
STRATEGIC WORKFORCE PLANNING GUIDE IN UAE … · STRATEGIC WORKFORCE PLANNING ... but also more on...
58
ة الحكوميةد البشريلموارتحادية ل الهيئة اwww.fahr.gov.ae United Arab Emirates Federal Authority For Government Human Resources STRATEGIC WORKFORCE PLANNING GUIDE IN UAE FEDERAL GOVERNMENT
Transcript of STRATEGIC WORKFORCE PLANNING GUIDE IN UAE … · STRATEGIC WORKFORCE PLANNING ... but also more on...
1 الدليل االسترشادي لنظام التخطيط االستراتيجي للقوى العاملة في الجهات االتحادية
الهيئة االتحادية للموارد البشرية الحكومية
www.fahr.gov.ae
United Arab Emirates
Federal Authority For Government Human Resources
STRATEGIC WORKFORCE PLANNINGGUIDE IN UAE FEDERAL GOVERNMENT

2
Table of Contents
CHAPTER 1 – BACKGROUND INTRODUCTION ............................................................................... 4
1. PURPOSE OF THE GUIDE ....................................................................................................... 4 1.1 Intended Purpose, Coverage and Target Audience....................................................................... 4 1.2 Abbreviations and Symbols used ................................................................................................ 4 1.3 Exclusions & Limitations ............................................................................................................. 5
2. TYPES OF WORKFORCE PLANNING ....................................................................................... 5
3. FUTURE OBJECTIVES OF WORKFORCE PLANNING IN FEDERAL ENTITIES ................................ 8 3.1 Current State Assessment of workforce planning in Federal entities ............................................ 8 3.2 FAHR’s Vision on Workforce Planning ......................................................................................... 9 3.3 Need and Priority for Strategic Workforce Planning in Federal bodies ........................................ 11 3.4 Perceived Benefits of SWFP in Federal entities .......................................................................... 11
4. SWFP – PROPOSED MODEL FOR FEDERAL MINISTRIES ....................................................... 13 4.1 Proposed Strategic Workforce Planning Model for Federal entities ............................................ 13
5. SWFP STAKEHOLDERS ........................................................................................................... 18
CHAPTER 2: DETERMINATION OF STRATEGIC INTENT ................................................................. 21
WHAT IS STRATEGIC INTENT STAGE? ......................................................................................... 21
2. ACTIVITY OVERVIEW AND PERSON (S) RESPONSIBLE .............................................................. 21
3. ACTIVITY WORK INSTRUCTION ............................................................................................... 24 3.1 Source Data Assimilation .......................................................................................................... 24 3.2 Formalization of Business Plans / HCM goals / SWFP Scope ....................................................... 24 3.3 Review by FAHR ....................................................................................................................... 24 3.4 Communication and Roll Out .................................................................................................... 24
REFERENCES AND FORMATS ...................................................................................................... 25 5.1 PESTEL Scenario ....................................................................................................................... 25 5.2 Guideline Checklist for Brainstorming ....................................................................................... 26 5.3 SWFP Scope and Project plan .................................................................................................... 28
CHAPTER 3: FORMALIZATION OF JOB ARCHITECTURE ................................................................ 29
1.WHAT IS JOB ARCHITECTURE? ................................................................................................ 29 2.1 Plotting of Job Family and Job Band ............................................................................................... 31 2.2 Critical Job Analysis – Plotting, Scoring and Ranking ...................................................................... 31 2.3 Skill Quadrant Rating and Reports Generation .......................................................................... 31 2.4 Review and upload ................................................................................................................... 31 2.5 Annual Maintenance ................................................................................................................ 32
REFERENCES AND FORMATS ...................................................................................................... 32 4.1 Critical Job Analysis – Yardstick brief ......................................................................................... 32 4.2 Skill Quadrant Rating Mechanism ............................................................................................. 34
CHAPTER 4: FORMALIZATION OF Workforce segmentation ........................................................ 36
1.WHAT IS WORKFORCE SEGMENTATION? ................................................................................ 36
3
2. ACTIVITY OVERVIEW AND PERSON (S) RESPONSIBLE .............................................................. 37
3. ACTIVITY WORK INSTRUCTION ............................................................................................... 40 3.1 Compilation of Desired Entity Workforce Segmentation (DEWS) ................................................ 40 3.2 Compilation of Current Entity Workforce Segmentation (CEWS) ................................................ 40 3.3 Workforce Segmentation Analysis (WSA) .................................................................................. 40 3.4 Review and Upload into Bayanati System ................................................................................. 41 3.5 Annual Maintenance ................................................................................................................ 41
CHAPTER 5: WORKFORCE FORECASTING .................................................................................... 42
1.WHAT IS WORKFORCE FORECASTING? .................................................................................... 42
2. FORECASTING MODEL ADOPTED BY FAHR .............................................................................. 43 2.1 DEMAND FORECASTING ........................................................................................................... 43 2.2 SUPPLY FORECASTING .............................................................................................................. 47
3. ACTIVITY OVERVIEW AND PERSON (S) RESPONSIBLE .............................................................. 48
CHAPTER 6 : GAP ANALYSIS &PRIORITIZATION ........................................................................... 52
. WHAT IS GAP ANALYSIS &PRIORITIZATION AND WHY IS IT IMPORTANT? ................................. 52
2. GAP ANALYSIS AND PRIORITIZATION METHODOLOGY ADOPTED BY FAHR .............................. 53 2.1 COUNT GAPS ............................................................................................................................ 53 2.2 GAP RISK RATING ..................................................................................................................... 53 2.3 PROFILE GAPS .......................................................................................................................... 54 2.4 TOLERANCE GRADING OF THE GAPS ......................................................................................... 54
3. ACTIVITY OVERVIEW AND PERSON (S) RESPONSIBLE .............................................................. 56
4
CHAPTER 1 – BACKGROUND INTRODUCTION
1. PURPOSE OF THE GUIDE
1.1 Intended Purpose, Coverage and Target Audience
This Manual will act as a Guide for the Federal entities who are implementing Strategic workforce
planning. The manual is a step-by-step work instruction manual, which will guide the stakeholders through
the process of implementation. The guide is elaborated in simple lucid language for clarity in ready and
easy understanding. The manual follows the 5W1H principle of writing and hence the following elements
will be covered while describing the activity to be performed:
What is this activity?
Who should do this activity?
When should this activity be carried out?
Why should this activity be followed?
Where should the activity be recorded or placed?
How should the activity be performed?
Each stage in the SWFP model is elaborated in the above fashion under every chapter. The guide is
replete with the relevant formats, templates and toolkits for the execution stakeholders to implement them
in limited elapsed time.
FAHR is the custodian of this Operating Guide. They own this guide and hence retain the rights to modify
and maintain versions of this guide. The version(s) circulated by FAHR to the federal entities only will
stand validity. Any amendments to this guide can be proposed by the federal entities to the FAHR who will
retain the right to approve and modify accordingly as deemed fit. The guide will be made available in
bilingual – English and Arabic.
1.2 Abbreviations and Symbols used
Abbreviation /Symbol Description
DMADV methodology Define Measure Analyze Design Verify
FAHR Federal Authority for Government Human Resources
ICT Information and Communication Technology
NRI Networked Readiness Index
PDCA Plan Do Check Act
SWF / SWFP Strategic Workforce Planning
5
UAE United Arab Emirates
1.3 Exclusions & Limitations
This document is limited to provide guidance to implementation of the SWFP model and cannot
enforce successful implementation, which is the responsibility of the personnel involved.
As mentioned earlier, this is only a standard guideline and can be subject to minor amendments in course
of implementation, to cater to the specific technicalities of the entity’s business.
2. TYPES OF WORKFORCE PLANNING
The strength of the workforce planning process and the plan depends on:
Quality, coverage and intensity of parameters and information being captured for analysis and
forecast
Ability and accuracy to forecast and address requirements gaps for the most number of years
ahead in the future
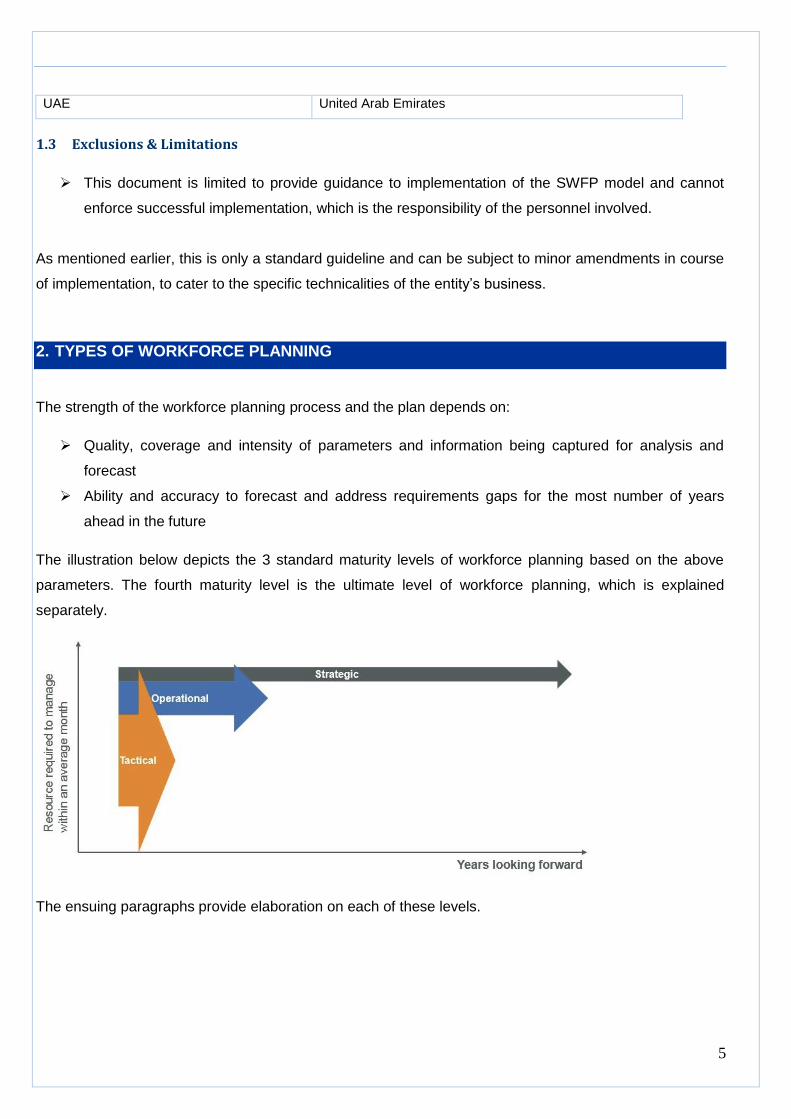
The illustration below depicts the 3 standard maturity levels of workforce planning based on the above
parameters. The fourth maturity level is the ultimate level of workforce planning, which is explained
separately.
The ensuing paragraphs provide elaboration on each of these levels.
6
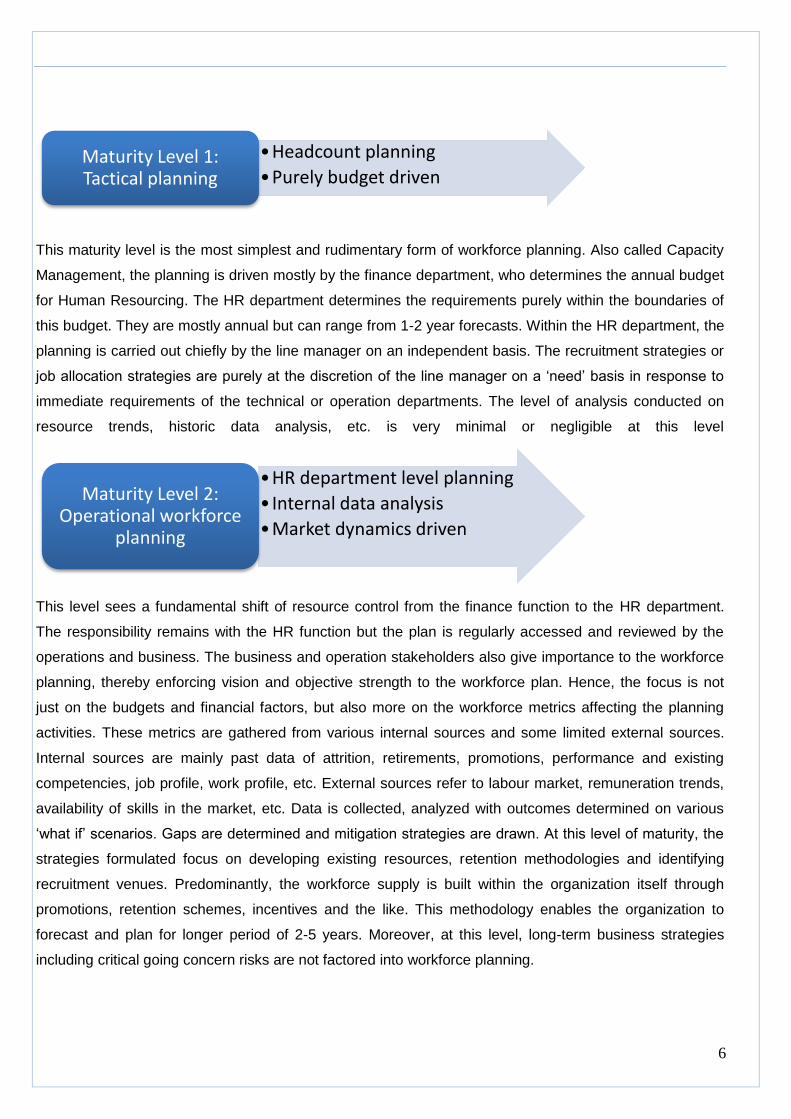
This maturity level is the most simplest and rudimentary form of workforce planning. Also called Capacity
Management, the planning is driven mostly by the finance department, who determines the annual budget
for Human Resourcing. The HR department determines the requirements purely within the boundaries of
this budget. They are mostly annual but can range from 1-2 year forecasts. Within the HR department, the
planning is carried out chiefly by the line manager on an independent basis. The recruitment strategies or
job allocation strategies are purely at the discretion of the line manager on a ‘need’ basis in response to
immediate requirements of the technical or operation departments. The level of analysis conducted on
resource trends, historic data analysis, etc. is very minimal or negligible at this level
This level sees a fundamental shift of resource control from the finance function to the HR department.
The responsibility remains with the HR function but the plan is regularly accessed and reviewed by the
operations and business. The business and operation stakeholders also give importance to the workforce
planning, thereby enforcing vision and objective strength to the workforce plan. Hence, the focus is not
just on the budgets and financial factors, but also more on the workforce metrics affecting the planning
activities. These metrics are gathered from various internal sources and some limited external sources.
Internal sources are mainly past data of attrition, retirements, promotions, performance and existing
competencies, job profile, work profile, etc. External sources refer to labour market, remuneration trends,
availability of skills in the market, etc. Data is collected, analyzed with outcomes determined on various
‘what if’ scenarios. Gaps are determined and mitigation strategies are drawn. At this level of maturity, the
strategies formulated focus on developing existing resources, retention methodologies and identifying
recruitment venues. Predominantly, the workforce supply is built within the organization itself through
promotions, retention schemes, incentives and the like. This methodology enables the organization to
forecast and plan for longer period of 2-5 years. Moreover, at this level, long-term business strategies
including critical going concern risks are not factored into workforce planning.
•Headcount planning
•Purely budget driven
Maturity Level 1: Tactical planning
•HR department level planning
• Internal data analysis
•Market dynamics driven
Maturity Level 2: Operational workforce
planning
7
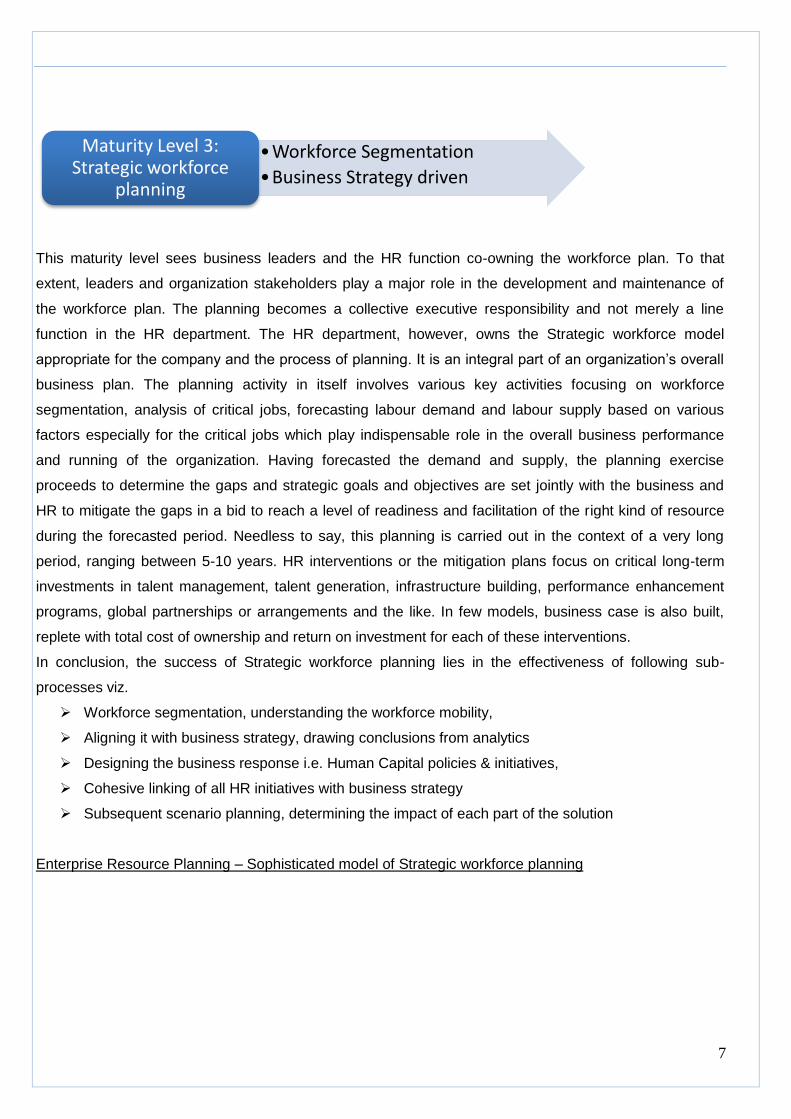
This maturity level sees business leaders and the HR function co-owning the workforce plan. To that
extent, leaders and organization stakeholders play a major role in the development and maintenance of
the workforce plan. The planning becomes a collective executive responsibility and not merely a line
function in the HR department. The HR department, however, owns the Strategic workforce model
appropriate for the company and the process of planning. It is an integral part of an organization’s overall
business plan. The planning activity in itself involves various key activities focusing on workforce
segmentation, analysis of critical jobs, forecasting labour demand and labour supply based on various
factors especially for the critical jobs which play indispensable role in the overall business performance
and running of the organization. Having forecasted the demand and supply, the planning exercise
proceeds to determine the gaps and strategic goals and objectives are set jointly with the business and
HR to mitigate the gaps in a bid to reach a level of readiness and facilitation of the right kind of resource
during the forecasted period. Needless to say, this planning is carried out in the context of a very long
period, ranging between 5-10 years. HR interventions or the mitigation plans focus on critical long-term
investments in talent management, talent generation, infrastructure building, performance enhancement
programs, global partnerships or arrangements and the like. In few models, business case is also built,
replete with total cost of ownership and return on investment for each of these interventions.
In conclusion, the success of Strategic workforce planning lies in the effectiveness of following sub-
processes viz.
Workforce segmentation, understanding the workforce mobility,
Aligning it with business strategy, drawing conclusions from analytics
Designing the business response i.e. Human Capital policies & initiatives,
Cohesive linking of all HR initiatives with business strategy
Subsequent scenario planning, determining the impact of each part of the solution
Enterprise Resource Planning – Sophisticated model of Strategic workforce planning
•Workforce Segmentation
•Business Strategy driven
Maturity Level 3: Strategic workforce
planning

8
This is the ultimate maturity level in workforce planning and is a sophisticated method of Strategic
workforce planning. This level focuses on the enterprise or the business sector as a whole. It could be
group of companies within a conglomerate or group of government bodies under a common nodal agency,
etc. Some large Commonwealth agencies engage in this level of workforce planning, though it is nascent
in most parts of the world. The strategy & design with respect to workforce planning is governed at a
corporate level and optimized for each business entity. It involves establishing 'Center of Excellence' to
facilitate and monitor the Strategic workforce planning processes as well as analytical activities, with
organization-wide governance & integration of a suite of human capital solutions. This level demands
engagement from top business leaders, head of the organization, all business heads, associated
leadership alongside HR departments at corporate and entity level. This model enables planning for over
ten year forecasts.
Organizations typically progress from being tactical level planners to operational workforce
planners and evolve further into strategic solution providers; however, the achievement levels
need not follow a sequential growth pattern. With the right strategic objectives and organization
vision, organizations can directly work towards instilling a Strategic workforce planning culture
and eventually planning at an Enterprise level.
3. FUTURE OBJECTIVES OF WORKFORCE PLANNING IN FEDERAL ENTITIES
3.1 Current State Assessment of workforce planning in Federal entities
The Human Resources Law, as enforced by the UAE Government, binds all the above entities. Currently,
the Articles in Federal Law by Decree No. 11 of 2008 on Human Resources are abided by all the federal
bodies. The Articles in the Second chapter of the Law, pertaining to Human Resource Planning is
applicable to these bodies. The Articles in the law, amongst other features with respect to compensation,
retrials, terminations, etc...mandates that each of the ministries should have a defined organization
structure (Article 6) and a job budgeting process (Articles 7 to 9).
•Group wide planning
• Industry / Profession trend driven
Ultimate Maturity Level :
Enterprise workforce planning
9
At present, all the federal entities are in compliance with the regulations of the Law. They have a stringent
budgeting process, which is carried out annually. The budget envisages the headcount requirements
against the job designations existing currently. This function is driven by the finance along with an
executive from the HR support office in each of the ministries. With the new Bayanati system in place,
however, the job designations are standardized under each of the ministries, in the system and the
forecasted head count is also captured in the Bayanati.
The formalization of budget begins well in advance with the HR office in each ministry identifying the
vacancies / requirements in the year before the previous year of the fiscal for which the budget is
prepared. For example, HR team in each ministry starts preparing the draft of budget for fiscal year 2015
by end of 2013.Each ministry will submit the draft to Ministry of Finance (MOF) in the month of April, 2014
and after deliberations, the budget is finalized and approved in the month of November 2014. Budgets are
approved on grade level basis across all offices and not allocated specifically to job titles or to specific
department.
Hence, in effect, all the ministries are adopting the tactical level of workforce planning currently.
3.2 FAHR’s Vision on Workforce Planning
FAHR has been entrusted with the task of enhancing and enriching the quality of human resources
amongst all the federal entities it covers, following the directives provided by the UAE Government
through its Strategy document 2011-13. Accordingly, one of FAHR’s primary activities has been to
establish a standardized workforce planning system across all these entities. After assimilating the current
state of planning and comparing with the Vision of the UAE Government, it believes that the logical step to
scale up in this area, apart from introducing new technology initiatives, performance systems and the like,
is also to move from the current tactical planning practice to Strategic Workforce planning directly. FAHR
believes that rather than progressing in a sequential mode and targeting operational workforce planning, it
will channelize all its energies and efforts to set up all necessary technical infrastructures to work towards
instilling Strategic workforce planning (SWFP) methodology. In this context, it has also conceptualized and
designed a suitable SWFP model ideal for implementation in all the entities. It has adopted globally
benchmarked SWFP model and customized it to suit the working culture in the government, capabilities
involved and Emirati sensibilities. Later sections in this chapter provide a brief of the conceptualized
model. The SWFP model will be implemented and maintained independently in each of the federal
entities. Towards this extent, the methodologies followed in terms of data collections, analysis, recording
and reporting, as part of the planning exercise will be conducted by each of the entities in their individual
capacity under the guidance and governance of FAHR. The entities’ HR support offices will be owners of
their respective planning construction.
10
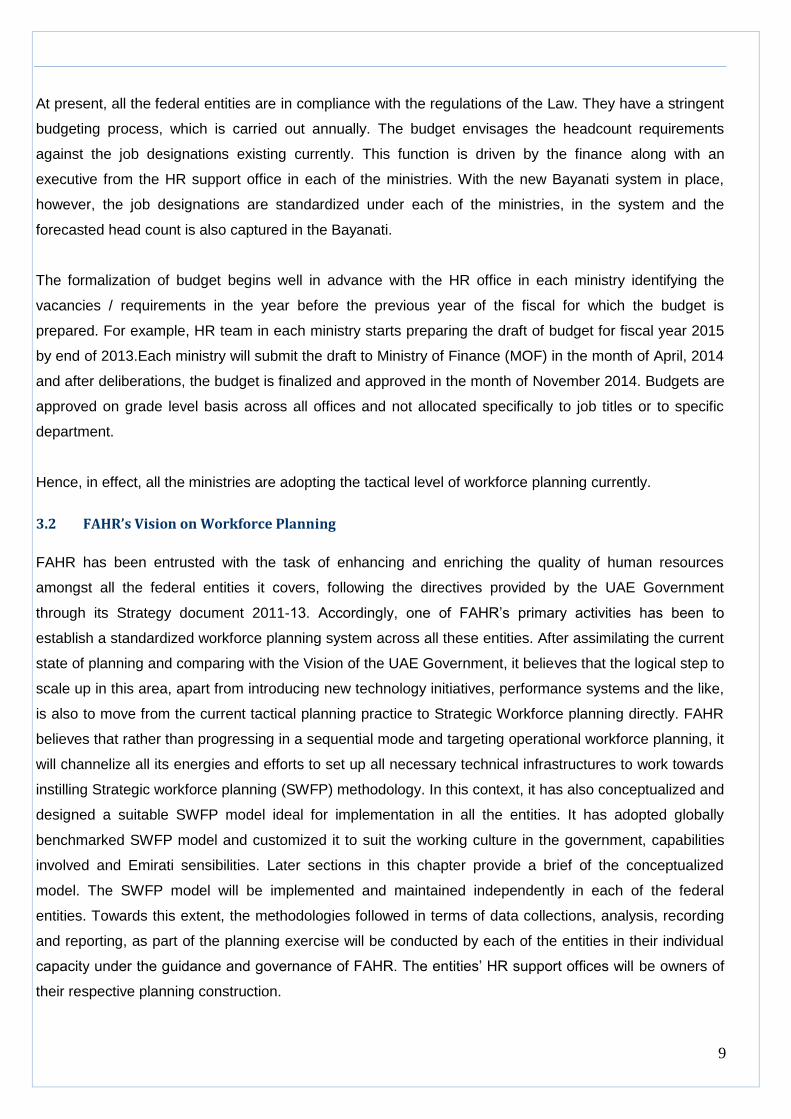
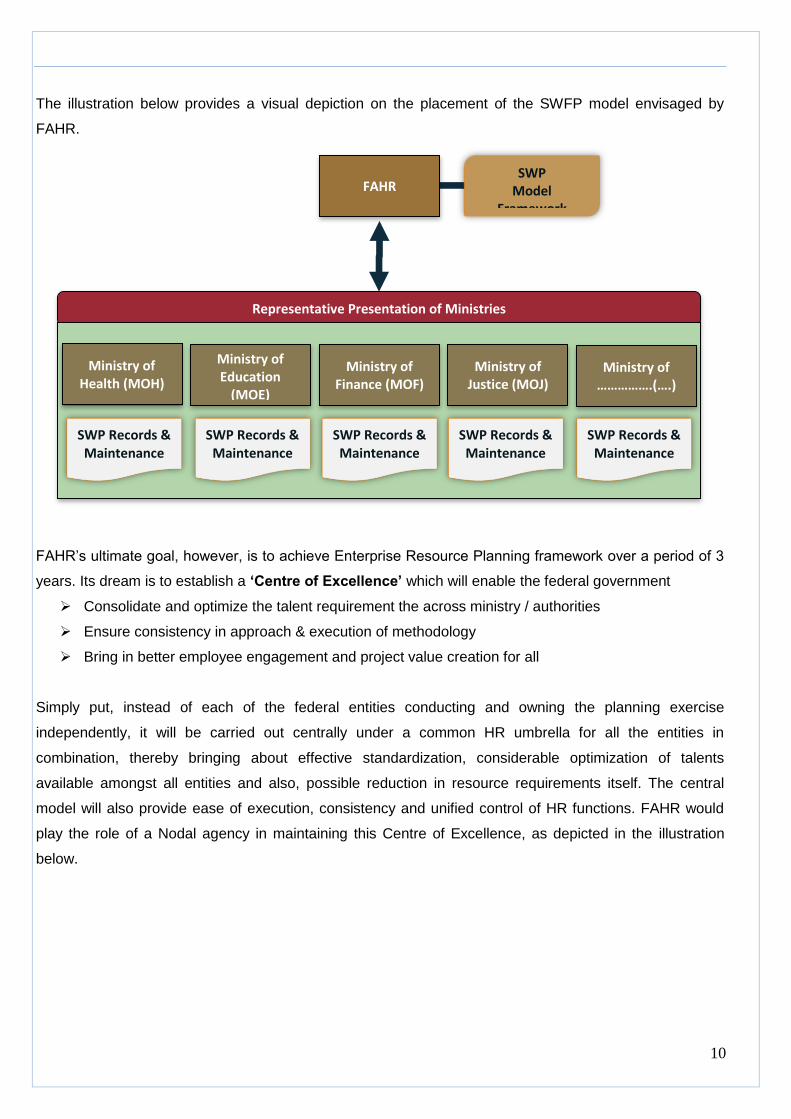
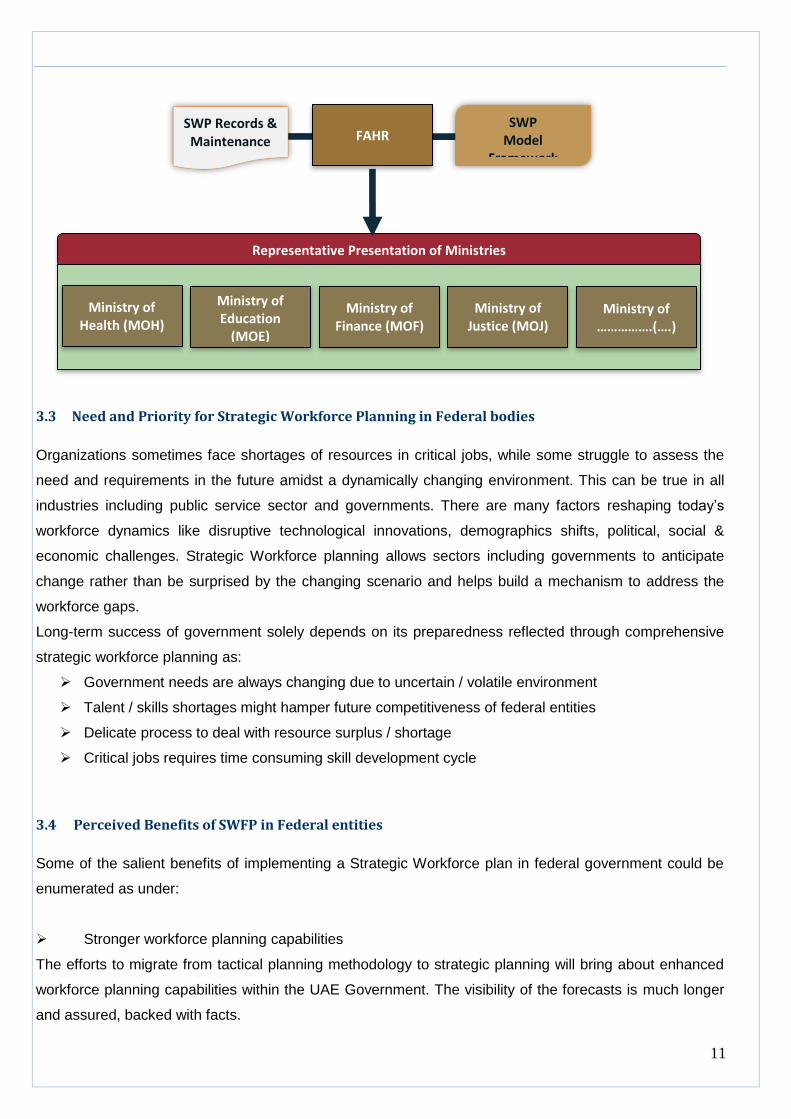
The illustration below provides a visual depiction on the placement of the SWFP model envisaged by
FAHR.
FAHR’s ultimate goal, however, is to achieve Enterprise Resource Planning framework over a period of 3
years. Its dream is to establish a ‘Centre of Excellence’ which will enable the federal government
Consolidate and optimize the talent requirement the across ministry / authorities
Ensure consistency in approach & execution of methodology
Bring in better employee engagement and project value creation for all
Simply put, instead of each of the federal entities conducting and owning the planning exercise
independently, it will be carried out centrally under a common HR umbrella for all the entities in
combination, thereby bringing about effective standardization, considerable optimization of talents
available amongst all entities and also, possible reduction in resource requirements itself. The central
model will also provide ease of execution, consistency and unified control of HR functions. FAHR would
play the role of a Nodal agency in maintaining this Centre of Excellence, as depicted in the illustration
below.
Representative Presentation of Ministries
Ministry of Health (MOH)
Ministry of Education
(MOE)
Ministry of Finance (MOF)
Ministry of Justice (MOJ)
Ministry of …………….(….)
FAHR
SWP Records & Maintenance
SWP Records & Maintenance
SWP Records & Maintenance
SWP Records & Maintenance
SWP Records & Maintenance
SWP Model
Framework
11
3.3 Need and Priority for Strategic Workforce Planning in Federal bodies
Organizations sometimes face shortages of resources in critical jobs, while some struggle to assess the
need and requirements in the future amidst a dynamically changing environment. This can be true in all
industries including public service sector and governments. There are many factors reshaping today’s
workforce dynamics like disruptive technological innovations, demographics shifts, political, social &
economic challenges. Strategic Workforce planning allows sectors including governments to anticipate
change rather than be surprised by the changing scenario and helps build a mechanism to address the
workforce gaps.
Long-term success of government solely depends on its preparedness reflected through comprehensive
strategic workforce planning as:
Government needs are always changing due to uncertain / volatile environment
Talent / skills shortages might hamper future competitiveness of federal entities
Delicate process to deal with resource surplus / shortage
Critical jobs requires time consuming skill development cycle
3.4 Perceived Benefits of SWFP in Federal entities
Some of the salient benefits of implementing a Strategic Workforce plan in federal government could be
enumerated as under:
Stronger workforce planning capabilities
The efforts to migrate from tactical planning methodology to strategic planning will bring about enhanced
workforce planning capabilities within the UAE Government. The visibility of the forecasts is much longer
and assured, backed with facts.
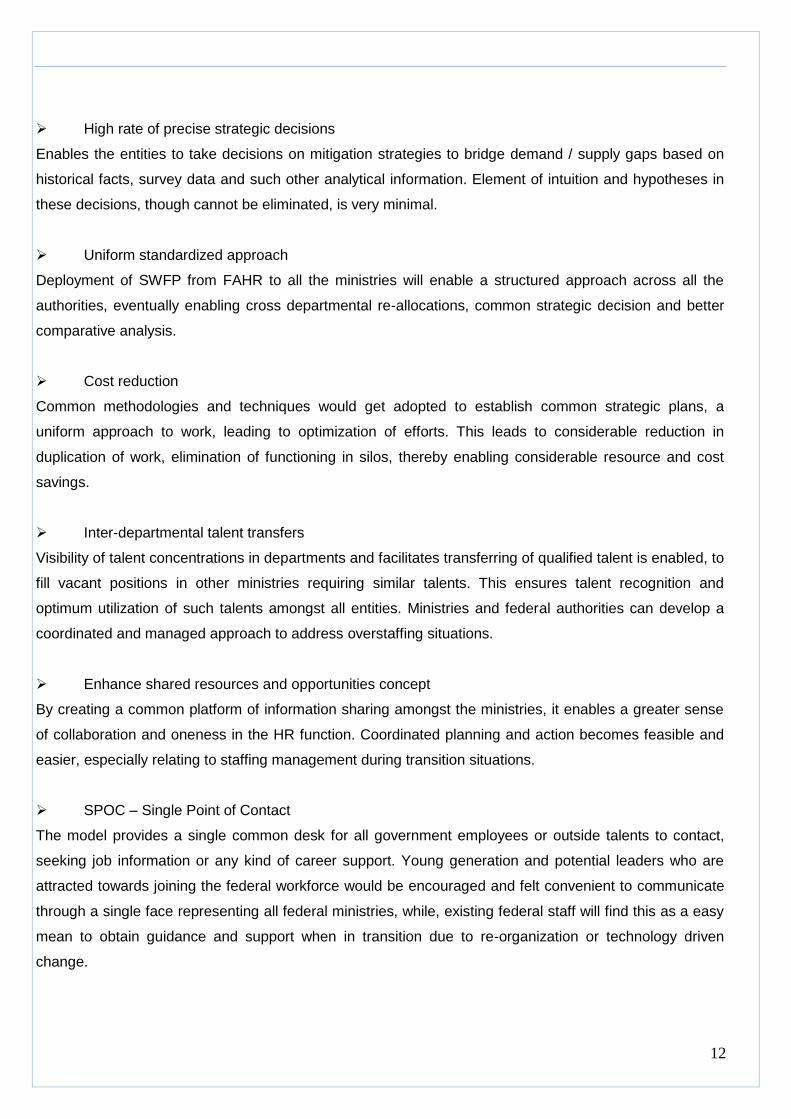
Representative Presentation of Ministries
Ministry of
Health (MOH)
Ministry of Education
(MOE)
Ministry of Finance (MOF)
Ministry of Justice (MOJ)
Ministry of …………….(….)
FAHR SWP Records & Maintenance
SWP Model
Framework
12
High rate of precise strategic decisions
Enables the entities to take decisions on mitigation strategies to bridge demand / supply gaps based on
historical facts, survey data and such other analytical information. Element of intuition and hypotheses in
these decisions, though cannot be eliminated, is very minimal.
Uniform standardized approach
Deployment of SWFP from FAHR to all the ministries will enable a structured approach across all the
authorities, eventually enabling cross departmental re-allocations, common strategic decision and better
comparative analysis.
Cost reduction
Common methodologies and techniques would get adopted to establish common strategic plans, a
uniform approach to work, leading to optimization of efforts. This leads to considerable reduction in
duplication of work, elimination of functioning in silos, thereby enabling considerable resource and cost
savings.
Inter-departmental talent transfers
Visibility of talent concentrations in departments and facilitates transferring of qualified talent is enabled, to
fill vacant positions in other ministries requiring similar talents. This ensures talent recognition and
optimum utilization of such talents amongst all entities. Ministries and federal authorities can develop a
coordinated and managed approach to address overstaffing situations.
Enhance shared resources and opportunities concept
By creating a common platform of information sharing amongst the ministries, it enables a greater sense
of collaboration and oneness in the HR function. Coordinated planning and action becomes feasible and
easier, especially relating to staffing management during transition situations.
SPOC – Single Point of Contact
The model provides a single common desk for all government employees or outside talents to contact,
seeking job information or any kind of career support. Young generation and potential leaders who are
attracted towards joining the federal workforce would be encouraged and felt convenient to communicate
through a single face representing all federal ministries, while, existing federal staff will find this as a easy
mean to obtain guidance and support when in transition due to re-organization or technology driven
change.

13
4. SWFP – PROPOSED MODEL FOR FEDERAL MINISTRIES
The SWFP steps clearly identify areas of concern and help in developing targeted action plans to
overcome those barriers to success. The broad steps that are usually associated with the SWFP strategic
processes are as under:
Step Purpose
1. Business Objective
Assessment
Develop a mission and vision, specific goals and measurable
objectives, and relevant priorities that enable the organization to
achieve a desired future state.
2. Current Workforce Analysis Review and assess various aspects of the current workforce, including
position requirements, demographic makeup, funding, end-strength,
full-time equivalent levels (FTEs), competencies, attrition rates,
vacancies, and organizational climate. Determine trends and impacts
based on current and historical data.
3. Future Requirements Analysis Assess the future or desired end-state in the same workforce terms as
Step 2. Additional factors are also considered that may impact the
future workforce such as projected attrition, anticipated retirements,
changes in structure, changes in mission, new technology,
organizational realignment, and/or new competency requirements.
4. Gap Analysis Analyze quantitative and qualitative differences between Step 2 and
Step 3 to identify and prioritize differences, or “gaps” based on mission
and strategic priorities.
5. Workforce Action Planning Develop plans that outline the strategies that will be employed to close
each critical gap. Plans should contain detailed information on action
steps required to complete the strategies, roles and responsibilities,
and milestones.
6. Execute and Monitor Implement the Workforce Action Plan and monitor progress. Review
and adjust the plan as required.
All SWFP models adopt the PDCA approach – Plan Do Check Act. The PDCA approach is cyclic in
nature and is under constant evolution and assessment. It is an
4.1 Proposed Strategic Workforce Planning Model for Federal entities
FAHR, keeping true to its ambitious objectives and vision, has embarked on the journey to implement
Strategic workforce planning methodology in all the federal bodies covered under it. After considerable
analysis, thought, awareness and consideration of the federal sensibilities and environment, they have
conceptualized a working SWFP model, convenient and appropriate for implementation in these Federal
14
entities. The ensuing sections provide a glimpse of the model and its step concepts. Every step will be
elaborated in detail in subsequent individual chapters in this manual.
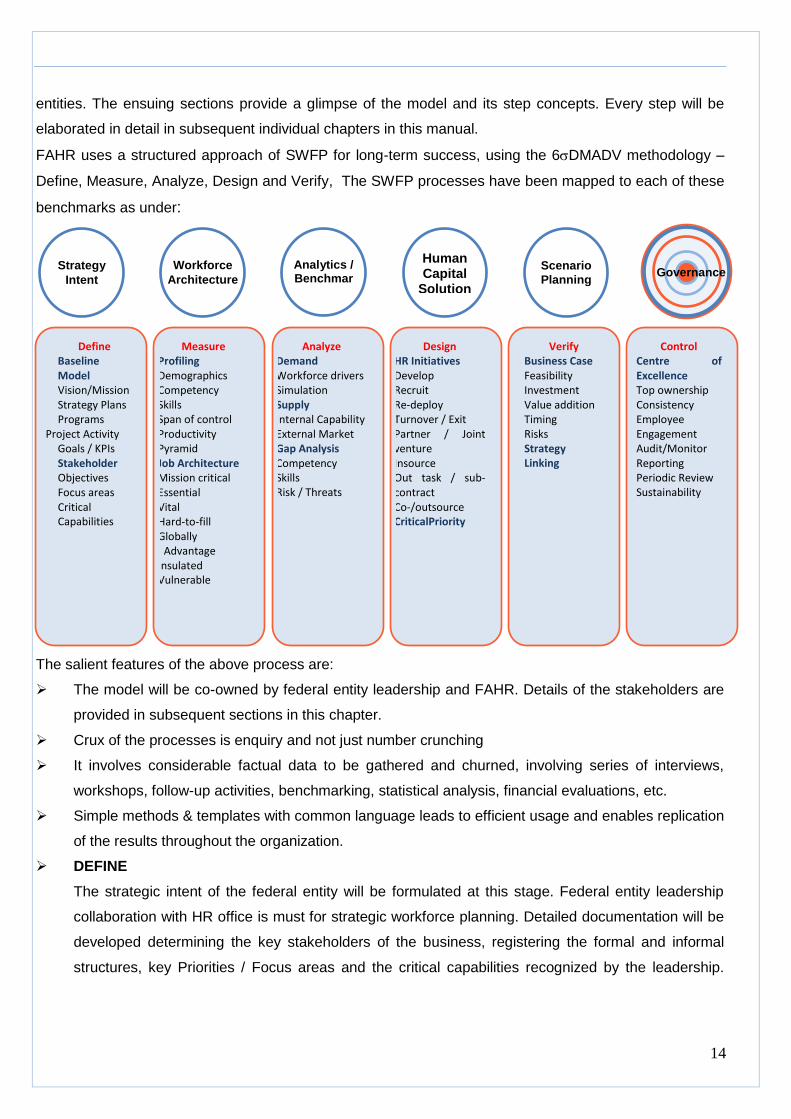
FAHR uses a structured approach of SWFP for long-term success, using the 6DMADV methodology –
Define, Measure, Analyze, Design and Verify, The SWFP processes have been mapped to each of these
benchmarks as under:
The salient features of the above process are:
The model will be co-owned by federal entity leadership and FAHR. Details of the stakeholders are
provided in subsequent sections in this chapter.
Crux of the processes is enquiry and not just number crunching
It involves considerable factual data to be gathered and churned, involving series of interviews,
workshops, follow-up activities, benchmarking, statistical analysis, financial evaluations, etc.
Simple methods & templates with common language leads to efficient usage and enables replication
of the results throughout the organization.
DEFINE
The strategic intent of the federal entity will be formulated at this stage. Federal entity leadership
collaboration with HR office is must for strategic workforce planning. Detailed documentation will be
developed determining the key stakeholders of the business, registering the formal and informal
structures, key Priorities / Focus areas and the critical capabilities recognized by the leadership.
Define
Baseline Model Vision/Mission
Strategy Plans
Programs
Project Activity
Goals / KPIs
Stakeholder
Objectives
Focus areas
Critical Capabilities
Measure
Profiling
Demographics
Competency
Skills
Span of control Productivity
Pyramid
Job Architecture
Mission critical Essential Vital Hard-to-fill Globally
Advantage
Insulated
Vulnerable
Analyze
Demand Workforce drivers
Simulation
Supply
Internal Capability
External Market Gap Analysis
Competency
Skills
Risk / Threats
Design
HR Initiatives
Develop
Recruit Re-deploy
Turnover / Exit Partner / Joint venture
Insource
Out task / sub-contract Co-/outsource
CriticalPriority
Verify
Business Case Feasibility
Investment Value addition
Timing
Risks
Strategy Linking
Control Centre of Excellence
Top ownership
Consistency
Employee Engagement Audit/Monitor Reporting
Periodic Review
Sustainability
Scenario
Planning Human Capital
Solution
Analytics / Benchmar
k
Workforce
Architecture Strategy
Intent Governance

15
Decoding the stakeholders DNA will ensure the success & sustainability of strategic workforce
planning.
Once the stakeholders have been determined and placed, the strategic objectives of the entity along
with the scope and coverage under which the model is going to be processed will be determined.
This is called Baseline Modeling. It involves developing an understanding of the ministry’s vision /
mission, federal strategic programs, key projects / services impacting workforce requirements, goals
/ KPIs, operational value chain, emerging standards, the external environment and the like. The
baseline information identifies the program alignment with government priorities, vital capabilities
and stakeholder focus areas.
This phase will not be complete until the base lined scope and objective has been shared,
communicated and understood through a Top-Down approach to all the relevant stakeholders; be it
from leadership, execution or governance. Shared understanding between project team and
business leadership need to be developed regarding:
–employee roles, competencies, accountabilities, performance expectations
–development opportunities across the enterprise
–how work is or should be accomplished
Overall program scope, general guidelines and inclusive framework is agreed in this step, which
enables next phases to function effectively.
MEASURE
Federal entities need to measure how the workforce is currently structured and job groups are
aligned with its strategy. This is carried out by building a Job Architecture per entity and establishing
the Workforce segmentation of existing taskforce. Understanding criticality of each job roles & job
family is very important.
Criticality of Job roles or groups isdetermined under these three parameters:
a) Business Criticality: Job is assessed based on its level of contribution to business / overall
entity level objectives and visibility to the stakeholders.
b) Resourcing Constraints: Job is assessed based on characteristic features of resources such
as availability, attractiveness, skill level, etc.
c) Long term value: Job is assessed based on the potential life of the job. It determines the fate
and existence of the job in the future following various environmental factors affecting it.
Workforce analytics develops a detail blueprint for a federal talent structure to support execution of
the government entity’s strategy and is carried out based on various factors such as:
Demographics (age, gender, location etc.),
16
Knowledge, competency, skills,
Line of operations (sector / division / department / section),
Span of control, Shape of pyramid,
Staffing ratio (support vis-à-vis operations staff),
Productivity levels, service years etc.
Detailed operating instructions of developing the Job Architecture and determining the Workforce
Segmentation are explained in separate chapters of this manual.
ANALYSE
The analytic stage covers three sub processes – Demand analysis, Supply analysis and Gap
Analysis.
Demand Simulation techniques are used to articulate the future needs of resources – not just in
headcount numbers but also in terms of competencies and capabilities. This is estimated over a
period of ten years based on the strategic intent already defined in the Define phase. Resource
projection on yearly basis is simulated by:
Identifying the business drivers for workforce demand with relevant degree of correlation
Considering available industry trends / benchmarks statistics
Factoring the innovation breakthroughs and technological impact
Studying productivity levels and performance trends
Calculating impact of anticipated growth and new business models
Simulation techniques range from estimation based on experience to documented what-if scenarios.
Supply forecasting is done to determine job wise talents available and forecasted over the period of
ten years. The estimates would be both on supplies available internally across the federal entities
and also in the external labour market. To that extent, supply is estimated manifolds such as:
Internal talent mobility due to promotion, retirement, sickness, resignation etc…
External market dynamics like school / university program, population statistics, economic
factors, recruitment benchmarks
Emerging competitive environment, Local vis-à-vis Global and Direct vis-à-vis Indirect
Retention statistics, Employer Brand
For both demand and supply estimates, quality of the forecasts is directly proportional to the intensity of
data assimilated and analyzed during this exercise.
The comparative analysis between the demand and supply forecasts throws up gaps or imbalances in the
demand / supply ratio with respect to:
Job levels, Skills / Capabilities, Location / Departments
Potential risks posed by talent surplus or deficit
17
Gap analysis showcases the health of government in steady state condition based on foreseeable
strategy.
DESIGN
Design phase is a crucial phase to determine various strategies for mitigating the gaps. These strategies
are long ranging and designed to bridge the gaps of all the ten-year imbalances. Time plan for execution
is also determined depending on the status of the gaps over the years forecasted. This is a key
differentiator step of Strategic Workforce Planning because asset management on Human Capital side is
extremely complex & volatile. These strategies or HR interventions, as it may be called, can broadly vary
between four areas:
increasing talent supply,
reducing demand dependency,
enhancing internal capability or
inducing structural changes
The second challenge in this phase is about prioritizing the strategies for execution. Multiple factors play in
prioritization of strategies like criticality of the business objective, criticality of the jobs, which the strategy
intends to fulfill, the investments, costs and efforts involved in implementing the strategy and the proposed
return on investment. It becomes imminent then, that every HR intervention is backed by a suitable
Business Case representation, depicting the pros and cons, the value adds the implementation brings, the
potential risks involved with the likelihood of occurrence of such risks, the financial implications and cost-
benefit analysis. In essence, every HR initiative emerging out of Strategic workforce planning process
need to be critically evaluated based on:
Investment requirement
Time scale – Needs vis-à-vis Delivery
Risks compliance, Compliance
Feasibility, Pre-requisites
Envisaged value addition
VERIFY
Verification mechanism occurs in two parts:
Verification and validation of the status and progress of the HR initiatives being implemented
Monitoring of the Strategic workforce model itself and determining whether the standards and
policies are being adopted uniformly across all the federal entities
Strategic workforce planning need to be reviewed every year and all input factors, assumptions should be
restated. Standard auditing / monitoring mechanism need to be in place to minimize the gap between
planning & execution. Periodic reporting is required on the progress of workforce segmentation, job

18
architecture and impact of HR solution emerged from this process. The overall governance of the model
needs to be carried out not only within the federal entities but also from FAHR overseeing the standard
compliance.
CONTROL
This stage is designed on a long-term vision of establishing a ‘Center of Excellence’ model for workforce
planning. As explained in earlier sections in this chapter, the workforce planning activity is visualized to be
under a single umbrella, managed and controlled through a single entity eventually. As of today and until
implementation of the SWFP model, FAHR will be the custodian of the standard model only, while the
management of the plan and records will be the responsibility of the individual federal entities. On
attainment of certain level of experience, maturity and sufficient data building, FAHR will eventually work
to consolidation of the implemented plans into a single common Federal workforce plan, for which FAHR
will become the custodian. The unified Strategic workforce planning exercise will cover all the entities
under FAHR.
5. SWFP STAKEHOLDERS
Success of any project or exercise depends on the strength of the personnel who drive it and the clarity in
each stakeholder’s roles and responsibilities. Strategic workforce planning can be a successful exercise
only if it has a robust people structure at necessary levels that will work in co-ordination and direction of
the leadership. In this case, the stakeholders of the SWFP model proposed by FAHR can be classified
under the following three categories:
- SWFP Leadership
- SWFP Governance
- SWFP Execution
LEADERSHIP
The Governing rulers -the Prime Minister Office and Ministry of Cabinet Affairs form part of the driving
leadership force of this model with the Chairman and Director General of FAHR. These Senior Leaders
provide commitment to the SWP process and crucial guidance in the development of the overall strategic
direction of the organization. They own the SWP model and the vision behind this project. They will
officially release the SWP methodology and mandate the implementation within targeted timelines. They
may also direct the order of implementation amongst the federal ministries based on critical need and
importance over a 2-3 year time span.
19
GOVERNANCE
FAHR: Model adoption Review
Typically comprising of senior representatives, domain experts and trainers in FAHR, theywill provide
expertise and drive the SWP process amongst the federal entities. They will be intermediate
communication link between the Core Executive committee and the Leadership for implementation
updates. They will be responsible for Change Management and ensure the activities are carried out
toward the Vision of the Leadership. Towards this, they will impart training and handhold the executive
committee of the federal entities and will also be recipients of the end results on execution of every stage
in the SWP methodology. FAHR will be responsible for uploading the reports and forecasts into Bayanati.
Prior to upload they will review the filled model to assess compliance with the methodology and submit a
recommendatory note to the Project Manager for any rectifications or suggestions of improvement.
FAHR is the custodian of this Operating guide and will also be responsible to ensure the standards are
maintained and managed uniformly across the entities. They are directly accountable for establishing and
monitoring the overall progress of the SWP process.
Ministry of Finance: Model Enforcement & Compliance
Ministry of Finance (MOF) is the ultimate beneficiary of the SWP methodology as the annual financial
budgets including HR functions (recruitments, new initiatives, etc.) are submitted by individual ministry to
them for approval and fund allocation. MOF will play an indirect role in enforcing implementation of SWP
in the ministries by verifying and ensuring the HR proposal submitted for workforce related budgets have
been arrived at, on implementation of and justification of the figures through the SWP methodology only.
EXECUTION
Core Executive Committee:
Following guidance from FAHR, a Core executive Committee will be formed in each of the federal entities.
It will comprise of members from a multi-disciplined background and offices within the entity such as
specialists or analysts from Human Resource office, senior representative from particular business /
technical office, finance and budget analysts from Finance & Accounts and other executives as deemed
fit. The suggested Core Executive Committee members would be:
Head of Strategy Offices
Head of Ministry specific Operations Offices
Head of Support Services
o Finance
o HR
o Admin
o IT

20
o Legal
The Heads of the respective offices can choose to nominate executives within their departments to
become part of the Executive committee in addition or in their place. However, the responsibility of
successful implementation will vest with the Head of the above offices only.
The Core Executive Committee will implement the project, carry out the activities as guided through this
manual and seek training FAHR. They will frequently meet to discuss, analyze and mobilize the day-to-
day operations of the SWP process. They will provide routine and constant information flow to FAHR on
completion of every progressive stage of implementation. Activities under the responsibility of the Core
Executive Committee and work instructions are detailed out in the subsequent chapters of this Guide.
Core Executive Committee functions will be spearheaded by a Project Manager.
Project Manager:
The Project Manager will be nominated within the ministry, who will administer the workings of the
committee and be the communications manager for the whole SWP process. The roles and
responsibilities of the Project Manager is detailed in each stage of implementation in the subsequent
chapters. Based on the responsibilities to be discharged by the Project Manager, typical skill profile
expected is as under:
a) Thorough understanding of the SWP methodology
b) Good communication and writing skills
c) Documentation management capabilities
d) Project management skills
e) Functional knowledge of operations in all departments within the ministry
f) Interfacing with departments within the ministry
g) Interfacing with FAHR
h) Functional knowledge of operating excel software / toolkit
Ideally, the Project Manager would be an employee with considerable years of experience in the ministry
(minimum 5-8 years). It is preferable for the Project Manager to be nominated from the Operations
departments of the ministry or from the HR office.

21
CHAPTER 2: DETERMINATION OF STRATEGIC INTENT
WHAT IS STRATEGIC INTENT STAGE?
This is crucial a stage in SWP, which will set the entire exercise into motion. It is the trigger point or as we
call in our framework, the baseline on which the entire plan will be built. The focus here is the Federal
Entity’s business and operational strategic objectives and more importantly, the Vision towards the
sustenance, survival and thriving of the entity itself. These objectives are the baseline parameters on
which the workforce needs and forecasts are determined. Every strategic objective of the entity is then
translated from the perspective of Human resource department, into HR needs.
In essence, this Stage is the process of determination of the Entity’s Strategic Direction over the course of
next 10 years. The exit takeaway at the end of this stage will be:
Entity Human Capital Management (HCM) Plan in line with the Business plans of the entity
SWP Scope & Coverage document for the entity
STAGE DEFINITION: Develop a mission and vision, specific goals and measurable objectives, and
relevant priorities that enable the organization to achieve a desired future state.
2. ACTIVITY OVERVIEW AND PERSON (S) RESPONSIBLE
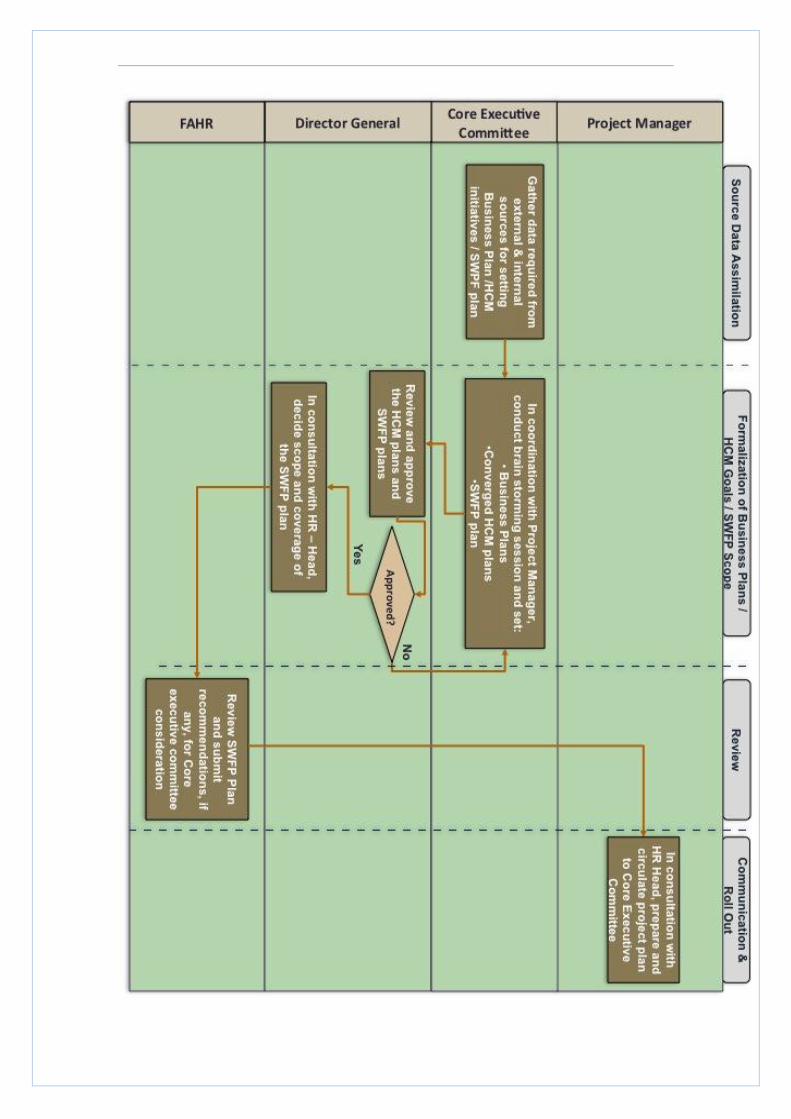
The entire process of Strategic Objective determination can be classified under the following
major categories:
Source Data Assimilation
Brainstorming and Formalization of Business Plan / Human Capital Management Goal
Plan / SWFP Scope
Review by FAHR
Communication and Roll Out
The flow of the above categories can be aptly illustrated as under:

23
24
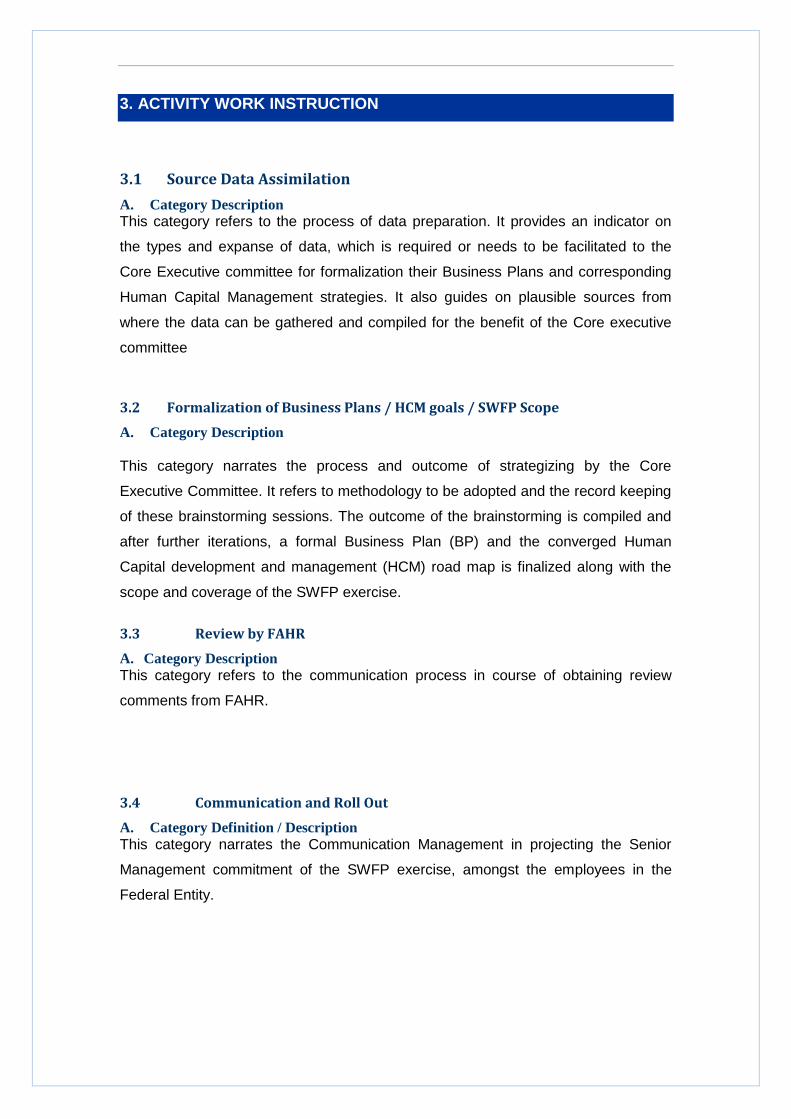
3. ACTIVITY WORK INSTRUCTION
VITRK INSTRUCTIAO
3.1 Source Data Assimilation
A. Category Description
This category refers to the process of data preparation. It provides an indicator on
the types and expanse of data, which is required or needs to be facilitated to the
Core Executive committee for formalization their Business Plans and corresponding
Human Capital Management strategies. It also guides on plausible sources from
where the data can be gathered and compiled for the benefit of the Core executive
committee
3.2 Formalization of Business Plans / HCM goals / SWFP Scope
A. Category Description
This category narrates the process and outcome of strategizing by the Core
Executive Committee. It refers to methodology to be adopted and the record keeping
of these brainstorming sessions. The outcome of the brainstorming is compiled and
after further iterations, a formal Business Plan (BP) and the converged Human
Capital development and management (HCM) road map is finalized along with the
scope and coverage of the SWFP exercise.
3.3 Review by FAHR
A. Category Description
This category refers to the communication process in course of obtaining review
comments from FAHR.
3.4 Communication and Roll Out
A. Category Definition / Description
This category narrates the Communication Management in projecting the Senior
Management commitment of the SWFP exercise, amongst the employees in the
Federal Entity.
REFERENCES AND FORMATS
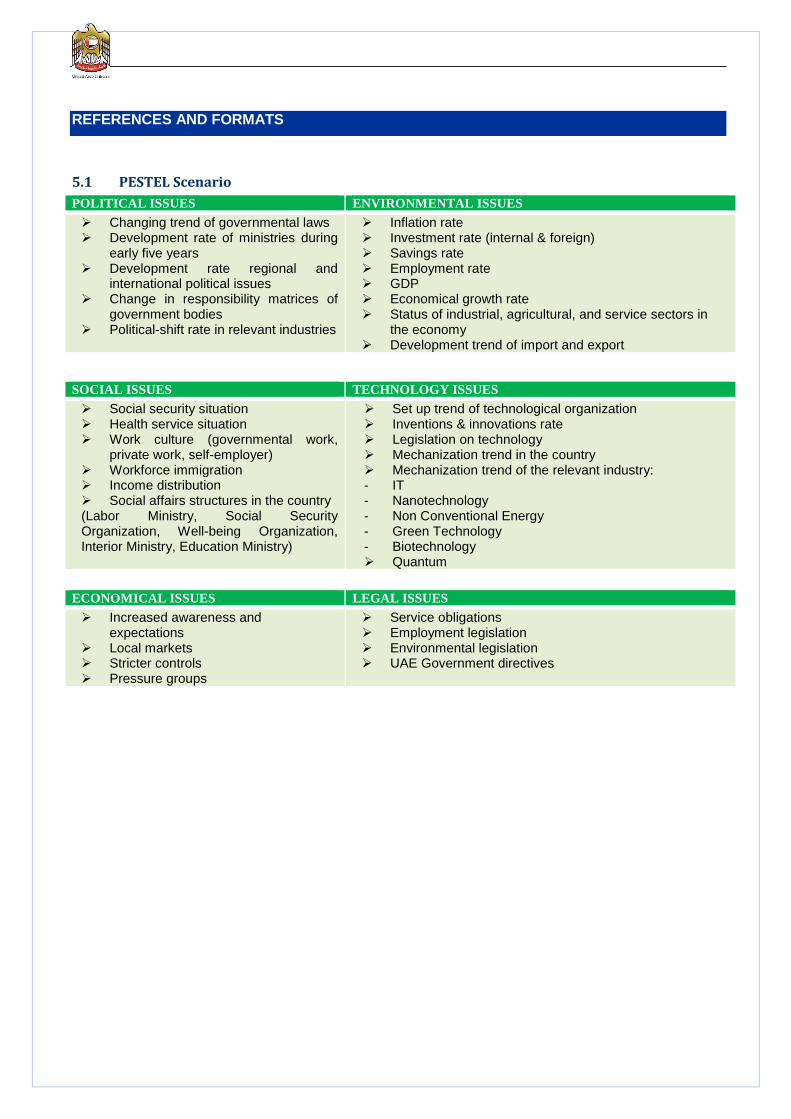
5.1 PESTEL Scenario
POLITICAL ISSUES ENVIRONMENTAL ISSUES
Changing trend of governmental laws Development rate of ministries during
early five years Development rate regional and
international political issues Change in responsibility matrices of
government bodies Political-shift rate in relevant industries
Inflation rate Investment rate (internal & foreign) Savings rate Employment rate GDP Economical growth rate Status of industrial, agricultural, and service sectors in
the economy Development trend of import and export
SOCIAL ISSUES TECHNOLOGY ISSUES
Social security situation Health service situation Work culture (governmental work,
private work, self-employer) Workforce immigration Income distribution Social affairs structures in the country (Labor Ministry, Social Security Organization, Well-being Organization, Interior Ministry, Education Ministry)
Set up trend of technological organization Inventions & innovations rate Legislation on technology Mechanization trend in the country Mechanization trend of the relevant industry: - IT - Nanotechnology - Non Conventional Energy - Green Technology - Biotechnology Quantum
ECONOMICAL ISSUES LEGAL ISSUES
Increased awareness and expectations
Local markets Stricter controls Pressure groups
Service obligations Employment legislation Environmental legislation UAE Government directives
26
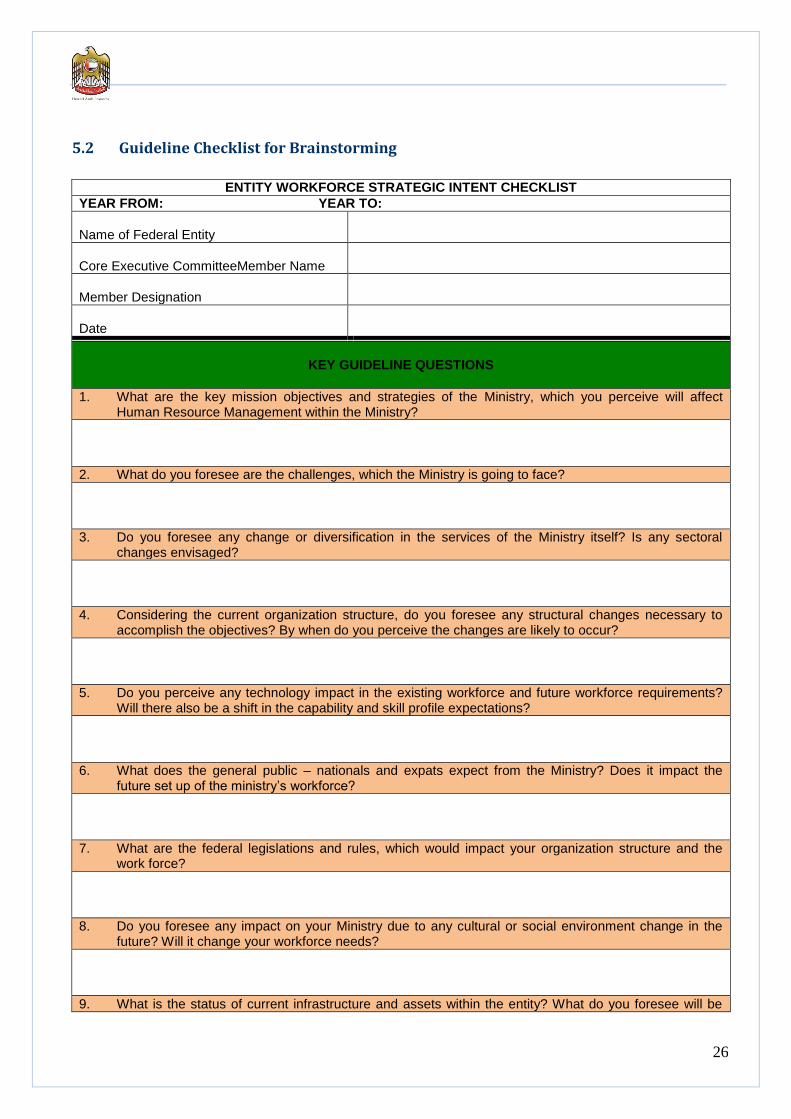
5.2 Guideline Checklist for Brainstorming
ENTITY WORKFORCE STRATEGIC INTENT CHECKLIST
YEAR FROM: YEAR TO:
Name of Federal Entity
Core Executive CommitteeMember Name
Member Designation
Date
KEY GUIDELINE QUESTIONS
1. What are the key mission objectives and strategies of the Ministry, which you perceive will affect Human Resource Management within the Ministry?
2. What do you foresee are the challenges, which the Ministry is going to face?
3. Do you foresee any change or diversification in the services of the Ministry itself? Is any sectoral changes envisaged?
4. Considering the current organization structure, do you foresee any structural changes necessary to accomplish the objectives? By when do you perceive the changes are likely to occur?
5. Do you perceive any technology impact in the existing workforce and future workforce requirements? Will there also be a shift in the capability and skill profile expectations?
6. What does the general public – nationals and expats expect from the Ministry? Does it impact the future set up of the ministry’s workforce?
7. What are the federal legislations and rules, which would impact your organization structure and the work force?
8. Do you foresee any impact on your Ministry due to any cultural or social environment change in the future? Will it change your workforce needs?
9. What is the status of current infrastructure and assets within the entity? What do you foresee will be
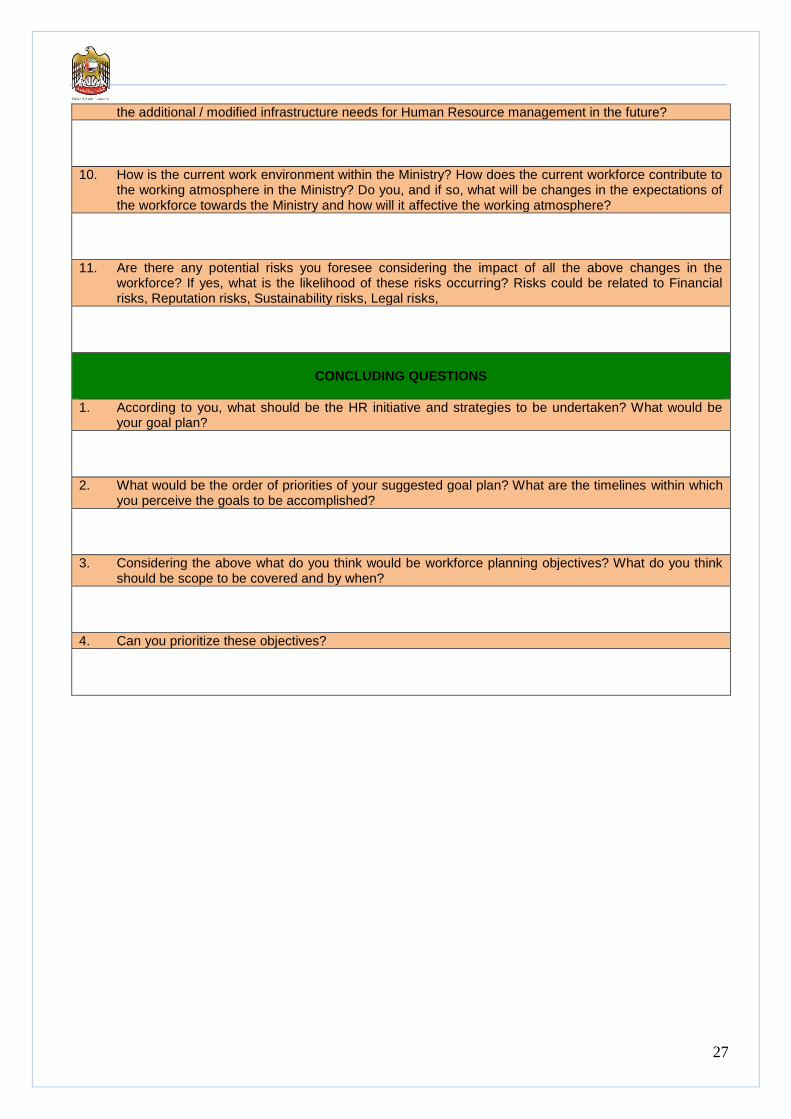
27
the additional / modified infrastructure needs for Human Resource management in the future?
10. How is the current work environment within the Ministry? How does the current workforce contribute to the working atmosphere in the Ministry? Do you, and if so, what will be changes in the expectations of the workforce towards the Ministry and how will it affective the working atmosphere?
11. Are there any potential risks you foresee considering the impact of all the above changes in the workforce? If yes, what is the likelihood of these risks occurring? Risks could be related to Financial risks, Reputation risks, Sustainability risks, Legal risks,
CONCLUDING QUESTIONS
1. According to you, what should be the HR initiative and strategies to be undertaken? What would be your goal plan?
2. What would be the order of priorities of your suggested goal plan? What are the timelines within which you perceive the goals to be accomplished?
3. Considering the above what do you think would be workforce planning objectives? What do you think should be scope to be covered and by when?
4. Can you prioritize these objectives?
28
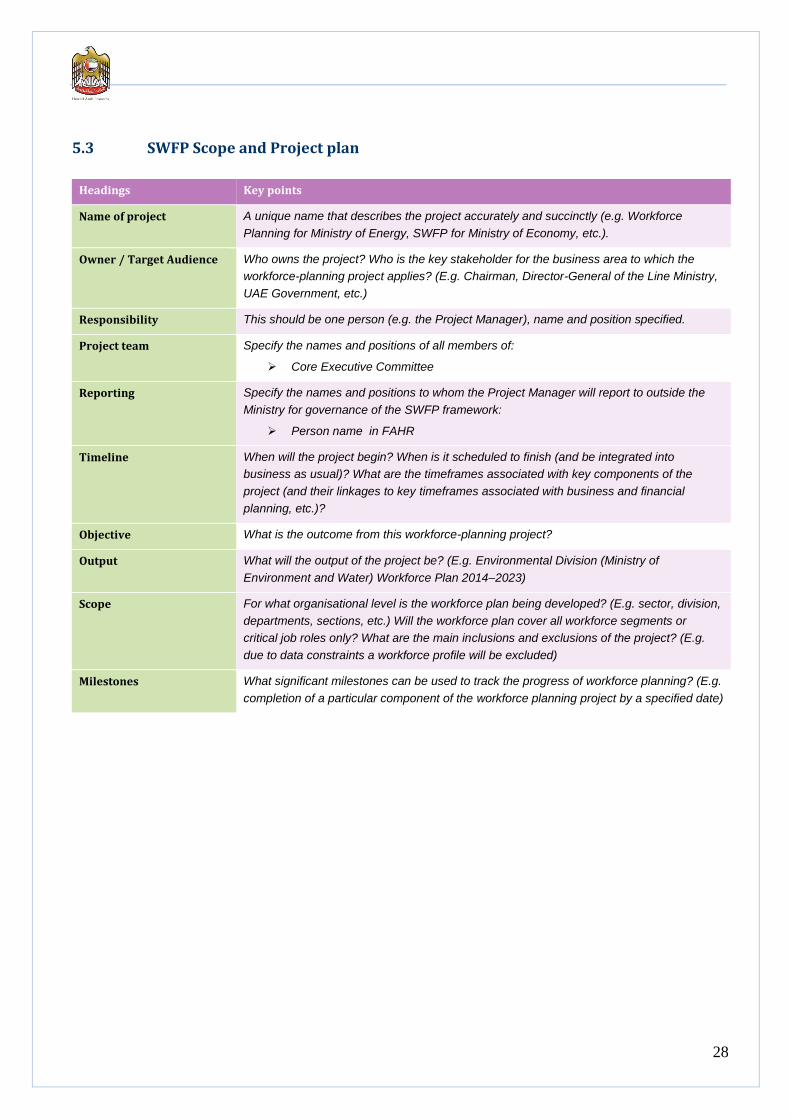
5.3 SWFP Scope and Project plan
Headings Key points
Name of project A unique name that describes the project accurately and succinctly (e.g. Workforce
Planning for Ministry of Energy, SWFP for Ministry of Economy, etc.).
Owner / Target Audience Who owns the project? Who is the key stakeholder for the business area to which the
workforce-planning project applies? (E.g. Chairman, Director-General of the Line Ministry,
UAE Government, etc.)
Responsibility This should be one person (e.g. the Project Manager), name and position specified.
Project team Specify the names and positions of all members of:
Core Executive Committee
Reporting Specify the names and positions to whom the Project Manager will report to outside the
Ministry for governance of the SWFP framework:
Person name in FAHR
Timeline When will the project begin? When is it scheduled to finish (and be integrated into
business as usual)? What are the timeframes associated with key components of the
project (and their linkages to key timeframes associated with business and financial
planning, etc.)?
Objective What is the outcome from this workforce-planning project?
Output What will the output of the project be? (E.g. Environmental Division (Ministry of
Environment and Water) Workforce Plan 2014–2023)
Scope For what organisational level is the workforce plan being developed? (E.g. sector, division,
departments, sections, etc.) Will the workforce plan cover all workforce segments or
critical job roles only? What are the main inclusions and exclusions of the project? (E.g.
due to data constraints a workforce profile will be excluded)
Milestones What significant milestones can be used to track the progress of workforce planning? (E.g.
completion of a particular component of the workforce planning project by a specified date)
29
CHAPTER 3: FORMALIZATION OF JOB ARCHITECTURE
1.WHAT IS JOB ARCHITECTURE?
Job Architecture (JA) is a model of defining an entity’s organization structure, replete with
designation, roles and skills to enable to organization to ‘measure and manage’ the structure and the
existing workforce effectively. It explores and articulates all the activities that are undertaken by an
organization, through a flexible yet structured model. It acts as a powerful tool to determine the gaps
between demands and existing set up and can be used as a driver to determine number of HR
programs and initiatives. It is also used as a measurable objective and tool to trigger monitoring and
assessing the results of these initiates and strategies. The need for clarity and structure is inherent
and is not a requirement solely for Strategic workforce planning. It builds as a base for assessing the
criticality of the jobs and talents required and constantly updating the same in line with the HR
strategies.
In essence, this Stage is the process of building a measurable and managing tool to determine the
organization structure’s skills, talents and job criticality. The exit takeaway at the end of this stage
will be:
Job Architecture model
Guideline framework to conduct Critical Job Analysis (CJA) and Skill Quadrant Rating (SQR)
STAGE DEFINITION: Develop a standard model of Job architecture along with formalization
of the Job Family and Job band within the organization. To also analyze existing jobs for their
criticality based on the standardized assessment parameters.
31
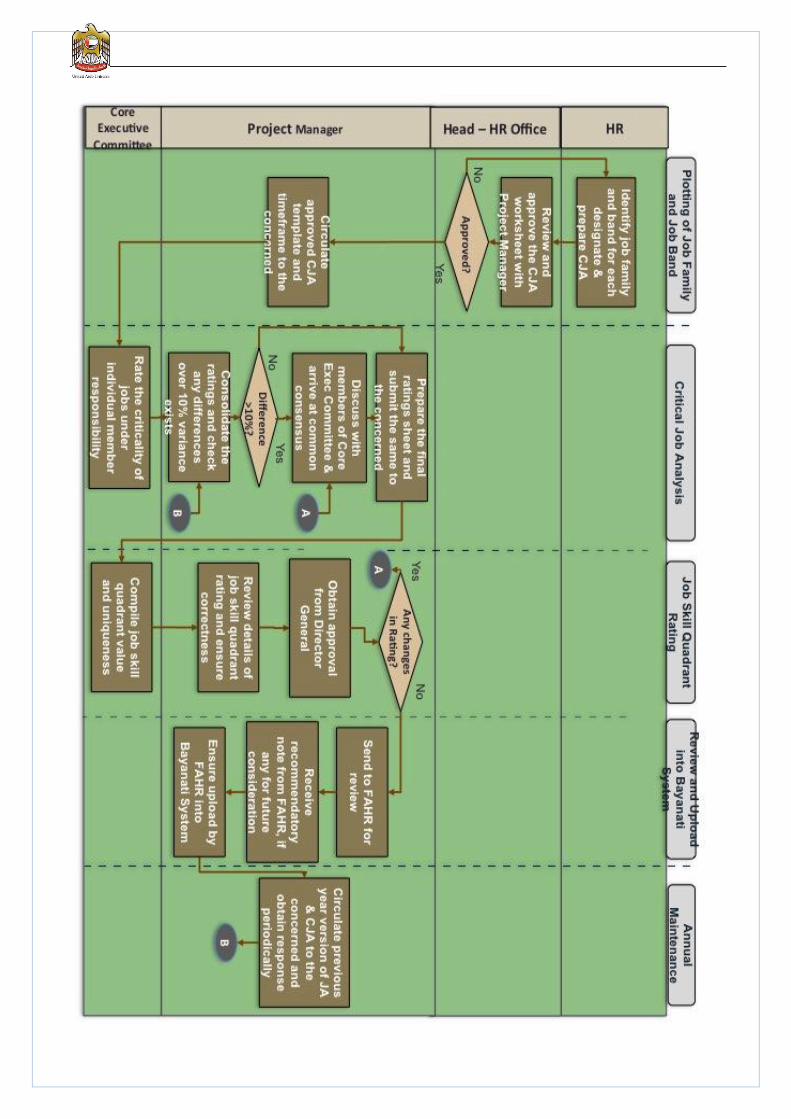
2.1 Plotting of Job Family and Job Band This category refers to the process of allocating the job family and band for each job designate. This
allocation and grouping exercise enables the Human Resource office to determine job family wise or
job band wise concentrations and generally, the shape of the organization structure. This one-time
exercise shall be under the execution responsibility of the HR department in the respective entity but
will be reviewed by the Core Executive Committee.
2.2 Critical Job Analysis – Plotting, Scoring and Ranking
Following the plotting exercise, the Core Executive Committee is responsible in filling in the
questionnaire and rating the criticality of the job on each parameter. This one-time exercise shall be
collectively carried out by the Core executive committee and the rating shall be unanimous backed
by enough justification. Though this activity shall be carried out for all the job titles – core technical,
strategic areas and the support offices, the final ratings for the jobs under support offices will be
reviewed and confirmed by FAHR.
The ratings for the jobs in the support offices will be rationalized across all the federal ministries on a
common platform by FAHR. The rationale behind this model is that designations amongst all the
support offices, which are functioning independently in each federal entity today, the job profile and
criticality parameters will be the same. Hence, to bring about standardization and uniformity, CJA for
these offices will be carried out by FAHR. Eventually, this exercise will also enable bringing about a
common Support office for all Federal entities itself.
2.3 Skill Quadrant Rating and Reports Generation
A. Category Description
Having determined the criticality levels per job title on the three parameters of long-term value,
business value and resource constraints, this category rates the job based on the skills expected to
successfully execute the job. The required skills are rated against the value the skills bring to the
ministry and the level of uniqueness of the skill in itself. While skill uniqueness rating shall be auto
generated based on the job criticality score, the Core Executive committee shall determine the rating
of Skill value for the job titles reporting to them. The specifications and methodology of rating are
provided in Section 4.2 of this Chapter for reference.
2.4 Review and upload
A. Category Description
32
The final scores and ranks shall be reviewed and confirmed by DG of the Federal entity along
with the HR Head. DG of the entity along with the HR head shall approve post review of the
EWS and WSA. They shall be uploaded into Bayanati along with skill quadrant ratings and
reports circulated to the management following the approval.
2.5 Annual Maintenance
A. Category Description
This category explains the practice of periodic assessment of the current state and updation onto the
JA, CJA and Skill Quadrant based on changes to the workforce and job architecture of the entity.
REFERENCES AND FORMATS
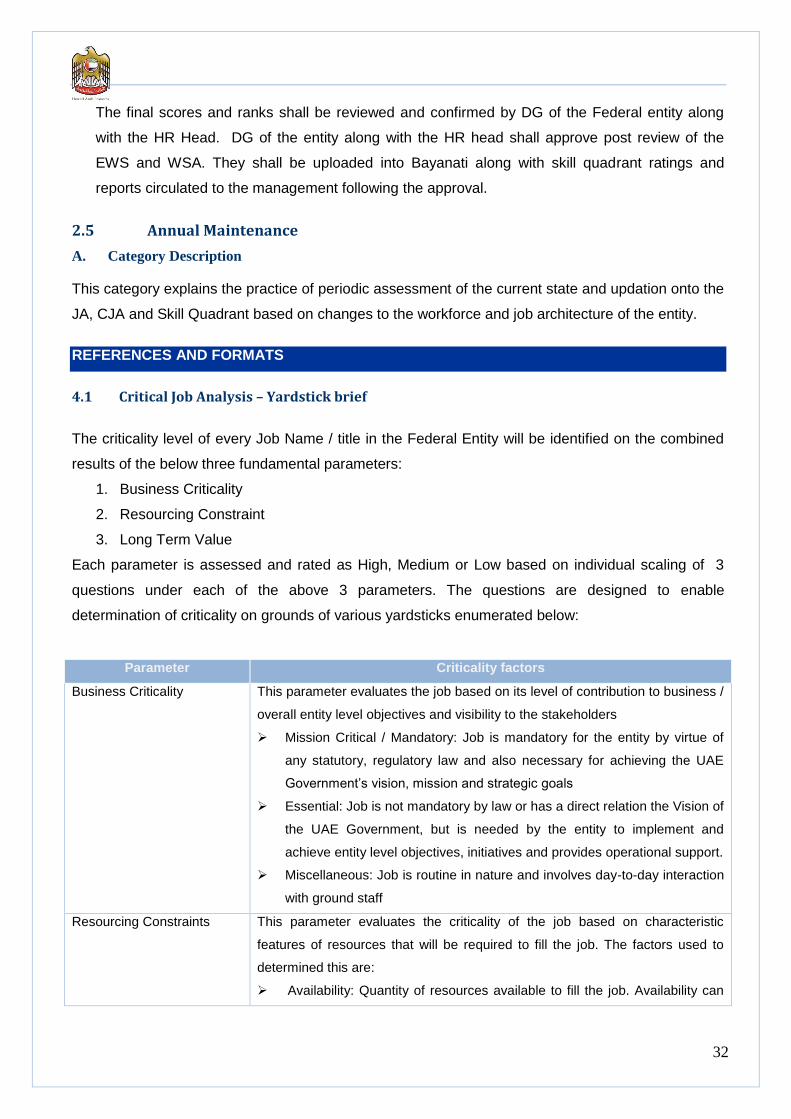
4.1 Critical Job Analysis – Yardstick brief
The criticality level of every Job Name / title in the Federal Entity will be identified on the combined
results of the below three fundamental parameters:
1. Business Criticality
2. Resourcing Constraint
3. Long Term Value
Each parameter is assessed and rated as High, Medium or Low based on individual scaling of 3
questions under each of the above 3 parameters. The questions are designed to enable
determination of criticality on grounds of various yardsticks enumerated below:
Parameter Criticality factors
Business Criticality
This parameter evaluates the job based on its level of contribution to business /
overall entity level objectives and visibility to the stakeholders
Mission Critical / Mandatory: Job is mandatory for the entity by virtue of
any statutory, regulatory law and also necessary for achieving the UAE
Government’s vision, mission and strategic goals
Essential: Job is not mandatory by law or has a direct relation the Vision of
the UAE Government, but is needed by the entity to implement and
achieve entity level objectives, initiatives and provides operational support.
Miscellaneous: Job is routine in nature and involves day-to-day interaction
with ground staff
Resourcing Constraints This parameter evaluates the criticality of the job based on characteristic
features of resources that will be required to fill the job. The factors used to
determined this are:
Availability: Quantity of resources available to fill the job. Availability can
33
Parameter Criticality factors
be from internal, external within UAE or overseas labour market sources,
as the case may be
Attractiveness: Resources may be available to fill the job, however, major
dependency lies on the job’s overall package and level of motivation for
the resource to take up the job. Also ability of the job to retain the
resource
Skill level: Resources may be available to fill the job, however, major
dependency lies on appropriate skills, experience and talents being in
place. The ease or feasibility of acquiring skills or transferring talents
between resources also plays a role in determining the criticality under
this category
Long Term Value This parameter evaluates the potential life of the job in itself. It determines the
fate and existence of the job in the future following various environmental
factors affecting it. The factors used to determine this are:
Advantage: Long-term existence of the job is dependent on the
importance of the job and the inherent character of the profile determining
its importance. Nature of the work is either technical or conceptual
demanding the need globally and hence is placed at a better advantage
than other jobs.
Insulated: Long term existence of the job is dependent on the level of
customization and uniqueness of the job profile itself in relation to the
entity’s business. Factors of price and technology immunity also
determine criticality on grounds of job insulation.
Vulnerable: Long term existence of the job is dependent of vulnerabilities
associated with impact of environmental changes, like technology
inventions, automation of routines operations, globalization, etc. on the
job, thereby making it redundant
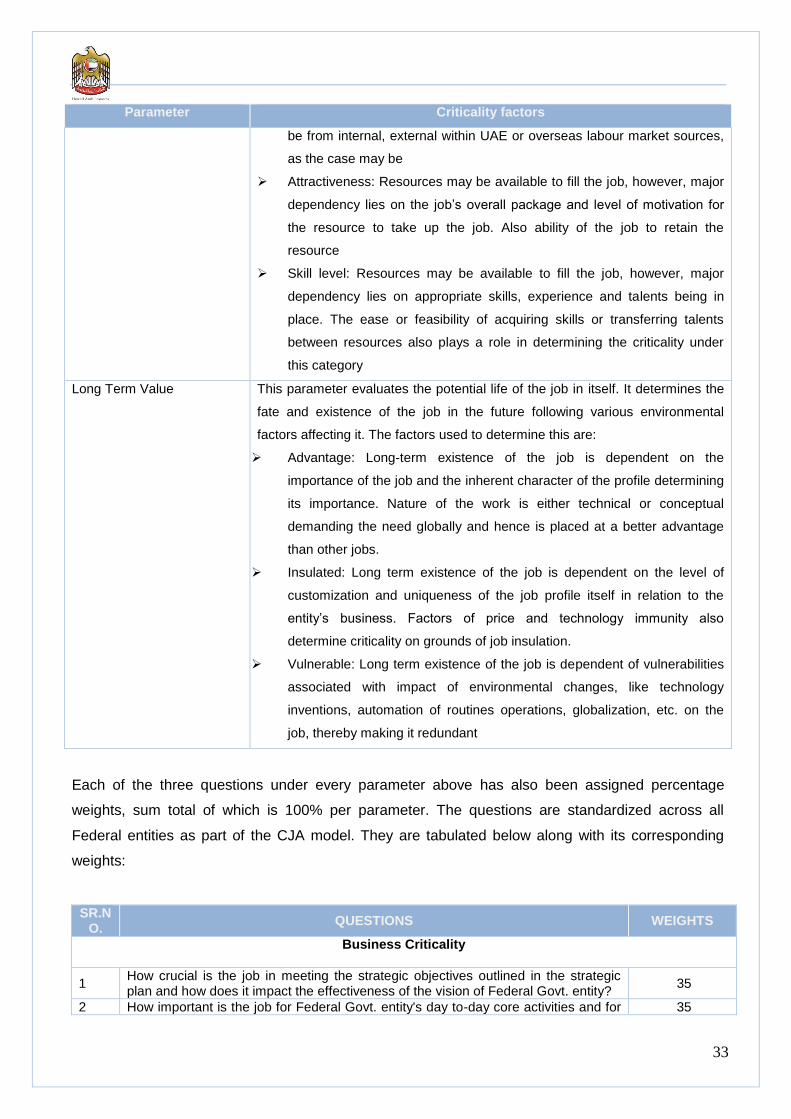
Each of the three questions under every parameter above has also been assigned percentage
weights, sum total of which is 100% per parameter. The questions are standardized across all
Federal entities as part of the CJA model. They are tabulated below along with its corresponding
weights:
SR.NO.
QUESTIONS WEIGHTS
Business Criticality
1 How crucial is the job in meeting the strategic objectives outlined in the strategic plan and how does it impact the effectiveness of the vision of Federal Govt. entity?
35
2 How important is the job for Federal Govt. entity's day to-day core activities and for 35
34
SR.NO.
QUESTIONS WEIGHTS
strong inter linkages with internal/external stakeholders? ?
3 Is this job mandated by decree / executive decision / international laws OR directly impact the entity's capability to deliver its legislative or regulatory requirements?
30
TOTAL WEIGHT 100
Resource Constraint
1 What is the level of non-availability of resource pool i.e. wide scale scarcity of talent required for the job?
34
2 How hard is to retain or attract talent to this job offering evenif talent is available in market?
33
3 How difficult is it to transfer knowledge or up skill the successor in this job? 33
TOTAL WEIGHT 100
Long term Value
1 What is level of difficulty in consolidating this job with another job, in future to improve effectiveness/ efficiency of the entity?
30
2 Where the nature of job is either conceptual or technical, or involves personal/customized service whether its importance won't dilute with time or get obsolete?
35
3 How unique skills & tasks does this job involvewhich are not of a routine production nature and have very less potential of being automated or replaced in the near future?
35
TOTAL WEIGHT 100
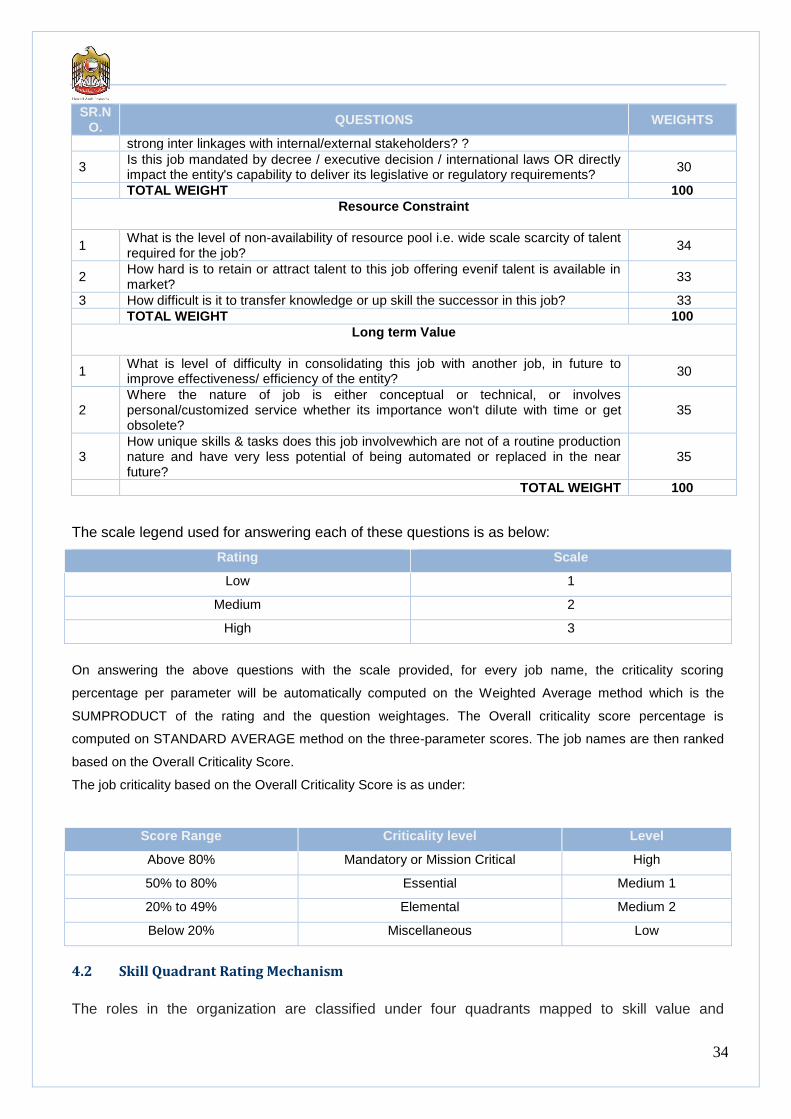
The scale legend used for answering each of these questions is as below:
Rating Scale
Low 1
Medium 2
High 3
On answering the above questions with the scale provided, for every job name, the criticality scoring
percentage per parameter will be automatically computed on the Weighted Average method which is the
SUMPRODUCT of the rating and the question weightages. The Overall criticality score percentage is
computed on STANDARD AVERAGE method on the three-parameter scores. The job names are then ranked
based on the Overall Criticality Score.
The job criticality based on the Overall Criticality Score is as under:
Score Range Criticality level Level
Above 80% Mandatory or Mission Critical High
50% to 80% Essential Medium 1
20% to 49% Elemental Medium 2
Below 20% Miscellaneous Low
4.2 Skill Quadrant Rating Mechanism
The roles in the organization are classified under four quadrants mapped to skill value and
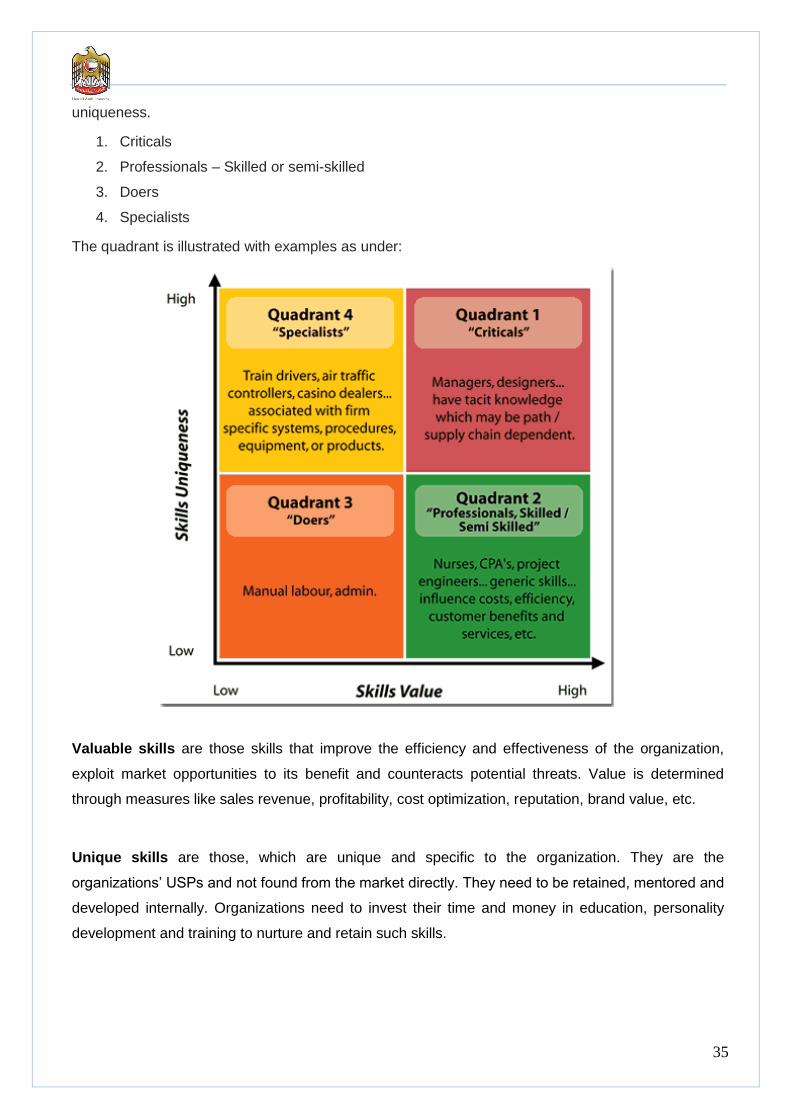
35
uniqueness.
1. Criticals
2. Professionals – Skilled or semi-skilled
3. Doers
4. Specialists
The quadrant is illustrated with examples as under:
Valuable skills are those skills that improve the efficiency and effectiveness of the organization,
exploit market opportunities to its benefit and counteracts potential threats. Value is determined
through measures like sales revenue, profitability, cost optimization, reputation, brand value, etc.
Unique skills are those, which are unique and specific to the organization. They are the
organizations’ USPs and not found from the market directly. They need to be retained, mentored and
developed internally. Organizations need to invest their time and money in education, personality
development and training to nurture and retain such skills.
36
CHAPTER 4: FORMALIZATION OF Workforce segmentation
1.WHAT IS WORKFORCE SEGMENTATION?
Workforce Segmentation (WS) is the process of categorizing human capital within an entity under
predefined categories or features, which are expected by the entity amongst its workforce. Simply
put, it means breaking down the current and forecasted workforce requirements under
characteristics of the job, which determine the profile of the job. WS is a methodology to enable
effective Human Capital management by optimization of current workforce and also identification of
the workforce gaps against the future profile requirements.
Two most common misconceptions prevalent in organizations are that:
a) Personnel at the leadership level or top management are the only people who are most
critical for the organization
b) ‘One size fits all’ approach of the organization structure when dealing with multiple target
customers or multiple ventures at lengthy time periods
c) Segmentation of workforce at salary levels / grade levels are adequate.
Organizations need to realize that though a stable top management is critical for smooth running of
their businesses, there are other key jobs and their profiles which are critical not only for the
sustainability of the organization itself but also act as unique selling points (USPs) amongst its peers.
They may, in essence, play a proportionate role in the revenue growth of the business also. A set
workforce with uniform or stagnant skill sets will not stand the test of time. Organizations need to
recognize this and acknowledge that there are segments, which have skills, knowledge, experience,
location and such other characters, which are unique to every expected job delivery, and that some
of them cannot be easily replaced with any other profile. Some of them also impact the value chain
of the organization over long term.
Similarly, segmentation based on salary hierarchies is deficient in that they do not enable attraction,
engagement and retention strategies. Furthermore, salary levels don’t indicate true relativities
between roles and their linkage to the business strategy, and their impact on business outcomes.
Hence determination of the workforce segments and differentiating the criticalities in each will
provide a holistic view of the ‘Kind’ of Human Resources needed and currently existing, thereby
37
providing opportunity to the organization to focus on methods of mitigating the talent gaps for the
immediate and long term future.
In essence, this Stage is the process of building a measurable and managing tool to determine the
organization workforce skills and profile for talent management. The exit takeaway at the end of this
stage will be:
Desired Entity Workforce Segmentation tool (DEWS) to be applied on what the federal
ministry currently desires to be structured factoring its current ongoing objectives
Current Entity Workforce Segmentation tool (CEWS) to be applied to the current workforce in
each of the federal ministries
Workforce Segmentation Assessment (WSA) : key pivots and graphs for current state
analysis and determination of immediate gaps to be addressed.
STAGE DEFINITION: Develop a standard model of Workforce Segmentation containing the
parameters to be assessed in a job profile. To also map the profile of the existing workforce
against on the standardized parameters and determine the gaps.
2. ACTIVITY OVERVIEW AND PERSON (S) RESPONSIBLE
FAHR has prescribed a Workforce Segmentation methodology adopting suitable best practices and
has compiled a standard excel toolkit model – EWS, to be utilized in all the federal entities.
Considering the current state of maturity levels in the federal entities, it has designed and formalized
the data capture and retention format of the desired workforce architecture at a strategic level and
the capture of the existing workforce segmentation at any given point of time. It has adopted the
global practice of Skill Quadrant rating method as explained in the earlier chapter and has
associated the rating against the existing workforce in the ministry as part of current workforce
assessment. Certain primary assessment reports are populated automatically in the model with
diagrammatic representations for statistical analysis. They help in determining dashboard views of
the desired workforce compositions on various key parameters as against views of the current
workforce compositions, thereby enabling immediate placement of the gaps and issues to be
addressed. The tool is user friendly to be adopted and used with option of very minimal non-
standardized text. The parameters to be filled in are central to all the entities, while the values can be
standardized for each federal entity.
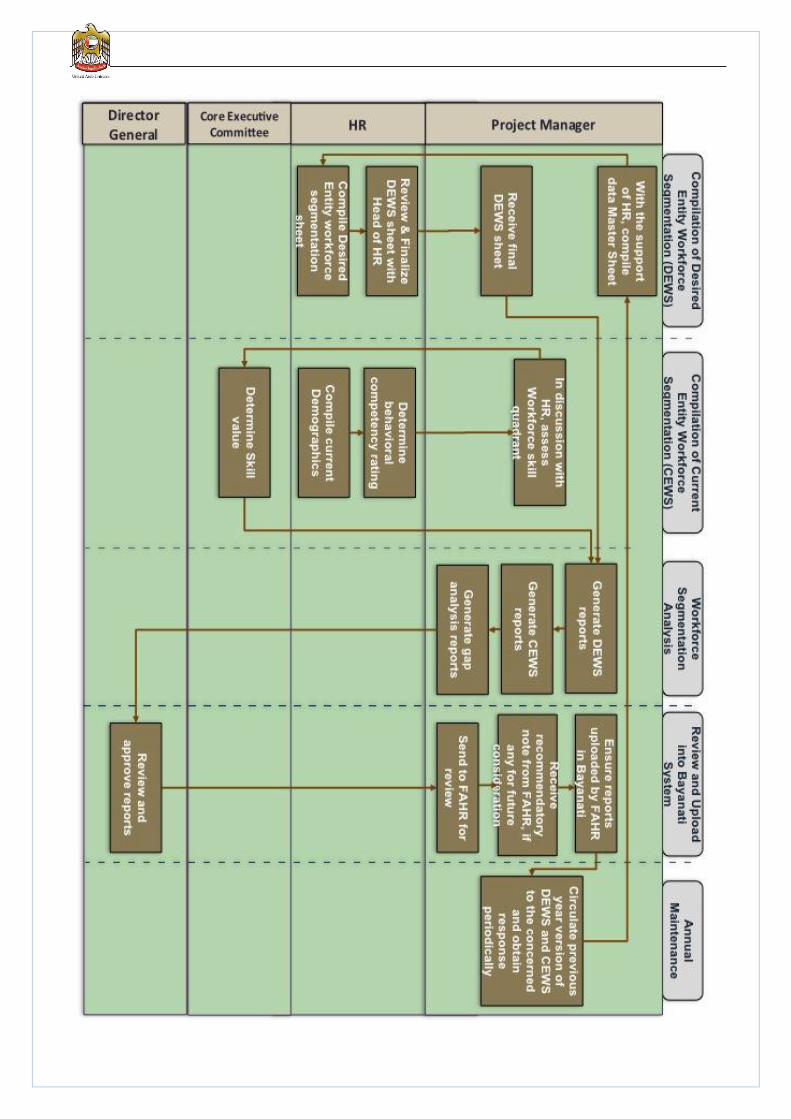
Accordingly, the entire process life cycle of constructing and maintaining the Workforce
segmentation exercise can be categorized as under:
38
Compilation of Desired Entity Workforce Segmentation (DEWS)
o Master Sheet for Data
o Desired key elements per job title demographics, academic qualifications, technical
skills and behavioral competencies
Compilation of Current Entity Workforce Segmentation Analysis (CEWS)
o Existing Workforce demographics
o Current workforce Skill Quadrant Rating
Workforce Segmentation Analysis (WSA)
Review and Upload into Bayanati System
Annual Maintenance
all the above activities will be carried out under the overall responsibility of the Core Executive
Committee. FAHR will be involved in the overall review of the progress in all the federal entities and
will play a supporting role by validating compliance of the methodology followed for implementation,
on a test check basis, as in case needed, at the time of upload into Bayanati.
The flow of the above activities can be aptly illustrated as under:
40
3. ACTIVITY WORK INSTRUCTION
3.1 Compilation of Desired Entity Workforce Segmentation (DEWS)
This category refers to the first stage in building strategic workforce segments in the entity. This
stage focuses on formalizing what the entity as a whole desires or expects to bring about amongst
its workforce in terms of its traits, skills, competencies and values. It can be ideally called the
‘Intended workforce’ for an entity, needed to achieve its operational and strategic goals. As the
outcome is a pre-defined skill architecture stamped for the entity, it shall be compiled by the HR
department, under supervision and review by the Head of HR. The overall activity from the point of
view of the tool updation shall be monitored by the Project Manager, who shall also be responsible
for maintaining the Master Data Sheet and the protected data in the DEWS sheet.
The details of the fields and the source from which the information need to be gathered are provided in Section 5.1 of this Chapter. The Excel software watch-outs and instructions provided in the tool shall be strictly adhered to.
3.2 Compilation of Current Entity Workforce Segmentation (CEWS)
Following the master building exercise, the current operating workforce shall be dissected and its
features recorded inthe format provided in the CEWS sheet. The HR Office along with the Project
Manager can carry out this process stage with access to internal data of the resources currently
employed.The current operating workforce shall be dissected and its features recorded from the
sources depicted under Section 5.1.2. One of the pre-requisite for this stage is the accessibility of
internal data of the resources currently employed, to the Project Manager and HR office.
The skill quadrant scoring shall be carried out for each employee wherein the assessment of skill
value will be carried out manually by the members of the SWP execution committee. The expected
attributes under DEWS for each job title will be mapped with the employee concerned and
accordingly individual discretion shall be applied before rating the skill value of the employee. The
populated final rating shall be reviewed by the DG of the federal entity.
The Excel software watch-outs and instructions provided in the tool shall be strictly adhered to.
3.3 Workforce Segmentation Analysis (WSA)
A. Category Description
Responsibility vests with the Project Manager in populating the analytical dashboard reports
intended to provide the execution committee and the stakeholders, inputs for assessment of current
state of the ministry’s workforce under various feature dimensions. He shall also be responsible for
populating the gap report between intended skill segments and current skill segments. The exception
41
reporting is chiefly auto populated on triggering the related macros; the specifications of the
reports currently being populated with the intended benefits and usage are provided in Section 5.1.3
of this Chapter.
These statistics are submitted to the executive committee and reviewed by the DG of the entity, for
usage in subsequent stages of the SWP exercise.
3.4 Review and Upload into Bayanati System
The standard activity review process as in earlier chapters shall also apply wherein the DG of the
entity along with the HR head shall approve post review of the EWS and WSA. They shall be
uploaded into Bayanati along with skill quadrant ratings and reports circulated to the management
following the approval.
3.5 Annual Maintenance
This category explains the practice of periodic assessment of the current state and updation onto the toolkit and capturing the status of the skill segments
42
CHAPTER 5: WORKFORCE FORECASTING
1.WHAT IS WORKFORCE FORECASTING?
The stages as described in earlier chapters sets the environment and scenario under which
Workforce Forecasting (WF) commences. This is the core stage of the Strategic Workforce Planning
framework and is built on the resultant outputs and assessments arising out of Strategic Intent,
Critical Job analysis and Workforce Segmentation. Workforce forecasting simply means the process
of forecasting workforce needs for an entity over a period. In the case of SWP, the framework
enables the entity to forecast for a period ranging from current to 10 years horizon. Determining the
future staffing demand is essential to ensure that the strategic goals, customer expectations are met
with quality maintained, as wel as the competencies that are required of the future workforce to meet
the business outcomes are acquired and maintained through qualified staff.
Forecasting has two elements:
o Demand forecasting
o Supply forecasting
Demand forecasting determines the workforce needs of the organization over the future. The focus
here is to map the work, which the company should perform against the staff needed to perform the
work. A staffing assessment against future functional requirements is conducted. The result is a
forecast of the type of competencies, numbers, and locations of employees needed in the future.
This makes up the future workforce profile. An important part of the demand analysis process is
examining not only what work the organization will do in the future, but how that work will be
performed. Activities which are currently operational may not be functional in the future, due to
technological impact on those activities or due to re-organization of services and customer delivery
focus, thereby leading to change in the Job architecture in itself.
Supply forecasting determines the workforce availability to suit the organization needs over the
future. The availability of future supplies is determined from probability levels of current workforce
supplies continuing in the future and the probability levels of supplies in the external market joining
the entity. Forecasting or projecting the future supply requires identifying variables and applying
assumptions about how these variables will influence the type and level of workforce the
organization will have in the future. Internal and external environment is scanned to determine the
probability levels. It helps in identifying emerging trends and issues and business environment within
the organization. This information can be found by consulting labor force research reports and
forecasts available from industry associations, business and trade publications, and government
43
resources.
In essence, this Stage is the process of building a measurable and managing tool to calculate the
demand and supply forecasts of the organization workforce, with provision for assessment on
various parameters affecting the forecasts. The outcome of this exercise would be the inputs for
formulating the Desired workforce profile in the DEWS sheet in Workforce Segmentation tool,
explained in Chapter 4.
The exit takeaway at the end of this stage will be:
Workforce Demand forecast over ten year period
Workforce Supply forecast over ten year period
STAGE DEFINITION: Develop a model for assessing future or desired end-state in the same
workforce terms as mentioned in Workforce Segmentation. The end result of the stage would
be to arrive at the forecasted resource count against each of the jobs in the entity over the
next 10 year period after factoring other factors like attrition, retirements, structural changes,
technology changes, new competency requirements and / or new job positions.
2. FORECASTING MODEL ADOPTED BY FAHR
FAHR has adopted a simple strategic model for Demand and Supply forecasting specifically for
government department resourcing keeping into consideration the following:
Limited scope for which the forecasting technique is applied for, that is, manpower planning
of resources within government departments.
Current maturity levels of manpower estimation
Existing workforce architecture set up amongst the federal ministries
Availability levels of statistical data and other information
Technology enablers
FAHR has endeavored to keep the model features simple, easy to understand and quick to adopt
with results to be instantly appreciated. The forecasting model has been translated onto an excel
based toolkit for the convenience of the users in the ministry. The ensuing paragraphs provide brief
on the features and equation adopted for Demand forecasting and Supply forecasting. The manner
in which the data is captured in the excel model is also depicted at appropriate sections. The field
level specifications of the toolkit are provided in Section 7 of this chapter.
2.1 DEMAND FORECASTING

44
FAHR has adopted a simplified version of the “XXXX’ model conceptualized by ILO. (Ref….).
The formula has been suitably modified to factor only the features responsible for impacting the
quantitative demand of manpower against every job title in the workforce of the federal entity. In
essence, both demand and supply forecasting methodology is purely to arrive at the estimated
resource count needed under every job title over a period of ten years to execute the objectives of
the entity.
The formula used to arrive at the resource count demand for every year under each job title is:
MYr X = MYr Y * (1 + Growth%)n where
(1+Productivity%)n
MYr X is the resource count estimate for the desired year
MYr Y is the resource count during the year of data available
Growth% is the percentage impact of factors influencing growth in the ministry on the labor
demand during the year of data available
Productivity % is the percentage impact of factors affecting productivity / efficiency of the labor on
the demand during the year of data available
n is the number of years (Yr X minus Yr Y)
For the purpose of this SWFP model, the growth and productivity percentages are computed year on
year, for every job title. Hence n will always be equal to 1 and MYr Y will be the previous year.
The formula effectively means that to arrive at a particular year’s demand forecast, the previous year
count is incremented with a positive or negative net percentage of growth and productivity balanced
ratio estimated for the particular year. The underlying principle is that Growth is directly proportional
to labor demand wherein with increase in growth, there is higher likelihood of increase in manpower.
Productivity, on the other hand, is inversely proportional to labordemand, wherein with higher
productivity and efficient resources, number of resources required to discharge the function or job
decreases. Hence the combination of Growth and Productivity percentage as a balanced ratio is
arrived at, to determine the forecasted percentage of increase or decrease against the previous year
manpower count.
The following paragraphs describe the methodology adopted for arriving at the Growth rates and
Productivity rates and the manner in which they are assigned to individual job titles eventually.
Determination of Growth Percentage per Job title
The factors bringing about growth are attributable to the ministry in entirety and are not job or skill
specific. Hence, the arrival of growth percentage per job title requires the following data to be
compiled necessarily in the order below. The excel toolkit provided as part of this guide for each

45
ministry to utilize enables the user to follow the cycle accordingly.
First Data level : Factors influencing the growth in the ministry and estimated growth rate of each
factor
There are various internal and external factors, which influence the growth of a ministry. The
standard internal factors applicable to all ministries are strategic objectives of the entity, new
initiatives, revenue increase, new service lines, cost optimization, etc. Similarly, external factors
applicable for a ministry can be increase in population, foreign investments, global networking and
general political and economic environment affecting growth. Detailed enumeration of measurable
factors are provided in the excel toolkit as reference. Ministries can suitable modify or append them
to suit their operations.
Year on year forecast of growth rate over the ten-year period is made based on subjective
assessment of past trends and other statistical data and other in-house and external information
available.
The unit of measurement or baseline for arriving at the growth rate would be random and different for
each factor.
Second Data level :Growth contribution weights per factor and Weighted growth rate
As the growth rates specified in first data level are at different baselines, they are normalized to a
common scale by associating a relative weight of contribution to the total growth of the ministry
against each of the factor. The product of the relative weights to the growth rate above will determine
the year on year Weighted growth rate per factor set to a base scale of total growth of the
ministry.The sum of the weighted growth rates is used to arrive at job title wise growth impact on
manpower need.
Third Data level :Job wise growth impact variability
Each job title has different variability levels of impact on the quantitative demand. The variability
levels can be either fixed,100% variable or limited variable.
If the job title has a fixed variability, it means that there will be zero impact of growth on the existing
quantity of resources under the job title. Top management and leaders would predominantly have a
fixed variability level.
If the job title has a100% variability, it means that there will be 100% impact of growth on the existing
resources under the job title. Hence, if the total growth rate for the year is 10%, the number of
resources under the job title will also increase by 10%.

46
If the job title has a limited variability, it means that it could be any percentage (between 1
and 99) impact of growth on the existing resources under the job title. Hence, if the total growth rate
for the year is 10% and the variability level of the job title is 20%, the number of resources under the
job title will increase by 2%.
The variability levels are set year on year for each job title manually based on subjective assessment
while the impact percentage on demand is automatically computed in the toolkit.
Determination of Productivity Percentage per Job title
Unlike in the case of growth as explained earlier, factors affecting productivity and its consequent
impact on demand are directly attributable to each job title. The baseline of factor wise productivity
increase or decrease percentage is common for all the factors – “total workforce”. Hence, relative
weights as done in growth are not plotted here.
The arrival of productivity percentage per job title requires the following data to be compiled
necessarily in the order below. The excel toolkit provided as part of this guide for each ministry to
utilize enables the user to follow the cycle accordingly.
First Data level : Factors influencing the growth in the ministry and estimated growth rate of each
factor
There are predominant internal factors, which influence the productivity of a ministry’s workforce.
The standard factors applicable to all ministries would be technological automations, improving
working conditions, training to enhance skills, academic sponsorships, motivational and employee
morale boosters, employment mode / status, etc. Detailed enumeration of measurable factors are
provided in the excel toolkit as reference. Ministries can suitable modify or append them to suit their
operations.
Year on year forecast of productivity rate over the ten-year period is made based on subjective
assessment of the current and future condition of the factors and the related impact on the total
workforce.
The unit of measurement or baseline for arriving at the productivity rate would be the total workforce.
The sum of the factor wise productivity rates is used to arrive at job title wise productivity impact on
manpower need.
Second Data level :Job wise productivity impact variability
The same methodology followed for third data level in determining job wise growth impact is adopted
47
here.
Determination of Resource Demand Count
The end result of all the above would be year on year job title wise Growth and Productivity impact
percentages. The final outcome is automatically computed using the formula explained in the earlier
paragraph. The demand forecast sheet would display estimated count of resources required per year
for every Job title in the workforce of the ministry.
2.2 SUPPLY FORECASTING
Generally accepted practice of supply forecasting is the assessment of the probabilities of continuing
availability of existing workforce over the period of estimation. Factors influencing internal and
external movement or transition of the workforce are determined and likelihood of the occurrence
with impact of the occurrence is calculated. The year on year incremental / decremented supply rate
is thus arrived at and accordingly quantified. External situations affecting the supply of the
workforceare also assessed and appropriate impact weightage assigned to the supply forecast.
The following paragraphs describe the methodology adopted for arriving at the Supply impact rate
and the manner in which they are assigned to individual job titles eventually.
First Data level : Factors influencing manpower supply
The common factors affecting future availability of existing manpower within the ministry / job family
are:
Promotions (inward and outward)
Transfers (inward and outward)
Retirement
Retrenchments
Resignation
The external factors which affect the supply of workforce required by the ministry would be, the
impact of:
Ongoing talent generation and acquisition activities of the ministry
New talent acquisition initiatives planned by the ministry to be implemented
Talent attraction initiatives planned and ongoing like promotions, advertising,
Branding and imaging
Competitive environment
General growth or nature of the working population / labor environment
Projected industry / business trends
48
Detailed enumeration of measurable factors are provided in the excel toolkit as reference.
Ministries can suitable modify or append them to suit their operations.
Second Data level :Assimilation of past data and future trend information
The assessment of the impact of the above factors on the future supply rate is subjective based on
review of past trends of internal factors and availability of external source data in the form of trend
reports, surveys, etc.
FAHR expects that data movement of workforce per ministry in previous 3 years on promotions,
transfers, retirements is captured and recorded in the Bayanati system. Annual reports from
Bayanati would be generated, providing job title wise details of counts and percentages of resources
increased or decreased by virtue of promotions, transfers, resignations, resignations and
retrenchments. This information is then segmented year wise against per job title to assess the trend
or impact of each individual factor on the resources per job title. The excel toolkit provides the
segmentation format for easy conversion of the Bayanati data into analytical layout. The indicative
trend percentage is automatically populated in the toolkit, which would be used as a reference for
future estimation.
For other external factors, ministries are expected to assimilate relevant information from respective
sources.
Third Data level : Estimation of Supply trend percentage
Post assimilation of data as above, year on year supply impact percentage is estimated for each of
the influencing internal factor under every job title. Impact percentage of each external influencing
factor on the total workforce of the ministry is estimated year on year and the year wise total of the
impact percentage is appropriately applied to job titles, which are affected by external environment.
Determination of Resource Supply Count
The end result of all the above would be year on year job title wise increase or decrease supply
percentage. The final outcome is automatically computed by applying the percentage to the previous
year supply estimate count. The supply forecast sheet would display estimated count of resources
available per year for every Job title in the workforce of the ministry.
3. ACTIVITY OVERVIEW AND PERSON (S) RESPONSIBLE
The forecasting methodology prescribed by FAHR in the above section has been compiled into a
standard excel toolkit model – Demand / Supply toolkit, to be utilized in all the federal entities.
Though the primary layout of the model is standardized for all entities, the parameters can be
modified by each ministry as per their relevance and subjective importance.
49
The functionalities, sources from which the data needs to be collected and the manner of
implementing the toolkit is in the order of the data compilation and population cycle described in
detail in Section 2 of this chapter. Accordingly, the entire process life cycle of carrying out the
Demand / Supply exercise can be categorized as under:
Demand Forecasting
Determination of Growth Impact percentage
Determination of Productivity Impact percentage
Demand Forecast and Finalization
Supply Forecasting
Past years Trend Assessment
External Factor identification and Impact assessment
Job wise Impact on future supply
Supply Forecast and Finalization
As in earlier stages, all the above activities will be carried out under the overall responsibility of the
Core Executive Committee. FAHR will be involved in the overall review of the progress in all the
federal entities and will play a supporting role by validating compliance of the methodology followed
for implementation, on a test check basis, as in case needed, at the time of upload into Bayanati.
The flow of the Demand forecasting activities can be aptly illustrated as under:

DEMAND FORECASTING
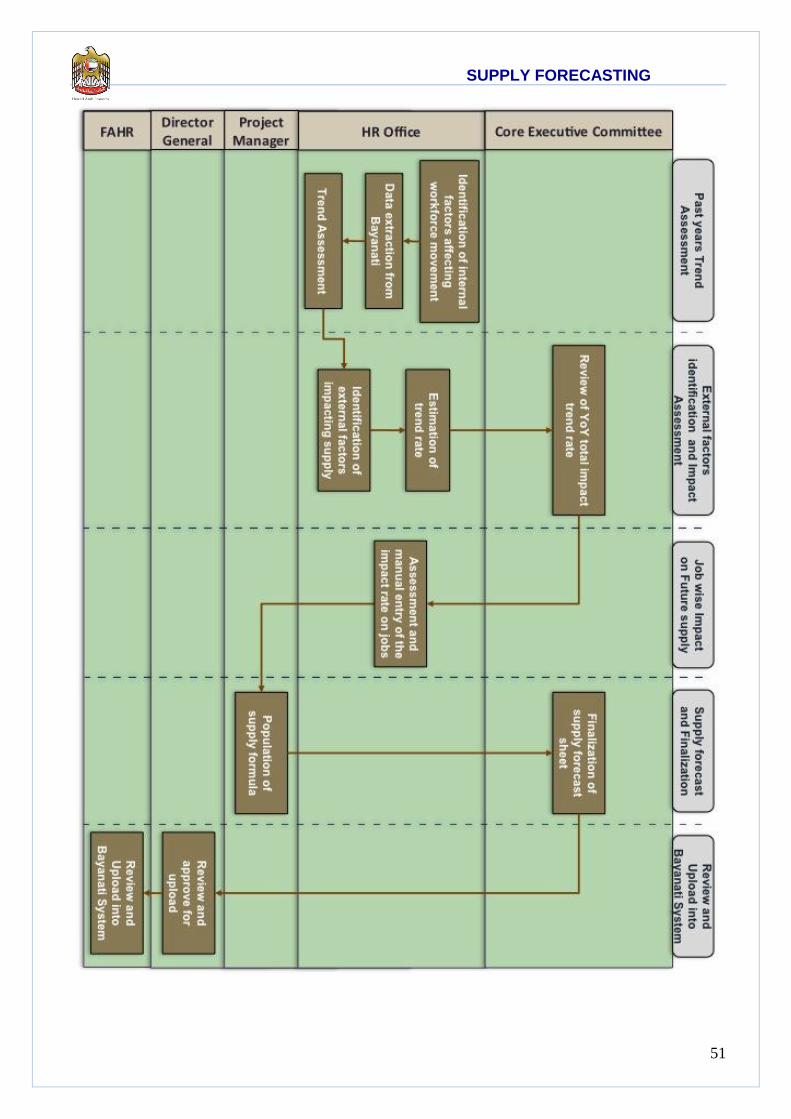
51
SUPPLY FORECASTING
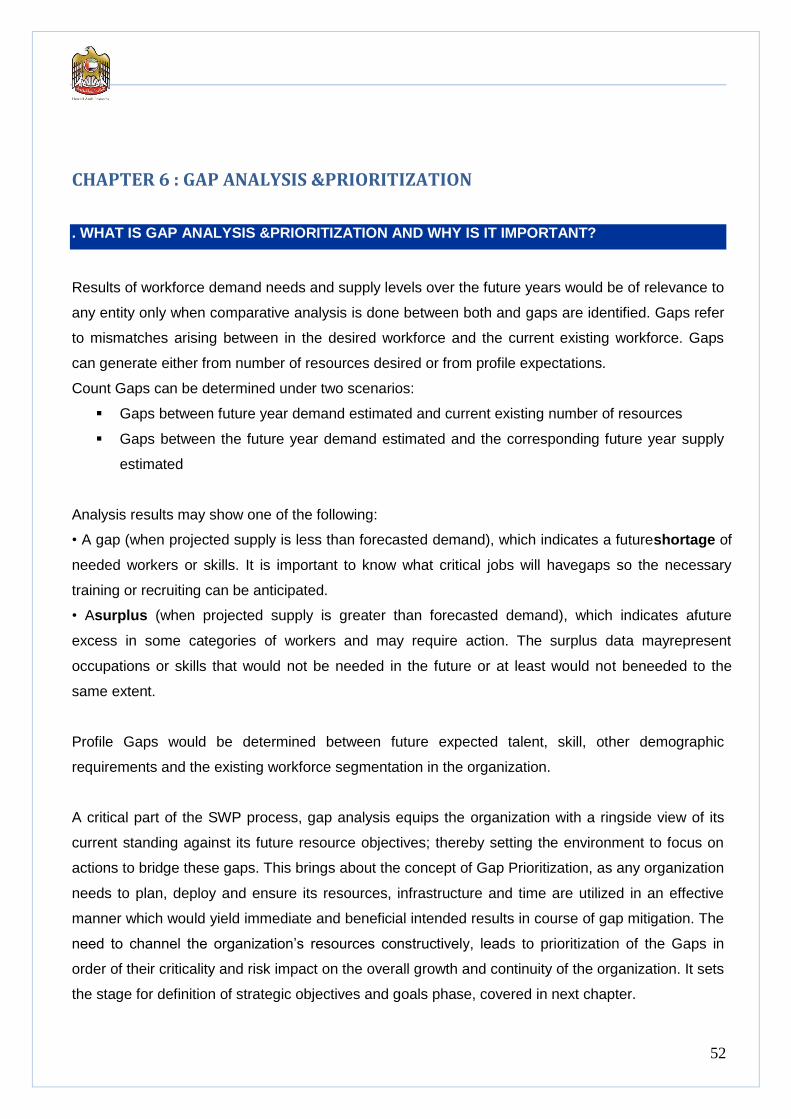
52
CHAPTER 6 : GAP ANALYSIS &PRIORITIZATION
. WHAT IS GAP ANALYSIS &PRIORITIZATION AND WHY IS IT IMPORTANT?
Results of workforce demand needs and supply levels over the future years would be of relevance to
any entity only when comparative analysis is done between both and gaps are identified. Gaps refer
to mismatches arising between in the desired workforce and the current existing workforce. Gaps
can generate either from number of resources desired or from profile expectations.
Count Gaps can be determined under two scenarios:
Gaps between future year demand estimated and current existing number of resources
Gaps between the future year demand estimated and the corresponding future year supply
estimated
Analysis results may show one of the following:
• A gap (when projected supply is less than forecasted demand), which indicates a futureshortage of
needed workers or skills. It is important to know what critical jobs will havegaps so the necessary
training or recruiting can be anticipated.
• Asurplus (when projected supply is greater than forecasted demand), which indicates afuture
excess in some categories of workers and may require action. The surplus data mayrepresent
occupations or skills that would not be needed in the future or at least would not beneeded to the
same extent.
Profile Gaps would be determined between future expected talent, skill, other demographic
requirements and the existing workforce segmentation in the organization.
A critical part of the SWP process, gap analysis equips the organization with a ringside view of its
current standing against its future resource objectives; thereby setting the environment to focus on
actions to bridge these gaps. This brings about the concept of Gap Prioritization, as any organization
needs to plan, deploy and ensure its resources, infrastructure and time are utilized in an effective
manner which would yield immediate and beneficial intended results in course of gap mitigation. The
need to channel the organization’s resources constructively, leads to prioritization of the Gaps in
order of their criticality and risk impact on the overall growth and continuity of the organization. It sets
the stage for definition of strategic objectives and goals phase, covered in next chapter.

53
In essence, this Stage is the process of determination of the count and talent gaps. The exit
takeaway at the end of this stage will be:
Gap Identification and analysis
Prioritization of gaps
STAGE DEFINITION: Develop a mechanism of consolidation of the demand and supply
estimates of the workforce including its profile segmentation and provide a holistic view of
the differences for preventive action to be undertaken.
2. GAP ANALYSIS AND PRIORITIZATION METHODOLOGY ADOPTED BY FAHR
Similar to earlier stages, FAHR has developed an excel based toolkit which enables consolidation of
the results of the demand and supply forecasts carried out under the prescribed methodology. It also
enables the comparison and identification of the profile gaps between DEWS of a particular future
year and CEWS of the year selected. Details about DEWS and CEWS are provided in the Workforce
Segmentation Chapter. (Chapter 4 of this Operating Guide). The Gap risk rating process and
Analytical view of the Job title wise count and skill gaps are automated within the toolkit.
The following provide brief of the specifications and logic configured in the toolkit.
2.1 COUNT GAPS
The toolkit provides the flexibility to determine the demand and supply count gap for any year
selected. The years selected can also be dissimilar. The user is given the option to select the year
for both demand and supply forecasts. Determination of current count gaps (gaps between demand
forecast of a future year and existing workforce) is excluded from this methodology,as FAHR
requires that the ministries focus on actions required to mitigate the future gaps primarily.
2.2 GAP RISK RATING
FAHR has adopted a methodology of categorizing the Gaps and arriving at the Risk Priority Scale
(RPS) based on the Job Criticality and the Skill Quadrant Rating of each job title rather than the
quantum of the gaps. The RPS is arrived at from a standardized probability matrix of both the above
parameters as below: (Refer Chapter 3 – Critical Job analysis for details on Job Criticality and Skill
Quadrant Rating)
Job Criticality Skill Quadrant Rating Risk Priority Scale
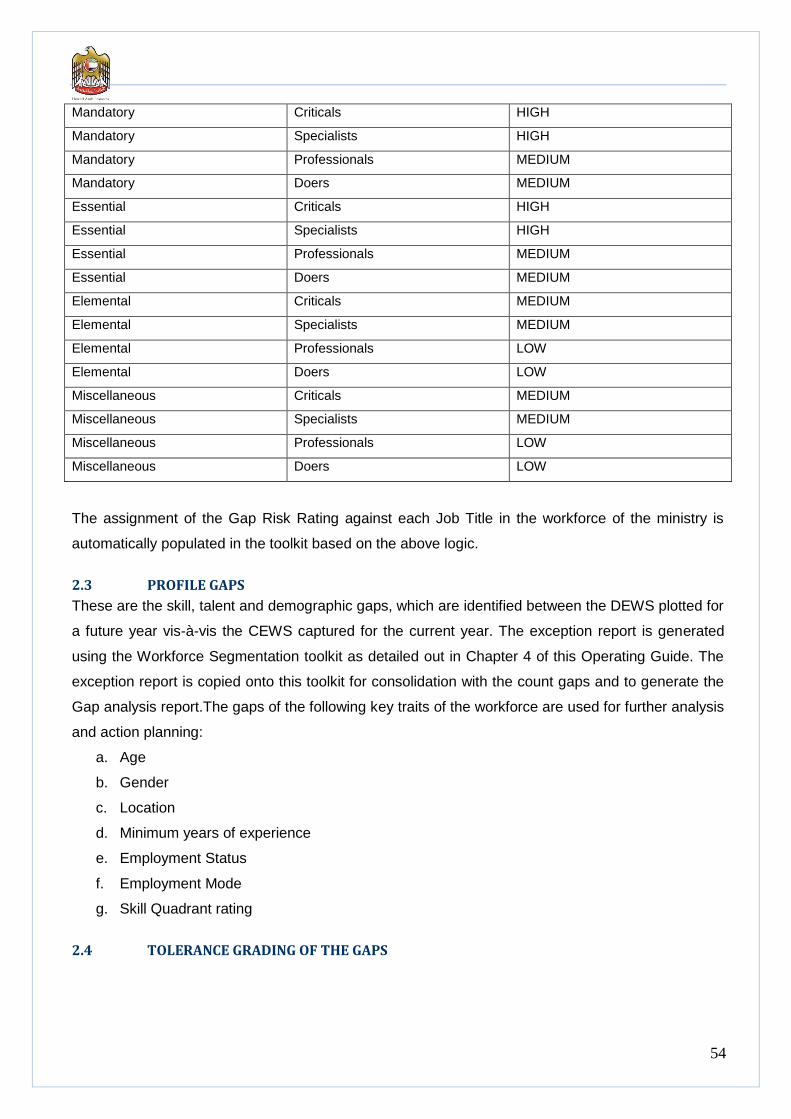
54
Mandatory Criticals HIGH
Mandatory Specialists HIGH
Mandatory Professionals MEDIUM
Mandatory Doers MEDIUM
Essential Criticals HIGH
Essential Specialists HIGH
Essential Professionals MEDIUM
Essential Doers MEDIUM
Elemental Criticals MEDIUM
Elemental Specialists MEDIUM
Elemental Professionals LOW
Elemental Doers LOW
Miscellaneous Criticals MEDIUM
Miscellaneous Specialists MEDIUM
Miscellaneous Professionals LOW
Miscellaneous Doers LOW
The assignment of the Gap Risk Rating against each Job Title in the workforce of the ministry is
automatically populated in the toolkit based on the above logic.
2.3 PROFILE GAPS
These are the skill, talent and demographic gaps, which are identified between the DEWS plotted for
a future year vis-à-vis the CEWS captured for the current year. The exception report is generated
using the Workforce Segmentation toolkit as detailed out in Chapter 4 of this Operating Guide. The
exception report is copied onto this toolkit for consolidation with the count gaps and to generate the
Gap analysis report.The gaps of the following key traits of the workforce are used for further analysis
and action planning:
a. Age
b. Gender
c. Location
d. Minimum years of experience
e. Employment Status
f. Employment Mode
g. Skill Quadrant rating
2.4 TOLERANCE GRADING OF THE GAPS
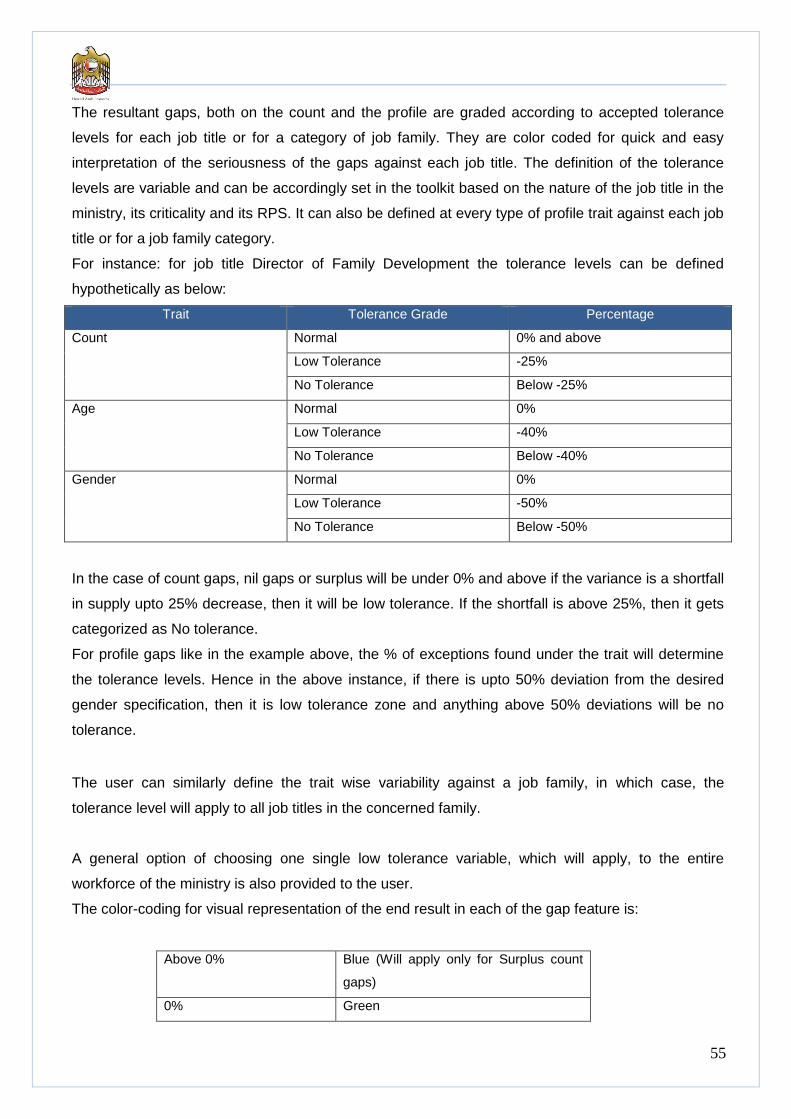
55
The resultant gaps, both on the count and the profile are graded according to accepted tolerance
levels for each job title or for a category of job family. They are color coded for quick and easy
interpretation of the seriousness of the gaps against each job title. The definition of the tolerance
levels are variable and can be accordingly set in the toolkit based on the nature of the job title in the
ministry, its criticality and its RPS. It can also be defined at every type of profile trait against each job
title or for a job family category.
For instance: for job title Director of Family Development the tolerance levels can be defined
hypothetically as below:
Trait Tolerance Grade Percentage
Count Normal 0% and above
Low Tolerance -25%
No Tolerance Below -25%
Age Normal 0%
Low Tolerance -40%
No Tolerance Below -40%
Gender Normal 0%
Low Tolerance -50%
No Tolerance Below -50%
In the case of count gaps, nil gaps or surplus will be under 0% and above if the variance is a shortfall
in supply upto 25% decrease, then it will be low tolerance. If the shortfall is above 25%, then it gets
categorized as No tolerance.
For profile gaps like in the example above, the % of exceptions found under the trait will determine
the tolerance levels. Hence in the above instance, if there is upto 50% deviation from the desired
gender specification, then it is low tolerance zone and anything above 50% deviations will be no
tolerance.
The user can similarly define the trait wise variability against a job family, in which case, the
tolerance level will apply to all job titles in the concerned family.
A general option of choosing one single low tolerance variable, which will apply, to the entire
workforce of the ministry is also provided to the user.
The color-coding for visual representation of the end result in each of the gap feature is:
Above 0% Blue (Will apply only for Surplus count
gaps)
0% Green
56
Low tolerance Yellow
No Tolerance Red
The user is provided with the facility to capture the variable tolerance levels in the excel toolkit for
each job title or job family in the form of 3 reports:-
Report 1 – Uniform/Single Tolerance Level
This option can be used if the user wants to fix a standard uniform tolerance level across all
workforce segments
Report 2 – Job Title Specific Gap Analysis
This option can be used if the user wants to define different tolerance levels at a job title level and
different gap types under each job title. For job titles wherever this option is not adopted, the uniform
tolerance limit will be applied.
Report 3 – Job Family Specific Gap Analysis
This option can be used if the user wants to define different tolerance levels a job family level and
different gap types under a job family. For job familities wherever this option is not adopted, the
uniform tolerance limit will be applied.
The excel macros trigger the computation of the gap percentage, comparison with the tolerance level
and automatically sets the color and deviation %ages against each trait in the job title, thus forming
the Gap analysis sheets.
3. ACTIVITY OVERVIEW AND PERSON (S) RESPONSIBLE
The entire process of conducting the gap analysis and prioritization can be classified under the
following major categories:
Data Consolidation and Tolerance Level determination
Gap Analysis and Risk Priority Scaling
The entire process will be carried out by the Project Manager alongwith HR office and submitted to
the Core Executive Committee for further strategic action to be taken.
The flow of the above categories can be aptly illustrated as under:
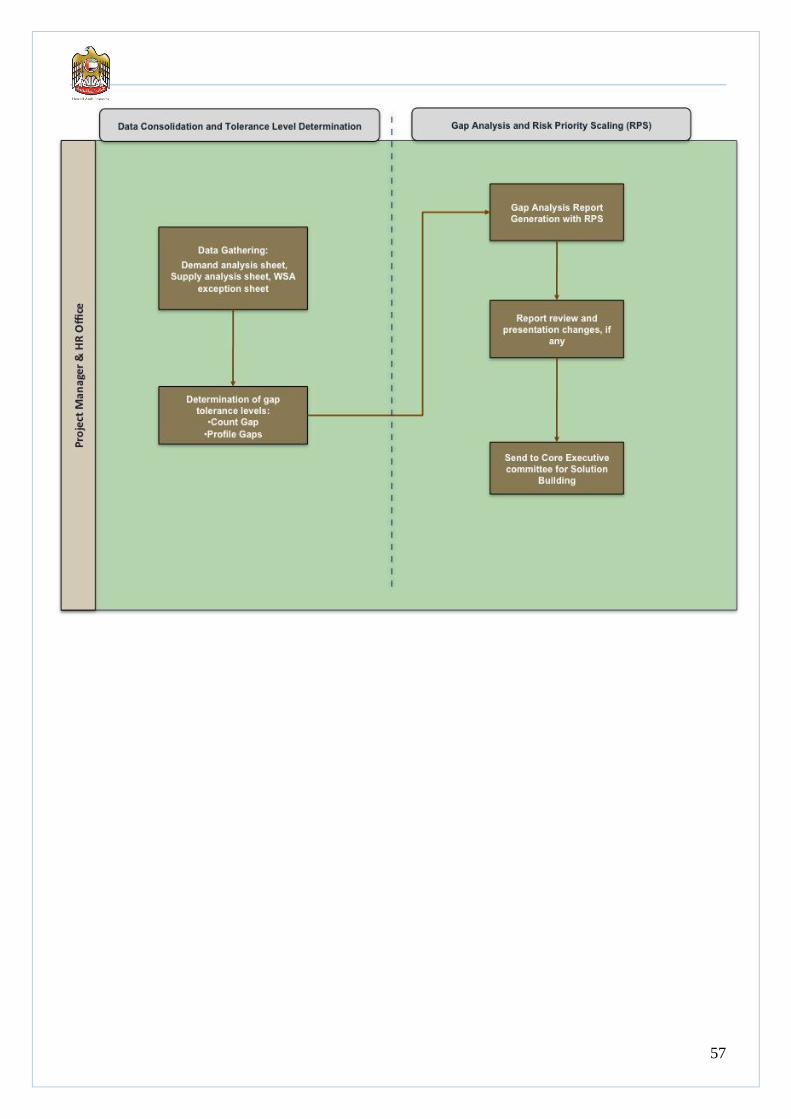
57

58