Strategic Sourcing: Current Trends in State Government Moderated by: Dianne Lancaster, OR Panelists:...
24
Strategic Sourcing: Strategic Sourcing: Current Trends in Current Trends in State Government State Government Moderated by: Dianne Lancaster, OR Moderated by: Dianne Lancaster, OR Panelists: Charles Covington, FL Panelists: Charles Covington, FL Paul Higgins, Paul Higgins, VA VA Mike Smith, IL Mike Smith, IL
-
Upload
gervais-tate -
Category
Documents
-
view
213 -
download
0
Transcript of Strategic Sourcing: Current Trends in State Government Moderated by: Dianne Lancaster, OR Panelists:...

Strategic Sourcing: Current Strategic Sourcing: Current Trends in State GovernmentTrends in State Government
Moderated by: Dianne Lancaster, ORModerated by: Dianne Lancaster, ORPanelists: Charles Covington, FLPanelists: Charles Covington, FL Paul Higgins, VAPaul Higgins, VA Mike Smith, ILMike Smith, IL

General Overview:General Overview:
What is it?
• Ask 10 different people, you’ll likely get 10 different Ask 10 different people, you’ll likely get 10 different answers!answers!
• The Merriam-Webster dictionary doesn’t even The Merriam-Webster dictionary doesn’t even have one. Instead they have words like have one. Instead they have words like stereochemistries and psuedotuberculosis!stereochemistries and psuedotuberculosis!

We like this definition:We like this definition:
Strategic SourcingStrategic Sourcing -- -- the the collaborativecollaborative and and structuredstructured process of critically analyzing an process of critically analyzing an organization’s spending and using this organization’s spending and using this information to make business decisions about information to make business decisions about acquiring commodities and services more acquiring commodities and services more effectively and efficiently effectively and efficiently (Federal Office of (Federal Office of Management and Budget)Management and Budget)

Broad Overview of the ProcessBroad Overview of the Process
1)1) Investigation:Investigation: Examine/collect data & establish baselinesExamine/collect data & establish baselines Define needsDefine needs Develop specs and sourcing strategyDevelop specs and sourcing strategy
2)2) Solicitation:Solicitation: Determine methodologyDetermine methodology Evaluate bidsEvaluate bids Contract negotiationContract negotiation Total cost of ownershipTotal cost of ownership Vendor selectionVendor selection
3)3) ImplementationImplementation Vendor management/contract administrationVendor management/contract administration Performance monitoringPerformance monitoring Change managementChange management

Florida Florida
MyFloridaMarketPlace-- eProcurement• 66,000 Registered Vendors• 21,000 Minority & Women Vendors• 194, 000 Annual Purchase Orders• $1.3 Billion Annual Spend• 32 Executive Agencies on the System
Florida One Initiative• Equity in Contracting• Environmental Considerations• Certification of Drug Free Workplace• RESPECT• PRIDE
75-State Term Contracts•Mandatory use by Executive Agencies•Optional use for all other government entities (OEU’s)•Eliminated over 100 State Term Contracts•Approved Cooperative Contract Sources
- WSCA- HIRE
- MMCAP- US Communities- Other
Spend Management• MFMP-Analysis Tool• State Accounting System• P-Card• Vendor Sales Information• User Data

Office ConsumablesOffice Consumables Maintenance Repair and Maintenance Repair and
Operating SuppliesOperating Supplies Wireless VoiceWireless Voice Communication Communication
backbone infrastructurebackbone infrastructure Dry-Cell and Dry-Cell and
Rechargeable BatteriesRechargeable Batteries Office PaperOffice Paper Gasoline & other fuelsGasoline & other fuels Medical & Dental Medical & Dental
SuppliesSupplies
Courier ServicesCourier Services Officer’s UniformsOfficer’s Uniforms Can LinersCan Liners Audio Visual EquipmentAudio Visual Equipment Pest Control ServicesPest Control Services Hand Held & Power ToolsHand Held & Power Tools EnvelopesEnvelopes Tissue and TowelsTissue and Towels Lawn CareLawn Care
$250MM in Contract Savings for Waves 1 and 2

Telephone System Telephone System EquipmentEquipment
Lab SuppliesLab Supplies Security ServicesSecurity Services Janitorial ServicesJanitorial Services
Mail EquipmentMail Equipment Office EquipmentOffice Equipment Maintenance ServicesMaintenance Services Metal Detection and Metal Detection and
Scanning EquipmentScanning Equipment
Potential Strategic Sourcing Events for Wave 3

VirginiaVirginiaProcurement ScopeProcurement Scope
State Government
171 Agencies/Institutions of Higher Education
Central oversight of state contracts
Variety of systems, including 44 Enterprise Resource Planning (Financial) Systems
Approximately $5 billion annual spend
Local Government
350+ Cities, Counties & Towns
Plus Public Schools, Airports, Districts, Authorities and Commissions
Use state contracts
Variety of systems
Approximately $5 billion annual spend
Vendors
20-30,000 for state government
Mix of local vendors versus statewide vendors
20% get 80% of the orders (Approximately 6,000)
Virginia equals a Fortune 300 Corporation

Profile Spend & Baseline
Facilities
General Equipment & Consumables
Industrial Equipment & Supplies
Materials
Technology
Industrial Services
Logistics
Personnel Services
Professional Services
Utilities
Furniture & FurnishingsOffice EquipmentOffice Supplies
Packaging & Storage Materials(Containers, Corrugated, Pallets, Tape)Paper, Stationery
Building MaintenanceEnvironmental ServicesEquipment MaintenanceIndustrial Cleaning Services Infrastructure SupportSecurity Guard ServicesWaste Disposal Services
BenefitsContract LaborDomestic ServicesRelocationTemporary StaffingTrainingTravel & Entertainment
ElectricityTelecommunicationsUtility Billing Services
AccountingAdvertising & MarketingCommercial PrintComputer ServicesFleet ManagementInsuranceIT ConsultingLegalReal Estate
Cargo Transport (Air, Rail & Road)Courier/MessengerExpress DeliveryPostageWarehousing & Storage
HardwareSoftwareTelecom Equipment
Janitorial SuppliesMRO SuppliesSafety Equipment & SuppliesSecurity EquipmentSpare PartsVehicle Parts and Accessories
Building MaterialsHVACLighting, Fixtures & AccessoriesPipes, Valves & Fittings
Goods
Services
Area Category

Savings Results
$150 Million in Contract Savings Created
Selected Target Categories and Percent Savings
• Computer Hardware 12%• Janitorial Supplies 11%• Lab Supplies 13%• Office Supplies & Paper 18%• Computer Software 8%• Off-Road Equipment 6% • Enterprise Storage Devices 15%
• Temporary Services 32%• Uniforms 17%• Hotels 31%• Heavy Trucks 20%• Storage Media 30%• School Buses 3%• Printers and Accessories 15%• Maintenance, Repair, and Operating Supplies (MRO) 13%
Ultimately saved over $150M in 2 separate “waves” of strategic sourcing
Leveraged purchases across 200+ state agencies, institutions of higher education and other public entities

IllinoisIllinois
OrganizationOrganizationChief Procurement OfficersChief Procurement Officers
Dept. of Transportation – Highway ConstructionDept. of Transportation – Highway Construction Capital Development Board – Capital ProjectsCapital Development Board – Capital Projects Higher Education Higher Education Supplies and ServicesSupplies and Services
Authority/ApplicabilityAuthority/ApplicabilityIllinois Procurement CodeIllinois Procurement Code All state agencies, boards and All state agencies, boards and
commissionscommissions Competitive selection on all Competitive selection on all
procurements with few exceptionsprocurements with few exceptions Preferences for small businessPreferences for small business Goals for diversified businessesGoals for diversified businesses Agencies required to use master Agencies required to use master
contractscontracts Contracts available to local Contracts available to local
governments -- Joint Purchasing governments -- Joint Purchasing Program Program
Central Management ServicesCentral Management Services Center-leads all Supplies and Services Center-leads all Supplies and Services
procurementsprocurements• Manages Illinois Procurement BulletinManages Illinois Procurement Bulletin Created comprehensive Knowledge Management Created comprehensive Knowledge Management
system -- an electronic reference library and system -- an electronic reference library and communications systemcommunications system
Provides access and contracting opportunities for all Provides access and contracting opportunities for all vendorsvendors
TransparencyTransparency Accountability Accountability Cost SavingsCost Savings
$17 billion in procurable spend$17 billion in procurable spend

ILLINOIS PROCUREMENT INITIATIVE ILLINOIS PROCUREMENT INITIATIVE STRATEGIC SOURCINGSTRATEGIC SOURCINGAugust 2003 - PresentAugust 2003 - Present
Goals Save $200+ million in two years Organizational transformation Standardize/streamline processes Improve transparency and increase vendor participation Build capabilities/knowledge management system
Results:Results: 27 projects -- $216 million of Validated Savings 27 projects -- $216 million of Validated Savings
Examples ----
Project Strategy SavingsFood Product substitution, bulk purchasing, $6.3 million
elimination of unnecessary items
Can Liners Change in specifications, renegotiation $737,000
Cleaning Supplies Combined multiple contracts, extended term $182,000
PC’s/Laptops/Monitors Demand management $1.8 million
Emissions Testing Renegotiation $10.2 million
Utilities/Electricity Changed rate plans to best suit state facilities $3.0 millionconsumption patterns.
Paper and Envelopes Combined multiple contracts, extended term $715,000
Family Case Mgmnt Enhanced federal reimbursement $24.2 million

ILLINOISILLINOIS
PROCUREMENT INITIATIVE ACCOMPLISHMENTSPROCUREMENT INITIATIVE ACCOMPLISHMENTS
$216 million in validated savings
Created new center-led organization to better manage procurements statewide and identify sourcing opportunities
Implemented 5-step procurement approach
Streamlined processes – eliminated unnecessary and/or redundant steps
Implemented procurement business case system to ensure all purchases are justified and to identify opportunities for savings
Implemented a toll-free call center to assist agencies and vendors – ensures consistent responses and that caller gets to appropriate person
Created comprehensive Knowledge Management system -- an electronic
reference library and communications system Greatly improved transparency into the process – more detailed publications of
procurement notices, supplier workshops, enhanced documentation of how decisions are made, published procurement opportunity reports
Increased opportunities for small and diverse businesses

Oregon Smart Buy ProjectOregon Smart Buy Project

CATEGORIZING PURCHASED EXPENSEFiscal Year 2003 Spending$ Billions
0.301.35
0.27
$1.05
$1.62
Total Total Purchased Purchased ExpensesExpenses
Non-Non-AddressableAddressable
PotentiallyPotentiallyAddressable Addressable Purchased Purchased ExpensesExpenses
EvaluatedEvaluatedIn-DepthIn-Depth
Potentially Potentially Addressable Addressable
in Future in Future WavesWaves
• Government Services• Interest
How Opportunities Were IdentifiedHow Opportunities Were IdentifiedState Spending OverviewState Spending Overview
To facilitate identification of high-savings opportunities, the team created a consolidated picture To facilitate identification of high-savings opportunities, the team created a consolidated picture of the State's spending, classifying spending into common expense categories, and conducting of the State's spending, classifying spending into common expense categories, and conducting a “deep dive” diagnostic into a large number of spending categories.a “deep dive” diagnostic into a large number of spending categories.
• The State purchased $1.62 billion of goods and services from vendors in fiscal year 2003, $1.35 billion of which is on purchases that are potentially “source-able”
• The initial Opportunity Assessment (conducted in October-December 2003) evaluated spending in the largest spending categories where there was significant cross-agency leverage – 65% of the State’s spending is with vendors who serve only one agency
Note: Purchased expenses exclude interagency transfersSource: State financial systems (SFMA, ODOT, Lottery; Corrections, p-card); Silver Oak Solutions analysis
KEY OBSERVATIONS

Potential Wave 2Potential Wave 2
• Smaller, but still sufficient baseline to Smaller, but still sufficient baseline to warrant detailed spend reviewwarrant detailed spend review
• Significant savings percent range Significant savings percent range based on benchmarking or historical based on benchmarking or historical savings experiencesavings experience
• Support from key stakeholders or no Support from key stakeholders or no anticipated push backanticipated push back
• Can be agency-specific categories Can be agency-specific categories without cross-agency leverage, as long without cross-agency leverage, as long as above 3 criteria are satisfiedas above 3 criteria are satisfied
Wave 1Wave 1
• Sufficient baseline to warrant Sufficient baseline to warrant detailed spend reviewdetailed spend review
• Historic savings experience in Historic savings experience in categorycategory
• Cross-agency leverageCross-agency leverage• Positive results from benchmarking Positive results from benchmarking
and market analysisand market analysis• Medium to High ease of captureMedium to High ease of capture
PRIMARY SELECTION CRITERIA
Category Selection Criteria
By evaluating top-spending areas with joint leverage opportunities in a number of areas, two waves of spending categories were identified.
SCREENING MATRIX
• Wave 1 CategoriesWave 1 Categories
Potential Wave 2 CategoriesPotential Wave 2 Categories
Savings Opportunity
High
Low
Low Ease of Capture High
• PC Hardware/Peripherals
• ITPS• Office Supplies
• TCPERS• Telecom LD/Data
• Express Mail• Tires • Telecom Cellular
• Copiers• Software
Lab Supplies
Hot Mix Food
Janitorial Supplies
Blade Server/Mainframes
Postage Meters
Emulsions

HARD DOLLAR IMPACT 1 BREAKDOWN By Completed Category$ Thousands
CategoryCategoryAnnual Annual SpendSpend
ROBROBImpactImpact
Annual Run-Annual Run-Rate ImpactRate Impact
Contract Contract Length Length ImpactImpact22 % Impact% Impact33
PC HardwarePC Hardware $12,318$12,318 $4,151$4,151 $3,036$3,036
$16,396$16,396
25%25%
Office SuppliesOffice Supplies 11,106 11,106 3,634 3,634 2,994 2,994
14,403 14,403
27%27%
Telecom CPE & Related ServicesTelecom CPE & Related Services 7,8267,826 738738 1,2671,267
7,5197,519
16%16%
Telecom LDTelecom LD 2,4792,479 670670 690690
2,0772,077
28%28%
PC PeripheralsPC Peripherals 3,6633,663 579579 682682 3,4223,422 19%19%
Telecom CellularTelecom Cellular 1,7581,758 148148 133133 272272 8%8%
Express MailExpress Mail 1,3971,397 140140 140140 376376 10%10%
CopiersCopiers 3,0393,039 122122 152152 2,9982,998 5%5%
SoftwareSoftware 5,2765,276 3535 3838 198198 3%3%
TotalTotal $48,861 $10,215 $9,132 $47,597 18%
Identified hard dollar impact is projected to be $9.1 million per year (or 18% of baseline spend) and will accrue to the State over many years.
1 Includes spend reduction savings, rebates and increase in VCAF (Vendor Collected Administrative Fee), due to fee increase in some Smart Buy price agreements2 Contracts vary in length by category from 2 – 6 years, and savings are expected to accrue over the lives of these contracts3 Defined as (Annual Run-Rate Savings/Annual Spend)4 Information gathered as of February 2, 2005

The type of savings vary by commodity spending category.The type of savings vary by commodity spending category.
SOURCES OF SAVINGS AND SERVICE IMPROVEMENTSBy Category
CategoryCategory
Source of SavingsSource of Savings
CommentsComments
Lower Lower Negotiated Negotiated
PricingPricing
Right-Right-Spec’ing Spec’ing (Demand (Demand
Management)Management)
Best-in-Best-in-Class Class
Buying Buying PracticesPractices
Office Supplies & PaperOffice Supplies & Paper • In addition to lower negotiated pricing, significant In addition to lower negotiated pricing, significant incremental savings can be obtained through adoption of incremental savings can be obtained through adoption of essential items list and best-in-class buying practicesessential items list and best-in-class buying practices
PC HardwarePC Hardware • In addition to lower negotiated pricing, significant In addition to lower negotiated pricing, significant incremental savings can be obtained through adoption of incremental savings can be obtained through adoption of standard configurationsstandard configurations
• Additional savings possible through quarterly bulk-buysAdditional savings possible through quarterly bulk-buys
PC PeripheralsPC Peripherals
• Created new peripherals contract where one did not existCreated new peripherals contract where one did not exist
Telecom Customer Premise Telecom Customer Premise Equipment and Related Equipment and Related ServicesServices
• Competitive solicitation created savings with incumbent Competitive solicitation created savings with incumbent vendorvendor
Long-Distance TelecomLong-Distance Telecom
• Competitive solicitation created savings with incumbent Competitive solicitation created savings with incumbent vendorvendor
Express MailExpress Mail
• Incumbent negotiations resulted in lower pricingIncumbent negotiations resulted in lower pricing
Cellular Phones and ServicesCellular Phones and Services
• Savings through migration to optimal price plans that Savings through migration to optimal price plans that minimize cost based on observed usageminimize cost based on observed usage
CopiersCopiers
• Savings through adoption of 48-month rental terms and Savings through adoption of 48-month rental terms and copier specifications that meet, but not exceed, actual copier specifications that meet, but not exceed, actual needsneeds
SoftwareSoftware
• Incumbent negotiations resulted in lower pricingIncumbent negotiations resulted in lower pricing
Telecom DataTelecom Data • Short-term savings identified but not recommendedShort-term savings identified but not recommended• Larger Wave 2 savings approach identifiedLarger Wave 2 savings approach identified

Impact on the Vendor Impact on the Vendor CommunityCommunity
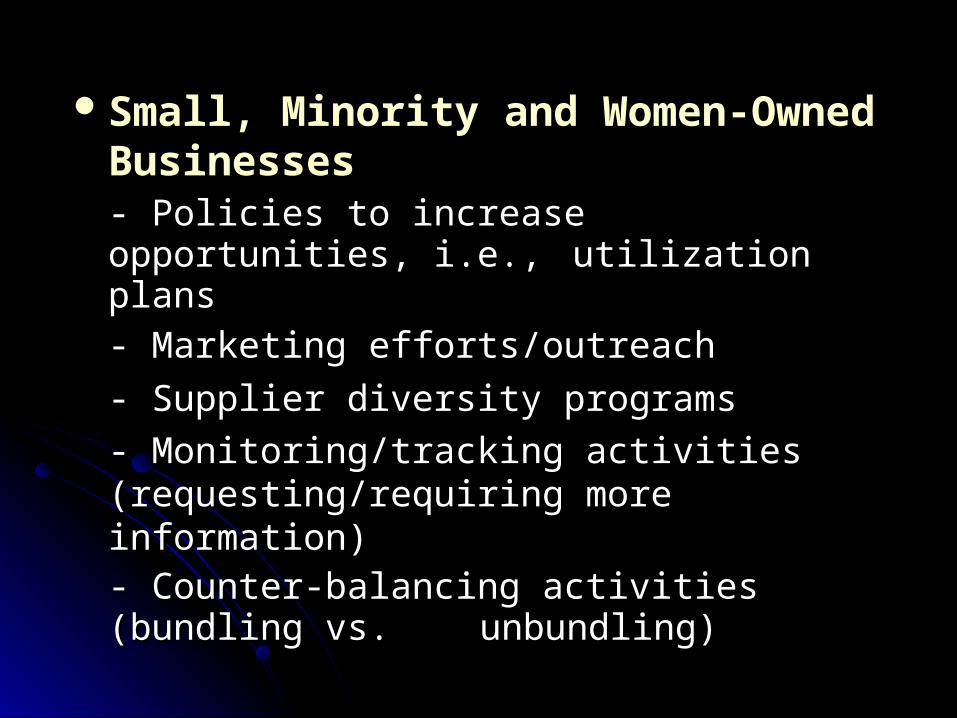
Small, Minority and Women-Owned Small, Minority and Women-Owned BusinessesBusinesses
- Policies to increase opportunities, i.e., - Policies to increase opportunities, i.e., utilization plansutilization plans
- Marketing efforts/outreach- Marketing efforts/outreach
- Supplier diversity programs- Supplier diversity programs
- Monitoring/tracking activities - Monitoring/tracking activities (requesting/requiring more information)(requesting/requiring more information)
- Counter-balancing activities (bundling - Counter-balancing activities (bundling vs. vs. unbundling)unbundling)

Different from “Business as Usual”Different from “Business as Usual”
- Reduction in the Number of Overall Awards
- Best value vs. best price
- Changes in the RFP process, i.e., reverse auction
- Total cost of ownership
- More purchasing options, i.e., lease vs. buy
- Data-driving decision making
- More RFP’s and multi-step bids
- Understanding of the industry—contract staff has increased knowledge of supply chains & costs
- Uniform Price Card
- Length of Contracts
- Performance Management: Data driven vendor performance, i.e., automated and electronic tracking systems
- Improving Relationships with Suppliers: More communication, face-to-face meetings (quarterly review sessions)

Commodities/Categories of Commodities/Categories of ItemsItems
Popular items that have already been sourced:Popular items that have already been sourced: Office supplies/equipmentOffice supplies/equipment Cleaning/janitorial suppliesCleaning/janitorial supplies CopiersCopiers IT hardware/software/servicesIT hardware/software/services FoodFood Telecom servicesTelecom services Mail servicesMail services HMO/Hospital rate negotiationsHMO/Hospital rate negotiations

Commodities/Categories of Commodities/Categories of ItemsItems
What is planned for the future?What is planned for the future?Commercial servicesCommercial servicesUtilitiesUtilitiesLease vs. purchases—equipment & facility Lease vs. purchases—equipment & facility
spacespaceProfessional servicesProfessional services

Questions?Questions?