Strategic Report for Goldman Sachs Group, Inc
38
Strategic Report for Goldman Sachs Group, Inc. Tom Church Meredyth Lacy Cameron Taylor April 22, 2009
Transcript of Strategic Report for Goldman Sachs Group, Inc

Strategic Report for Goldman Sachs Group, Inc.
Tom Church
Meredyth Lacy Cameron Taylor
April 22, 2009
Goldman Sachs Group, Inc.
April 22, 2009 Page 2
Table of Contents EXECUTIVE SUMMARY .......................................................................................................................... 3 COMPANY OVERVIEW............................................................................................................................ 4
COMPANY HISTORY.................................................................................................................................... 4 BUSINESS OVERVIEW ................................................................................................................................. 8
Investment Banking............................................................................................................................... 8 Trading and Principal Investments....................................................................................................... 8 Asset Management and Securities Services .......................................................................................... 9
COMPETITIVE ANALYSIS .................................................................................................................... 10 RIVALRY .................................................................................................................................................. 10
Investment Banking............................................................................................................................. 10 Trading and Principal Investments..................................................................................................... 10 Asset Management and Securities Services ........................................................................................ 10
BUYER POWER.......................................................................................................................................... 11 SUPPLIER POWER ...................................................................................................................................... 11 BARRIERS TO ENTRY ................................................................................................................................ 12
Investment Banking............................................................................................................................. 12 Trading and Principal Investments..................................................................................................... 12 Asset Management and Securities Services ........................................................................................ 13
SUBSTITUTES............................................................................................................................................ 13 Investment Banking............................................................................................................................. 13 Trading and Principal Investments..................................................................................................... 14 Asset Management and Securities Services ........................................................................................ 14
COMPLEMENTS......................................................................................................................................... 14 SWOT.......................................................................................................................................................... 15
STRENGTHS .............................................................................................................................................. 15 WEAKNESSES ........................................................................................................................................... 18 OPPORTUNITIES ........................................................................................................................................ 18 THREATS .................................................................................................................................................. 19
FINANCIAL ANALYSIS .......................................................................................................................... 20 OVERVIEW................................................................................................................................................ 20 PROFITABILITY AND GROWTH .................................................................................................................. 21 SOLVENCY................................................................................................................................................ 22 LIQUIDITY ................................................................................................................................................ 25
STRATEGIC RECOMMENDATIONS................................................................................................... 26 LEVERAGE................................................................................................................................................ 26 REGULATION ............................................................................................................................................ 28
Troubled Asset Relief Program - TARP.............................................................................................. 28 Term Asset-Backed Securities Loan Facility - TALF.......................................................................... 28 Temporary Liquidity Guarantee Program – TLGP ............................................................................ 28
COMPENSATION........................................................................................................................................ 30 POTENTIAL FOR GROWTH......................................................................................................................... 33
Brazil – Banco Pactual ....................................................................................................................... 33 Eastern Europe – UniCredit Group.................................................................................................... 34
ENDNOTES................................................................................................................................................ 37

Goldman Sachs Group, Inc.
April 22, 2009 Page 3
Executive Summary Goldman Sachs Group, Inc. (“GS,” “Goldman Sachs,” “Goldman,” or “the firm”) is
arguably the world’s leading financial services institution. The firm has best-in-class
operations in its investment banking, trading and principal investments, and asset
management and securities services divisions. The current financial crisis has created a
difficult environment for all investment banks, including Goldman Sachs, whose profitability
slumped in fiscal year 2008 before rebounding in Q1 2009. Despite the crisis, however, the
firm has continued to outperform its peers, further validating its reputation for superior risk
management. Goldman’s relative success notwithstanding, the investment banking industry
is undergoing a period of deep self-evaluation, and structural fundamental shifts may be
underway. Questions raised include:
• Leverage: Macroeconomic headwinds and investor uncertainty have necessitated rapid
deleveraging across the industry, which raises broad questions about the sustainable future
level of leverage for investment banks.
• Regulatory reform: Government capital injections into large financial institutions are
accompanied by the prospect of extensive regulatory reform. Public fury over financial
institutions deemed “too big to fail” is at a fever pitch. For systemically important
institutions, the government may make specific demands. More generally, legislative and
regulatory changes may undermine the current business models of the largest investment
banks.
• Compensation: Mainstream opinion has accepted that compensation at least partially
caused the type of risk-taking that led to the financial crisis. The question now becomes
whether public firms will be allowed to make their own reforms or if the government will
legislate compensation change. At stake is the very human capital which makes the large
investment banks valuable.
• Competitive landscape: The elimination of weaker firms has left a vacuum. The
business model of the large investment banks will compete with the boutique model over
that market share.
Goldman is better-positioned to weather the storm than most or all of its peers. The firm
must decide where aggression is appropriate and where caution is the optimal strategy.

Goldman Sachs Group, Inc.
April 22, 2009 Page 4
Company Overview
Company History The long history of Goldman Sachs Group dates back to 1869, when German immigrant
Marcus Goldman moved to New York and began buying customers' promissory notes from
jewelers to resell to banks for a profit. Goldman's son-in-law, Samuel Sachs, joined the
business in 1882, followed by Goldman's son Henry and son-in-law Ludwig Dreyfus in
1885. That year, the firm became a general partnership as Goldman, Sachs & Co.
In 1887, Goldman Sachs formed a relationship with the British merchant bank Kleinwort
Sons and began offering US-UK foreign exchange and currency services. Having
established a presence in the northeast, the firm expanded its operations to Chicago and St.
Louis to serve such clients as Sears, Roebuck and Co.
In 1896, soon after Samuel Sachs's brother Harry joined the company, Goldman Sachs
joined the New York Stock Exchange. The next few years brought the steady expansion of
the firm’s operations, and by the turn of the century, the company had built the commercial
paper market into a major source of short-term capital.
Goldman experienced a milestone in its history in 1906 when the firm co-managed its first
initial public offering. That year, Goldman helped United Cigar Manufacturers expand by
underwriting $4.5 million worth of United Cigar stock. Goldman Sachs next co-managed
Sears Roebuck's IPO. Following the successful IPOs of the two companies, Henry
Goldman was invited to join the boards of directors of both United Cigar and Sears. The
practice of negotiating a seat on the boards of major clients continues today.
Although World War I slowed down financial activity until 1919, its aftermath brought
strong economic expansion. Many of Goldman’s clients, namely H.J. Heinz, Pillsbury, and
General Foods, returned to the company for additional financing, and Goldman continued
to grow into the 1920s.

Goldman Sachs Group, Inc.
April 22, 2009 Page 5
In 1928, the firm formed an investment subsidiary called the Goldman Sachs Trading
Corporation to operate a closed-end fun. With an initial $10 million capitalization, the new
company expanded rapidly. However, the stock market crash of 1929 dealt Goldman Sachs
Trading a devastating blow, and by 1933, it was worth only a fraction of its initial value. The
failure tarnished Goldman’s reputation for years to come.
In the 1930s, Goldman Sachs ventured into the securities business and continued to expand
by taking over other commercial-paper firms in New York, Boston, Chicago, and St. Louis.
Although World War II diverted attention and capital away from Goldman’s activities, the
company regained its prewar momentum several years after the war ended. As the economy
experienced unprecedented growth, Goldman launched many new activities in finance and
investment and emerged as a leader in investment banking.
In 1956, Goldman co-managed Ford's IPO. In doing so, the company helped market 10.2
million shares, worth $700 million. The firm set another record in October 1967, when it
handled the floor trade of a single block of Alcan Aluminum stock consisting of 1.15 million
shares, worth $26.5 million, at the time the largest block trade ever made.
During the 1970s, the firm expanded in several ways. In addition to opening its first
international office in London in 1970, it created a private wealth division and a fixed
income division in 1972.
Another milestone for the company came in 1981 when Goldman Sachs purchased J. Aron
& Company, a commodities-trading firm which dealt in precious metals, coffee, and foreign
exchange. The purchase helped Goldman establish a presence in the commodities industry
and in South America.
In 1982, Goldman took over the London-based merchant bank First Dallas, Ltd., which it
later renamed Goldman Sachs, Ltd.
Beginning in 1984, a new craze erupted on Wall Street in which investment companies
engineered leveraged buyouts (LBOs) of entire firms. Although the risky practice could

Goldman Sachs Group, Inc.
April 22, 2009 Page 6
generate sizable profits, Goldman Sachs chose to stress its transaction work instead of the
higher risk LBOs. However, the market crash of October 1987 reduced the profitability of
transaction work, and Goldman Sachs began to lose clients to more aggressive investment
firms. The company was forced to cut costs, and several hundred employees would be laid
off through the end of the decade.
In 1986, the firm formed Goldman Sachs Asset Management, which manages the majority
of its mutual funds and hedge funds today. That year the company also underwrote the the
IPO of Microsoft, advised General Electric on its acquisition of RCA, and joined the
London and Tokyo stock exchanges.
After suffering heavy losses from the 1986 market crash, Goldman Sachs raised more than
$500 million from Sumitomo Mitsui Financial Group (SMFG). Although Sumitomo was
entitled to 12.5 percent of Goldman’s profits, the newer partners would be prevented by
federal law from having voting rights within the firm. Goldman Sachs would continue to
accept such equity investments into the next decade.
The early 1990s were years of strong growth and record earnings for Goldman Sachs. By
1993, the company had become one of the most profitable in the world, with pre-tax
earnings of $2.7 billion. However, the company was dealt a major setback in 1993, however,
when a federal appeals court ruled that an investment banking firm could no longer advise a
company in bankruptcy proceedings with whom it had a business relationship. This decision
brought an end to a lucrative business practice for Goldman, which brought in more than
$100 million a year in such transactions.
The crash in the market price of Treasury and other bonds in 1994 and the drop of the U.S.
dollar in foreign markets also put financial strain on the company. Goldman was forced to
cut costs through a wave of layoffs. However, a bull market helped Goldman rebound, and
by the late nineties, the company focused on enhancing its international presence,
particularly in the UK and Asia.

Goldman Sachs Group, Inc.
April 22, 2009 Page 7
A landmark event came in 1999, when Goldman Sachs launched one of the largest financial
services IPOs in U.S. history. The company listed on the New York Stock Exchange and
raised $3.6 billion by selling off just under 12.5 percent of the company. It adopted the name
The Goldman Sachs Group Inc. and named Henry Paulson, Jr., chairman and CEO.
In 1999 Goldman acquired Hull Trading Company, one of the world's premier market-
making firms, for $531 million. It purchased Spear, Leeds, & Kellogg, one of the largest
specialist firms on the New York Stock Exchange, for $6.3 billion the next year. Although
earnings were healthy through 2000, the September 11th terrorist attacks weakened market
conditions.
Nonetheless, Goldman stood as the leading advisor in merger activity in 2001and was
involved in eight out of the ten largest deals completed that year. When IPO and merger
activity slowed substantially in 2002, Goldman Sachs faced one of its most challenging years.
To combat rumors that Goldman might be forced into a merger, Paulson insisted that
Goldman Sachs would thrive on its own and laid out the company's strategy in a 2002
Business Week article.1
More recently, 2008 brought some of the most dramatic changes in Goldman’s history and
the history of Wall Street. In the midst of the financial crisis in September 2008, Goldman
Sachs and Morgan Stanley received Federal Reserve approval to transition from an
investment bank to a bank holding company. The change placed the banks under the
supervision the bank regulators and gave them easier access to credit to help them ride out
the financial crisis.2
Goldman Sachs initially received help from Warren Buffett's Berkshire Hathaway, in the
form of $5 billion of preferred shares and warrants for another $5 billion of common stock.3
Then the firm accept $10 billion dollars from the governments Troubled Asset Relief
Program. Within the last few months, the firm has issued $25 billion of bonds guaranteed
by the FDIC through the Temporary Liquidity Guarantee Program. Also, specifically in
order to ramp up the pressure on the government to allow Goldman to repay its TARP
money, Goldman issued $5 billion in equity.

Goldman Sachs Group, Inc.
April 22, 2009 Page 8
Business Overview Goldman Sachs Group, Inc. is a bank holding company that specializes in investment
banking, trading and principal investments, and asset management and securities transaction
services. Headquartered in New York City, the company primarily operates in the U.S.,
Europe, and Asia and has offices in financial centers throughout the world. Long
considered one of the most prestigious investment banks, Goldman boasts such notable
alumni as Henry H. Fowler, Robert Rubin, and Henry Paulson, all former secretaries of the
United States Treasury. Although Goldman has some government and high-net-worth
individual clients, the firm sets itself apart by focusing almost exclusively on institutional
clients. As of Q1 2009, Goldman employed 27,898 people, with a market capitalization of
approximately $55 billion.4
Investment Banking • Financial advisory: Advises corporate clients on activities including M&A, divestitures,
corporate defense, restructurings, and spin-offs.
• Underwriting: Underwrites a wide range of securities and places them with investors.
Offerings include common stock, preferred stock, convertible and exchangeable securities,
investment-grade debt, high-yield debt, sovereign and emerging market debt, bank loans,
asset-backed securities and real estate-related securities.
Trading and Principal Investments • Fixed income, currency and commodities (FICC): Trades and makes markets for
commodities, credit products, currencies, interest rate products, money market
instruments, real estate-related securities and loans, in addition to other asset-backed
securities. Special situations groups focus on capital structure arbitrage, non-performing
loans, and illiquid assets.
• Equities: Provides investment research, portfolio recommendations and hedging, client
order execution, structuring derivatives trades, and market-making in equities, preferreds,
and structured products.

Goldman Sachs Group, Inc.
April 22, 2009 Page 9
• Principal investments: Operates in-house hedge funds and private equity funds,
trading on the firm’s behalf.
Asset Management and Securities Services • Asset management: Offers investment advisory and financial planning. Investment
offerings include money markets, fixed income, equities, mutual funds, alternative
investment funds, and merchant banking funds.
• Securities services: Provides prime brokerage, financing, and securities lending for
institutional clients and high-net-worth individuals.
Trading and Principal Investments 61%
Investment Banking 18%
Asset Management and Securities Services 21%
Net Revenue Breakdown by Segment, 2006-2008
Goldman’s business model focuses on leveraging its elite brand to lure top employee talent,
which allows the firm to provide the most value-added services for clients. Holding on to
key employees is fundamental to the firm’s success, and so it is imperative for compensation
(whether financial or other) be very competitive. In practice, a great deal of the value of
working for a firm like Goldman comes from the connections its employees develop during
their tenure. Those relationships with influential clients can lead to very lucrative post-
Goldman employment opportunities, and this possibility is a nontrivial component of
Goldman’s compensation scheme, whether explicit or implicit. Another key to Goldman’s
model is its relative lack of direct exposure to the consumer. Unlike giant competitors such
Goldman Sachs Group, Inc.
April 22, 2009 Page 10
as Citigroup, JPMorgan Chase, and Bank of America, Goldman does not rely on deposits
and credit cards. This is an especially salient fact during the current downturn, which is
likely to get even worse for consumers going forward as unemployment rises.
Competitive Analysis
Rivalry
Investment Banking Even in the wake of the current financial crisis, there will still be a large number of
investment banks, both in the US and globally. As mentioned previously, brand
differentiation does exist and helps, at the margin, to maintain a client base. However, even
the most stable clients work regularly with several investment banks, and so competition is
everywhere an issue. The legitimate hope to increase market share in the wake of bankrupt
competitors does not change this fact.
Trading and Principal Investments There are many competitors in the sales and trading space as well, and they run the gamut of
quality. However, there is legitimate product differentiation between the proprietary trading
systems at large banks.
Asset Management and Securities Services Similar to the sales and trading operations, there are many competitors and companies use
technological product differentiation as a buffer. An important difference in the asset
management business is the fact that once a high net worth individual opens an account with
Goldman’s asset managers, there are practical and economic switching costs to deal with.

Goldman Sachs Group, Inc.
April 22, 2009 Page 11
Buyer power Across all three segments of the firm, buyer power is similar. There are an extremely large
number of customers for most financial services firms, but there are also many financial
institutions. The size of the pools of supply and demand balance out and there is relatively
little asymmetrical buyer power. Investment banking advisory work can be done for dozens
of corporations in any industry in any country. Sales and trading activities can be performed
for numberless pension funds, endowments, and other institutional investors. Many of
Goldman’s businesses are also human relationships based around trust, which creates small-
scale switching costs.
Supplier power The major suppliers for most financial services firms are their employees. Even in this
financial crisis, there is still an overabundance of college graduates seeking employment
somewhere within the investment banking industry. There has been a great deal of talk in
the press about how the “best and the brightest” are now looking to other careers after
graduation, but few articles acknowledge that this is largely because bank hiring plummeted
this year. Graduates considered other jobs as much out of necessity as out of disgust a lack
of interest in investment banking. Thus, even though there are a wide variety of firms that
compete over any individual potential employee, the excess supply of talented applicants still
tilts the equation in favor of the banks, including Goldman Sachs.
Other suppliers include IT support functions, which can be either outsourced or internal to
a bank’s operations. Regardless, there are many competitors to choose from to provide this
function, decreasing their supplier power.
Research tool providers such as Bloomberg have a great deal of power because there are few
substitutes. Competitors such as Reuters are trying to enter that business, but at least up
until this point, banks basically have to accept whatever prices Bloomberg decides to charge.
Finally, colleges and business schools, to the extent that they influence the pipeline of
potential future employees for investment banks, have some supplier power. However,

Goldman Sachs Group, Inc.
April 22, 2009 Page 12
there are too many of them to exert much control. Through coordinated efforts, they can
achieve some concessions, such as widespread reductions in so-called “exploding offers”1.
Barriers to Entry
Investment Banking Starting an investment banking business is extremely simple. All that is required is human
capital, a little office space, and a few computers with Microsoft Excel and Powerpoint. It is
not infrequent for top dealmakers at large firms to split off to start their own boutique
investment banking advisory firms, pulling with them other employees from the large firm.
This is certainly an issue for Goldman Sachs because its investment banking relationships are
ultimately individual relationships with specific dealmakers. Defection to start a new firm is
a serious potential threat for any investment bank.
The top investment banking firms heavily brand their franchises and use prestige to promote
their products. Thus, intuitively, it would make sense for it would be difficult for new
entrants to break into the market. However, the media helps brand investment banks by
writing articles about top dealmakers. Thus, in a sense, these dealmakers may already have a
brand before they leave to start their own firm.
Traditional investment banking advisory and underwriting work does not require capital. It
is simply a service provided for a fee. Thus, it is relatively less risky than many other
segments within the financial services industry. It also contributes to low barriers to entry.
Some capital is required for underwriting if the firm plans to hold any of the risk themselves
at any point, so the barriers to entry may be slightly higher for that part of the business.
Trading and Principal Investments Barriers to entry for trading and principal investments segment of the firm are higher than
for the investment banking segment because it requires risking firm capital. Even in simple
1 An “exploding offer” is a job offer that must be accepted on the spot or it will be given to someone else.
Goldman Sachs Group, Inc.
April 22, 2009 Page 13
market-making, the firm cannot avoid putting up its own capital to take temporary risks on
its balance sheet. Furthermore, in its proprietary trading unit, that is specifically the goal.
Thus, in order for a new company to enter the sales and trading segment would require a
substantial amount of capital.
Additionally, a trading operation requires significant technological investments. There may
need to be some sort of proprietary trading software developed if the firm is to have any
competitive advantage. At the very least, a firm will need many computers and costly
Bloomberg subscriptions.
Asset Management and Securities Services In the asset management and securities services segment, the firm is investing for clients, so
it doesn’t require capital. However, similar issues will exist with relation to technology and
research tools. Thus, it would not be terribly difficult for an asset manager at a major firm to
walk away with his book of clients, provided he could organize enough capital to provide for
the infrastructure necessary to manage the money.
Substitutes
Investment Banking So long as mergers and acquisitions exist, or firms need debt or equity financing in order to
operate, there cannot truly be a substitute for investment banking advisory or underwriting.
Surely, the business can and is changing as times change. But companies will still seek expert
advice on mergers and acquisitions, and they will still need help in coordinating issuance of
debt, equity, or other securities with potential investors. Internal M&A groups within
corporations that are highly active in the M&A markets may decrease those firms’ need for
investment banking advice. But there will at least still be many firms who infrequently
acquire or merge and need expert advice on those occasions.

Goldman Sachs Group, Inc.
April 22, 2009 Page 14
Trading and Principal Investments Access to electronic trading platforms may reduce customers’ need for Goldman to act as a
market-maker. But institutional investors will still have a need for customized prime
brokerage service to meet their needs.
As far as Goldman’s proprietary trading operations goes, they could theoretically invest that
money through outside hedge funds and private equity firms, but that would drastically
reduce their ability to monitor their own risk. In light of recent issues with risk management
within the financial services industry, this substitution is unlikely.
Asset Management and Securities Services For asset management, high net worth investors could invest their own money directly. If
they are wealthy enough, it may make sense for them to invest directly in hedge funds or
private equity funds. However, it will usually be more convenient for them to outsource the
monitoring of these investments. If there are any true substitutes for this service, they are
essentially commodities offered by retail brokerage firms.
Complements The complements for the investment banking industry are usually all offered under one roof.
Investment bankers underwrite securities, then GS salespeople find buyers for them, all the
while the asset managers are developing relationships with high net worth individuals –
many who work for investment banking clients – in order to solidify relationships and keep
the cycle going.
One set of external complements is filled by securities exchanges and clearinghouses.
Without these entities, Goldman’s operations would be curtailed or eliminated in many
departments.

Goldman Sachs Group, Inc.
April 22, 2009 Page 15
Potential to seize market share International expansion Wider margins
SWOT
Strengths • Ability to raise capital: As evidenced by its $5 billion stock issuance just last week,
Goldman’s ability to raise capital has significantly improved.5 Goldman’s financing
capacity surpasses many of its Troubled Asset Relief Program (TARP) counterparts and
has shown eagerness to pay the government back early.6 This access to capital both signals
and enhances Goldman’s solvency, which in turn improves the firm’s ability to commit
capital to operations.
Government influence Continued writedowns Boutique firms Regulatory reform Low-leverage environment Public fury and legislative retribution over
AIG concerns Market uncertainty and fear
Threats Opportunities
Government limitations “Black box” to investors “Too big to fail”
Ability to raise capital Brand/human capital Global influence Little direct consumer exposure Deep connections Liquidity Risk management “Too big to fail" Uncorrelated revenue streams Already marked-to-market
Weaknesses Strengths

Goldman Sachs Group, Inc.
April 22, 2009 Page 16
• Brand/human capital: The Goldman Sachs name attracts the best employees. Those
employees produce the best services, which attracts the most lucrative projects and clients.
This, in turn, leads to high revenues, which means that the firm can provide employees
with lucrative employment and interesting work, thereby creating a virtuous cycle.
• Global influence: Goldman’s asset base and international presence provides Goldman
the opportunity to maintain more consistent deal flow and increase its service base.
• Little direct consumer exposure: None of Goldman’s business segments gives it
direct exposure to consumers,7 which partially protects it during downturns like the
current one.
• Deep connections: The nature of the business necessitates networking and
connections. None are better than Goldman, which is frequently cited in conspiracy
theories for having its “tentacles” deep in the government. Connections lead, at the
margin, to more favorable, or at least less unfavorable, treatment.
• Liquidity: Even before the recent $5 billion equity issuance, Goldman was a peer-leader
in terms of liquidity. A historically high global core pool of liquidity around $164 billion
dollars as of Q1 2009 gives Goldman operational flexibility and also increases investor
confidence.8
• Risk management: Goldman’s risk management is unsurpassed. Importantly, risk
managers are seen as prestigious and important at the firm, instead of bureaucrats who do
not produce revenue. This is arguably the greatest reason for Goldman’s outperformance
during the crisis.
• “Too big to fail”: Although it is unclear what would have happened in financial
markets were TARP not enacted, Goldman’s perception as being too big too fail certainly
granted it access to government pools of capital that ensured its survival.
• Uncorrelated revenue streams: All three of the firm’s business segments are capable
of outperforming in up and down markets. Investment banking underwriting may be
more prevalent in boom times, but consolidating M&A deals and restructurings will fuel
the firm through bad times. The FICC business is also non-directional, which is
significant considering how much of the firm’s revenue come from the unit. High-net-
worth individuals will still need their assets managed in bad times, and any surviving hedge
funds will still need a prime broker even in bad times.9

Goldman Sachs Group, Inc.
April 22, 2009 Page 17
Already marked-to-market:: From an accounting perspective, Goldman should also strive
to stay the course. Currently, the firm attempts to mark all of its assets to market,
maintaining maximum transparency for investors. This only adds to the confidence
investors already feel because of Goldman’s operational and risk management
outperformance.
10 The following graph further illustrates how Goldman’s already marked-to-market accounting
strategy starkly differentiates the firm from the rest of the pack, who have broadly failed to
mark assets to market.

Goldman Sachs Group, Inc.
April 22, 2009 Page 18
Weaknesses
• Government Limitations: The acceptance of TARP aid comes with limitations of
dividends, stock buybacks, and executive compensation.
• “Black box to investors”: Due to the opaque nature of many of Goldman’s
businesses, investors can never be quite sure what risks underlie their investment.
• “Too big to fail”: Being too big to fail was a boon when it came to government aid
programs, at least to the extent that it essentially eliminated short-term solvency concerns.
However, there is now the risk that the government decides to exercise greater regulatory
control over institutions deemed systemically significant. Anything from compensation
limits to forced separation of businesses (à la Glass-Steagall II) is possible.
Opportunities • Potential to Seize Market Share: Large bankruptcies and struggling competitors create
the opportunity for increased market share across business segments. This can be achieved
without growing operations simply through aggression. However, organic or inorganic
growth could also build market share.
• International expansion: About half of Goldman’s revenues and earnings come from
the U.S. Goldman could take advantage of the global recession to increase its
international footprint. This is attractive because BRIC and other emerging countries are
likely to grow faster than the U.S. once they recover from the recession. Goldman has
already started this process in China, through existing relationships with the Chinese
Government and powerful businesses (such as its 4.9% stake in the Industrial and
Commercial Bank of China, or “ICBC”).
• Wider margins: Due to investors’ and banks’ risk-aversion in this period of deep
market uncertainty, margins have widened for those banks willing to provide liquidity to
markets. Goldman clearly took advantage of this in Q1 2009 with its FICC group, and
can continue to do so.11

Goldman Sachs Group, Inc.
April 22, 2009 Page 19
Threats • Government Influence: The Obama administration has indicated willingness to exert a
great deal of influence over the banking sector, whether through programs like TARP or
through future legislation. Market uncertainty is at least significantly related to uncertainty
about the future of government influence in the banking sector.
• Continued writedowns: There is no certainty that asset prices have stabilized. The
loosening of mark-to-market accounting rules could slightly diffuse the problem, but the
likelihood of further write-downs is still nontrivial.
• Boutique firms: Since executive compensation limitations were threatened on large
investment banks, there has been an exodus of talent to unrestricted boutique firms or to
new ventures. For instance, the recent departure of Byron Trott, who is leaving to start
his own firm.12 If this is not curtailed, it poses a legitimate threat to Goldman’s business
model.
• Regulatory reform: Regulatory reform could come in many shapes and forms.
Compensation limits, Glass-Steagall-type separations, or even nationalization of
competitors could all have serious effects on industry dynamics and the existing business
model.
• Low-leverage environment: Market fear has demanded that firms de-leverage,
thereby improving their capital ratios. This could hurt the bottom line and impair
compensation expectations.
• Public fury and legislative retribution over AIG concerns: The government’s
erratic and ad hoc handling of various situations within the financial crisis raises concerns.
Should public fury rise over the payments that flowed from the government through AIG
to Goldman, there is no way of knowing the government will not stick its hands into
Goldman’s pockets to take the money back.
• Market uncertainty and fear: Severe market volatility has eroded investor confidence
even in the most solvent institutions. It will take some time for that confidence to be
rebuilt.
Goldman Sachs Group, Inc.
April 22, 2009 Page 20
Financial Analysis
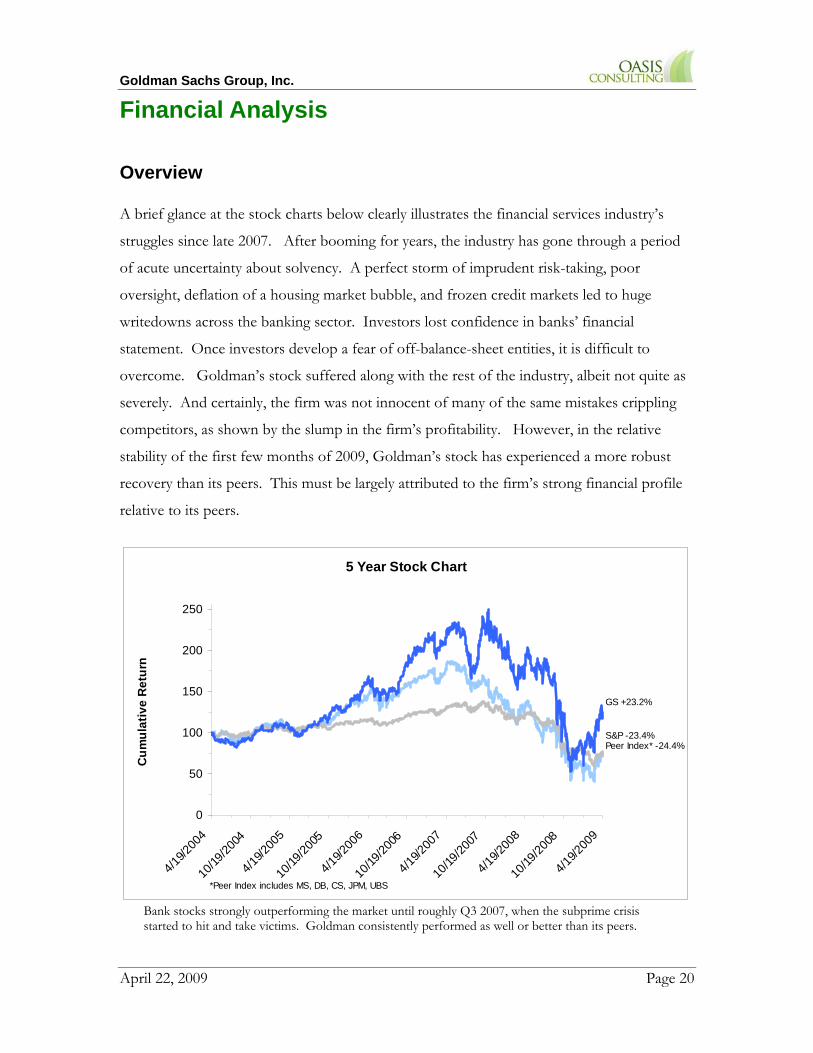
Overview A brief glance at the stock charts below clearly illustrates the financial services industry’s
struggles since late 2007. After booming for years, the industry has gone through a period
of acute uncertainty about solvency. A perfect storm of imprudent risk-taking, poor
oversight, deflation of a housing market bubble, and frozen credit markets led to huge
writedowns across the banking sector. Investors lost confidence in banks’ financial
statement. Once investors develop a fear of off-balance-sheet entities, it is difficult to
overcome. Goldman’s stock suffered along with the rest of the industry, albeit not quite as
severely. And certainly, the firm was not innocent of many of the same mistakes crippling
competitors, as shown by the slump in the firm’s profitability. However, in the relative
stability of the first few months of 2009, Goldman’s stock has experienced a more robust
recovery than its peers. This must be largely attributed to the firm’s strong financial profile
relative to its peers.
5 Year Stock Chart
0
50
100
150
200
250
4/19/2
004
10/19
/2004
4/19/2
005
10/19
/2005
4/19/2
006
10/19
/2006
4/19/2
007
10/19
/2007
4/19/2
008
10/19
/2008
4/19/2
009
Cum
ulat
ive
Ret
urn
GS +23.2%
Peer Index* -24.4%S&P -23.4%
*Peer Index includes MS, DB, CS, JPM, UBS
Bank stocks strongly outperforming the market until roughly Q3 2007, when the subprime crisis started to hit and take victims. Goldman consistently performed as well or better than its peers.

Goldman Sachs Group, Inc. 1 Year Stock Chart
0
20
40
60
80
100
120
4/18/2
008
5/18/2
008
6/18/2
008
7/18/2
008
8/18/2
008
9/18/2
008
10/18
/2008
11/18
/2008
12/18
/2008
1/18/2
009
2/18/2
009
3/18/2
009
4/18/2
009
Cum
ulat
ive
Ret
urn
GS -32.1%S&P -37.5%Peer Index* -44.9%
*Peer Index includes MS, DB, CS, JPM, UBS*Peer Index includes MS, DB, CS, JPM, UBS
13 Bank stocks underperforming, and likely dragging down, the market until the beginning of Q1 2009, when those same stocks have led a rebound. Goldman has paced its competitors during the recovery of the last few months.
Profitability and Growth Explosive revenue growth from 2004-2007 (at a 3-year CAGR of 30.0%) led to record
revenues in 2007 of over $45 billion. This growth was across business segments, as the
business mix stayed relatively constant over that period, although it is worth noting that
Trading and Principal Investments comprised roughly two thirds of revenue. Impressively,
operating margins increased from 31.9% in 2004 to 38.3%.
In 2008, total revenue dropped by over 51%, with Trading and Principal Investments in
particular seeing revenue decrease by 71%. Q1 2009 showed a large-scale turnaround. If the
Q1 09 results could be maintained for all of 2009, revenues would increase by 69.7%, with
Trading and Principal Investments revenue increasing by over 215%. It is definitely
somewhat concerning that both the Investment Banking and Asset Management and
Securities Services segments would still show significant further decreases in revenue if the
Q1 data were maintained. Trading and Principal Investments are carrying the firm right
April 22, 2009 Page 21

Goldman Sachs Group, Inc.
April 22, 2009 Page 22
now, in large part because of strong results in the liquid products businesses of the FICC
group. Meanwhile, the other segments have not started to recover yet.
Revenue by business segment ($ millions)
2004 2005 2006 2007 2008 Q1 2009Q1 2009
AnnualizedInvestment Banking $3,374 $3,671 $5,629 $7,555 $5,185 $823 $3,292Trading and Principal Investments $13,728 $16,818 $25,562 $31,226 $9,063 $7,150 $28,600Asset Management and Securities Services $3,849 $4,749 $6,474 $7,206 $7,974 $1,452 $5,808
Total $20,951 $25,238 $37,665 $45,987 $22,222 $9,425 $37,700 % of Revenue
2004 2005 2006 2007 2008 Q1 2009Q1 2009
AnnualizedInvestment Banking 16.1% 14.5% 14.9% 16.4% 23.3% 8.7% 8.7%Trading and Principal Investments 65.5% 66.6% 67.9% 67.9% 40.8% 75.9% 75.9%Asset Management and Securities Services 18.4% 18.8% 17.2% 15.7% 35.9% 15.4% 15.4%
Revenue - YOY Growth2004 2005 2006 2007 2008 Q1 2009
Q1 2009 Annualized*
Investment Banking 8.8% 53.3% 34.2% -31.4% -36.5%Trading and Principal Investments 22.5% 52.0% 22.2% -71.0% 215.6%Asset Management and Securities Services 23.4% 36.3% 11.3% 10.7% -27.2%
Total 20.5% 49.2% 22.1% -51.7% 69.7%
Pretax Operating Profit $6,676 $8,273 $14,560 $17,604 $2,336 $2,629
Pretax Operating Margin 31.9% 32.8% 38.7% 38.3% 10.5% 27.9%
*Q1 09 Annualized is compared to 2008 Source:FBR Research and company reports14
Solvency Goldman is solvent and strong when compared to its peers. According to its Tangible
Common Equity ratio, Goldman leads the pack of the major banks (see chart below). This
ratio gives a sense of how well-capitalized a firm is. A higher ratio implies lower leverage
(leverage is the inverse of this ratio), and therefore a smaller chance of failing to meet
obligations.

Goldman Sachs Group, Inc.
15 Financial companies’ stock market struggles can in large part be traced to solvency fears.
Surely, fears of decreased earnings power given lower leverage and questions about the
business model played a role as well, but primarily investors were concerned that creditors
would pull the short-term lending that is the lifeblood of investment banks. Goldman’s
more conservative leverage is likely a large factor in its stock outperformance.
GS’s TCE ratio hovered around 4.7% as of Q4 2008, implying leverage of 21x. Until the
government reveals the results of its stress tests, it remains unclear whether this will satisfy
them enough to accept TARP repayment from GS. There are, of course, political and
April 22, 2009 Page 23

Goldman Sachs Group, Inc.
April 22, 2009 Page 24
systemic considerations related to TARP repayment in addition to company-specific
financial strength.
Another strategy that has enhanced Goldman’s solvency relates to the maturities of its debt.
One concern during the peak of this crisis was that critical, short-term financing would be
pulled, essentially dealing banks a death sentence. However, we see that even before the
crisis started, Goldman was shifting away from short-term to more long-term borrowing.
This was smart first because short-term lending was more attractive when the yield curve
was more tilted between Q1 2002 and Q1 2005 (as shown in the graph below by the bars
indicating the spread between the 2-year and 10-year Treasuries). Then, as the yield curve
flattened and rates concurrently came down, Goldman shifted from short-term borrowing
into long-term. Now, the firm has locked up long-term financing at relatively low rates,
thereby decreasing its exposure to the threat of short-term creditors pulling their financing.
16
Goldman Sachs Group, Inc.
April 22, 2009 Page 25
Liquidity
With respect to liquidity, Goldman is also in a strong position. In Q1 2009, its global
core excess pool of liquidity averaged a record $164 billion, during a period of
deleveraging. Some analysts on the earnings call were concerned that Goldman was
hording too much cash, but CFO David Viniar said the firm was intentionally taking a
cautious stance during this period of uncertainty.17
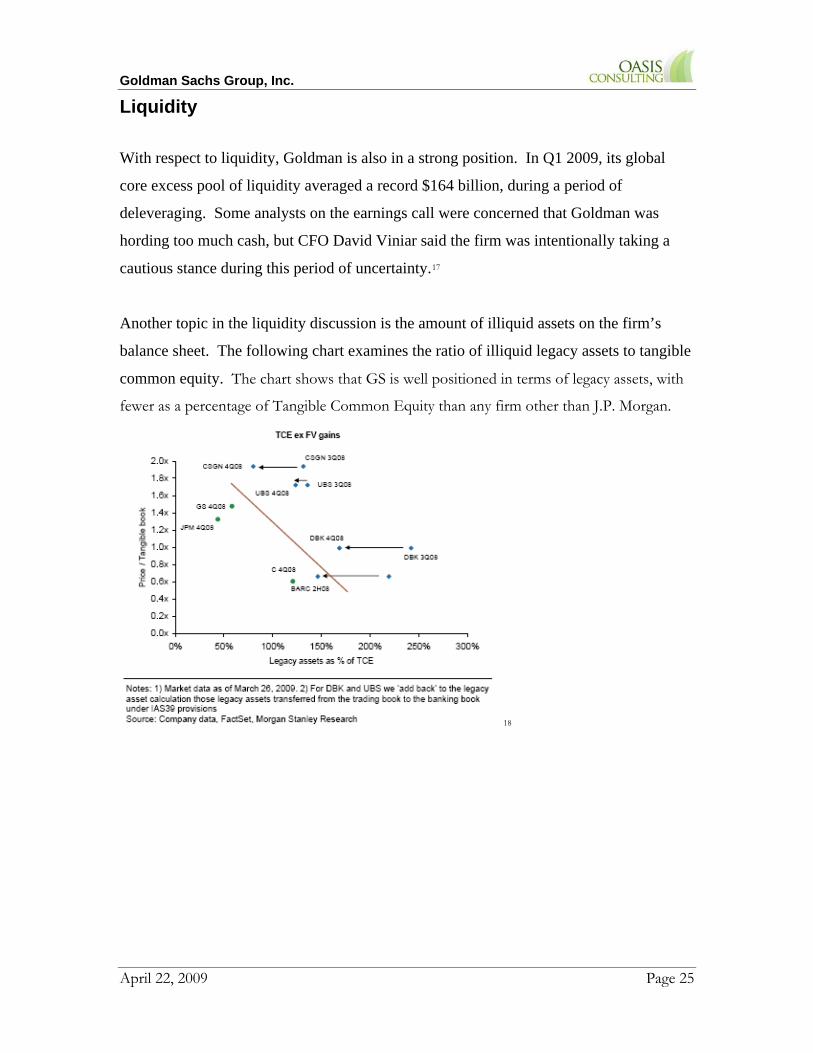
Another topic in the liquidity discussion is the amount of illiquid assets on the firm’s
balance sheet. The following chart examines the ratio of illiquid legacy assets to tangible
common equity. The chart shows that GS is well positioned in terms of legacy assets, with
fewer as a percentage of Tangible Common Equity than any firm other than J.P. Morgan.
18

Goldman Sachs Group, Inc.
April 22, 2009 Page 26
Strategic Recommendations
Leverage During the boom times of 2006-2007, investment banks used leverage to boost their returns.
This strategy seemed safer because of the prevailing wisdom that complex derivatives
allowed banks to hedge away more risk. However, the crisis has made it clear that our
financial infrastructure has systemic weaknesses. In particular, off-balance-sheet entities
have deeply eroded confidence in financial institutions. Banks that seemed to have healthy
financials owned off-balance-sheet Structured Investment Vehicles (SIVs) housing
collateralized debt obligations (CDOs) financed by commercial paper. With the housing
downturn, the CDOs began rapidly losing value, which caused the commercial paper
investors to stop rolling over the SIVs’ financing arrangements. All of a sudden, the SIVs
had to be brought onto the balance sheet, along with their massive writedowns.
These blunders did massive violence to investor confidence in bank financial statements, and
it will take time for banks to restore confidence that they are no longer concealing material
risks from their investors. Until that confidence is fully replenished and the market
stabilizes, banks would be smart to maintain conservative leverage, even if it means taking a
hit to return-on-equity. Goldman has a very strong reputation for its risk management, and
investors may allow it more flexibility with its capital structure than some of its competitors,
but in the short term at least, maintaining confidence is at a high premium in these uncertain
times. In the Q1 2009 earnings call, Goldman CFO David Viniar indicated that this is how
Goldman views the situation as well. As mentioned previously, the firm has amassed a
record $164 billion excess pool of liquidity. This pool cushions Goldman against a further
downturn, but in the upside case of a quick recovery, the firm can easily and
opportunistically move out of these liquid positions.19

Goldman Sachs Group, Inc.
20
April 22, 2009 Page 27

Goldman Sachs Group, Inc.
April 22, 2009 Page 28
Regulation
Troubled Asset Relief Program - TARP Goldman needs to get out of the TARP program as soon as possible, and they know it. The
threat of executive compensation limits is causing the loss of talented executive to
unencumbered boutique firms. Also, participation in the program has brought with it too
much bad publicity.
Nonetheless, exiting the program will not be so easy. The government is concerned with
ensuring that allowing healthy banks out of the program does not bring back the systemic
risks the program was designed to eliminate.
Term Asset-Backed Securities Loan Facility - TALF The TALF program has not worked as planned, due to lack of interest. As of the morning
of the April deadline, only two lenders had applied for the program, for a total issuance of
under $1.4 billion. March’s issuance was $4.7 billion, also well below expectations. One
article summarized the problems with TALF as follows21:
• Inadequate demand: The economic environment does not favor the kinds of real-
estate or other fixed asset investment that a couple of years ago would have been rapidly
bundled into the kinds of asset-backed securities TALF was designed for.
• Better options exist: Investors may be choosing to utilize other government programs,
whose terms seem friendlier, such as the Public-Private Investment Partnership.
• Government fear and uncertainty: After seeing how TALF participation has created
deep problems for members, there is widespread fear that the government will exercise
the same unexpected control over TALF participants.
Temporary Liquidity Guarantee Program – TLGP Goldman has been organized large bond issues under the Temporary Liquidity Guarantee
Program (TLGP), which provides and FDIC guarantee on relatively short bonds. One
analysis estimated that the program was saving Goldman two to three percentage points of
interest that they would have to offer to place bonds not guaranteed by the FDIC. With the
$25 billion of bonds that Goldman has issued under the program, those savings amount to
between $500 and $750 million a year in government subsidies.

Goldman Sachs Group, Inc.
April 22, 2009 Page 29
22 In the most recent earnings call, Goldman CFO David Viniar repeated that he does not
believe the TLGP program will be subjected to the same kind of legislative attacks that
TARP participants experienced. Also, he said he did not believe that TARP repayment
would disqualify Goldman from TLGP participation, citing as evidence the fact that TARP
non-participants were already taking advantage of the TLGP.
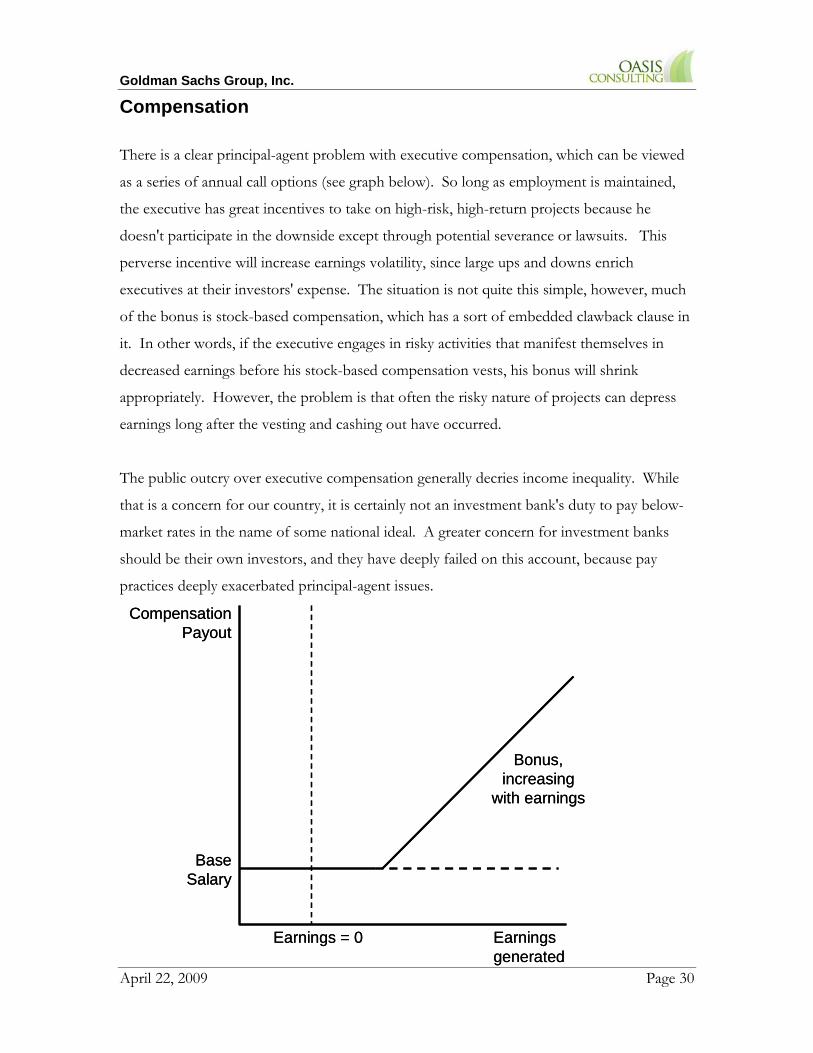
Goldman Sachs Group, Inc. Compensation There is a clear principal-agent problem with executive compensation, which can be viewed
as a series of annual call options (see graph below). So long as employment is maintained,
the executive has great incentives to take on high-risk, high-return projects because he
doesn't participate in the downside except through potential severance or lawsuits. This
perverse incentive will increase earnings volatility, since large ups and downs enrich
executives at their investors' expense. The situation is not quite this simple, however, much
of the bonus is stock-based compensation, which has a sort of embedded clawback clause in
it. In other words, if the executive engages in risky activities that manifest themselves in
decreased earnings before his stock-based compensation vests, his bonus will shrink
appropriately. However, the problem is that often the risky nature of projects can depress
earnings long after the vesting and cashing out have occurred.
The public outcry over executive compensation generally decries income inequality. While
that is a concern for our country, it is certainly not an investment bank's duty to pay below-
market rates in the name of some national ideal. A greater concern for investment banks
should be their own investors, and they have deeply failed on this account, because pay
practices deeply exacerbated principal-agent issues.
Earnings generated
CompensationPayout
BaseSalary
Bonus, increasing
with earnings
Earnings = 0 Earnings generated
CompensationPayout
BaseSalary
Bonus, increasing
with earnings
Earnings = 0
April 22, 2009 Page 30

Goldman Sachs Group, Inc.
April 22, 2009 Page 31
Compensation structure was the catalyst of improper risk-taking. The option-like payout
structure encouraged executives to search out projects that would show up fast in net
income, regardless of the level of future risk. So long as projects could keep company stock
prices inflated until options of restricted stock units vested, executives could cash out and
then watch the stock price drop as risks became realized. There is a growing consensus that
compensation needs to change. The following graph shows that firms plan in particular to
use risk-adjustments when determining compensation. Additionally, vesting periods will be
tailored to attempt to align executives’ incentives with their firms’.
23
These alterations to compensation practices have already clearly been absorbed into the
mainstream. Thus, at this point, the more relevant question becomes exactly what risk
metrics to use to determine compensation and how best to determine the risk time horizon
associated with any given position.
Another incredibly important strategic issue for investment banks in general, and GS in
particular, is the threat of legislated compensation restrictions. The clearest threat is from
the TARP program. If the government refuses to accept repayment of TARP funds, GS
may be saddled with pay limits that will cripple its ability to compete with boutique
investment banks for top executive talent. This cannot be allowed to happen. In the short
term, GS continue to focus on TARP repayment. If that fails or takes longer than expected,

Goldman Sachs Group, Inc.
April 22, 2009 Page 32
GS should consider raising base salaries and lowering bonuses, both potentially dramatically.
The firm and its brand are worthless without the stock of human capital stored up in its
employees. GS may decide that the incentives created by the bonus structure are critical to
operational success, in which case the firm should consider some sort of break-up. Only by
removing the label “too big to fail” can GS truly ensure that it will have the freedom to pay
its employees market rates.

Goldman Sachs Group, Inc.
April 22, 2009 Page 33
Potential for Growth The firm has a record amount of excess cash on its balance sheet, which theoretically
endows it with a great deal of power for potential acquisitions. Additionally, the Goldman’s
revenues are highly concentrated in the U.S., with around 50% of revenues and earnings in
the U.S. (see chart below). Through acquisitions the firm could gain access to the higher
growth likely in emerging countries once stability returns to financial markets.
Net revenues ($ millions) 2008 2007 2006Americas1 15,485 70% 23,412 51% 20,361 54%EMEA2 5,910 27% 13,538 29% 9,354 25%Asia 827 4% 9,037 20% 7,950 21%
Total net revenues 22,222 100% 45,987 100% 37,665 100%
Pre-tax earnings2008 2007 2006
Americas1 4,879 N.M. 7,673 44% 7,515 52%EMEA2 169 N.M. 5,458 31% 3,075 21%Asia (2,716) N.M. 4,510 26% 4,015 28%Corporate3 4 — (37) — (45) —
Total pre-tax earnings 2,336 100% 17,604 100% 14,560 100%
Net earnings2008 2007 2006
Americas1 3,371 N.M. 4,981 43% 4,855 51%EMEA2 694 N.M. 3,735 32% 2,117 22%Asia (1,746) N.M. 2,907 25% 2,594 27%Corporate3 3 — (24) — (29) —
Total net earnings 2,322 100% 11,599 100% 9,537 100%
1 Substantially all relates to the U.S.2 EMEA (Europe, Middle East and Africa).3 Consists of net provisions for a number of litigation and regulatory proceedings. 24
Brazil – Banco Pactual Just recently, UBS announced its intention to sell its “highly profitable” Brazilian financial
services business Banco Pactual for around $2.5 billion to its original, Brazilian owners, BTG
Investments. Banco Pactual is primarily engaged in asset and wealth management, with $24
billion in assets under management. Goldman was reportedly interested in buying the firm
but was beat out by UBS. One wonders why they would not be interested in it again now.25
Goldman Sachs Group, Inc.
April 22, 2009 Page 34
According to UBS’s 2008 20-F filing, Banco Pactual, renamed UBS Pactual Asset
Management after the acquisition, was the seventh largest asset manager in Brazail as of
12/31/08, with CHF 19 billion of invested assets. As a recently acquired subsidiary, UBS
does not break out any information on the unit in its financials. Oblique references are
made to Pactual having a positive effect on UBS’s FICC unit performance for 2008, but no
hard numbers are given.
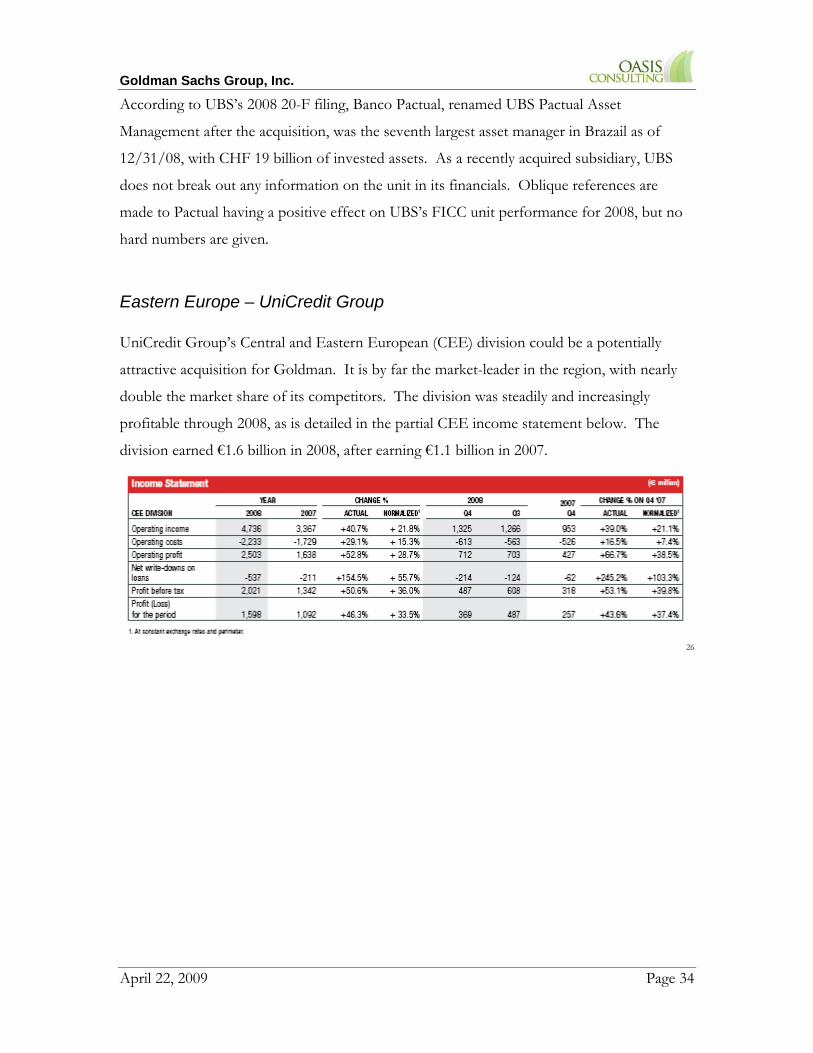
Eastern Europe – UniCredit Group UniCredit Group’s Central and Eastern European (CEE) division could be a potentially
attractive acquisition for Goldman. It is by far the market-leader in the region, with nearly
double the market share of its competitors. The division was steadily and increasingly
profitable through 2008, as is detailed in the partial CEE income statement below. The
division earned €1.6 billion in 2008, after earning €1.1 billion in 2007.
26

Goldman Sachs Group, Inc.
April 22, 2009 Page 35
The stock has traded heavily downwards over the last year, as can be seen in the stock charts
below, making it a potentially attractive buy. Using 2008 earnings, UniCredit’s P/E is
around 5.5-6.0. Granted, that is the P/E for the whole firm, which may not be growing as
fast as the CEE region, but that is still cheap for a market-leading firm with steady profits
even during troubled times.
1 Year Stock Chart
27 3 Year Stock Chart
28

Goldman Sachs Group, Inc.
April 22, 2009 Page 36
The firm’s results are remarkable across a variety of countries. The following graph shows
that operating income increased in every country in the region (using constant 2006 euros).
29 More would need to be known about the nature of the division’s non-performing assets
before progress could be made on this topic. Eastern Europe has been hit hard by the
financial crisis, and this period of uncertainty might not be the right time to enter the region.
Nonetheless, I believe Goldman should keep its eye on this firm. If global market
conditions stabilize somewhat, this could be an attractive acquisition target.
Goldman Sachs Group, Inc.
April 22, 2009 Page 37
Endnotes 1 Hoover’s Company History. 2 Harper, Christine and Craig Torres. “Goldman, Morgan Stanley Bring Down Curtain on an Era.” Bloomberg. September
22, 2008.
(http://www.bloomberg.com/apps/news?pid=newsarchive&sid=axaX5i4871U0) 3 Bratton, Anna Jo. “Berkshire Buying $5 Billion Stake in Goldman Sachs.” ABC News. September 23, 2008.
(http://abcnews.go.com/Business/WireStory?id=5870347&page=1) 4 Goldman 10-K. Company website. 5 Harper, Christine and Poppy Towbridge. “Goldman Sachs Raises $5 Billion to Repay TARP Funds.” Bloomberg. April
14, 2009.
(http://www.bloomberg.com/apps/news?pid=20601087&sid=aGi9069FDKbo) 6 Harper, Christine. “Goldman Sachs Would Like to Repay Treasury, CFO Says.” Bloomberg. February 4, 2009.
(http://www.bloomberg.com/apps/news?pid=20601087&refer=home&sid=a3xTcf52kEZM) 7 1Q 09 Earnings Call. 8 1Q 09 Earnings Call. 9 1Q 09 Earnings Call. 10 Bary, Andrew. “Resurrection on Wall Street.” Barron’s. March 16, 2009.
(http://online.barrons.com/article/SB123698562029125353.html?mod=article-outset-box) 11 1Q 09 Earnings Press Release. 12 Moore, Heidi N. “Byron Trott to Leave Goldman Sachs. Warren Buffett Signs On.” WSJ Blogs. Deal Journal. March 30,
2009.
(http://blogs.wsj.com/deals/2009/03/30/byron-trott-to-leave-goldman-sachs-warren-buffett-signs-on/) 13 Stock data from Yahoo! Finance. 14 FBR Research. The Goldman Sachs Group. “Bruised, Not Broken – Initiating at Outperform.” March 26, 2009; and GS
8-K. April 13, 2009. 15 Morgan Stanley, Oliver Wyman. “Wholesale Banks: Outlook for Global Wholesale & Investment Banking.” March 30,
2009. 16 FBR Research. The Goldman Sachs Group. “Bruised, Not Broken – Initiating at Outperform.” March 26, 2009. 17 1Q 09 Earnings Call. 18 Morgan Stanley, Oliver Wyman. “Wholesale Banks: Outlook for Global Wholesale & Investment Banking.” March 30,
2009. 19 1Q 09 Earnings Call. 20 Morgan Stanley, Oliver Wyman. “Wholesale Banks: Outlook for Global Wholesale & Investment Banking.” March 30,
2009. 21 Carney, John. “TALF Program Is Just Limping Along.” The Business Insider. April 7, 2009.
(http://www.businessinsider.com/talf-program-is-just-limping-along-2009-4) 22 Bary, Andrew. “Resurrection on Wall Street.” Barron’s. March 16, 2009.
(http://online.barrons.com/article/SB123698562029125353.html?mod=article-outset-box)

Goldman Sachs Group, Inc.
April 22, 2009 Page 38
23 Morgan Stanley, Oliver Wyman. “Wholesale Banks: Outlook for Global Wholesale & Investment Banking.” March 30,
2009. 24 Goldman 10-K 2008. 25 Bart, Katharina. “UBS, in Asset Dump, to Sell Brazilian Bank.” WSJ. April 21, 2009.
(http://online.wsj.com/article/SB124020500095834219.html) 26 UniCredit Provisional 2008 consolidated Reports and Accounts. 27 From UniCredit website. 28 From UniCredit website. 29 UniCredit Provisional 2008 consolidated Reports and Accounts.