STRATEGIC PLANstatic.k12.wv.us/superintendent/doc/strategicplan.pdf1 STRATEGIC PLAN: METRICS THAT...
40
STRATEGIC PLAN: METRICS THAT MATTER West Virginia Department of Education
-
Upload
vuongkhanh -
Category
Documents
-
view
220 -
download
4
Transcript of STRATEGIC PLANstatic.k12.wv.us/superintendent/doc/strategicplan.pdf1 STRATEGIC PLAN: METRICS THAT...

STRATEGIC PLAN:METRICS THAT MATTERWest Vi rg in i a Depar tment o f Educa t i on

West Virginia Board of Education2015-2016
Michael I. Green, PresidentLloyd G. Jackson II, Vice President
Tina H. Combs, Secretary
Thomas W. Campbell, MemberBeverly E. Kingery, MemberL. Wade Linger, Jr., MemberGayle C. Manchin, MemberWilliam M. White, MemberJames S. Wilson, Member
Paul L. Hill, Ex OfficioChancellor
West Virginia Higher Education Policy Commission
Sarah A. Tucker, Ex OfficioInterim Chancellor
West Virginia Community and Technical College Education
Michael J. Martirano, Ex OfficioState Superintendent of Schools
West Virginia Department of Education

1
STRATEGIC PLAN:METRICS THAT MATTER
Michael J. Martirano, Ed.D.State Superintendent of SchoolsWest Virginia Department of Educationwvde.state.wv.us
October 22, 2015

2
Since I began my tenure as the 30th State Superintendent of Schools for West Virginia, I have worked with our West Virginia Board of Education, our Governor, our elected officials, community and business leaders, educational leaders, parents and most importantly, our teachers and students to institutionalize my entry and vision plan: “One Voice, One Focus: All Students Achieving”.
The entry and vision plan established my initial goals as well as 10 World Class System Priorities for all West Virginia Schools. Once these goals and priorities were presented to the State Board of Education, the Department and our educational leaders, I embarked on a robust “Listening and Learning” communication opportunity - an endeavor to build relationships and trust, and begin the work of actualizing my entry and vision plan into a five year strategic plan.
Along the way, we took a pause to engage with the legislature, ensure that our resources were aligned to the plan and to build an organizational structure at the West Virginia Department of Education that is staffed with a skilled and innovative team that is poised to respond to the urgent work outlined in the goals and newly defined objectives.
In addition, I brought together a key advisory group made up of diverse stakeholders including educational leaders, experts, practitioners and community partners to provide input in strategic areas of operations, innovation, teaching and learning opportunities. This advisory group will meet on a periodic basis to assist the Department in making sure the outlined goals and objectives are being met.
Throughout my thoughtful engagement with key leaders and stakeholders across our great state and careful reflection on the best means for improving the educational quality for each young person in West Virginia, I am ready to unveil the five year Strategic Plan. As I previously stated in the early days of my tenure, “I cannot do this work alone - we must galvanize every citizen in West Virginia to eliminate academic failure for our youth”. Again, I firmly believe that our best days are yet to come as we implement the measurable goals and objectives outlined in our 2016-2020 Strategic Plan.
Michael J. Martirano, Ed.DState Superintendent of Schools
INTRODUCTION

3
2016-2020BOARD GOALProvide a statewide system of education that ensures all students graduate from high school prepared for success in high-quality postsecondary opportunities in college and/or careers.
MISSIONThe West Virginia Board of Education establishes policies and rules to assure implementation of West Virginia’s education goals and to ensure the general supervision, oversight and monitoring of a thorough and efficient educational system.
DEPARTMENT VISION“One Voice, One Focus: All Students Achieving”Creating a World Class Educational System for the State of West Virginia
Shared Values and BeliefsWe believe the West Virginia Department of Education (WVDE) partnered with our key educational leaders and districts should:
• Establish high expectations and create an engaging and orderly atmosphere to foster learning for all.
• Encourage and develop distributed leadership among staff, students, and stakeholders in order to focus collective action for improved school performance.
• Deliver a standards-focused curriculum which values children’s developmental stages to assure all students attain the essential knowledge, skills and dispositions necessary in our global and digital age.
• Provide support services to address students’ physical, social/emotional and academic growth, and form positive connections to families and the community.
• Encourage processes of self-reflection, collaboration and evaluation that lead to professional growth and development.
• Assure that facilities, fiscal resources, personnel, data, and technology systems add value to student learning.

4
GOAL 1:ENSURE ALL STUDENTS GRADUATE FROM HIGH SCHOOL WITH A WORLD-CLASS EDUCATION, PRE-K-12, WHO ARE COLLEGE AND CAREER READY.
OBJECTIVE 1.13rd Grade Reading
OBJECTIVE 1.2Grades 3-8 ELA &Math Proficiency
OBJECTIVE 1.3Higher Levels ofRigor
OBJECTIVE 1.4College & CareerReadiness
OBJECTIVE 1.5Graduation Rate(90% by 2020)

5
STRATEGIES: » Establish the structure and culture for universal access and
continuous improvement of relevant and rigorous curriculum by implementing best practices through a systemic, professional and personalized learning system for both teachers and students.
» Develop and implement a system of support for graduation by focusing on middle to high school students through a coordinated, comprehensive Graduation 20/20 School Improvement Framework.
» Increase focus on the implementation of a Simulated Workplace Company Environment, Advanced Career Programs, enhanced Career Technical Education (CTE) project-based learning, and Tech Centers That Work in all CTE programs.
» Maintain and enhance the current Pre-K-12 seamless education partnerships as a means to ensure effective transitions for all students.
» Advance a unified commitment to excellence and equity in early childhood education and early learning through a comprehensive Pre-K – 5th Grade approach and a statewide Campaign for Early Literacy.
» Use Math/Science Partnership initiative to target math and science achievement at the middle grades and use transition courses to target math achievement at the high school level.
» Expand Innovation Zones to develop, implement and evaluate Science, Technology, Engineering, and Math (STEM) initiatives and educational opportunities for all students Pre-K-12.
» Support capacity building within all local education agencies and RESAs to guarantee high quality instructional programs that contain rigorous and vertically aligned standards, effective teaching, and ongoing assessments.
» Support capacity building within all local education agencies and RESAs to provide differentiated instruction for all students and interventions/remediation for students who are not yet proficient nor college and career ready.
» Use WV standards based accountability system (A-F) to report progress in improving overall student achievement.

6
OBJECTIVE 1.1Improve the Grade 3 reading proficiency rate, supported by a statewide Pre-K-Grade 3 comprehensive literacy initiative.
OBJ. 1.1.A.Increase Grade 3 reading proficiency rate by 5 percentage points in the 2015 – 2016 school year as measured by the WV General Summative Assessment.
Long-term proficiency rate trajectories will be determined following the second-year administration of the WV General Summative Assessment (WVGSA). Reading proficiency rates will be compared with the biennial National Assessment of Education Progress (NAEP) results.
Number of Third Grade Students at or above Proficiency in 2015 and Projected for 2016: English Language Arts/Literacy
Number of StudentsStudents
Tested 2015Students at proficiency Projected
increase 20162015 201619,551 8,994 9,971 977
OBJ. 1.1.B.Reduce to 20% by 2020 the rate of Grade 3 students in the Below Standard category for the Reading Claim as measured by the WVGSA English language arts assessment.
Percent Proficient
2015 rate 2016 rate
46%
51%
Percent of Grade 3 Students in Below Standard Category for the Reading Claim
2015 2016 2017 2018 2019 2020
36%
32.8%
29.6%
26.4%
23.2%
20%

7
OBJECTIVE 1.2Increase the percentage of students in Grades 3-8 who are proficient in English language arts/literacy and mathematics.
OBJ. 1.2.A.Increase Grades 3 - 8 English Language Arts (ELA) and mathematics proficiency rate by 5 percentage points in the 2015 - 2016 school year, as measured by the West Virginia General Summative Assessment.
Long-term proficiency rate trajectories will be determined following the second-year administration of the WV General Summative Assessment (WVGSA). Reading proficiency rates will be compared with the biennial National Assessment of Education Progress (NAEP) results.
Number and Percent of Students Grades 3 - 8 at or above Proficiency in 2015 and Projected for 2016: English Language Arts/Literacy
Number of Students
Students Tested 2015
Students at ProficiencyIncrease2015 2016
Grade 3* 19,551 8,994 9,971 977Grade 4 19,676 8,854 9,838 984Grade 5 19,831 10,114 11,105 991Grade 6 19,577 8,418 9,397 979Grade 7 19,966 8,985 9,983 998Grade 8 19,765 8,499 9,487 988*Grade 3 ELA scores also appear in Objective 1.1.
3 4 5 6 7 8Grade Level
Percent of Students
2015 proficiency rate
2016 proficiency target
51% 50%
56%
48%50%
48%
46% 45%
51%
43%45%
43%

8
Number and Percent of Students Grades 3 - 8 at or above Proficiency in 2015 and Projected for 2016: Mathematics
Number of Students
Students Tested 2015Students at Proficiency
Increase2015 2016Grade 3 19,555 8,604 9,582 978Grade 4 19,685 6,890 7,874 984Grade 5 19,821 5,946 6,937 991Grade 6 19,592 5,094 6,074 980Grade 7 19,983 4,996 5,995 999Grade 8 19,814 4,954 5,945 991
Percent of Students
3 4 5 6 7 8Grade Level
2015 proficiency rate
2016 proficiency target
49%
40%
35%
31%30% 30%
44%
35%
30%
26%25% 25%

9
OBJ. 1.2.B.Improve WV’s ranking to 40th on the National Assessment of Educational Progress (NAEP) by 2020 for Grades 4 and 8 in reading.
Ranking projections are based on the most current available data (NAEP 2013). Numbers of students performing at or above proficient cannot be shown because NAEP testing is based on a sampling of students.
GRADE 4 READING PERCENT PROFICIENT
27% 28% 29% 30%
40%
30%
20%
10%
0%2013 2015 2017 2019
GRADE 4 READING RANK* EQUIVALENT
47th
44th
41st
40th40
2013 2015 2017 2019
45
50
GRADE 8 READING PERCENT PROFICIENT
25% 28% 29% 30%
40%
30%
20%
10%
0%2013 2015 2017 2019
GRADE 8 READING RANK* EQUIVALENT
47th
45th
43rd
40th40
2013 2015 2017 2019
45
50
* Includes 52 jurisdictions (50 states, the District of Columbia and Department of Defense Activity schools)

10
GRADE 4 MATHEMATICS PERCENT PROFICIENT
2013 2015 2017 2019
35% 36% 37% 39%
40%
30%
20%
10%
0%
GRADE 4 MATHEMATICS RANK* EQUIVALENT
GRADE 8 MATHEMATICS PERCENT PROFICIENT GRADE 8 MATHEMATICS RANK* EQUIVALENT
2013 2015 2017 2019
40
45
50
44th
43rd
41st40th
24% 26% 28% 30%
40%
30%
20%
10%
0%2013 2015 2017 2019
40
2013 2015 2017 2019
45
50
47th46th
43rd
40th
OBJ. 1.2.C.Improve WV’s ranking to 40th on the National Assessment of Educational Progress (NAEP) by 2020 for Grades 4 and 8 in mathematics.
Ranking projections are based on the most current available data (NAEP 2013). Numbers of students performing at or above proficient cannot be shown because NAEP testing is based on a sampling of students.
* Includes 52 jurisdictions (50 states, the District of Columbia and Department of Defense Activity schools)

11
OBJECTIVE 1.3Increase the rate of student success in rigorous courses leading to college credit or industry-recognized credentials while in high school.
OBJ. 1.3.A.Increase the number of students who enroll in at least 1 Advanced Placement® (AP) course by 2 percent a year.
Number of Students Enrolled in at least 1 AP Course Projected, 2014 – 2020
Number* Increase2013 – 2014 9,1502014 – 2015 9,333 1832015 – 2016 9,520 1872016 – 2017 9,710 1902017 – 2018 9,904 1942018 – 2019 10,102 1982019 – 2020 10,304 202*This number reflects an unduplicated student count and does not reflect students who take multiple AP courses.
OBJ. 1.3.B.Increase the number students who take at least 1 AP exam by 2 percent a year.
Number of Students taking at least 1 AP ExamProjected, 2014 – 2020
Number Increase2013 – 2014 6,8022014 – 2015 6,938 1362015 – 2016 7,077 1392016 – 2017 7,218 1412017 – 2018 7,363 1452018 – 2019 7,510 1472019 – 2020 7,660 150
Students Enrolled in an AP Course
9,1
50
9,3
33
9,5
20
9,7
10
9,9
04
10
,10
2
10
,30
4
2014 2015 2016 20182017 2019 2020
Students Taking at least 1 AP Exam
6,8
02
6,9
38
7,0
77
7,2
18
7,3
63
7,5
10
7,6
60
2014 2015 2016 20182017 2019 2020

12
OBJ. 1.3.C.Increase the number students who score a 3 or higher on at least 1 AP exam by 2 percent a year.
Number of AP Students Projected to have an exam with a score of 3 or higher, 2014 – 2020
Students with exam score of 3 or higher Increase
2013 – 2014 2,8572014 – 2015 2,914 572015 – 2016 2,972 582016 – 2017 3,031 592017 – 2018 3,092 612018 – 2019 3,154 622019 – 2020 3,217 63
OBJ. 1.3.D.Increase the rate of students in CTE pathways who enter a WV Community Techincal College (CTC) with Earn a Degree-Graduate Early (EDGE) credit(s) by 5 percent a year.
Students entering CTCs with EDGE Increase
2013 – 2014 4632014 – 2015 486 232015 – 2016 510 242016 – 2017 576 262017 – 2018 605 292018 – 2019 635 302019 – 2020 667 32
Number of AP Test TakersScoring 3 or Higher
2,8
57
2,9
14
2,9
72
3,0
31
3,0
92
3,1
54
3,2
17
2014 2015 2016 20182017 2019 2020
Number of StudentsEntering CTCs with EDGE
46
3
48
6
51
0
57
6
60
5
63
5
66
7
2014 2015 2016 20182017 2019 2020

13
OBJ. 1.3.E.Increase the number of students who enroll in at least 1 dual credit course by 2 percent a year.
Number of Dual Credit Course Enrollments Projected, 2015 - 2020
Dual credit course enrollments
Increase from 2014-2015
2014 – 2015 4,3072015 – 2016 4,393 862016 – 2017 4,481 882017 – 2018 4,571 902018 – 2019 4,662 912019 – 2020 4,755 93
OBJ. 1.3.F.Increase the number of students who earn dual course credit by 2 percent a year.
Number and Percentage of Dual Credit Enrollments Projected to Receive College Credit, 2015-2020
Number of StudentsStudents Earning
Course CreditIncrease since
2014-20152014 – 2015 4,1532015 – 2016 4,236 832016 – 2017 4,321 852017 – 2018 4,407 862018 – 2019 4,495 882019 – 2020 4,585 90
Percent Enrollments ReceivingCredits
2015 2016 2017 2018 2019 2020
90% 91% 92% 93% 94% 95%
Dual Credit CourseEnrollments
4,3
07
4,3
93
4,4
81
4,5
71
4,6
62
4,7
55
2015 2016 2017 2018 2019 2020

14
OBJ. 1.3.G.Increase the rate of students in CTE concentrations who earn industry credentials by 2 percent a year.
Number and Percent of Students in CTE Concentrations Who Earn an Industry Credential
Number of CTE StudentsStudents attaining
credentialIncrease from previous year
2014 – 2015 3,5112015 – 2016 3,922 4112016 – 2017 4,383 8722017 – 2018 4,845 1,3342018 – 2019 5,306 1,7952019 – 2020 5,768 2,257Based on a constant 2014-2015 enrollment of 23,070 students in CTE concentrations.
Attainment of credential can be cost prohibitive for some students. See chart below for comparison of 2014 – 2015 credential attainment numbers when the state pays for the assessment (highlighted) versus when the student must pay for it.
Unduplicated Number of Students Earning Industry Credentials in 2014 – 2015 by Type of Credential
Industry credentialNumber of students earning
credential (unduplicated)TOTAL 3,511
Certified nurse assistant (CNA) 200Direct care worker 100Food handler 184IT Academy* 834National Center for Construction Education and Research (NCCER)* 1,899Pharmacy technician 20ServSafe managers 6State welding certifications* 165West Virginia Welcome* 103
*The cost of the assessment for this credential is paid for by the State.
Note: Students completing Automotive and/or Electrical CTE programs are eligible to sit for the Automotive Service Excellence (ASE) and Electrical Journeyman’s certification upon high school graduation.
Percent of CTE Students
2015 2016 2017 2018 2019 2020
15%17%
19%21%
23%25%

15
OBJECTIVE 1.4Increase the percentage of students who are college and career ready at graduation.
OBJ. 1.4.A.Increase Grade 11 proficiency in English language arts/literacy and mathematics rate by 5 percent in the 2015-2016 school year, as measured by the West Virginia General Summative Assessment (WVGSA).
Long-term proficiency rate trajectories will be determined following the second-year administration of the WVGSA. Proficiency rates will be compared with the biennial National Assessment of Education Progress (NAEP) results.
Number and Percentage of Grade 11 Students at or above Proficiency* in 2015 and Projected for 2016: English language arts/literacy
Number Proficient: ELA
Total enrollmentStudents at proficiency
Increase2015 2016
16,970 7,976 8,824 848*Proficiency is defined as a score of 3 or 4 on the WVGSA and is recognized by the WV Higher Education Policy Commission (HEPC) as having met pre-requisites for college-level, credit-bearing courses.
Number and Percentage of Grade 11 Students at or above Proficiency* in 2015 and Projected for 2016: Mathematics
Number Proficient: Math
Total enrollmentStudents at proficiency
Increase2015 2016
16,946 3,389 4,237 848*Proficiency is defined as a score of 3 or 4 on the WVGSA and is recognized by the WV Higher Education Policy Commission (HEPC) as having met pre-requisites for college-level, credit-bearing courses.
Percent Proficient: ELA
2015 2016
47%
52%
Percent Proficient: Math
2015 2016
20%
25%

16
OBJ. 1.4.B.Increase by 2 percent a year, with an ultimate goal of 40% by 2020, the rate of student completers in enhanced career technical education (CTE) programs delivered within Simulated Workplace Company environments.
Number and Percent of Grade 12 Students Completing Enhanced CTE programs
Number of Program Completers
Program completers
Increase from 2015-2020
2014 – 2015 5,5322015 – 2016 5,812 2802016 – 2017 6,175 6432017 – 2018 6,539 1,0072018 – 2019 6,902 1,3702019 – 2020 7,265 1,733Based on a constant 2014-2015 enrollment of 18,163 12th-Grade students.
OBJ. 1.4.C.Increase by 2 percentage points annually, with an overall increase of 10 percentage points by 2020, the rate of West Virginia test takers who are college and career ready as measured by the SAT.
Number and Percent of Students Taking SAT Identified as College and Career Ready
Number College and Career Ready2014
testers reaching bench-mark
Students at proficiencyIncrease
2014-20202015 2016 2017 2018 2019 2020
CriticalReading 1,212 1,255 1,298 1,342 1,385 1,428 1,472 908
Math 1,082 1,125 1,169 1,212 1,255 1,298 1,342 909
Writing 1,017 1,060 1,104 1,147 1,190 1,233 1,277 909
Numbers projected for 2015 - 2020 are projected based on the 2014 number of test takers (2,164) the most recent year for which data are available.
Percent of 12th GradeStudents
2015 2016 2017 2018 2019 2020
30%32%
34%36%
38%40%
Percent College and Career Ready
2014 2015
56%
58%
50%
52%
47%
49%
Critical Reading
Math
Writing
17
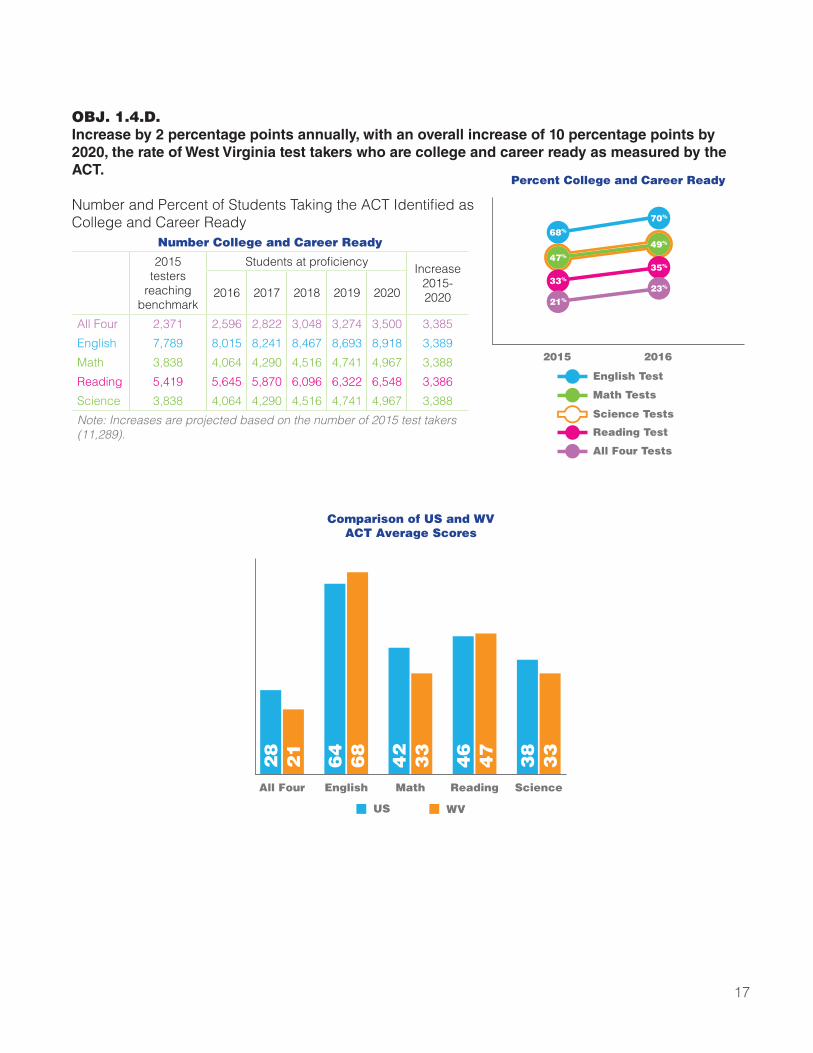
OBJ. 1.4.D.Increase by 2 percentage points annually, with an overall increase of 10 percentage points by 2020, the rate of West Virginia test takers who are college and career ready as measured by the ACT.
Number and Percent of Students Taking the ACT Identified as College and Career Ready
Number College and Career Ready
2015testers
reaching benchmark
Students at proficiency Increase2015-20202016 2017 2018 2019 2020
All Four 2,371 2,596 2,822 3,048 3,274 3,500 3,385
English 7,789 8,015 8,241 8,467 8,693 8,918 3,389
Math 3,838 4,064 4,290 4,516 4,741 4,967 3,388
Reading 5,419 5,645 5,870 6,096 6,322 6,548 3,386
Science 3,838 4,064 4,290 4,516 4,741 4,967 3,388
Note: Increases are projected based on the number of 2015 test takers (11,289).
Percent College and Career Ready
2015 2016
68%
70%
47%
49%
33%
35%
21%
23%
English Test
Math Tests
Science Tests
Reading Test
All Four Tests
Comparison of US and WVACT Average Scores
28
21
64
68
42
33
46
47
38
33
All Four English Math Reading Science
US WV

18
OBJECTIVE 1.5Improve the graduation rate annually with an ultimate goal of 90% for all students by 2020.
Number and Percent of 4-Year Cohort Graduates in 2014 and Projected Through 2020
Number of Graduates
4-year cohort*Increase
2014 - 20202013-2014 16,7192014-2015 16,886 1672015-2016 17,055 3362016-2017 17,226 5072017-2018 17,398 6792018-2019 17,572 8532019-2020 17,748 1,029*Projections based on 16,719 four-year cohort graduates statewide in 2013-2014, the most recent year for which data are available.
Graduation Rate
2014 2015 2016 20182017 2019 2020
84%
88%90%
89%
87%
85% 86%

19
20
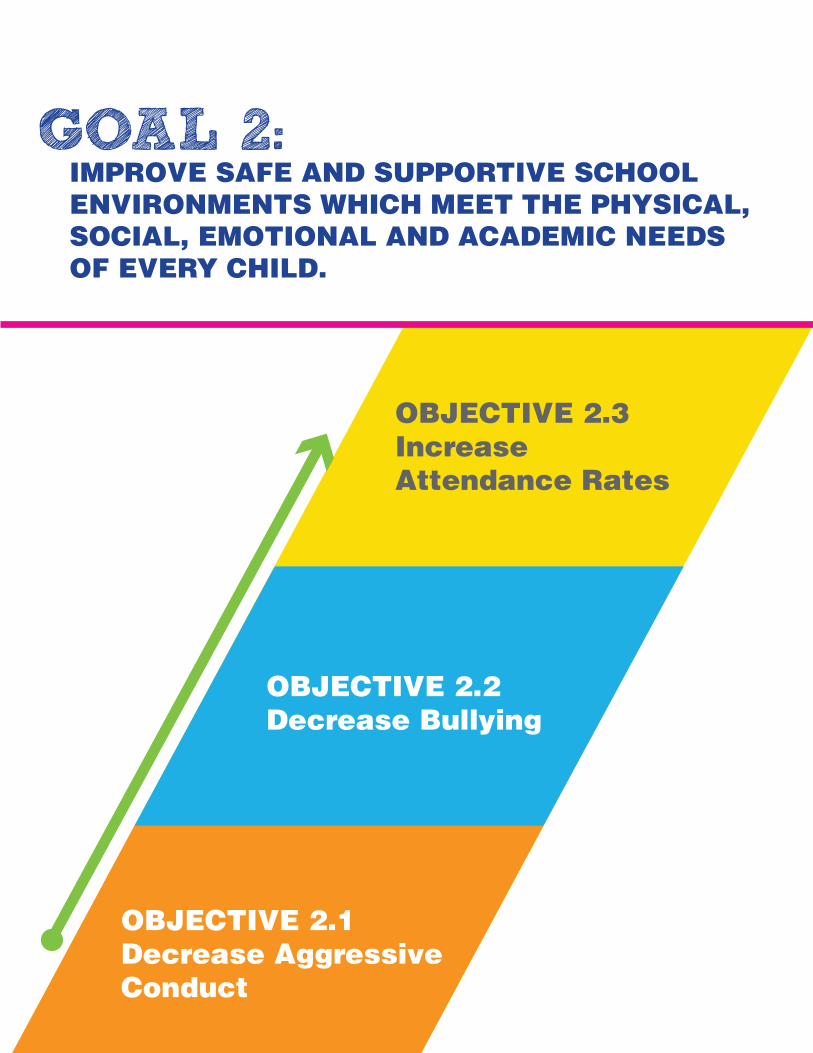
GOAL 2:IMPROVE SAFE AND SUPPORTIVE SCHOOL ENVIRONMENTS WHICH MEET THE PHYSICAL, SOCIAL, EMOTIONAL AND ACADEMIC NEEDS OF EVERY CHILD.
OBJECTIVE 2.1Decrease AggressiveConduct
OBJECTIVE 2.2Decrease Bullying
OBJECTIVE 2.3IncreaseAttendance Rates

21
STRATEGIES: » Provide comprehensive focus on school improvement initiatives
through the Grad 20/20 School Improvement Framework and Community Schools policy to ensure the needs of the whole child are being met.
» Launch a statewide “Attendance Matters in WV” campaign to provide schools with ongoing strategies to engage students daily.
» Leverage Policy 4110 in an effort to standardize attendance reporting at the local and state level.
» Ensure that students in West Virginia benefit from nutritious meals that foster better learning and a lifetime of good health.
» Utilize the Early Warning System through school leadership teams, making data readily available to educators on at-risk students and matching them with appropriate interventions.
» Leverage the Local School Dropout Prevention and Recovery Innovation Zones and Truancy Diversion grants to expand local efforts to target dropout prevention.
» Partner with community agencies to meet the needs of all West Virginia students and provide supports to school systems.
» Provide ongoing support and resources for reimagining instructional time to increase the capacity of counties to provide 180 days of instruction.
» Evaluate data from the Extended Stop Arm Pilot program to determine next steps to decrease illegal vehicle passings statewide.

22
OBJECTIVE 2.1Decrease the total number of aggressive conduct incidences by 2 percentage points annually, to fewer than 20,500 by 2020.
Aggressive conduct behaviors include the following: physical fights without injury; battery against a student or school employee; hazing; sexual misconduct; threats of injury or assault against a student or employee; harassment, intimidation or bullying; and verbal assaults against students or school employees (for full text of this definition see WV Code §18-2C-3).
Number of Aggressive Conduct Incidences and Projected Decrease, 2015 – 2020
Aggressive conduct
incidencesDecrease from
2014-20152014 – 2015 22,6482015 – 2016 22,195 -4532016 – 2017 21,742 -9062017 – 2018 21,289 -1,3592018 – 2019 20,836 -1,8122019 – 2020 20,383 -2,265
Number Aggressive ConductIncidents
22
,64
8
22
,19
5
21
,74
2
21
,28
9
20
,83
6
20
,38
3
2015 2016 2017 2018 2019 2020

23
OBJECTIVE 2.2Decrease the number of bullying incidences by 2 percentage points annually to fewer than 3,200 by 2020.
Harassment, intimidation or bullying means any intentional gesture or electronic, written, verbal or physical act, communication, transmission or threat that (a) has the effect of physically harming a student or a student’s property, or of placing a student in reasonable fear of harm to his or her person or property; (b) is sufficiently severe, persistent or pervasive that it creates an intimidating, threatening or emotionally abusive educational environment for a student; or (c) disrupts or interferes with the orderly operation of the school (for full text of this definition see WV Code WV Code §18-2C-2).
Number of Bullying Incidences and Projected Decrease, 2015 – 2020
Bullying incidencesDecrease from
2014-20152014 – 2015 3,5122015 – 2016 3,442 -702016 – 2017 3,372 -1402017 – 2018 3,301 -2112018 – 2019 3,231 -2812019 – 2020 3,161 -351
OBJECTIVE 2.3Improve the attendance rate with the ultimate goal of 95% for all students by 2020.
Baseline will be determined with implementation of Policy 4110 based on actual attendance versus attendance rate calculated with allowable deductions.
Bullying Incidences
3,5
12
3,4
42
3,3
72
3,3
01
3,2
31
3,1
61
2015 2016 2017 2018 2019 2020

24
GOAL 3:IMPROVE ORGANIZATIONAL EFFECTIVENESS THROUGH PROMOTION, RECRUITMENT, AND RETENTION OF A HIGHLY SKILLED WORKFORCE FOCUSED ON STRONG INSTRUCTIONAL LEADERSHIP.
OBJECTIVE 3.1Educator Growth
OBJECTIVE 3.2Increase inNBCTs
OBJECTIVE 3.3NBCTs inLow-Performing Schools
OBJECTIVE 3.4Substitute TeacherUtilization
OBJECTIVE 3.5Teacher Salary

25
STRATEGIES: » Customize professional development aligned to the Educator
Evaluation System.
» Build capacity for new and aspiring school and county leaders through collaborative support systems and professional learning.
» Incorporate more clinical based partnerships and performance assessments within teacher preparation programs aligned to the Council for the Accreditation of Educator Preparation (CAEP).
» Reform leader preparation through the National Governor’s Association (NGA) based on the work of the Wallace Foundation and the refreshed Interstate School Leader Licensure Consortium (ISLLC) standards.
» Advocate for increased salaries for West Virginia educators.
» Implement Phase II of the WVDE reorganization to full fidelity and continue to monitor the implementation.
» Establish a calendar of ongoing professional learning to develop the WVDE staff capacity, promote leadership succession and eliminate single points of failure.
» Continue to develop alternative pathways to the teaching profession.
» Strengthen existing efforts to recruit, retain and support educators and craft new models for creating an educator pipeline for West Virginia.
» Utilize the Reimagining Time initiative to recreate the school day to provide flexibility for both student and adult learning and to provide instruction on what normally would be lost instructional days.
» Expand the Learning School (Catalyst Schools) initiative state-wide to empower teachers and principals to take charge of their own professional learning as members of collaborative learning teams.
26
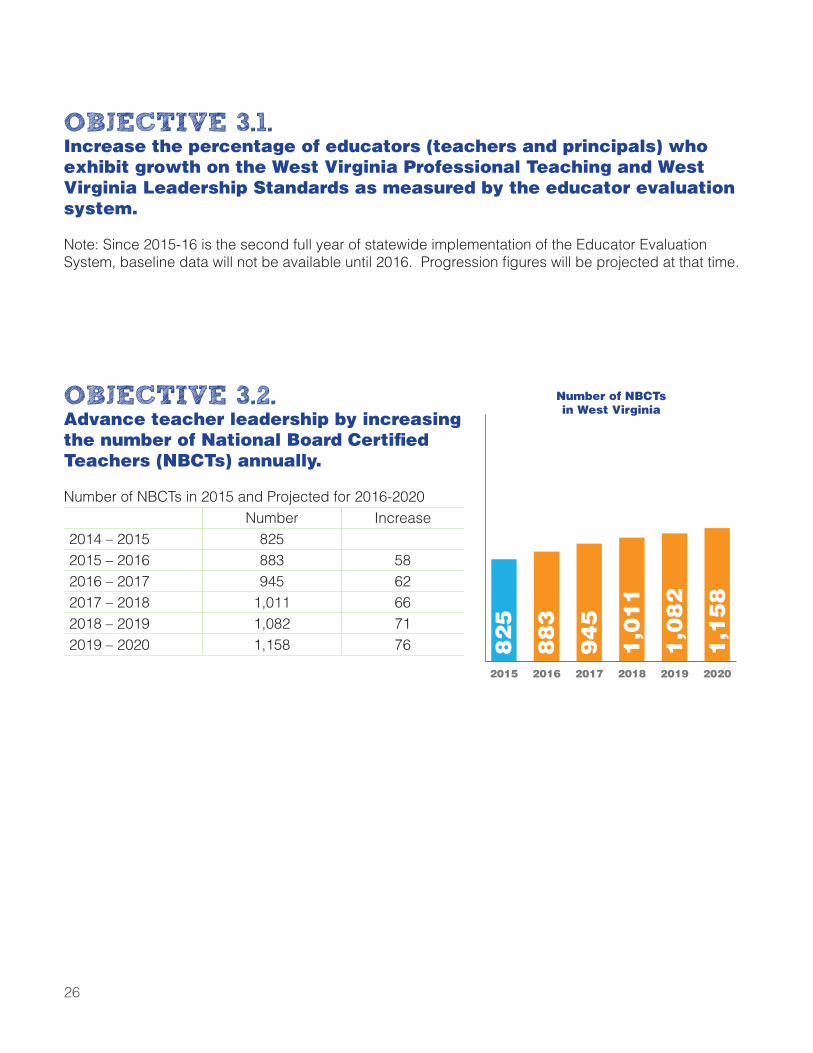
OBJECTIVE 3.1.Increase the percentage of educators (teachers and principals) who exhibit growth on the West Virginia Professional Teaching and West Virginia Leadership Standards as measured by the educator evaluation system.
Note: Since 2015-16 is the second full year of statewide implementation of the Educator Evaluation System, baseline data will not be available until 2016. Progression figures will be projected at that time.
OBJECTIVE 3.2.Advance teacher leadership by increasing the number of National Board Certified Teachers (NBCTs) annually.
Number of NBCTs in 2015 and Projected for 2016-2020Number Increase
2014 – 2015 8252015 – 2016 883 582016 – 2017 945 622017 – 2018 1,011 662018 – 2019 1,082 712019 – 2020 1,158 76 8
25
88
3
94
5
1,0
11
1,0
82
1,1
58
2015 2016 2017 2018 2019 2020
Number of NBCTsin West Virginia
27
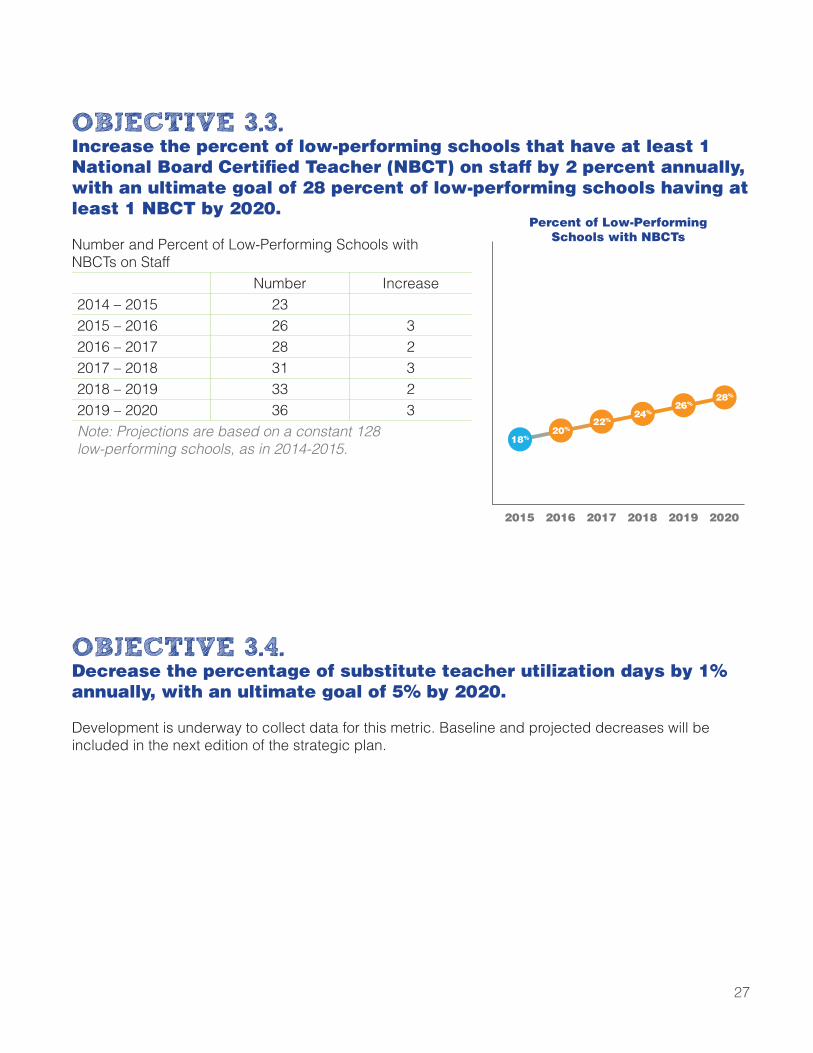
OBJECTIVE 3.3.Increase the percent of low-performing schools that have at least 1 National Board Certified Teacher (NBCT) on staff by 2 percent annually, with an ultimate goal of 28 percent of low-performing schools having at least 1 NBCT by 2020.
Number and Percent of Low-Performing Schools with NBCTs on Staff
Number Increase2014 – 2015 232015 – 2016 26 32016 – 2017 28 22017 – 2018 31 32018 – 2019 33 22019 – 2020 36 3Note: Projections are based on a constant 128 low-performing schools, as in 2014-2015.
Percent of Low-PerformingSchools with NBCTs
2015 2016 2017 2018 2019 2020
18%20%
22%24%
26%28%
OBJECTIVE 3.4.Decrease the percentage of substitute teacher utilization days by 1% annually, with an ultimate goal of 5% by 2020.
Development is underway to collect data for this metric. Baseline and projected decreases will be included in the next edition of the strategic plan.

28
OBJECTIVE 3.5Increase the state minimum salary for teachers with zero years of experience and a B.A. degree to at least $37,675 by fiscal year 2019 (W. Va. Code §18A-4-2(a)).
Current Minimum Teacher Salary and Projected IncreasesIncrease
2015-2016 $32,675 2016-2017 $34,342 $1,6672017-2018 $36,008 $1,6662018-2019 $37,675 $1,667
Minimum Teacher Salary
$3
2,6
75
$3
4,3
42
$3
6,0
08
$3
7,6
75
2016 2017 2018 2019

29

30
GOAL 4:DEVELOP EXTENSIVE AND MEANINGFUL PARENT AND COMMUNITY RELATIONSHIPS WHERE WE COMMUNICATE REGULARLY AND OFTEN WITH ALL STAKEHOLDERS.
OBJECTIVE 4.1One Voice Tour
OBJECTIVE 4.2Student Voice
OBJECTIVE 4.3Superintendent’sAdvisory Group
OBJECTIVE 4.4Communications
OBJECTIVE 4.5Parent Resources

31
STRATEGIES: » Update the WVDE website to be more user friendly.
» Create a Legislative Plan to ensure our elected officials fully understand educational issues and plans.
» Direct the WV Academic Spotlight: A Community Evaluation of Our Standards, the public review of the West Virginia Next Generation Standards.
» Increase the use of social media to communicate with all stakeholders.
» Publish findings from the One Voice Tour documenting all “listening and learning” observations.
» Continue to engage families with resources regarding standards, curriculum and assessment via websites, apps, and social media.
» Design and supply districts and schools with family-friendly resources and toolkits to help families better understand and support their child’s achievement in school.

32
OBJECTIVE 4.1Complete the 55-County One Voice Tour.
Hancock
Brooke
Ohio
Marshall
Monongalia
Marion Preston
Wetzel
TylerPleasants
Wood Ritchie
MineralHampshire
MorganBerkeley
Jefferson
Kanawha
Doddridge HarrisonTaylor
Barbour TuckerLewisWirt
JacksonRoane
Calhoun GilmerUpshur Randolph
Braxton
ClayPutnam
Mason
Cabell
LincolnNicholas
Webster
Pocahontas
FayetteGreenbrier
Summers
Boone
Wayne
Mingo Logan
Wyoming
McDowell
Raleigh
Mercer
Monroe
Pendleton
Grant
Hardy
Tyler County Schools
Wetzel County Schools
Brooke County Schools
Hancock County Schools
Mason County Schools
Taylor County Schools
Barbour County Schools
Braxton County Schools
Clay County Schools
Logan County Schools
Summers County Schools
Webster County Schools
Upshur County Schools
Tucker County Schools
Grant County Schools
Hardy County Schools
Pocahontas County Schools
Randolph County Schools
Wayne County Schools
West Virginia Schools for the Deaf & Blind
Hampshire County Schools
Mineral County Schools
Monroe County Schools
Preston County Schools
Ohio County Schools
Marshall County Schools
Cabell County Schools
Pendleton County Schools
Fayette County Schools
Morgan County Schools
Jefferson County Schools
Berkeley County Schools
Mercer County Schools
Mingo County Schools
Lewis County
Harrison County Schools
Raleigh County (RESA 1)
Gilmer County
McDowell County Schools
Marion County Schools
Jackson County Schools
Putnam County Schools
Monongalia County Schools
Kanawha County Schools
Greenbrier County Schools

33
OBJECTIVE 4.2Convene the Student Voice Forum, composed of two students from each county that will meet semiannually.
OBJECTIVE 4.3Establish the Superintendent’s Advisory Group that will meet semiannually.
OBJECTIVE 4.4Implement a strategic communication and marketing plan to ensure our stakeholders and public understand the strategic plan and how it will be monitored.
OBJECTIVE 4.5Develop and distribute resources to parents that assist with their child’s education.
34
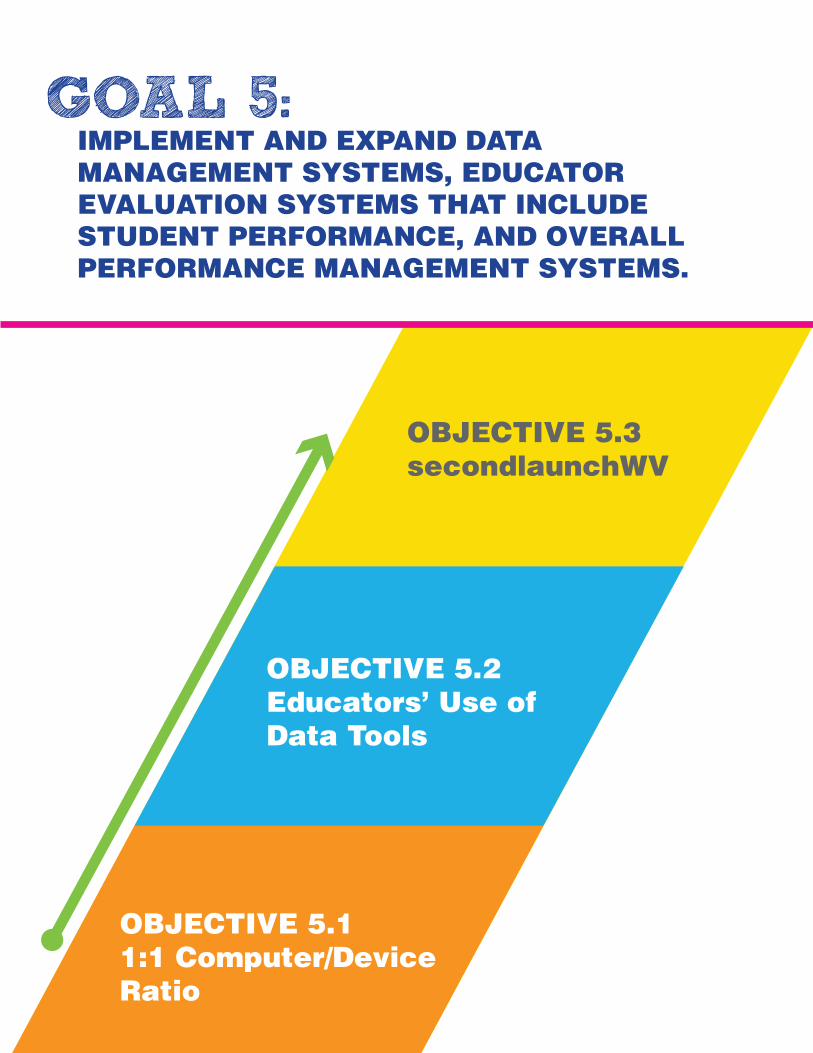
GOAL 5:IMPLEMENT AND EXPAND DATA MANAGEMENT SYSTEMS, EDUCATOR EVALUATION SYSTEMS THAT INCLUDE STUDENT PERFORMANCE, AND OVERALL PERFORMANCE MANAGEMENT SYSTEMS.
OBJECTIVE 5.11:1 Computer/DeviceRatio
OBJECTIVE 5.2Educators’ Use ofData Tools
OBJECTIVE 5.3secondlaunchWV

35
STRATEGIES: » Implement a portal to serve as a front end access point for the
West Virginia Education Information System (WVEIS).
» Create an identity management system that allows for a single sign-on solution for each user.
» Provide the ability for districts to host state provided as well as locally implemented solutions through the portal.
» Increase wireless network access within schools to support the advancement of mobile technologies, including the investigation of the feasibility of wireless access on WV school buses.
» Continually monitor and update bandwidth as needed to meet the needs of increased computer/device to student ratios.
» Implement strategies to ensure that both the K-12 Network and Confidential Student Data are properly safeguarded from unauthorized access.
» Provide data management in support of Policy 2320, A Process for Improving Education: Performance Based Accreditation System (i.e A-F Rating System).

36
OBJECTIVE 5.1Continue to increase computer/device-to-student ratios in West Virginia schools, achieving a 1:1 ratio in Grades 3-12 by 2020
Development is underway to collect data for this metric. Baseline and projected increases will be included in the next edition of the strategic plan.
OBJECTIVE 5.2Increase educators’ use of state-supported data tools.
OBJECTIVE 5.3Continue to implement*
secondlaunchWV
Hancock
Brooke
Ohio
Marshall
Monongalia
Marion Preston
Wetzel
TylerPleasants
Wood Ritchie
MineralHampshire
MorganBerkeley
Jefferson
Kanawha
Doddridge HarrisonTaylor
Barbour TuckerLewisWirt
JacksonRoane
Calhoun GilmerUpshur Randolph
Braxton
ClayPutnam
Mason
Cabell
LincolnNicholas
Webster
Pocahontas
FayetteGreenbrier
Summers
Boone
Wayne
Mingo Logan
Wyoming
McDowell
Raleigh
Mercer
Monroe
Pendleton
Grant
Hardy
Counties who have received secondlaunchWVcomputers.
* Total savings as of October 1, 2015: $1,375,401.25

37

Michael J. Martirano, Ed.D.State Superintendent of Schools