
Strategic Planning for Xiaomi: Smart Phones, Crisis ... · Although Xiaomi still is one of the most...
12
International Business Research; Vol. 10, No. 8; 2017 ISSN 1913-9004 E-ISSN 1913-9012 Published by Canadian Center of Science and Education 149 Strategic Planning for Xiaomi: Smart Phones, Crisis, Turning Point Lung-Tan Lu 1 1 Fo Guang University, Taiwan Correspondence: Lung-Tan Lu, Fo Guang University, Taiwan. Received: October 14, 2016 Accepted: July 6, 2017 Online Published: July 14, 2017 doi:10.5539/ibr.v10n8p149 URL: https://doi.org/10.5539/ibr.v10n8p149 Abstract The aims of this case study are to design, practice, and evaluate a group of comparative strategies for one of the leading smart phone companies in the world: Xiaomi Inc. to turn a crisis into an expansion opportunity. First, the worldwide market of smart phones is illustrated. Second, we show the highly competition of smart phones in China market. Third, the development of Xiaomi Inc. is overviewed. Finally, we use several strategic matrixes: (1) IFE, (2) EFE, (3) CPM, (4) SWOT, (5) SPACE, (6) BCG, (7) IE, (8) GSM, (9) QSPM to evaluate and develop strategies for Xiaomi so as to change crisis into a turning point. Keywords: smart phone, strategic matrix, strategic planning, Xiaomi JEL: D7, L1, L6, M0, M1 1. Global Smart Phones Market The sales of smart phones worldwide in 2016 were over 1.5 billion, 5% growth year on year, in which the expansion power mainly came from emerging markets such as Asia Pacific region, East Europe, Middle East and North Africa. In the end of 2016, all mature markets except Japan saw weak demand but most of the emerging countries saw strong demand in smart phones. Ten vendors form the top 14 were Chinese companies. Due to the slowing demand of smart phones from 2016, most of these companies staring in peripheral technologies such as, wireless charging, augmented and virtual reality, multiple-lens camera solutions, sensors: biometric authentication and technologies, virtual personal assistants, flexible/curved displays, Wi-Fi 802.11 standards, USB Type-C, and embedded SIM and so on (See Table 1). Table 1. Top 14 Smartphones Companies Worldwide (2014 – 2016) Unit: millions Company (Nation) 2016 units Market Share (%) 2015 units Market Share (%) 2014 units Market Share (%) Samsung (S. Korea) 308.9 20.8 322.0 22.4 314.2 24.2 Apple (USA) 215.4 14.5 231.4 16.1 192.7 14.8 Huawei (China) 139.0 9.4 108.0 7.5 75.0 5.8 Oppo (China) 91.0 6.1 50.0 3.5 29.9 2.3 Vivo (China) 73.0 4.9 40.5 2.8 19.5 1.5 ZTE (China) 57.0 3.8 57.2 4.0 46.1 3.5 LG (S. Korea) 55.1 3.7 59.7 4.2 59.1 4.5 Xiaomi (China) 54.3 3.7 71.0 4.9 61.1 4.7 Lenovo (China) 53.1 3.6 76.3 5.3 95.2 7.3 TCL (China) 38.0 2.6 43.5 3.2 41.4 3.2 Gionee (China) 30.6 2.1 20.0 1.4 19.2 1.5 Meizu (China) 22.0 1.5 20.2 1.4 4.4 0.3 LeEco/Coolpad (China) 21.5 1.5 30.5 2.1 45.2 3.5 Asus (Taiwan) 20.0 1.4 16.0 1.1 5.0 0.4 Others 302.0 20.4 331.5 23.1 342.0 26.3 Total 1480.9 100 1437.3 100 1300.6 100 Source: IC Insights, Gartner, TomiAhonen Phone Book 2016, company reports 2. Smart Phones Market in China In China's, the world's largest smartphone market, the Top 5 companies have been closely matched competitors for years. It is not necessarily to be very profitable in China market, however, as most of the competitors in the world are willing to enlarge their market shares as main goal. 2015 was a critical year for smart phones companies in China. The first quarter of 2015 was the very first time the sales of smart phones declined. One of
Transcript of Strategic Planning for Xiaomi: Smart Phones, Crisis ... · Although Xiaomi still is one of the most...
International Business Research; Vol. 10, No. 8; 2017
ISSN 1913-9004 E-ISSN 1913-9012
Published by Canadian Center of Science and Education
149
Strategic Planning for Xiaomi: Smart Phones, Crisis, Turning Point
Lung-Tan Lu1
1Fo Guang University, Taiwan
Correspondence: Lung-Tan Lu, Fo Guang University, Taiwan.
Received: October 14, 2016 Accepted: July 6, 2017 Online Published: July 14, 2017
doi:10.5539/ibr.v10n8p149 URL: https://doi.org/10.5539/ibr.v10n8p149
Abstract
The aims of this case study are to design, practice, and evaluate a group of comparative strategies for one of the
leading smart phone companies in the world: Xiaomi Inc. to turn a crisis into an expansion opportunity. First, the
worldwide market of smart phones is illustrated. Second, we show the highly competition of smart phones in
China market. Third, the development of Xiaomi Inc. is overviewed. Finally, we use several strategic matrixes :
(1) IFE, (2) EFE, (3) CPM, (4) SWOT, (5) SPACE, (6) BCG, (7) IE, (8) GSM, (9) QSPM to evaluate and develop strategies for Xiaomi so as to change crisis into a turning point.
Keywords: smart phone, strategic matrix, strategic planning, Xiaomi
JEL: D7, L1, L6, M0, M1
1. Global Smart Phones Market
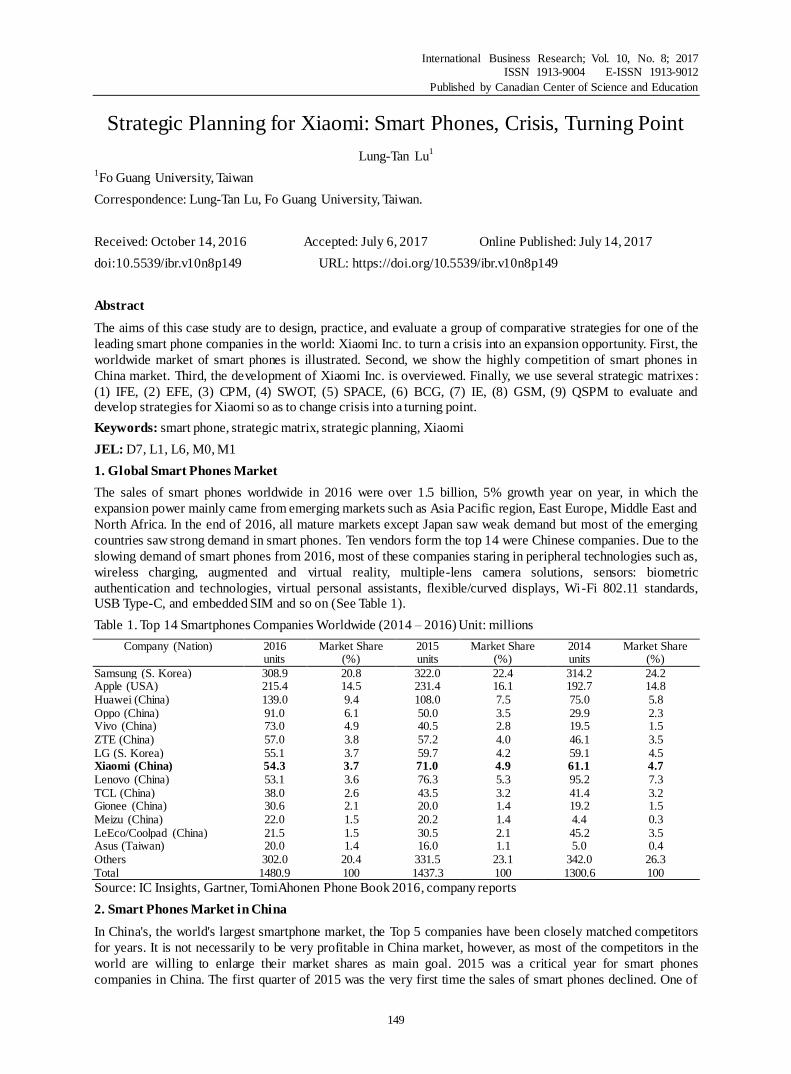
The sales of smart phones worldwide in 2016 were over 1.5 billion, 5% growth year on year, in which the
expansion power mainly came from emerging markets such as Asia Pacific region, East Europe, Middle East and
North Africa. In the end of 2016, all mature markets except Japan saw weak demand but most of the emerging
countries saw strong demand in smart phones. Ten vendors form the top 14 were Chinese companies. Due to the
slowing demand of smart phones from 2016, most of these companies staring in peripheral technologies such as,
wireless charging, augmented and virtual reality, multiple-lens camera solutions, sensors: biometric
authentication and technologies, virtual personal assistants, flexible/curved displays, Wi-Fi 802.11 standards, USB Type-C, and embedded SIM and so on (See Table 1).
Table 1. Top 14 Smartphones Companies Worldwide (2014 – 2016) Unit: millions
Company (Nation) 2016 units
Market Share (%)
2015 units
Market Share (%)
2014 units
Market Share (%)
Samsung (S. Korea) 308.9 20.8 322.0 22.4 314.2 24.2 Apple (USA) 215.4 14.5 231.4 16.1 192.7 14.8
Huawei (China) 139.0 9.4 108.0 7.5 75.0 5.8 Oppo (China) 91.0 6.1 50.0 3.5 29.9 2.3 Vivo (China) 73.0 4.9 40.5 2.8 19.5 1.5 ZTE (China) 57.0 3.8 57.2 4.0 46.1 3.5 LG (S. Korea) 55.1 3.7 59.7 4.2 59.1 4.5 Xiaomi (China) 54.3 3.7 71.0 4.9 61.1 4.7
Lenovo (China) 53.1 3.6 76.3 5.3 95.2 7.3
TCL (China) 38.0 2.6 43.5 3.2 41.4 3.2 Gionee (China) 30.6 2.1 20.0 1.4 19.2 1.5 Meizu (China) 22.0 1.5 20.2 1.4 4.4 0.3 LeEco/Coolpad (China) 21.5 1.5 30.5 2.1 45.2 3.5 Asus (Taiwan) 20.0 1.4 16.0 1.1 5.0 0.4 Others 302.0 20.4 331.5 23.1 342.0 26.3
Total 1480.9 100 1437.3 100 1300.6 100
Source: IC Insights, Gartner, TomiAhonen Phone Book 2016, company reports
2. Smart Phones Market in China
In China's, the world's largest smartphone market, the Top 5 companies have been closely matched competitors
for years. It is not necessarily to be very profitable in China market, however, as most of the competitors in the
world are willing to enlarge their market shares as main goal. 2015 was a critical year for smart phones
companies in China. The first quarter of 2015 was the very first time the sales of smart phones declined. One of
http://ibr.ccsenet.org International Business Research Vol. 10, No. 8; 2017
150
the major reasons was the Penetration of the smart phones in the main cities were over 95%. In 2011, the sales
growth of smart phones in China was 150%, 120 millions units, but kept declining every year and was only 2%
in 2015, 470 millions units. In 2016, the new types of smart phones in China market only 1376 models, down
29.5 % year on year. Counterpoint Research, a leading IT research company, estimate the smart phones
manufacturing companies would down from 300 in 2015 to 150 in near future. On the other hand, the growth
rates of average labor costs in China were 9.1% form 2012 to 2014. The challenge would be higher than even when the demand is declining and cost is increasing sharply.
Table 2. Top 5 Smartphone Companies in China (2014 – 2016) unit: millions
Company 2016
units
Market Share
(%)
2015
units
Market Share
(%)
2014
units
Market Share
(%) OPPO 78.4 16.8 35.3 8.2 22.3 5.3 Huawei 76.6 16.4 62.9 14.6 41.3 9.7
Vivo 69.2 14.8 35.1 8.2 24.1 5.7 Apple 44.9 9.6 58.4 13.6 31.1 7.3 Xiaomi 41.5 8.9 64.9 15.1 57.8 13.6
Others 156.7 33.5 173.3 40.3 247.0 58.3 Total 467.3 100 429.9 100 423.6 100
Source: IDC Qarterly Mobile Phone Tracker
3. Xiaomi Growing by Leaps and Bounds
It is believed that high-quality technology doesn't need to pay high price by the founder and CEO of Xiami Inc,
Mr. Lei Jun. Since 2010, Mr. Lei with 11 co-founders have been creating remarkable hardwares, softwares, and
internet services for their customers, called Mi fans by incorporating their feedback into our products and
services. The logo of Xiaomi, MI, symbolize for “Mobile Internet”, on the other hand, “MI” also has other
meaning, Mission Impossible, since this company challenges something impossible for this industry and rivals.
The logo of MI overturned is “WI”, which means Mi fans can enjoy Xiaomi’s products without trepidation in Chinese.
Xiaomi advertise one of the keys to its success: saving money on commercials in helping keeping the overall
price lower. For Apple’s iPhone, premium starts at around US$700 and it’s about US$ 600 for another rivail ,
Samsung. However, in 2011, Mi 1 has similar functions as its rivials but only sold in half price: US$ 325 (RMB
1999). In 27 September 2016, Xiaomi announced Mi5s, which equipped with Snapdragon 821, 3GB RAM/64GB ROM, 5.15” inch screen with the price same as Mi 1. Xiaomi relied on Mi fans to spread the word in
attracting new customers through social media. Xiaomi mainly use Weibo and MiTalk to be its social media to
connect with fans and prospective customers in China market. Xiaomi has been pro-active in running its own
community forums: MiTalk. This is a social media where the Mi fans meet to discuss devices, share experience
and knowledge, and usually hang out. On Weibo and MiTalk, there are numerous posts on a variety of topics such as feedbacks of products, flash sales, and photo form daily life.
The CEO of Xiaomi, Mr Mr. Lei Jun said the triangle of Mi products and services are: hardware, software,
internet services. In August 2011, Xiaomi released their first smart phone: Mi 1 and received huge success. The
sales of smart phones from 2012 to 2015 were 7.1 millions to 65.6 millions. (See Table 3) The hardware products
for Xiaomi presently include the Mi series, Redmi series, Mi TV, and smart home ecosystem. With more than 65
million smart phones sold in 2015 worldwide, and products launched in Asia (Taiwan, Hong Kong, Singapore,
Malaysia, Philippines, India, and Indonesia) and Americas (USA and Brazil), Xiaomi is planning to expand its
footstep across the world to grow to be a global brand. Creating a first class global company has been a dream
for Mr. Lei, the CEO of Xiaomi. Xiaomi’s organizational culture is: "Just for fans" and it’s company’s belief. Our
Mi fans lead us on the way to “always believe that something wonderful is about to happen”. As a team to
deliver wonderful for fans, we share the same persistent chase of excellence, always refining and improving our
products and services to deliver the best user experience for Mi fans. We are also courageous in testing new
technologies; realize dreams, commitment in innovation, and pushing industrial boundaries into unique Mi products and services with fully supports from Mi fans.
There are five best products in Xiaomi history. Mi4 - is a huge hit from Mi fans. Even today, it has not lost its
significance. This smart phone has a Snapdragon processor 801 with 3 GB RAM, equipped with a 5 "inch
display. Smart phone has recently updated to the latest MIUI V8. However, the most up-to-date flagship smart
phone is Mi 5s, which equipped with Snapdragon processor 821, 4G RAM, 5.15” inch display, and better than
ever camera. Second one would be the earphone, Piston 3 Youth Edition, with excellent sound quality
congregation is most likely the best headset from Xiaomi in terms of CP value. The third one is Smart TV Mi TV
http://ibr.ccsenet.org International Business Research Vol. 10, No. 8; 2017
151
3, was the most feature-rich and hi tech TV. It has an attractive 60 "inch display with 4K resolution. However,
the newest one is Mi TV 3s, which equipped with 65” inch display of 4K resolution, Surround Theater Sound, 64
bit CPU and massive drama programs. The forth one is Mi Band, which is probably the most popular wearable
device in the world. Xiaomi sold 12 million Mi Band in 2015 and 5.8 millions in the first half 2016. Bracelet Mi
Band may trace steps, to inform user about incoming notifications on smart phone, as well as to act as an
intelligent vibration alarm. The final one is Action Camera Xiaomi Yi Sports, which is a protected sport camera
in a case. The Yi camera equipped with 16 mega pixel sensor, F2.8, angle of 155 degrees and resolution of
4608x3456 pixels. Users can record video in Full HD resolutions. Recently, Xiaomi announced the second
generation of Yi sport camera, which provided 4K video recording and 2.19” inch touch screen. In 2016, Xiaomi
changed their policy to use three brand representatives, which believed to gain consumers from OPPO and Vivo. Xiaomi announced their Mi 6 flagship smartphone in April, 2017, hopping to regain its hi-end market shares.
MIUI is the operation system (OS) for Mi smart phones and tablet computers, based on the OS of Google
Android. Since16 August 2010 MIUI launched the vision 1, it has been more than 200 million handsets installed
MIUI ROM and the latest vision is MIUI 8 stated on 22 September 2016. Unlike other smart phone rivals,
Xiaomi provides customized MIUI for to be flashed for other brands such as Samsung, HTC, LG, and Nexus: over 340 model handsets are supported.
Although Xiaomi still is one of the most popular smart phones maker, but overall shipment units are shrinking
quickly. Rivals, Oppo and Vivo grew at a massive 124% and 74% year-on-year, while sales of Xiaomi volumes
decreased by nearly 40%. Most of Xiaomi’s products are sold on line. Most companies use their homepages as
showrooms or online adverts. However, Xiaomi, build its homepage as a purely e-commerce store. Since 2014,
Xiaomi’s homepage has been the third largest, behind Taobao and JD, business-to-consumer (B2C) e-store in
China in terms of sales volume. With the intention of catch up to its tough competitors such as Huawei, Lenovo,
Oppo and Vivo, Xiaomi is going to change once it proud with business model: on-line sale only into opening 1,000 stores in near future.
Global smartphone shipments grew 7% sequentially in Q3 2016. Tarun Pathak, Sr. Analyst at Counterpoint
Research stated that performance in the China, India and US smartphone markets is becoming a determining
issue in the worldwide growth as these three markets now account for more than half of the total shipments
worldwide. Since 2015, Xiaomi is looking to replicate its success in India. Manu Jain, India head of Xiaomi, said
that in the third quarter 2015, Xiaomi crossed sales of 1 million units and repeated this feat in the following
quarter. Xiaomi launched an India-focused smart phone and not only sell through Flipkart, biggest e-store in
India, but also through other channels such as Amazon, Aitel stores. Xiaomi seems to be confident of meeting the
30 per cent local sourcing norm and set up own stores, telecom industry sources said the average value addition
in assembling of mobile handsets in India by foreign players is less than 10 per cent. Indian government is trying
to raise value-addition by foreign smart phone makers in India from less 10 per cent to 30 per cent. By keeping 1
per cent excise duty on domestic assembling factories and 10 per cent customs duty, many foreign smart phone
makers such Foxconn, Asus, Acer, Inventec, Lenovo, and Huawei are building their own Indian factories to
reduce costs. Indian smartphone market has overcame by the top four Chinese rivals: Xiaomi, Lenovo, Oppo and
Vivo, pushing out the Indian players from the list of top 5 in 2016. Chinese players keep strengthening their seize
in Indian smartphone market. In the first quarter of 2017, these Chinese players gained 51.4% of the market in
India with 142.6% growth year-on-year. On the contrary, share of local India rivals deeply dropped to 13.5% in the Q1 2017 from 40.5% in Q1 2016 (See Table 3).
In 2015, Xiaomi started making smart phones in Brazil for local sale, promising to challenge rivals on price in
the first step outside Asia for the world's 4th largest smart phone market. Mr. Hugo Barra, Xiaomi's global
vice-president, said that Brazil was stage one of Latin America launch for Xiaomi, Mexico and Colombia will be
next steps in the Latin America region. Xiaomi's launch in Brazil had been highly expected by consumers who
keened to the company's homepage to secure a smart phone. However, the fundamental e-commerce
infrastructure could not cope with the demand and customers began to lose their attention just less than 12
months after it launched its operations in the Brazilian market. Nearly a year after Xiaomi expanded to first
market outside of Asia: Brazil, it will continue selling smart phone sales in Brazil but stop manufacturing these
phones. It’s a most important slow down for Xiaomi in the world’s fourth-largest smart phone market. The
Brazilan manufacturing of Xiaomi and its partner: Foxconn is going to an end before 2017. Xiaomi’s vice
president of international operations, Hugo Barra, said that the decision is due to constant changes in the regulations for manufacturing and e-commerce tax.
http://ibr.ccsenet.org International Business Research Vol. 10, No. 8; 2017
152
Table 3. Top 5 Smartphone Companies in India (Q12017 – Q22016)
Company Q12017 Market Share (%)
Company Q42016 Market Share (%)
Company Q32016 Market Share
(%)
Company Q22016 Market Share
(%) Samsung 28.1 Samsung 25.1 Samsung 23.0 Samsung 25.1 Xiaomi 14.2 Lenovo 10.7 Lenovo 9.8 Intex 7.1 Lenovo 9.5 Micromax 9.9 Micromax 7.5 Lenovo 7.7 OPPO 9.3 Reliance Jio 8.6 Reliance Jio 7.0 Micromax 12.9 Vivo 10.5 Xiaomi 7.6 Xiaomi 7.4 Reliance Jio 6.8 Others 28.4 Others 38.1 Others 45.3 Others 40.4 Total 100 Total 100 Total 100 Total 100
Source: IDC Qarterly Mobile Phone Tracker
What can Xiaomi do to keep its growth and Competitiveness?
4. Methodology
Data in this paper were collected form open sources such as Apple (2016), Gartner (2016), Huawei (2016), IDC
(2016), OPPO (2016), TrendForce (2016), Vivo (2016), and Xiaomi (2016). We utilized David’s
Strategy-Formulation Analytical Framework with nine matrixes: EFE, IFE, CPM, SWOT, SPACE, BCG, IE,
GSM, and QSPM (David, 2009, 2015). Delphi Method was employed in order to assess the weights and ratings
in the nine matrixes. There were 120 EMBA students participated and discussed this case at a strategic seminar
of one business school in China. The Delphi Method was developed in 1950 by Rand Corporation by a project
supported by USAF in order to seek expert opinions about the strategy selection. The Delphi Method has been broadly utilized to strategic planning (Shiue and Lin, 2013; Murry and Hammons, 1995).
5. Questions
a. Please formulate matrixes for Xiaomi as following:
(1) The External Factor Evaluation (EFE) Matrix
(2) The Internal Factor Evaluation (IFE) Matrix
(3) The Competitive Profile Matrix (CPM)
(4) The Threats-Opportunities-Weakness-Strengths (TOWS) Matrix
(5) The Strategic Position and Action Evaluation (SPACE) Matrix
(6) The BCG Matrix
(7) The Internal-External (IE) Matrix (8) The Grand Strategy Matrix (GSM)
(9) The Quantitative Strategic Planning Matrix (QSPM)
b. What kind of strategy should Xiaomi implement?
6. Strategic planning for Xiaomi
(1) The External Factor Evaluation (EFE) Matrix
An EFE Matrix permits strategists to review and calculate outside impact factors in terms of political,
governmental, legal, cultural, demographic, economic, social, environmental, technological, and competitive
information. Table 4 shows the External Factor Evaluation Matrix for Xiaomi. Overall, Xiaomi receives a 2.8
total weighted score, which indicating it is doing quite well with taking advantage of the external opportunities and avoiding the threats from industry and rivals.
http://ibr.ccsenet.org International Business Research Vol. 10, No. 8; 2017
153
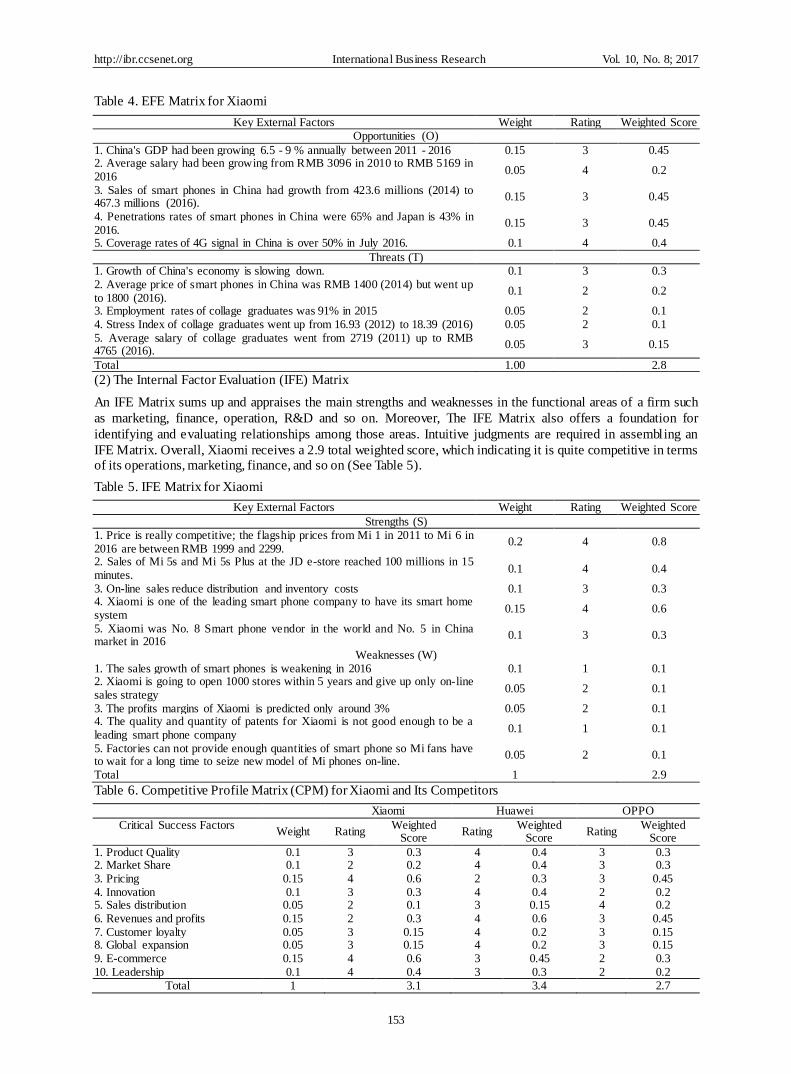
Table 4. EFE Matrix for Xiaomi
Key External Factors Weight Rating Weighted Score Opportunities (O)
1. China's GDP had been growing 6.5 - 9 % annually between 2011 - 2016 0.15 3 0.45 2. Average salary had been growing from RMB 3096 in 2010 to RMB 5169 in 2016
0.05 4 0.2
3. Sales of smart phones in China had growth from 423.6 millions (2014) to 467.3 millions (2016).
0.15 3 0.45
4. Penetrations rates of smart phones in China were 65% and Japan is 43% in 2016.
0.15 3 0.45
5. Coverage rates of 4G signal in China is over 50% in July 2016. 0.1 4 0.4
Threats (T) 1. Growth of China's economy is slowing down. 0.1 3 0.3 2. Average price of smart phones in China was RMB 1400 (2014) but went up to 1800 (2016).
0.1 2 0.2
3. Employment rates of collage graduates was 91% in 2015 0.05 2 0.1 4. Stress Index of collage graduates went up from 16.93 (2012) to 18.39 (2016) 0.05 2 0.1
5. Average salary of collage graduates went from 2719 (2011) up to RMB 4765 (2016).
0.05 3 0.15
Total 1.00 2.8
(2) The Internal Factor Evaluation (IFE) Matrix
An IFE Matrix sums up and appraises the main strengths and weaknesses in the functional areas of a firm such
as marketing, finance, operation, R&D and so on. Moreover, The IFE Matrix also offers a foundation for
identifying and evaluating relationships among those areas. Intuitive judgments are required in assembling an
IFE Matrix. Overall, Xiaomi receives a 2.9 total weighted score, which indicating it is quite competitive in terms of its operations, marketing, finance, and so on (See Table 5).
Table 5. IFE Matrix for Xiaomi
Key External Factors Weight Rating Weighted Score
Strengths (S) 1. Price is really competitive; the flagship prices from Mi 1 in 2011 to Mi 6 in 2016 are between RMB 1999 and 2299.
0.2 4 0.8
2. Sales of Mi 5s and Mi 5s Plus at the JD e-store reached 100 millions in 15 minutes.
0.1 4 0.4
3. On-line sales reduce distribution and inventory costs 0.1 3 0.3 4. Xiaomi is one of the leading smart phone company to have its smart home
system 0.15 4 0.6
5. Xiaomi was No. 8 Smart phone vendor in the world and No. 5 in China market in 2016
0.1 3 0.3
Weaknesses (W) 1. The sales growth of smart phones is weakening in 2016 0.1 1 0.1 2. Xiaomi is going to open 1000 stores within 5 years and give up only on-line sales strategy
0.05 2 0.1
3. The profits margins of Xiaomi is predicted only around 3% 0.05 2 0.1 4. The quality and quantity of patents for Xiaomi is not good enough to be a leading smart phone company
0.1 1 0.1
5. Factories can not provide enough quantities of smart phone so Mi fans have to wait for a long time to seize new model of Mi phones on-line.
0.05 2 0.1
Total 1 2.9
Table 6. Competitive Profile Matrix (CPM) for Xiaomi and Its Competitors
Xiaomi Huawei OPPO
Critical Success Factors Weight Rating
Weighted Score
Rating Weighted
Score Rating
Weighted Score
1. Product Quality 0.1 3 0.3 4 0.4 3 0.3 2. Market Share 0.1 2 0.2 4 0.4 3 0.3
3. Pricing 0.15 4 0.6 2 0.3 3 0.45 4. Innovation 0.1 3 0.3 4 0.4 2 0.2 5. Sales distribution 0.05 2 0.1 3 0.15 4 0.2 6. Revenues and profits 0.15 2 0.3 4 0.6 3 0.45 7. Customer loyalty 0.05 3 0.15 4 0.2 3 0.15 8. Global expansion 0.05 3 0.15 4 0.2 3 0.15 9. E-commerce 0.15 4 0.6 3 0.45 2 0.3 10. Leadership 0.1 4 0.4 3 0.3 2 0.2
Total 1 3.1 3.4 2.7

http://ibr.ccsenet.org International Business Research Vol. 10, No. 8; 2017
154
(3) The Competitive Profile Matrix (CPM)
The Competitive Profile Matrix (CPM) may identify a company’s key rivals. Identifying Critical success factors
is the most important process in constructing the CPM. The most important factors in the Table 6 are “pricing”,
“Revenues and profits” and “E-commerce” as indicated by weights of 0.15. Xiaomi is doing well in “pricing”
and “E-commerce” but scores quite low in “Revenues and profits”. Overall, Xiaomi is quite strong, as indicated by the total weighted score of 3.1, just after Huawei (3.4).
(4) The Strengths-Weakness-Opportunities-Threats (SWOT) Matrix
The Strengths-Weakness-Opportunities-Threats (SWOT) Matrix is an imperative matching implement that
assists managers construct four types of strategies: SO (strengths-opportunities), WO (weaknesses-opportunities),
ST (strengths-threats), and WT (weakness-threats) strategies. First, SO strategies exercise as firm’s inside
strengths to make the most of external opportunities. Second, WO strategies intend at improving internal
weakness by making use of external opportunities. Third, ST strategies exercise a firm’s strengths to keep away
from or decrease the impact of outer threats. Finally, WT strategies are self-protective tactics directed at reducing
inner weakness and avoiding outer threats. Tables 7-1 and 7-2 show the Strengths-Weakness-Opportunities-Threats (SWOT) Matrix for Xiaomi.
Table 7.1. SWOT Matrix for Xiaomi
Strengths (S) Weaknesses (W)
1. Price is really competitive; the flagship prices from Mi 1 in 2011 to Mi 6 in 2016 are between RMB 1999 and 2299.
1. The sales growth of smart phones is weakening in 2016
2. Sales of Mi 5s and Mi 5s Plus at the JD e-store reached 100 millions in 15 minutes.
2. Xiaomi is going to open 1000 stores within 5 years and give up only on-line sales strategy
3. On-line sales reduce distribution and inventory costs 3. The profits margins of Xiaomi is predicted only around 3%
4. Xiaomi is one of the leading smart phone company to have its smart home system
4. The quality and quantity of patents for Xiaomi is not good enough to be a leading smart phone company
5. Xiaomi was No. 8 Smart phone vendor in the world and No.
5 in China market in 2016
5. Factories can not provide enough quantities of smart
phone so Mi fans have to wait for a long time to seize new model of Mi phones on-line.
Opportunities (O) Threats (T) 1. China's GDP had been growing 6.5 - 9 % annually between 2011 - 2016
1. Growth of China's economy is slowing down.
2. Average salary had been growing from RMB 3096 in 2010
to RMB 5169 in 2016
2. Average price of smart phones in China was RMB 1400
(2014) but went up to 1800 (2016). 3. Sales of smart phones in China had growth from 423.6 millions (2014) to 467.3 millions (2016).
3. Employment rates of collage graduates was 91% in 2015
4. Penetrations rates of smart phones in China were 65% and Japan is 43% in 2016.
4. Stress Index of collage graduates went up from 16.93 (2012) to 18.39 (2016)
5. Coverage rates of 4G signal in China is over 50% in July 2016.
5. Average salary of collage graduates went from 2719 (2011) up to RMB 4765 (2016).
Table 7.2. SO-ST-WO-WT Strategies for Xiaomi
SO Strategies WO Strategies
1. Using high-end smart phones to catch customers in USA and European Union.
1. Put money in R&D in order to build up quantity and quality patents.
2. Going to emerging market by selling Red Mi smart phone in order to increase market shares worldwide.
2. Building good relationships with suppliers in order to have enough products on time.
ST Strategies WT Strategies
1. Keep providing low price models of Red Mi phones for young customers in China.
1. Rivals such as OPPO and VIVO have more 200 thousands stores in China, Xiaomi may open thousands stores to sell smart phones soon.
2. Offering higher price models Mi flagship phones, in which price can up to 2999 for high-end user in China.
2. Using low- price models under 100 USD for budget customers in Africa.
3. Cooperating with car firms to enlarge its smart home system into Internet of things.
(5) The Strategic Position and Action Evaluation (SPACE) Matrix
The Strategic Position and Action Evaluation (SPACE) Matrix with four-quadrant framework point out whether
aggressive, conservative, defensive, or competitive strategies are most suitable for given company. The axes of
the SPACE Matrix stand for two internal dimensions (FS: financial strength, and CA: competitive advantage)
http://ibr.ccsenet.org International Business Research Vol. 10, No. 8; 2017
155
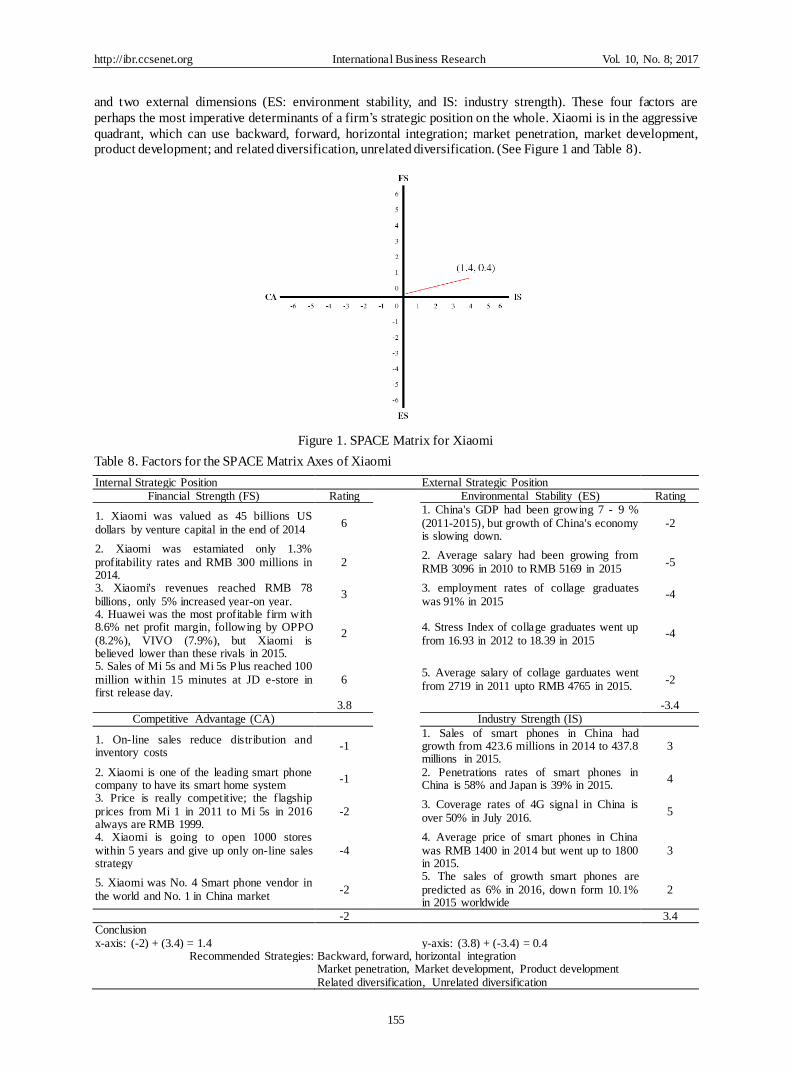
and two external dimensions (ES: environment stability, and IS: industry strength). These four factors are
perhaps the most imperative determinants of a firm’s strategic position on the whole. Xiaomi is in the aggressive
quadrant, which can use backward, forward, horizontal integration; market penetration, market development, product development; and related diversification, unrelated diversification. (See Figure 1 and Table 8).
Figure 1. SPACE Matrix for Xiaomi
Table 8. Factors for the SPACE Matrix Axes of Xiaomi
Internal Strategic Position External Strategic Position Financial Strength (FS) Rating Environmental Stability (ES) Rating
1. Xiaomi was valued as 45 billions US dollars by venture capital in the end of 2014
6
1. China's GDP had been growing 7 - 9 %
(2011-2015), but growth of China's economy is slowing down.
-2
2. Xiaomi was estamiated only 1.3% profitability rates and RMB 300 millions in 2014.
2 2. Average salary had been growing from RMB 3096 in 2010 to RMB 5169 in 2015
-5
3. Xiaomi's revenues reached RMB 78 billions, only 5% increased year-on year.
3 3. employment rates of collage graduates was 91% in 2015
-4
4. Huawei was the most profitable firm with 8.6% net profit margin, following by OPPO (8.2%), VIVO (7.9%), but Xiaomi is believed lower than these rivals in 2015.
2 4. Stress Index of collage graduates went up from 16.93 in 2012 to 18.39 in 2015
-4
5. Sales of Mi 5s and Mi 5s P lus reached 100 million within 15 minutes at JD e-store in first release day.
6 5. Average salary of collage garduates went from 2719 in 2011 upto RMB 4765 in 2015.
-2
3.8 -3.4 Competitive Advantage (CA) Industry Strength (IS)
1. On-line sales reduce distribution and inventory costs
-1 1. Sales of smart phones in China had growth from 423.6 millions in 2014 to 437.8 millions in 2015.
3
2. Xiaomi is one of the leading smart phone company to have its smart home system
-1 2. Penetrations rates of smart phones in China is 58% and Japan is 39% in 2015.
4
3. Price is really competitive; the flagship prices from Mi 1 in 2011 to Mi 5s in 2016 always are RMB 1999.
-2 3. Coverage rates of 4G signal in China is over 50% in July 2016.
5
4. Xiaomi is going to open 1000 stores within 5 years and give up only on-line sales strategy
-4 4. Average price of smart phones in China was RMB 1400 in 2014 but went up to 1800 in 2015.
3
5. Xiaomi was No. 4 Smart phone vendor in the world and No. 1 in China market
-2 5. The sales of growth smart phones are predicted as 6% in 2016, down form 10.1% in 2015 worldwide
2
-2 3.4
Conclusion x-axis: (-2) + (3.4) = 1.4 y-axis: (3.8) + (-3.4) = 0.4
Recommended Strategies: Backward, forward, horizontal integration Market penetration, Market development, Product development Related diversification, Unrelated diversification
http://ibr.ccsenet.org International Business Research Vol. 10, No. 8; 2017
156
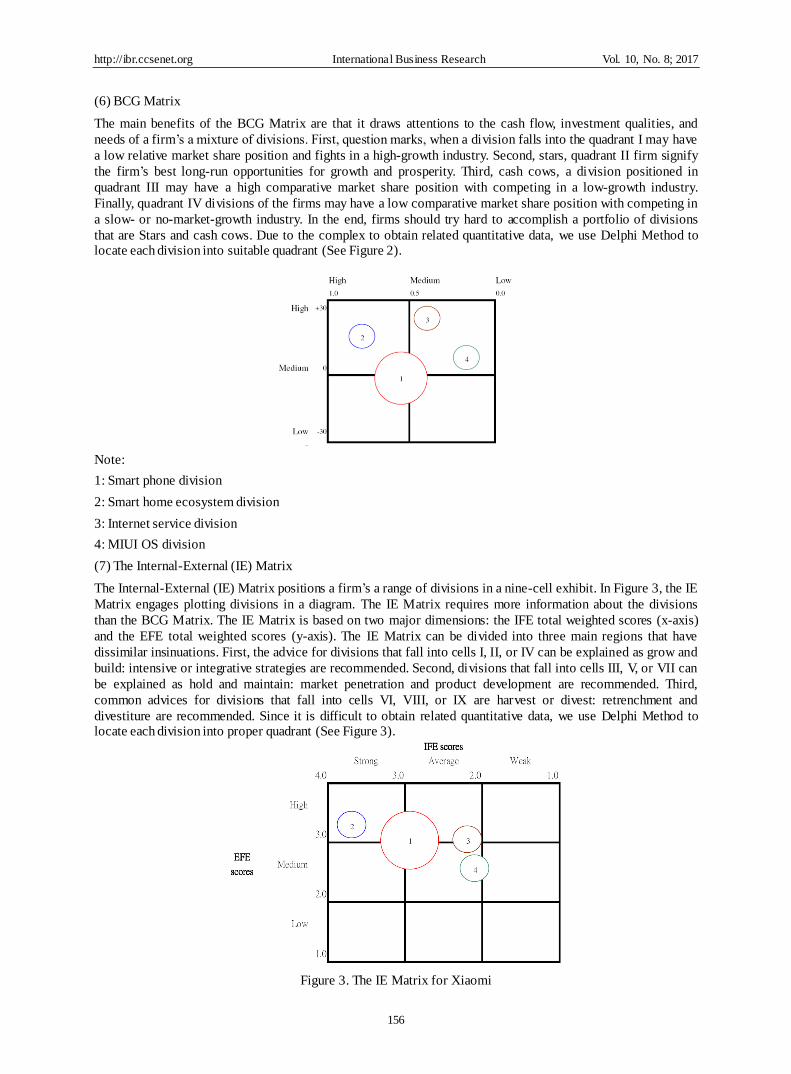
(6) BCG Matrix
The main benefits of the BCG Matrix are that it draws attentions to the cash flow, investment qualities, and
needs of a firm’s a mixture of divisions. First, question marks, when a division falls into the quadrant I may have
a low relative market share position and fights in a high-growth industry. Second, stars, quadrant II firm signify
the firm’s best long-run opportunities for growth and prosperity. Third, cash cows, a division positioned in
quadrant III may have a high comparative market share position with competing in a low-growth industry.
Finally, quadrant IV divisions of the firms may have a low comparative market share position with competing in
a slow- or no-market-growth industry. In the end, firms should try hard to accomplish a portfolio of divisions
that are Stars and cash cows. Due to the complex to obtain related quantitative data, we use Delphi Method to locate each division into suitable quadrant (See Figure 2).
Figure 2. The BCG Matrix for Xiaomi
Note:
1: Smart phone division
2: Smart home ecosystem division
3: Internet service division
4: MIUI OS division
(7) The Internal-External (IE) Matrix
The Internal-External (IE) Matrix positions a firm’s a range of divisions in a nine-cell exhibit. In Figure 3, the IE
Matrix engages plotting divisions in a diagram. The IE Matrix requires more information about the divisions
than the BCG Matrix. The IE Matrix is based on two major dimensions: the IFE total weighted scores (x-axis)
and the EFE total weighted scores (y-axis). The IE Matrix can be divided into three main regions that have
dissimilar insinuations. First, the advice for divisions that fall into cells I, II, or IV can be explained as grow and
build: intensive or integrative strategies are recommended. Second, divisions that fall into cells III, V, or VII can
be explained as hold and maintain: market penetration and product development are recommended. Third,
common advices for divisions that fall into cells VI, VIII, or IX are harvest or divest: retrenchment and
divestiture are recommended. Since it is difficult to obtain related quantitative data, we use Delphi Method to locate each division into proper quadrant (See Figure 3).
Figure 3. The IE Matrix for Xiaomi
http://ibr.ccsenet.org International Business Research Vol. 10, No. 8; 2017
157
Note:
1: Smart phone division
2: Smart home ecosystem division
3: Internet service division
4: MIUI OS division
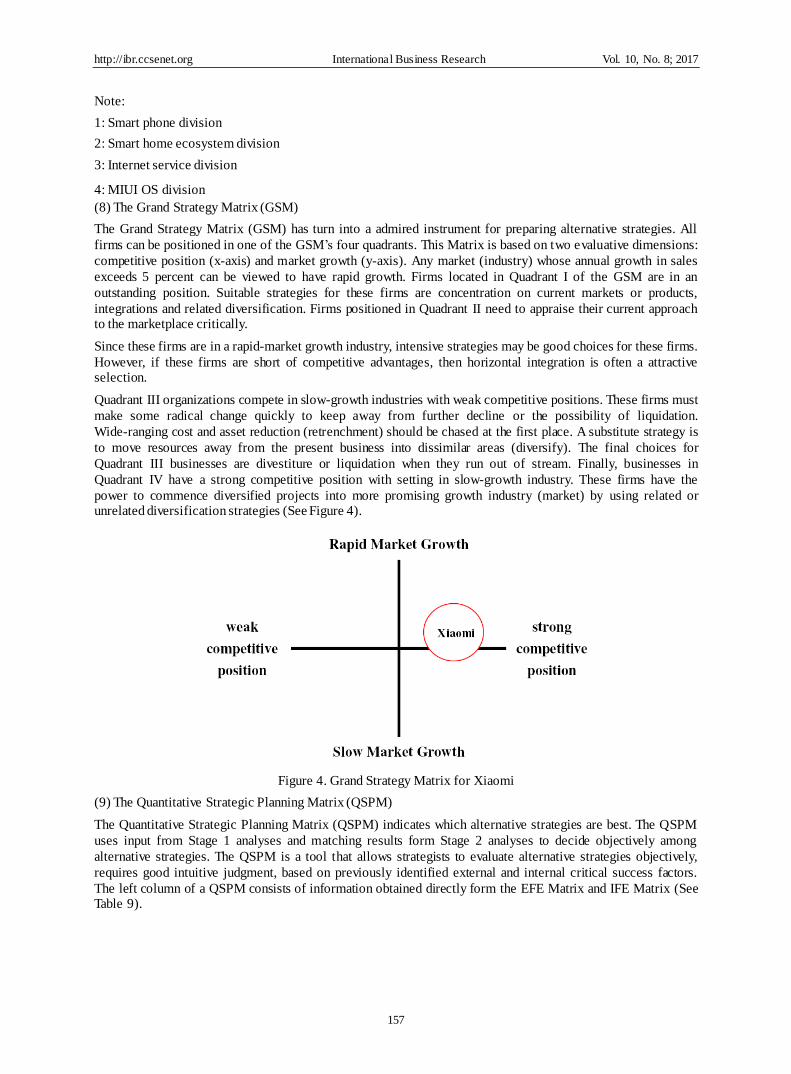
(8) The Grand Strategy Matrix (GSM)
The Grand Strategy Matrix (GSM) has turn into a admired instrument for preparing alternative strategies. All
firms can be positioned in one of the GSM’s four quadrants. This Matrix is based on two evaluative dimensions:
competitive position (x-axis) and market growth (y-axis). Any market (industry) whose annual growth in sales
exceeds 5 percent can be viewed to have rapid growth. Firms located in Quadrant I of the GSM are in an
outstanding position. Suitable strategies for these firms are concentration on current markets or products,
integrations and related diversification. Firms positioned in Quadrant II need to appraise their current approach to the marketplace critically.
Since these firms are in a rapid-market growth industry, intensive strategies may be good choices for these firms.
However, if these firms are short of competitive advantages, then horizontal integration is often a attractive selection.
Quadrant III organizations compete in slow-growth industries with weak competitive positions. These firms must
make some radical change quickly to keep away from further decline or the possibility of liquidation.
Wide-ranging cost and asset reduction (retrenchment) should be chased at the first place. A substitute strategy is
to move resources away from the present business into dissimilar areas (diversify). The final choices for
Quadrant III businesses are divestiture or liquidation when they run out of stream. Finally, businesses in
Quadrant IV have a strong competitive position with setting in slow-growth industry. These firms have the
power to commence diversified projects into more promising growth industry (market) by using related or unrelated diversification strategies (See Figure 4).
Figure 4. Grand Strategy Matrix for Xiaomi
(9) The Quantitative Strategic Planning Matrix (QSPM)
The Quantitative Strategic Planning Matrix (QSPM) indicates which alternative strategies are best. The QSPM
uses input from Stage 1 analyses and matching results form Stage 2 analyses to decide objectively among
alternative strategies. The QSPM is a tool that allows strategists to evaluate alternative strategies objectively,
requires good intuitive judgment, based on previously identified external and internal critical success factors.
The left column of a QSPM consists of information obtained directly form the EFE Matrix and IFE Matrix (See Table 9).

http://ibr.ccsenet.org International Business Research Vol. 10, No. 8; 2017
158
Table 9. Quantitative Strategic Planning Matrix for Xiaomi
Market
development Product
development Related
diversification
Key Factors Weight AS TAS AS TAS AS TAS
Opportunities (O)
1. China's GDP had been growing 6.5 - 9 % annually between 2011 - 2016
0.15 4 0.6 2 0.3 3 0.45
2. Average salary had been growing from RMB 3096 in 2010 to RMB 5169 in 2016
0.05 3 0.15 4 0.2 2 0.1
3. Sales of smart phones in China had growth from 423.6
millions (2014) to 467.3 millions (2016). 0.15 4 0.6 1 0.15 2 0.3
4. Penetrations rates of smart phones in China were 65% and Japan is 43% in 2016.
0.15 4 0.6 2 0.3 3 0.45
5. Coverage rates of 4G signal in China is over 50% in July 2016. 0.1 3 0.3 2 0.2 4 0.4
Threats (T) 1. Growth of China's economy is slowing down. 0.1 4 0.4 2 0.2 3 0.3 2. Average price of smart phones in China was RMB 1400 (2014) but went up to 1800 (2016).
0.1 3 0.3 4 0.4 2 0.2
3. Employment rates of collage graduates was 91% in 2015 0.05 4 0.2 1 0.05 3 0.15 4. Stress Index of collage graduates went up from 16.93 (2012) to 18.39 (2016)
0.05 3 0.15 1 0.05 4 0.2
5. Average salary of collage graduates went from 2719 (2011) up to RMB 4765 (2016).
0.05 3 0.15 4 0.2 2 0.1
1.00
Strengths (S) 1. Price is really competitive; the flagship prices from Mi 1 in 2011 to Mi 6 in 2016 are between RMB 1999 and 2299.
0.2 3 0.6 4 0.8 2 0.4
2. Sales of Mi 5s and Mi 5s Plus at the JD e-store reached 100 millions in 15 minutes.
0.1 3 0.3 4 0.4 2 0.2
3. On-line sales reduce distribution and inventory costs 0.1 4 0.4 3 0.3 2 0.2
4. Xiaomi is one of the leading smart phone company to have its smart home system
0.15 3 0.45 2 0.3 4 0.6
5. Xiaomi was No. 8 Smart phone vendor in the world and No. 5 in China market in 2016
0.1 4 0.4 2 0.2 3 0.3
Weaknesses (W)
1. The sales growth of smart phones is weakening in 2016 0.1 3 0.3 2 0.2 4 0.4 2. Xiaomi is going to open 1000 stores within 5 years and give up
only on-line sales strategy 0.05 3 0.15 4 0.2 2 0.1
3. The profits margins of Xiaomi is predicted only around 3% 0.05 3 0.15 2 0.1 4 0.2 4. The quality and quantity of patents for Xiaomi is not good enough to be a leading smart phone company
0.1 3 0.3 4 0.4 2 0.2
5. Factories can not provide enough quantities of smart phone so Mi fans have to wait for a long time to seize new model of Mi phones on-line.
0.05 4 0.2 2 0.1 3 0.15
1.00 Total 1.00 6.7 5.05 5.4
7. Suggestions
In Table 9, three alternative strategy types: (1) market development, (2) product development, and (3) related
diversification are being considered by Xiaomi. Note by sum total attractiveness scores of (1) market
development: 6.7, (2) product development: 5.05, (3) related diversification: 5.4 that the analysis indicates the
firm should first implement market development, and then carry out related diversification in terms of cooperate- level strategies.
Once we make sure the order of strategy types, we may go back to SWOT Matrix to find what kind of
SO-ST-WO-WT strategies can be performed. There are two SO strategies can be utilized: (1) using high-end
smart phones to catch customers in USA and European Union, and (2) going to emerging market by selling Red
Mi smart phone in order to increase market shares worldwide; one WT strategy can be exercised: Using low-
price models under 100 USD for budget customers in Africa. These strategies are classified as market
development. Second, one ST strategy: cooperating with car firms to enlarge its smart home system into Internet
of things is categorized into related diversification, which may be considered to put into effect after three market development strategies.
According to the results from BCG Matrix and IE Matrix, the division level strategies are as following: the first
Smart phone division may use (1) Product Development and Market Development. Second, Smart home
http://ibr.ccsenet.org International Business Research Vol. 10, No. 8; 2017
159
ecosystem division may use (1) Product Development, (2) Market Development, (3) Market Penetration, and (4)
Integration. Third, Internet service division may use (1) Product Development, (2) Market Development, and (3) Market Penetration. Finally, MIUI OS division may use (1) Product Development, and (2) Market Penetration.
Acknowledgment
This research was presented at the 2017 AIB Meeting in Dubai. We are thankful to the three anonymous reviewers for their insightful comments and suggestions.
References
Ansoff, I. (1987). Strategic Management of Technology. Journal of Business Strategy, 7(3), 28-39. https://doi.org/10.1108/eb039162
Biggadike, R. (1981). The Contribution of Marketing to Strategic Management. Academy of Management Review, 6(4), 621-632.
Camphell, A., & Yeung, S. (1991). Creating a Sense of Mission. Long Range Planning, 24(4), 10-20. https://doi.org/10.1016/0024-6301(91)90002-6
Chen, M. J. (1996). Competitor Analysis and Interfirm Rivalry: Toward a Theoretical Integration, Academy of Management Review, 21(1), 100-134.
David, F. (1986). The Strategic Planning Matrix – A Quantitative Approach. Long Range Planning, 19(5), 102-107. https://doi.org/10.1016/0024-6301(86)90015-4
David, F. (1988). How Companies Define Their Mission. Long Range Planning, 22(3), 90-97.
David, F. (2009). Strategic Management: Concepts, 12e, NJ: Parson.
David, F. (2015). Strategic Management: A Competitive Advantage Approach, Concepts & Cases, 15e, NY: Pearson.
Drucker, P. (1974). Management: Tasks, Responsibilities, and Practices, NY: Harper & Row.
Freund, Y. (1988). Critical Success Factors. Planning Review, 16(4), 20-23. https://doi.org/10.1108/eb054225
Harris, J., Shaw, R. J., & Sommers, W. (1983). The Strategic Management of Technology. Planning Review, 11(11), 28-35. https://doi.org/10.1108/eb054013
King, W. (1983). Integrating strength-weakness analysis into strategic planning. Journal of Business Research, 2(4), 475-487. https://doi.org/10.1016/0148-2963(83)90006-1
Murry, J. W., Jr. & Hammons, J. O. (1995). Delphi: A Versatile Methodology for Conducting Qualitative Research. Review of Higher Education, 18(4), 423-436. https://doi.org/10.1353/rhe.1995.0008
Okoli, C., & Pawlowski, S. (2004). The Delphi method as a research tool: an example, design considerations and applications. Information & Management, 42(1), 15-29. https://doi.org/10.1016/j.im.2003.11.002
Parnell, J. (2003). Five Critical Challenges in Strategy Making. SAM Advanced Management Journal, 68(2), 15-22.
Schein, E. H. (1996). Three Cultures of Management: The Key to Organizational Learning. Sloan Management Review, 38(1), 9-20.
Shiue, Y., Liu, H., & Lin, C. (2013). Strategy alignment of value system based on core value by integrating the
delphi method, dialectic method and important-performance analysis. Journal of Accounting, Finance & Management Strategy, 8(1), 69-95.
Tilles, S. (1963). How to Evaluate Corporate Strategy. Harvard Business Review, 41(4), 111-121.
Weihrich, H. (1982). The TOWS Matrix: A Tool for Situational Analysis. Long Range Planning, 15(2), 54-66. https://doi.org/10.1016/0024-6301(82)90120-0
Apple (2016) http://www.apple.com/
Gartner (2016) http://www.gartner.com/
Huawei (2016) http://www.huawei.com
IDC (2016) http://www.idc.com/
OPPO (2016) http://www.oppo.com/
TrendForce (2016) http://www.trendforce.com/
http://ibr.ccsenet.org International Business Research Vol. 10, No. 8; 2017
160
Vivo (2016) http://www.vivoglobal.com/
Xiaomi (2016) http://xiaomi-mi.com
Copyrights
Copyright for this article is retained by the author(s), with first publication rights granted to the journal.
This is an open-access article distributed under the terms and conditions of the Creative Commons Attribution license (http://creativecommons.org/licenses/by/4.0/).


![Smart phones[1]](https://static.fdocuments.in/doc/165x107/547bdf54b37959582b8b4e4c/smart-phones1.jpg)


