STRATEGIC PLAN FOR THE DEPARTMENT OF ... - National … budget/2003/Strategic... · 1.4 The...
68
1 STRATEGIC PLAN FOR THE DEPARTMENT OF HEALTH FOR THE 2003 MTEF PERIOD PART A 1. INTRODUCTION AND SIGN OFF BY THE MINISTER AND HEAD OF DEPARTMENT 1.1 The strategic plan for the 2003 MTEF period is a continuation of that of the previous period, with emphasis on improving service delivery in line with provincial priorities. 1.2 Of note is the fact that the Departmental Strategic Positioning Statement has now been compiled. This sets out in detail the services, which the Department, given adequate funding, will be required to deliver by 2010. This document provides the basis of the Departmental strategic planning and provides information on the needs of the population and links the budgeting and strategic service delivery processes. 1.3 The Department is faced with many challenges, one being the impact of HIV/AIDS on service delivery. The anticipated long term effect of this pandemic has been taken into account in the Strategic Positioning Statement. The pandemic has a number of serious implications for health care delivery in KwaZulu-Natal: • Skills shortages: The high prevalence amongst the productive age group implies a further loss of skilled health care workers. Already figures indicate an increase in deaths amongst KwaZulu-Natal health workers. Females in the 25-29 year age group are most at risk indicating an increase in nursing staff shortages. The cost of training personnel to replace attrition losses due to HIV/AIDS, has been taken into account in the any strategic planning process. • Increased health care demand due to opportunistic infections in patients with HIV/AIDS: The TB prevalence in KwaZulu-Natal is showing signs of increasing. A higher incidence rate, lower cure rate, higher incidence of multi-drug resistance cases, as well as a higher case fatality rate are all possible effects of the HIV/AIDS pandemic. • An increased number of maternal HIV/AIDS orphans: This vulnerable group will, apart from the social welfare requirements, place increasing demands on health care due to malnutrition, and poverty-related diseases.
Transcript of STRATEGIC PLAN FOR THE DEPARTMENT OF ... - National … budget/2003/Strategic... · 1.4 The...

1
STRATEGIC PLAN FOR THE DEPARTMENT OF
HEALTH FOR THE 2003 MTEF PERIOD
PART A
1. INTRODUCTION AND SIGN OFF BY THE MINISTER AND HEAD OF
DEPARTMENT
1.1 The strategic plan for the 2003 MTEF period is a continuation of that of the previous period, with emphasis on improving service delivery in line with provincial priorities.
1.2 Of note is the fact that the Departmental Strategic Positioning Statement has now
been compiled. This sets out in detail the services, which the Department, given adequate funding, will be required to deliver by 2010. This document provides the basis of the Departmental strategic planning and provides information on the needs of the population and links the budgeting and strategic service delivery processes.
1.3 The Department is faced with many challenges, one being the impact of HIV/AIDS
on service delivery. The anticipated long term effect of this pandemic has been taken into account in the Strategic Positioning Statement. The pandemic has a number of serious implications for health care delivery in KwaZulu-Natal:
• Skills shortages:
The high prevalence amongst the productive age group implies a further loss of skilled health care workers. Already figures indicate an increase in deaths amongst KwaZulu-Natal health workers. Females in the 25-29 year age group are most at risk indicating an increase in nursing staff shortages. The cost of training personnel to replace attrition losses due to HIV/AIDS, has been taken into account in the any strategic planning process.
• Increased health care demand due to opportunistic infections in
patients with HIV/AIDS:
The TB prevalence in KwaZulu-Natal is showing signs of increasing. A higher incidence rate, lower cure rate, higher incidence of multi-drug resistance cases, as well as a higher case fatality rate are all possible effects of the HIV/AIDS pandemic.
• An increased number of maternal HIV/AIDS orphans:
This vulnerable group will, apart from the social welfare requirements, place increasing demands on health care due to malnutrition, and poverty-related diseases.

2
• An increase in infant and child mortality and a decrease in life expectancy.
1.4 The Department continues to be guided by its Vision and Mission:
VISION
The vision of the Department is to achieve optimal health status for all persons in the Province of KwaZulu-Natal.
MISSION
To develop a sustainable, co-ordinated and comprehensive health system at all levels based on the Primary Health Care approach through the District Health System.
In accordance with the above, the aim of the Strategic Plan for the 2003 Medium Term Expenditure Framework period is to continue to give impetus to the drive for improved service delivery to meet the needs of the people of this Province, especially the poor and underserved in the peri-urban and rural communities. In addition, the Department will continue striving to establish an integrated, accessible, affordable, equitable, efficient and cost effective health service within the Province as envisaged in the Strategic Positioning Statement.
1.5 As indicated by our signatures below, we as Minister of Health and Head of the
KwaZulu-Natal Department of Health, confirm that we have participated in the compilation of this strategic plan and that we are fully committed to ensuring its implementation.
…………………………………… …………………………………………. DR Z. MKHIZE PROF. R.W. GREEN-THOMPSON MINISTER OF HEALTH HEAD OF DEPARTMENT KWAZULU-NATAL DEPARTMENT OF HEALTH
KWAZULU-NATAL 2. LEGISLATIVE AND OTHER MANDATES
The core functions of the Department of Health are to provide information, education and actions in order to prevent the occurrence of disease; and in the event of disease, to provide appropriate and cost-effective curative care. In carrying out these functions, the department is governed by, inter alia, the following Acts, rules and regulations:
• The Constitution of the Republic of South Africa, 1996, (Act 109 of 1996) • National Health Act (Act No.63 of 1977) • Mental Health Act (Act 18 of 1973) • Provincial Health Act, 2000 (Act 4 of 2000)
3
• Public Finance Management Act (Act 1 of 1999 ) and Treasury Regulations • Division of Revenue Act • Public Service Act and Public Service Regulations • KwaZulu-Natal Procurement Act 2001 (Act 3 of 2001)
3. POLICIES, PRIORITIES AND STRATEGIC GOALS
The Department of Health will continue to apply the following policy priorities in the 2003/04 Budget period:
3.1 KEY POLICY PRIORITIES OR SHIFTS THAT SHOULD BE TAKEN INTO ACCOUNT IN THE 2003/04 BUDGET
The following policy priorities are taken into consideration in this strategic plan
and the budgeting process:
a. Ensuring that the emphasis on prevention of disease is given high priority;
b. Ensuring that HIV/AIDS and tuberculosis are given specific attention;
c. The continued development and upgrading of basic services in the under-served areas through the primary health care approach to ensure equity of access;
d. Ensuring that quality services are provided at all its institutions,
especially at clinics; e. A shift towards equity allocation between the Districts; f. Maintaining the present services at lower cost; g. Expanding the Emergency Medical Rescue Services into the underserved
areas of the Province.
3.2 POLICY OPTIONS THAT ARE PROPOSED IN LINE WITH DEPARTMENTAL MEDIUM TERM POLICY PRIORITIES No new policy options are proposed but the following policies introduced in 2002 are in the process of being rolled out throughout the Province:
• The roll-out of the Counselling and Voluntary Testing for HIV/AIDS; • The roll-out of, and sustaining the programme to prevent the
transmission of HIV/AIDS from mother to child; • The continuation of the establishment of Crisis Centres throughout
the province: • The provision of anti-retroviral drugs to rape survivors. • The increase in the intake of student nurses to combat the high
attrition rate.
3.3 CONTINUATION OF POLICIES STILL IN EXISTENCE

4
The following policies, which have been introduced since 1995, will be continued in the 2003 MTEF period:
• Implementation of Primary Health Care through the District Health System;
• The immunisation of all newborns and children; • Continuation with the appointment of Community Services Doctors,
Community Services Pharmacists, Community Services Dentists, as well as other Community Services professionals;
• A major drive is in place in respect of the management of HIV/AIDS. Special funds have been set aside to establish/extend certain projects which include Hospice programmes, Drop-In Centres, voluntary Aids testing, promotional material and media releases;
• The use of Community Health Workers to disseminate information on health promotion at grass roots level;
• Continuation of a vigorous capital works and maintenance programme in an effort to upgrade facilities;
• Provision of an Integrated Nutrition Scheme; • Improved financial discipline and revenue generation.
3.4 STRATEGIC GOALS
The strategic goals, which the Department has formulated for the improvement of service delivery within the 2003 Medium Term Expenditure Framework period are in line with the Provincial priorities and the National Health ten-point plan.
3.4.1 The goals of the National Health’s ten point plan are as follows:
• Improving quality of care • Reinforcing the Primary Health Care and District Health System
approach • Decreasing morbidity and mortality Rates • Revitalisation of hospital services • Improving resource mobilisation and management of resources
without neglecting the attainment of equity in resource allocation • Improving human resource management and human resource
development • Reorganisation of support services • Improving communication and consultation with the Health services
and between the Health System and communities • Legislative reform • International co-operation in conjunction with and through the
National Department of Health.
3.4.2 The Provincial priorities are listed below:
• Reducing poverty and inequality • Investing in infrastructure • Re-engineering service delivery • Addressing the impact of HIV/AIDS • Strengthening governance • Human capability development.

5
3.4.3 In summary, this Department’s goals for the current year and the 2003
Medium Term Expenditure Framework are:
• To continue to provide and improve the quality of health care in the Province;
• To continue to enhance Primary Health Care services through the
District Health System approach with special emphasis on underserved areas;
• To continue with the vigorous campaign in regard to HIV/AIDS and
the roll-out of the CVT and the PMTCT programmes, as well as the introduction and provision of anti-retrovirals to rape survivors;
• To continue to strive towards decreasing morbidity and mortality
rates, especially amongst infants and mothers and to encourage preventative rather than curative treatment;
• To continue investing in the health infrastructure through the Clinic
Upgrading and Building Programme and the revitalisation of hospital facilities;
• Working towards resource mobilisation and management of
resources to attain equity in resource allocation; • Striving towards improving Human Resource Management and
Human Resource Development through the training of sufficient personnel to meet the needs of the Department;
• To continue to improve access to Support Services through effective
monitoring and improved distribution systems; • To continue to encourage and improve communication and
consultation with the Health services and between the Health System and Communities;
The more detailed descriptions of the objectives falling under the above goals will be discussed in detail under Part B of this Strategic Plan.
5. SECTORAL SITUATION ANALYSIS
5.1 SUMMARY OF SERVICE DELIVERY ENVIRONMENT AND CHALLENGES
The provision of Health Services in KwaZulu- Natal influences and is in turn influenced by a number of factors. The following resume is a broad analysis of the service delivery environment in which the Department operates, taking into consideration the external factors that have/may impact on the demand for its services, as well as those factors that have/may affect its ability to provide services.
Information from the Provincial Budget Statements for the 2002/03 financial year and other sources indicates that KwaZulu-Natal is the most populous province in South
6
Africa, with the second largest poverty gap in the country. This reveals grossly insufficient resources and an inability to provide adequate services of a reasonable quality, resulting in, inter alia, more expenditure for health care. (Appendix 1 details the demographic and socio-economic profile of the Province).
In order to meet its service delivery demands, this Department is faced with many challenges for the 2003 MTEF period, the major one being that of HIV/AIDS. It is essential that a more efficient and cost-effective way be found to manage the crisis in this Province. The current cost of managing HIV/AIDS and its concomitant opportunistic diseases especially tuberculosis, is becoming crippling. Currently patients, suffering from end-stage disease are being maintained in expensive, high care beds resulting in uneconomical use of funding.
The Strategic Positioning Statement has identified a more sustainable method of managing this problem through the re-categorisation of bed types within the District Health Service. It is intended that this policy should be put in place from the 2003/04 financial year. The provision of hospice step-down beds, and increasing the number of TB, and longterm care beds will result in a far more effective, efficient and economical management of funds. Although this process will require additional funding, the savings in the longterm would outweigh the initial expenditure.
The Department is currently initiating this policy for the management of HIV/AIDS and it is anticipated that positive progress will be made in the current financial year and the 2003 Medium Term Expenditure Framework period.
Other challenges which have, and will continue to have an impact on the service delivery of the Department during the current financial year and the 2003 MTEF period are, inter alia:
• the provision of sufficient clinics and Community Health Centres to
meet the needs of the Province; • the expansion of the Emergency Medical Rescue Services to those
areas of the Province where access is extremely poor or non-existent;
• the need to improve and maintain the health infrastructure in a safe and acceptable condition within the limited funds provided;
• the management of malaria and waterborne diseases;
• skills shortages in the Professional cadres resulting from HIV/AIDS
and personnel emigrating to other countries as well as a shortage of Community Health Workers;
• the provision of adequate plant, safe medical equipment and
sufficient medicines taking into consideration the high foreign exchange rate in relation to the Rand, as well as the probability of increased medical inflation within the local market environment;
• supporting the policy of accommodating tenders from small
businesses, which results in increased costs to the department. 5.2 SUMMARY OF ORGANISATIONAL ENVIRONMENT AND CHALLENGES

7
The Department is faced with a number of challenges relating to the internal environment, the main one being the lack of capacity in the management and professional cadres. A gap analysis has indicated acute shortages of medical personnel, especially nurses. The Department is addressing this issue by increasing the intake of nurses and providing bursaries in the required categories. Other organisational matters include:
• Improving Resource mobilisation and management of resources without neglecting the attainment of equity in resource allocation;
• Reorganisation of Support services to meet the challenge of devolving
procurement functions to the institutions, improved distribution of drugs and other stock items, as well as improving information systems.
The above information is discussed in more detail under the Strategic Goals of the Department in Part B. An organogram and maps indicating the organisational boundaries, i.e. health District boundaries are attached as annexures to the Plan.
5.3 DESCRIPTION OF THE STRATEGIC PLANNING PROCESS
5.3.1 The Department is aware of the importance of encouraging participation in the formulation of it medium and long-term goals in providing a health service in the Province. To this end, various mechanisms have been put in place to encourage participation by personnel and the community.
5.3.2 The strategic planning process for the 2003/04 MTEF period commenced with the
formulation of the Strategic Positioning Statement. The process followed included wide participation with all service delivery components in all the Districts, as well as senior management at Head Office. The Strategic Positioning Statement provides an overview through sophisticated assumptions of the long-term trends, envisaged requirements and challenges to the Department in 2010.
5.3.3 The Strategic Positioning Statement has addressed possible ways of effecting more
cost-effective patient management in hospitals by introducing different categories of beds at lower levels of nursing care. In the long-term, this will result in savings, making the provision of health services more affordable. The strategic planning process for 2003/04 has as a guideline the Strategic Positioning Statement principles and findings, which will influence future strategic plans to a greater extent than the present one.
5.3.4 The strategic planning process in this Department incorporates managers from all the institutions, districts and service delivery components and is used to inform the budgeting process of the Department. Once a year, the health managers, including the NGO’s from the districts and the members of the Health Portfolio Committee participate in an exercise whereby the Department’s activities are prioritised according to a set of approved criteria. During 2001/02 a Strategic Planning and Resource Committee was set up in each district in order to strengthen the bond between service delivery planning and the financial planning process.
5.3.5 Based on the above exercise, the Department’s Activities for the 2003/04 are set out below in priority order. The figures shown in brackets reflect the 2002 ranking.

8
1. Clinics and Mobile Clinic Services (1) These facilities are the first level of Primary Health Care and provide services mainly to those patients who do not require admission to a more sophisticated facility.
2. Health Promotion (7)
Through communication, this service/activity encourages the general population to live more healthy lifestyles, thereby playing a preventative rather than a curative role in health management.
3. Community Health Centre Services (3)
These facilities provide a 24-hour health care service and have a doctor in attendance. They provide facilities for, inter alia, childbirth and those cases that cannot be treated at the clinic level, but do not necessarily require hospitalisation for more than 24 hours.
4. Clinic Building and Upgrading Programme (2)
This programme is specifically geared to provide access to health services in the underserved areas of the Province and to upgrade the present clinic infrastructure.
5. HIV/AIDS : Awareness and Prevention (4)
KwaZulu-Natal has the highest incidence of HIV/AIDS in South Africa. This service provides for the special programmes for education in and the prevention of HIV/AIDS.
6. District Hospital Services (8)
These facilities cater for patients who require admission to a hospital for treatment at a general practitioner level.
7. Environmental Health (10) This service ensures that, inter alia, the standards of food, domestic housing, water supplies, sanitation and refuse management are maintained in order to provide a safe environment for the general population. The inspection of ports and border posts, also fall under this activity.
8. Communicable Disease Control (5)

9
This service/activity is aimed at improving the awareness and control of communicable diseases and covers immunisation of children for, inter alia, polio, measles and HIB.
9. Community-Based Care (New)
This service is aimed at the provision of health services by Community Health Workers and other community health care-givers. The service will play an increasingly important role in combating HIV/AIDS and TB as well as playing a role in the health promotion campaigns of the Department.
10. Training and Education (HRD) (6)
This service/activity provides training for doctors, nursing and ambulance personnel, health workers and personnel in health management, administration and health promotion.
11. HIV/AIDS: PMTCT and CVT (New)
The PMTCT activity is aimed at high level intervention to prevent transmission of HIV/AIDS from HIV positive mothers to their babies. The intervention per se is not the main cost driver of this programme but a holistic approach, which includes counselling, follow-up systems, formula feeding and family counselling. The aim of the CVT programme is to make the population aware of their HIV status to ensure that planning can be done effectively to deal with the problems and challenges associated with HIV/AIDS in the broader sense, taking into consideration the socio-economic implications.
12. Integrated Nutrition Services (11)
This service/activity supports a number of feeding schemes for the poor providing supplementary nutrition in order to prevent diseases that accompany inadequate nutrition.
13. Regional Hospital Services (12)
These services cater for those patients who need admission to hospital for treatment at specialist level.
14. TB Hospitalisation (9)
This activity provides hospitalisation for patients especially suffering from resistant strains of tuberculosis as well as those who become TB infected as a result of HIV/AIDS.
15. Emergency Medical Rescue Services (14)
This service provides emergency transport and paramedic personnel for victims of, inter alia, trauma, maternity, motor vehicle and other accidents.
10
16. Patient Transport Services (13)
This service/activity provides transport to indigent patients who have no other means of transport.
17. Maintenance of Buildings and Equipment (15)
This activity ensures the maintenance of existing buildings and equipment in order to avoid the necessity for major works and replacements at a later stage.
18. Malaria Control (16)
Malaria is endemic in parts of the Province of KwaZulu-Natal and its incidence is monitored and controlled by means of this service.
19. Central Hospital Services (18)
This service provides the facilities and expertise needed for sophisticated medical procedures as well as a platform for training health workers.
20. Mental Health Hospitalisation (17)
This activity provides facilities for those patients requiring psychiatric care and psychological management. This also includes the management of substance abuse.
21. Convalescent Hospitalisation (19)
This service/activity provides facilities for those patients who require nursing care with minimal supervision by doctors. It is becoming increasingly important because of the increased HIV/AIDS incidence necessitating care for the terminally ill.

11
PART B
BUDGET PROGRAMME AND SUB-PROGRAMME PLANS 6.1 INTRODUCTION TO PART B:
This section of the Strategic plan details the planning of the individual budget programmes and sub-programmes.
6.2 STRATEGIC GOALS AND OBJECTIVES
The strategic objectives, which drive the budgeting process are indicated under the relevant strategic goals mentioned in Part A of this Strategic Plan. 6.2.1 Strategic Goal 1: Improving Quality of Care
Strengthening and reaffirming the Batho Pele programme in the Department, incorporating the principles in the Patient’s Charter, health and safety at work and the care and consideration of the disabled.
Improving management at all levels of health services.
Developing and implementing clinical management guidelines, with clinical audits
at all facilities based on uniform health indicators for the Province.
Strengthening the Quality Improvement Programme in institutions and training health personnel in strategies to improve the quality of care rendered.
6.2.2 Strategic Goal 2: Management of HIV/AIDS
Continuing with the campaign against HIV/AIDS and rollout of the CVT and PMTCT programmes.
Introduction and provision of anti-retrovirals to rape survivors.
6.2.3 Strategic Goal 3: Primary Health Care and District Health System
Monitoring and evaluating the package of services which has been put into place for the Clinics and Community Health Centres.
Continue implementation of the package of services for the District Hospitals.
Continue training staff in appropriate clinical and non-clinical skills to provide
required package of services.
Continue to put in place and monitor referral systems with reference to the level of care.
Monitoring to ensuring that the quality of service is maintained.

12
Provision of Primary Health Care services in underserved areas.
Roll-out of community based care.
6.2.4 Strategic Goal 4: Decreasing Morbidity and Mortality Rates and Improving Health Status:
Interdepartmental/intersectoral collaboration will be encouraged, especially with
regard to provision of safe water and sanitation.
Combat infant morbidity and mortality resulting from:
- Poor nutrition - Diarrhoeal Diseases - Trauma - Infectious diseases
Combat maternal morbidity and mortality by encouraging ante-natal visits to
clinics.
Improve general health status of the population through preventative rather than curative treatment of trauma, HIV/AIDS, cholera and malaria, and management of substance abuse.
6.2.5 Strategic Goal 5: To continue investing in the Health Infrastructure and the
Revitalisation of Health Services:
Provision of clinics in underserved areas.
Improve maintenance of hospital and clinic facilities.
Replacement of obsolete/broken equipment through the medical equipment replacement programme.
Improve decentralisation of hospital management and capacity building.
Consolidating levels of care and referral patterns.
Changing levels of service in terms of the Strategic Positioning Statement by
introducing Acute Step-down beds and Hospice Step-down beds, which will result in more cost-effective management of patients.
A Government to government initiative has been undertaken with Cuba to provide
Cuban Doctors, which will continue to have a positive impact. 6.2.6 Strategic Goal 6: Improving Human Resource Development
Ensuring the provision of sufficient nurses, pharmacists and medical staff for future needs by providing funds for bursaries and doubling the intake of nurses at the colleges, and introducing internships for the different therapies.
A Government initiative has been undertaken with Cuba to train South African
medical students in Cuba to assist with the shortage of professional personnel.

13
6.2.7 Strategic Goal 7: Rationalisation of High Level Services
• Tertiary and Central Health Services, presently taking place at various institutions will be rationalised and consolidated at Inkosi Albert Luthuli Central Hospital and Grey’s Hospital. This will assist in pooling the scarce resources and will result in the optimal utilisation of expensive equipment.
ORGANISATIONAL MANAGEMENT
In order to support the strategic objectives for the improvement of service delivery, it is intended that the following organisational plans be continued during the Medium Term Expenditure Framework period.
6.2.8 Strategic Goal 8: Improving Resource Mobilisation and Management of
Resources without neglecting the attainment of Equity in Resource Allocation
Optimising the balance between personnel and other operational expenditure.
Optimising the utilisation of physical resources.
Optimising an equitable and efficient use of resources.
The Department is continually enforcing optimal utilisation of its resources in terms of the Employment Equity Act and the Public Service Guidelines. Special attention is also given to institutional performance management and to employee assistance programmes.
6.2.9 Strategic Goal 9: Reorganisation of Support Services
The Province has transferred its Procurement System and is in the process of devolving and delegating some of these improved procurement functions to institutional management.
The supply of drugs and other stores items is being improved through effective
monitoring and improved distribution systems.
The Department is also in the process of improving its health information systems, telemedicine, as well as its managerial electronic requirements.

14
7. PROGRAMME AND SUB-PROGRAMME PLANS
The Department continues through its budgeting and strategic planning process to make progress in achieving the strategic goals set out above. To this end the Strategic Positioning Statement will form the basis for improving the delivery of health care services in an effective, efficient and economical manner. The Strategic positioning Statement, which has been implemented in the current financial year will guide the strategic planning process to an increasing extent over the future financial years. Each Programme is discussed below, with emphasis being placed on the service delivery and training programmes. Historical data includes expenditure and estimates from 2000/01 until 2005/06 the final year of the current Medium Term Expenditure Framework period.
7.1 TRENDS IN PROVINCIAL PUBLIC HEALTH EXPENDITURE
The following tables reflect the global trends in Provincial Public Expenditure in both current and constant prices. TABLE 1: EVOLUTION OF EXPENDITURE BY PROGRAMME AND SUB-PROGRAMME – NOMINAL TERMS
Average Year 1 Year 2 Year 3 AveragePROGRAMMES Year - 2 Year - 1 Base year annual 2003/04 2004/05 2005/06 annual
2000/01 2001/02 2002/03 change (budget) (MTEF (MTEF change(actual) unaudited Adj.budget (%) projection) projection (%)
R ' 000 R ' 000 R ' 000 R ' 000 R ' 000 R ' 000
Programme 1: Administration 103,783 133,468 144,677 154,082 164,897 176420Programme 2: District Health Services 2,734,315 3,326,700 3,630,479 3,545,788 3,839,391 4095290Programme 3: Emergency Medical Services 154,158 158,336 182,981 243,355 260,437 278636Programme 4: Provincial Hospital Services 1,730,950 2,020,760 1,904,271 2,398,214 2,566,553 2745898Programme 5: Central Health Services 639,081 556,323 920,713 755,383 808,406 864895Programme 6: Health Sciences and Training 174,367 210,109 232,461 278,039 297,555 318348Programme 7: Health Care Support Services - - 5,000 1 1 1Programme 8: Health Facilities Management 234,771 624,071 398,598 430,978 461,229 493459TOTAL PROGRAMMES 5,771,425 7,029,767 7,419,180 7,805,840 8,398,469 8,972,947

15
TABLE 2: EVOLUTION OF EXPENDITURE BY PROGRAMME AND SUB-PROGRAMME – REAL TERMS
Average Year 1 Year 2 Year 3 AveragePROGRAMMES Year - 2 Year - 1 Base year annual 2003/04 2004/05 2005/06 annual
2000/01 2001/02 2002/03 change (budget) (MTEF (MTEF change(actual) (actual) Adj. Budget (%) projection) projection (%)R ' 000 R ' 000 R ' 000 R ' 000 R ' 000 R ' 000 R ' 000
Programme 1: Administration 111,878 142,143 144,677 145,635 148,824 152,612 Programme 2: District Health Services 2,947,592 3,542,936 3,630,479 3,351,406 3,465,154 3,542,638 Programme 3: Emergency Medical Services 166,182 168,628 182,981 230,014 235,051 241,035 Programme 4: Provincial Hospital Services 1,865,964 2,152,109 1,904,271 2,266,743 2,316,384 2,375,344 Programme 5: Central Hospital Services 688,929 592,484 920,713 713,973 729,608 748,179 Programme 6: Health Sciences and Training 187,968 223,766 232,461 262,797 268,551 275,388 Programme 7: Health Care Support Services 5,000 1 1 1 Programme 8: Health Facilities Management 253,083 664,636 398,598 407,352 416,272 426,868
7.2 PROGRAMME 1: ADMINISTRATION
AIM: To provide funds for conducting the overall management of the Department.
7.2.l SUB-PROGRAMME: OFFICE OF THE PROVINCIAL MINISTER Objective: Policy formulation by the Minister and the Department’s Management.
Outputs: To ensure that Health Services are rendered in terms of approved policies to the people of KwaZulu-Natal
7.2.2. SUB-PROGRAMME: MANAGEMENT Objective: Organising the Department of Health, managing its personnel and Financial management services.
Output: To co-ordinate comprehensive health care services in the Province of

16
KwaZulu-Natal.
Sub-Programme Year -2 Year - 1 Base year Average Year 1 Year 2 Year 3 Average 2000/01 2001/02 2002/03 annual 2003/04 2004/05 2005/06 annual(actual) unaudited Adj. Estimate change (budget) (MTEF (MTEF change
(%)² projection) projection) (%)31. Office of the Provincial Minister 2,636 2,974 4,214 4,622 4,946 5,292 2. Management 101,147 130,502 140,463 148,898 159,389 170,566 Total programme 103,783 133,476 144,677 - 153,520 164,335 175,858 -
Table 7.2.2: Evolution of expenditure by budget programme and sub-programme (R million) Real Terms
Sub-Programme Year -2 Year - 1 Base year Average Year 1 Year 2 Year 3 Average 2000/01 2001/02 2002/03 annual 2003/04 2004/05 2005/06 annual(actual) unaudited Adj. Estimate change (budget) (MTEF (MTEF change
(%)² projection) projection) (%)31. Office of the Provincial Minister 2,842 3,167 4,214 4,369 4,464 4,578 2. Management 109,036 138,985 140,463 140,735 143,853 147,548 Total programme 111,878 142,152 144,677 - 145,104 148,317 152,126 - 7.2.3 Expenditure Trends
It is the stated policy of the Department to keep the funding provided for this programme to a maximum of 2% of the total budget allocation. This has been achieved and the percentages remained more or less constant over the period under review.

17
The increase in the expenditure trend from 2000/01 to 2001/02 was mainly due to the improvement of conditions of service Personal profiles as well as the devolution of functions from the Department of Works to maintain Natalia building as well as funds from the Department of Finance for the payment of Auditor General fees. The Department will remain within the revised budget allocation for the 2002/03 financial year.
7.2.4 This is a staff function and no specific performance indicators have been developed.
7.3 DISTRICT HEALTH SERVICES
AIM: To render primary health care services.
7.3.l SUB-PROGRAMME: DISTRICT MANAGEMENT Objective: Service planning, administration, co-ordination and monitoring of district health services, Including those rendered by District Councils and non-governmental organisations.
Output : To ensure that Health Services are rendered in terms of approved policies to the people of the relevant District.
7.3.2 SUB-PROGRAMME: COMMUNITY HEALTH CLINICS
Objective: To render primary health care services outside hospitals.
Output: To provide the first contact to health services to patients within a reasonable distance from their residences.
7.3.3. SUB-PROGRAMME: COMMUNITY HEALTH CENTRES
Objective: To render primary health care services outside hospitals.

18
Output: To provide the first contact to health services to patients within areasonable distance from their residences.
7.3.4 SUB-PROGRAMME : COMMUNITY BASED SERVICES
Objective: To render primary health care services for home-based care, the treatment of abuse, crisis and trauma victims as well as those patients treated by Community Health Workers.
Output: The provision of effective home-based care, treatment of abused and other trauma victims as well as the promotion of personal health.
7.3.5 SUB-PROGRAMME : OTHER COMMUNITY SERVICES
Objective: To render services for the management of environmental health including malaria, as well as specific medical programmes, for example communicable diseases and health promotion.
Output: The effective management of environmental health including malaria and other health programmes, such as communicable diseases and health promotion.
7.3.6 SUB-PROGRAMME : HIV/AIDS
Objective: To render primarily health care services mainly related to the prevention of HIV/AIDS.
Output: An effective HIV/AIDS awareness campaign and the prevention of the spread of HIV/AIDS through specific projects, such as counselling and voluntary testing, and the prevention of mother to child transmission of the virus.
7.3.7 SUB-PROGRAMME : NUTRITION
Objective: To render services directed at providing nutrition for the malnourished members of the population, especially school children.
Output: A decrease in the malnourished members of the population, especially school children.

19
7.3.8 SUB-PROGRAMME : CORONER SERVICES
Objective: This sub-programme has been created pending the transfer of all forensic services to the provinces. At present the Department is only providing the post-mortem services which includes the provision of information and support in inquests and suspected unnatural deaths.
Output: Carrying out post mortem and forensic laboratory services required in all cases of suspected unnatural deaths.
7.3.9 SUB-PROGRAMME: DISTRICT HOSPITAL SERVICES Objective: Rendering of hospital services at general practitioner level.
Output: To provide for patients who require admission to a hospital for treatment at a general practitioner level.

20
Table 7.3.1: Evolution of expenditure by budget programme and sub-programme (Rmillion) Nominal Terms
Sub-Programme Year -2 Year - 1 Base year Average Year 1 Year 2 Year 32000/01 2001/02 2002/03 annual 2003/04 2004/05 2005/06(actual) (unaudited) Adj. Estimate change (budget) (MTEF (MTEF
(%)² projection) projection)
2.1 District Management 26,056 31,689 42,856 50,303 53,834 57,596 2. 2 Community HealthClinics 624,615 732,585 810,602 833,544 892,054 954,389 2.3 Community Health Centres 114,683 136,224 147,938 176,994 189,418 202,654 2.4 Community Based Services 47,743 64,911 71,145 72,613 77,710 83,140 2.5. Other Community Services 204,137 310,401 164,962 197,405 211,261 226,024 2.6. HIV/AIDS 30,403 49,364 143,313 246,523 289,843 300,869 2.7 Nutrition 128,454 168,550 169,565 184,000 215,612 227,518 28. Coroner Services - - - - - - - 2.9 District Hospitals 1,558,224 1,832,976 2,080,098 1,784,406 1,909,659 2,043,101 Total programme 2,734,315 3,326,700 3,630,479 - 3,545,788 3,839,391 4,095,291
21
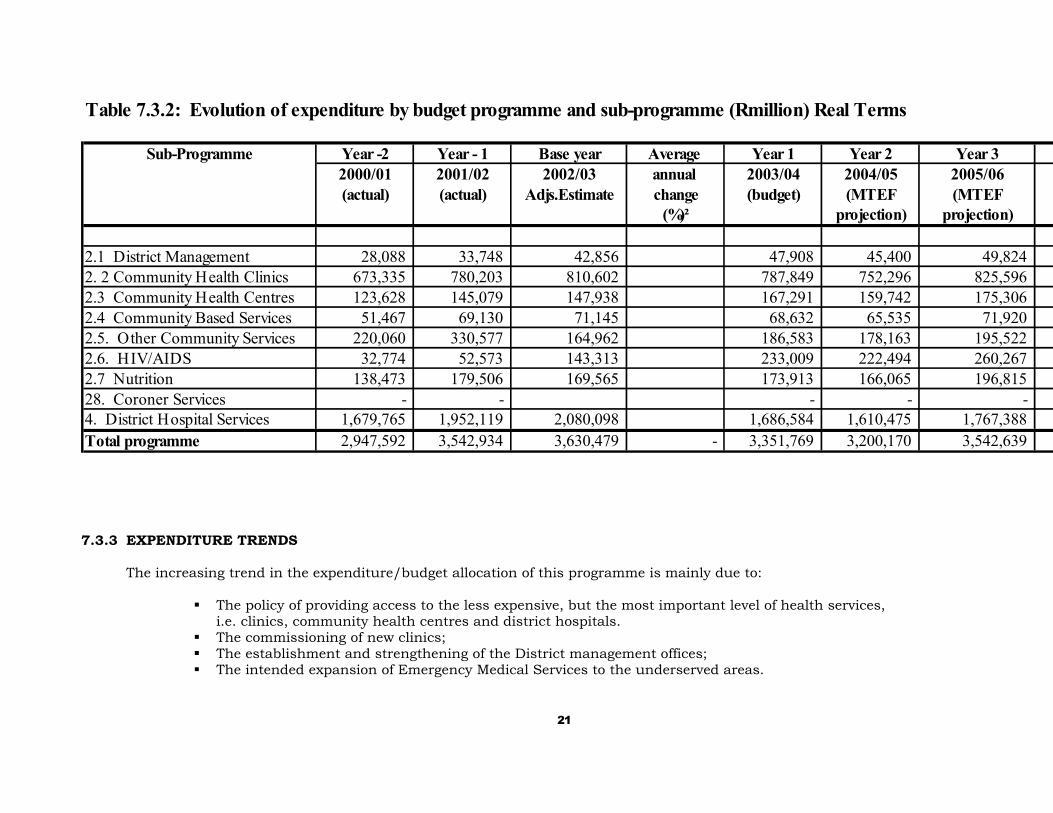
Table 7.3.2: Evolution of expenditure by budget programme and sub-programme (Rmillion) Real Terms
Sub-Programme Year -2 Year - 1 Base year Average Year 1 Year 2 Year 32000/01 2001/02 2002/03 annual 2003/04 2004/05 2005/06(actual) (actual) Adjs.Estimate change (budget) (MTEF (MTEF
(%)² projection) projection)
2.1 District Management 28,088 33,748 42,856 47,908 45,400 49,824 2. 2 Community Health Clinics 673,335 780,203 810,602 787,849 752,296 825,596 2.3 Community Health Centres 123,628 145,079 147,938 167,291 159,742 175,306 2.4 Community Based Services 51,467 69,130 71,145 68,632 65,535 71,920 2.5. Other Community Services 220,060 330,577 164,962 186,583 178,163 195,522 2.6. HIV/AIDS 32,774 52,573 143,313 233,009 222,494 260,267 2.7 Nutrition 138,473 179,506 169,565 173,913 166,065 196,815 28. Coroner Services - - - - - 4. District Hospital Services 1,679,765 1,952,119 2,080,098 1,686,584 1,610,475 1,767,388 Total programme 2,947,592 3,542,934 3,630,479 - 3,351,769 3,200,170 3,542,639
7.3.3 EXPENDITURE TRENDS The increasing trend in the expenditure/budget allocation of this programme is mainly due to:
The policy of providing access to the less expensive, but the most important level of health services, i.e. clinics, community health centres and district hospitals.
The commissioning of new clinics; The establishment and strengthening of the District management offices; The intended expansion of Emergency Medical Services to the underserved areas.

22
This programme was projecting an over-expenditure due to the following expenditure pressures which also will effect the expenditure in the future years:
The implementation of the new policy directive to rollout the prevention of the transmission of HIV/AIDS from Mother-to-Child (PMTCT).
The effect of the weakening Rand on the acquisition of medicine and equipment. To provide medical care for escalating HIV/AIDS patients at district hospital level. Supporting the policy of allocating contracts to SMME’S. Pressure to unfreeze frozen posts due to work pressure. The increase in the fuel price.
Additional funds have been provided in the revised estimates relieving the pressure on this programme.
2.2 Community Health Clinics Number of headcounts at anTo provide facilities for patients to be average of 2.8 per member oftreated at Primary Health Care Level. the indigent population (7,323 million)p.a. 15,745,172 17,321,000
2.2 Community Health Centres Number of headcounts at an 1,736,480 1,910,000To provide facilities for patients to be average of 2.8 per member oftreated at Primary Health Care Level. the indigent population (7,323 million)p.a.
2.9 District Hospitals Number of admissions to be maintainedat present levels or reduced. 275,598 275,598
23
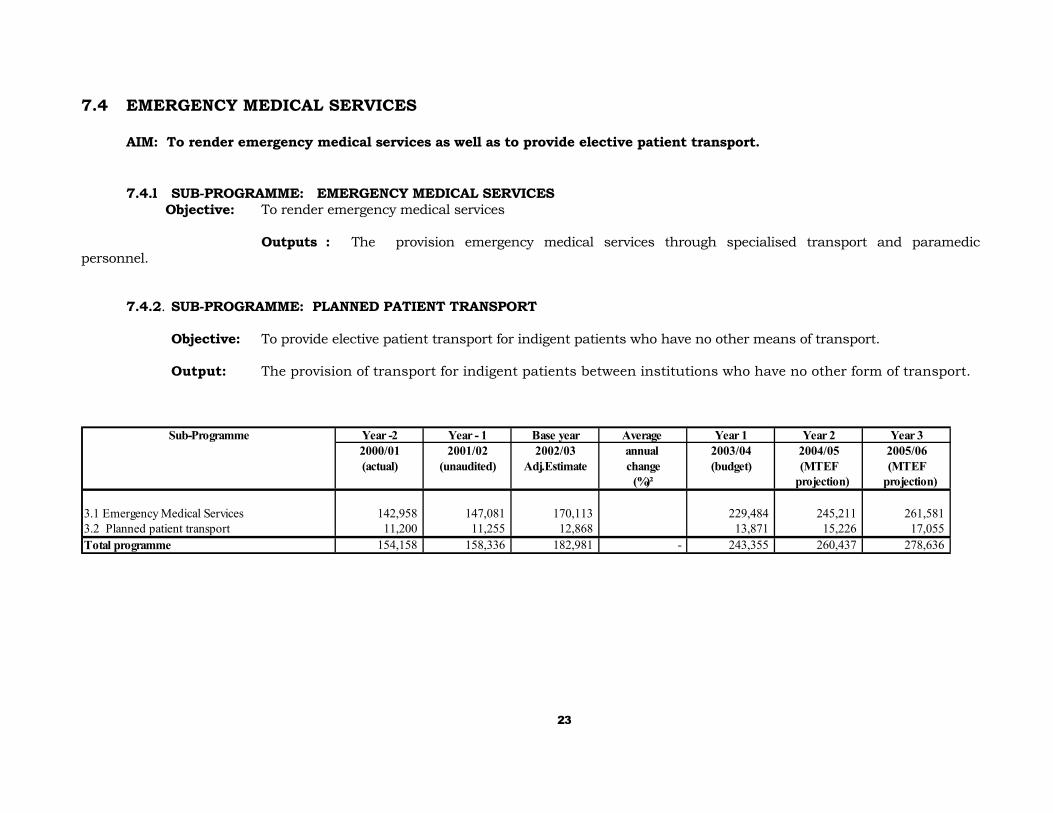
7.4 EMERGENCY MEDICAL SERVICES
AIM: To render emergency medical services as well as to provide elective patient transport.
7.4.l SUB-PROGRAMME: EMERGENCY MEDICAL SERVICES Objective: To render emergency medical services
Outputs : The provision emergency medical services through specialised transport and paramedic personnel.
7.4.2. SUB-PROGRAMME: PLANNED PATIENT TRANSPORT Objective: To provide elective patient transport for indigent patients who have no other means of transport.
Output: The provision of transport for indigent patients between institutions who have no other form of transport.
Sub-Programme Year -2 Year - 1 Base year Average Year 1 Year 2 Year 32000/01 2001/02 2002/03 annual 2003/04 2004/05 2005/06(actual) (unaudited) Adj.Estimate change (budget) (MTEF (MTEF
(%)² projection) projection)
3.1 Emergency Medical Services 142,958 147,081 170,113 229,484 245,211 261,581 3.2 Planned patient transport 11,200 11,255 12,868 13,871 15,226 17,055 Total programme 154,158 158,336 182,981 - 243,355 260,437 278,636

24
Table 7.4.2: Evolution of expenditure by budget programme and sub-programme (Rmillion) Real Terms
Sub-Programme Year -2 Year - 1 Base year Average Year 1 Year 2 Year 32000/01 2001/02 2002/03 annual 2003/04 2004/05 2005/06(actual) (unaudited) Adj.Estmate change (budget) (MTEF (MTEF
(%)² projection) projection)
3.1 Emergency Medical Services 154,109 156,641 170,113 216,904 221,310 226,281 3.2 Planned patient transport 12,074 11,987 12,868 13,111 13,742 14,753 Total programme 166,182 168,628 182,981 - 230,014 235,051 241,035 7.4.3 EXPENDITURE TRENDS The increasing trend in the expenditure/budget allocation of this programme is mainly due to the intended expansion and upgrading of Emergency Medical Services to the underserved areas.
This programme was projecting an over-expenditure due to the following expenditure pressures which also will effect the expenditure in the future years:
The increase in the fuel price. The effect of the foreign exchange rate on the acquisition of equipment. Pressure to unfreeze frozen posts due to work pressure.
Additional funds have been provided in the revised estimates relieving the pressure on this programme.
7.5 PROVINCIAL HOSPITAL SERVICES
AIM: To render general hospital services at a regional level.
7.5.1 SUB-PROGRAMME: GENERAL HOSPITALS Objective: To provide hospital facilities for those patients that require treatment at Specialist level. Output: The provision of specialist hospital services for those patients that require treatment at Specialist level.

25
7.5.2 SUB-PROGRAMME: TUBERCULOSIS HOSPITALS
Objective: To provide hospital facilities for those patients who require admission for tuberculosis.
Output: The hospital services for the treatment of tuberculosis including the treatment of Multi Drug Resistant patients.
7.5.3 SUB-PROGRAMME: PSYCHIATRIC HOSPITALS
Objective: To provide hospital facilities for those patients requiring mental health care.
Output: The rendering of hospital services to mentally ill patients including the management of substance abuse. .
7.5.4 SUB-PROGRAMME: CHRONIC MEDICAL HOSPITALS (LONGTERM)
Objective: To provide hospital facilities for those patients requiring long term nursing care.
Output: The rendering of hospital services to patients requiring long term nursing care.
7.5.5 SUB-PROGRAMME: DENTAL TRAINING HOSPITALS
Objective: To provide dental health services and to provide a platform for the training of health workers.
Output: To render dental health services and to provide training for oral health personnel.
26
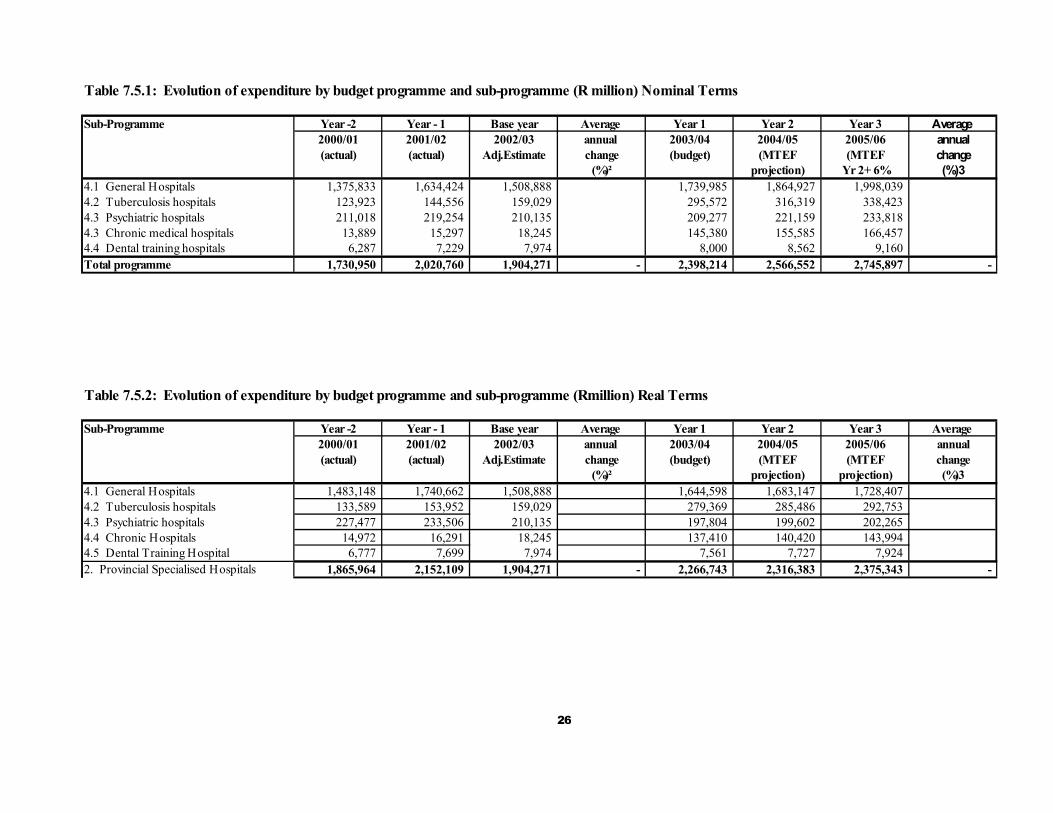
Table 7.5.1: Evolution of expenditure by budget programme and sub-programme (R million) Nominal Terms
Sub-Programme Year -2 Year - 1 Base year Average Year 1 Year 2 Year 3 Average 2000/01 2001/02 2002/03 annual 2003/04 2004/05 2005/06 annual(actual) (actual) Adj.Estimate change (budget) (MTEF (MTEF change
(%)² projection) Yr 2+ 6% (%)34.1 General Hospitals 1,375,833 1,634,424 1,508,888 1,739,985 1,864,927 1,998,039 4.2 Tuberculosis hospitals 123,923 144,556 159,029 295,572 316,319 338,423 4.3 Psychiatric hospitals 211,018 219,254 210,135 209,277 221,159 233,818 4.3 Chronic medical hospitals 13,889 15,297 18,245 145,380 155,585 166,457 4.4 Dental training hospitals 6,287 7,229 7,974 8,000 8,562 9,160 Total programme 1,730,950 2,020,760 1,904,271 - 2,398,214 2,566,552 2,745,897 - Table 7.5.2: Evolution of expenditure by budget programme and sub-programme (Rmillion) Real Terms
Sub-Programme Year -2 Year - 1 Base year Average Year 1 Year 2 Year 3 Average 2000/01 2001/02 2002/03 annual 2003/04 2004/05 2005/06 annual(actual) (actual) Adj.Estimate change (budget) (MTEF (MTEF change
(%)² projection) projection) (%)34.1 General Hospitals 1,483,148 1,740,662 1,508,888 1,644,598 1,683,147 1,728,407 4.2 Tuberculosis hospitals 133,589 153,952 159,029 279,369 285,486 292,753 4.3 Psychiatric hospitals 227,477 233,506 210,135 197,804 199,602 202,265 4.4 Chronic Hospitals 14,972 16,291 18,245 137,410 140,420 143,994 4.5 Dental Training Hospital 6,777 7,699 7,974 7,561 7,727 7,924 2. Provincial Specialised Hospitals 1,865,964 2,152,109 1,904,271 - 2,266,743 2,316,383 2,375,343 -

27
7.5.3 EXPENDITURE TRENDS
Although there is an increase in the expenditure trends over the past three years, funds have been moved to the more appropriate levels of service (District Health Services) in accordance with Departmental policy. However, this movement in monetary terms has been negated by the improvements to conditions of service, inflation and the poor performance of the Rand on international markets, especially in respect of medicines, medical equipment and plant, mainly used at this level of service. An over expenditure in this Programme was projected for the current financial year, which will also have an effect on the future MTEF years:
Increased pressure on specialised TB facilities as a result of HIV/AIDS. Performance of the Rand on international markets and its influence on the cost of medicine, medical equipment
and general inflation. Supporting the policy of allocating contract to SMME’s.
Additional funds have been provided in the revised estimates relieving the pressure on this programme.

28
Table:7.5.3 PROGRAMME 4: OBJECTIVES, OUTPUTS, MEASURES AND TARGETSProgramme Structure Performance 2001/02 2002/03 2003/04 2004/05 2005/06Measurable Objectives measures Actual Estimated Target Target Target
(quantitiy,quality,cost,timeliness)
4.1 General HospitalsTo provide hospital facilities for those Number of admissions to bepatients that require treatment at maintained at present levels or specialist level. reduced. 274,064 275,000
4.2 Tuberculosis hospitals Number of admissions to beTo provide hospital facilities for those patients increased resulting from HIV.AIDS 4,852 5,400 that require treatment for tuberculosis.
4.3 Psychiatric hospitals Number of admissionsTo provide hospital facilities for those patients to be increased in rural areas 4,362 4,800 that require mental health care
4.4 Chronic Medical Hospitals (Longterm) Number of admissions to be To provide hospital facilities for those patients that increased as a result of HIV/AIDS 1,198 1,220 longterm care
4.5 Dental training hospitalsTo render dental health services and Number of cases to be increased 47,880 52,700 to provide training for dental
29
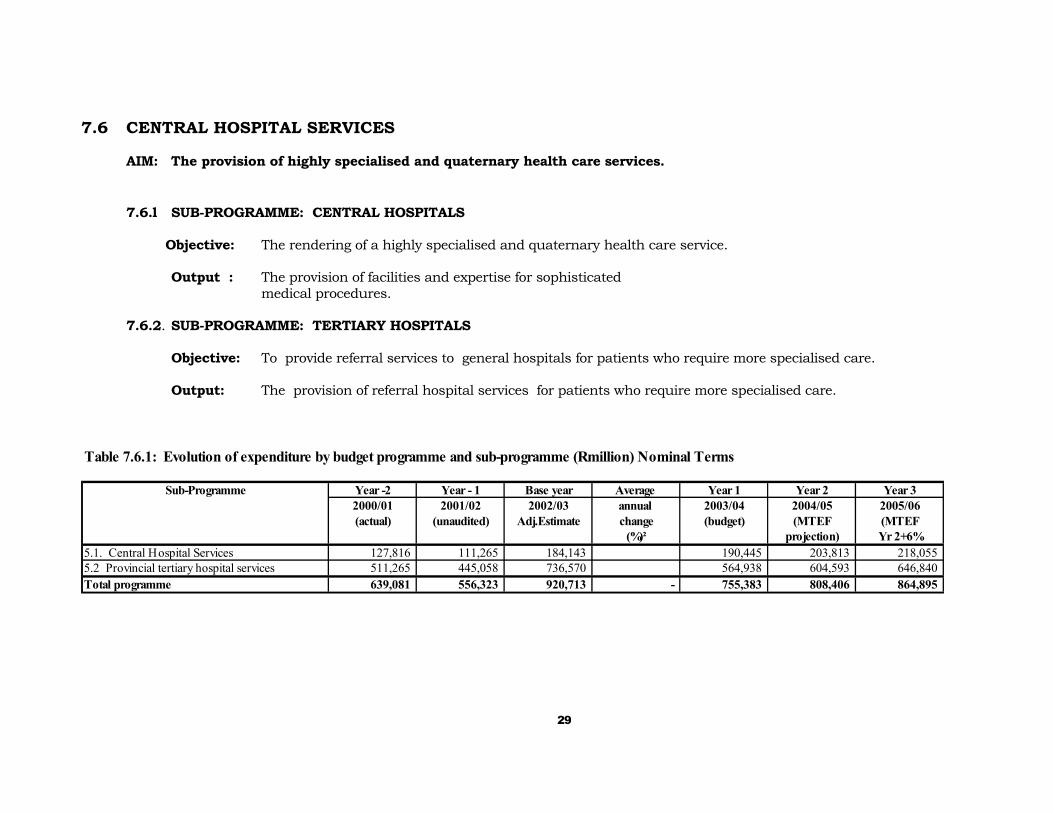
7.6 CENTRAL HOSPITAL SERVICES
AIM: The provision of highly specialised and quaternary health care services.
7.6.l SUB-PROGRAMME: CENTRAL HOSPITALS Objective: The rendering of a highly specialised and quaternary health care service.
Output : The provision of facilities and expertise for sophisticated
medical procedures.
7.6.2. SUB-PROGRAMME: TERTIARY HOSPITALS Objective: To provide referral services to general hospitals for patients who require more specialised care. Output: The provision of referral hospital services for patients who require more specialised care.
Table 7.6.1: Evolution of expenditure by budget programme and sub-programme (Rmillion) Nominal Terms
Sub-Programme Year -2 Year - 1 Base year Average Year 1 Year 2 Year 32000/01 2001/02 2002/03 annual 2003/04 2004/05 2005/06(actual) (unaudited) Adj.Estimate change (budget) (MTEF (MTEF
(%)² projection) Yr 2+6%5.1. Central Hospital Services 127,816 111,265 184,143 190,445 203,813 218,055 5.2 Provincial tertiary hospital services 511,265 445,058 736,570 564,938 604,593 646,840 Total programme 639,081 556,323 920,713 - 755,383 808,406 864,895

30
Table 7.6.2: Evolution of expenditure by budget programme and sub-programme (R million) Real Terms
Sub-Programme Year -2 Year - 1 Base year Average Year 1 Year 2 Year 3 Average 2000/01 2001/02 2002/03 annual 2003/04 2004/05 2005/06 annual(actual) (actual) Adj.Estimate change (budget) (MTEF (MTEF change
(%)² projection) projection) (%)35.1. Central Hospital Services 137,786 118,497 184,143 180,005 183,947 188,629 5.2 Provincial tertiary hospital services 551,144 473,987 736,570 533,968 545,662 559,550 Total programme 688,929 592,484 920,713 - 713,973 729,608 748,179 - 7.6.3 EXPENDITURE TRENDS
The downward trend from 2000/01 to 2001/02 is due to the commencement of the commissioning of Inkosi Albert Luthuli Central Hospital and the systematic movement of the services/expenditure relevant to King Edward and Wentworth Hospitals to the lower levels of service. (District Health Services and Provincial Hospital Services). The funding is, however, below the target expenditure of 11% for tertiary services.
This programme will be affected by the performance of the Rand since September 2001 as this influenced the unitary fees of the PPP contract in respect of the Inkosi Albert Luthuli Central Hospital.
For the 2002/03 financial year, this programme was projecting an over-expenditure, mainly due to the commissioning of the Inkosi Albert Luthuli Central Hospital and the simultaneous running of the central and tertiary services at King Edward Hospital, Wentworth and Grey’s Hospital. This service has been negatively influenced by the performance on the Rand on the Forex markets. The following expenditure pressures are being experienced by this programme:
Pressure to unfreeze frozen posts due to work pressure. Performance of the Rand on international markets and the general inflation affecting the cost of medicine. Because of the weakening of the Rand, the unitary payment for the PPP contract has been affected and will place
pressure on the budget.
Additional funds have been provided in the revised estimates relieving the pressure on this programme.

31
Table:7.6.3 PROGRAMME 5: OBJECTIVES, OUTPUTS, MEASURES AND TARGETS
Programme Structure Performance 2001/02 2002/03 2003/04 2004/05 2005/06Measurable Objectives measures Actual Estimated Target Target Target
(quantitiy,quality,cost,timeliness)
5.1 Central Hospital Services
To provide facilities and expertise for Number of admissionsto be increased 64,556 71,000sophisticated medical procedures in line with national guidelines
7.7 PROGRAMME 6: HEALTH SCIENCES AND TRAINING
AIM: To provide for the training of nursing and ambulance personnel, health workers and personnel in health management, administration and health promotion, as well as the granting of bursaries.
7.7.l SUB-PROGRAMME: NURSE TRAINING COLLEGES
Objective: The training of nursing personnel.
Outputs : The provision of trained nursing staff.
7.7.2. SUB-PROGRAMME: EMRS TRAINING COLLEGES Objective: The training of ambulance personnel.
Output: The provisionof trained ambulance personnel.
32
7.7.3 SUB-PROGRAMME: BURSARIES
Objective: Granting of bursaries to students and other personnel studying in Health Sciences and Administration.
Output: To improve capacity in health services and to provide funding for the disadvantaged students. 7.7.4 SUB-PROGRAMME: PRIMARY HEALTH CARE TRAINING
Objective: To render training to improve clinical skills of nurses functioning in the Primary Health Care Services. Output: The improved clinical skills of nurses functioning in Primary Health Care Services.
7.7.5 SUB-PROGRAMME: TRAINING OTHER
Objective: This service provides training for health workers and personnel in health management, administration and health promotion.
Output: Trained and capacitated health workers and personnel in health management, administration and health
promotion.
33
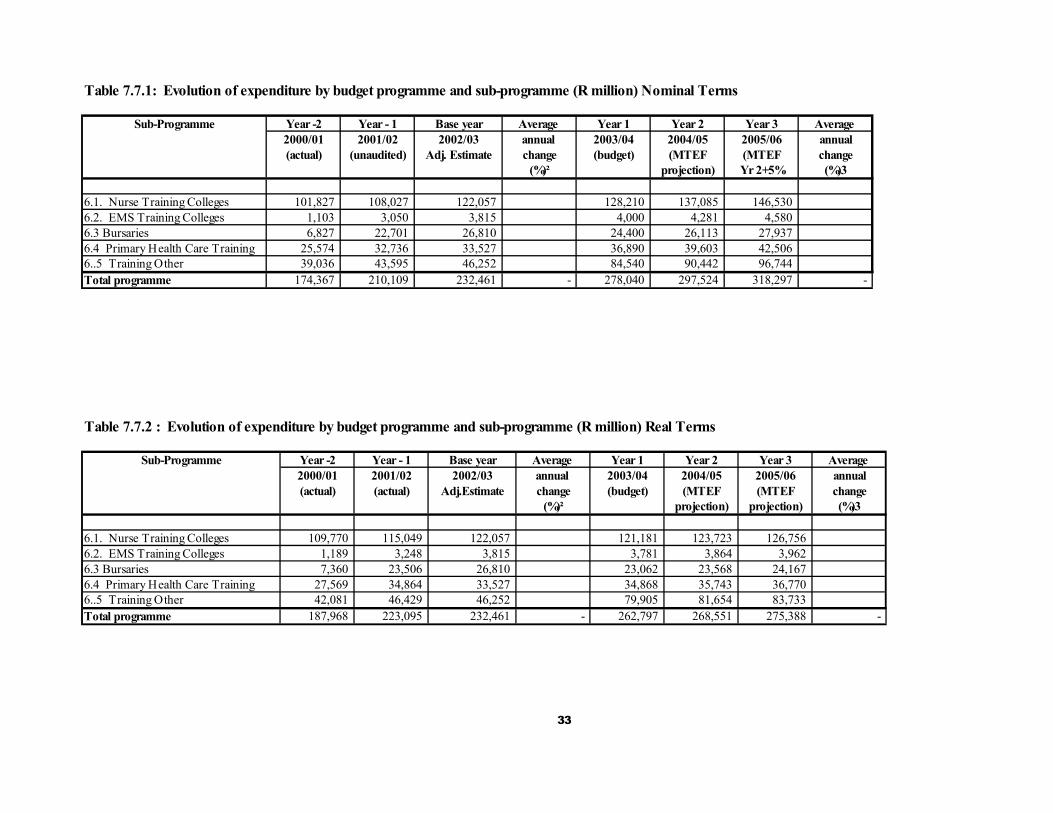
Table 7.7.1: Evolution of expenditure by budget programme and sub-programme (R million) Nominal Terms
Sub-Programme Year -2 Year - 1 Base year Average Year 1 Year 2 Year 3 Average 2000/01 2001/02 2002/03 annual 2003/04 2004/05 2005/06 annual(actual) (unaudited) Adj. Estimate change (budget) (MTEF (MTEF change
(%)² projection) Yr 2+5% (%)3
6.1. Nurse Training Colleges 101,827 108,027 122,057 128,210 137,085 146,530 6.2. EMS Training Colleges 1,103 3,050 3,815 4,000 4,281 4,580 6.3 Bursaries 6,827 22,701 26,810 24,400 26,113 27,937 6.4 Primary Health Care Training 25,574 32,736 33,527 36,890 39,603 42,506 6..5 Training Other 39,036 43,595 46,252 84,540 90,442 96,744 Total programme 174,367 210,109 232,461 - 278,040 297,524 318,297 - Table 7.7.2 : Evolution of expenditure by budget programme and sub-programme (R million) Real Terms
Sub-Programme Year -2 Year - 1 Base year Average Year 1 Year 2 Year 3 Average 2000/01 2001/02 2002/03 annual 2003/04 2004/05 2005/06 annual(actual) (actual) Adj.Estimate change (budget) (MTEF (MTEF change
(%)² projection) projection) (%)3
6.1. Nurse Training Colleges 109,770 115,049 122,057 121,181 123,723 126,756 6.2. EMS Training Colleges 1,189 3,248 3,815 3,781 3,864 3,962 6.3 Bursaries 7,360 23,506 26,810 23,062 23,568 24,167 6.4 Primary Health Care Training 27,569 34,864 33,527 34,868 35,743 36,770 6..5 Training Other 42,081 46,429 46,252 79,905 81,654 83,733 Total programme 187,968 223,095 232,461 - 262,797 268,551 275,388 -

34
7.7.3 EXPENDITURE TRENDS
The increasing expenditure trend over the past three years is mainly related to the consolidation of all training expenditure within one programme and includes, inter alia, provision for pharmacy interns, family planning trainers and the administrative training component. This programme is also affected by the improvements to conditions of service and personal profile expenditure. In the 2002/03 financial year and the Medium Term expenditure Framework period, this programme will be under pressure because of the policy of increasing the number of student nurses trained in order to provide sufficient staff to replace those who are leaving the services for more lucrative offers elsewhere, as well as deaths as a result of HIV/AIDS.

35
Table 7.7.3 PROGRAMME 6: OBJECTIVES, OUTPUTS, MEASURES AND TARGETSPerformance 2001/02 2202/03 2003/04 2004/05 2005/06
Programme Structure measures Actual Estimated Target Target TargetMeasurable Objectives (quantity, quality
cost, timeliness)6.1 Nurse Training Colleges Number of nurses trained per annumTo provide training for nurses. 3,040 3,788 5,682
6.3 BursariesTo improve capacity in health Number of students funded per annum 435 605 670 services and to provide funding forthe disadvantaged.
6.5 Other Number of community health workers trained 2,000 2,200 Number of hospital managers trained - 240 Number of employees trained in computer literacy 1,712 2,500 Number of interns 297 300 Number of persons in skills development programme 1,200 1,200

36
7.8 PROGRAMME 7: HEALTH CARE SUPPORT SERVICES AIM: To provide funding for Health Care Support Services. 7.8.1 SUB-PROGRAMME: MEDICINE TRADING ACCOUNT
Objective: To provide for augmentation of the Medicine Trading Account.
Table 7.7. 1: Evolution of expenditure by budget programme and sub-programme (R million) NominaRl TermsSub-Programme Year -2 Year - 1 Base year Average Year 1 Year 2 Year 3 Average
2000/01 2001/02 2002/03 annual 2003/04 2004/05 2005/06 annual(actual) (actual) Adj. Estimate change (budget) (MTEF (MTEF change
(%)² projection) Yr2+106% (%)31. Medicine Trading Account 5,000 1 1 1 Total programme - - 5,000 - 1 1 1 - Table 7.7. 2: Evolution of expenditure by budget programme and sub-programme (R million)Real Terms
Sub-Programme Year -2 Year - 1 Base year Average Year 1 Year 2 Year 3 Average 2000/01 2001/02 2002/03 annual 2003/04 2004/05 2005/06 annual(actual) (actual) Adj.Estimate change (budget) (MTEF (MTEF change
(%)² projection) Yr2+106% (%)31. MEDVAS Trading Account 5,000 1 1 1 Total programme - - 5,000 - 1 1 1 -

37
Programme7: Objectives, Outputs, Measures and Targets
Turnover of stock to be less than eight times per year. 7.9 PROGRAMME 8: HEALTH FACILITIES MANAGEMENT
AIM: To manage the physical facilities of the Department to provide new facilities, for example clinics and community health centres, as well as to maintain the existing structures
7.9.1 SUB-PROGRAMME: COMMUNITY HEALTH SERVICES
Objective: Physical management of Community Health Clinics and Community Health Centres.
Outputs: 1. Maintenance and Facilities Audit: Well maintained and improved Primary Health Care facilities.
2. Clinic Building and Upgrading Programme: The provision of new and replacement clinics to provide improve access to health services in the underserved areas of the Province.
7.9.2 SUB-PROGRAMME: DISTRICT HOSPITALS
Objective: Physical management of District Hospitals.
Output: Maintenance and Facilities Audit: Well maintained and improved District Hospitals. 7.9.3 SUB-PROGRAMME: EMERGENCY MEDICAL SERVICES
Objective: Physical management of Emergency Service facilities
Output Well maintained and improved of Emergency Service Facilities.
38
7.9.4 SUB-PROGRAMME: PROVINCIAL HOSPITAL SERVICES
Objective: Physical management of provincial hospitals.
Output: Well maintained and improved Provincial Hospitals.
7.9.5 SUB-PROGRAMME: CENTRAL HOSPITAL SERVICES
Objective: Physical management of Central and Tertiary Hospitals.
Outputs: Well maintained and improved Central and Tertiary Hospitals. 7.9.6 SUB-PROGRAMME: OTHER SERVICES
Objective: Physical management of all Departmental Buildings not falling into the above categories.
Outputs: Well maintained and improved non- medical building infrastructure.

39
Table 7.9. 1: Evolution of expenditure by budget programme and sub-programme (R million) Nominal Terms
Sub-Programme Year -2 Year - 1 Base year Average Year 1 Year 2 Year 3 Average 2000/01 2001/02 2002/03 annual 2003/04 2004/05 2005/06 annual(actual) (actual) Adj.Estimate change (budget) (MTEF (MTEF change
(%)² projection) Yr2+106% (%)3
8.1 Community Health Services 12,288 27,895 93,761 86,032 73,966 75,858 8.2 District Health Services 29,300 44,254 42,527 140,059 221,827 226,361 8.3 Emergeny Medical Services 472 435 392 2,292 2,257 3,055 8.4 Provincial Hospital Services 56,677 72,459 98,855 142,021 146,848 170,434 8.5 Central Hospital Services 86,956 414,245 13,485 66,022 59,063 72,527 8.6 Other Services. 49,078 64,783 69,578 27,962 33,062 27,094 Total programme 234,771 624,071 318,598 - 464,388 537,023 575,329 - Table7.9.2: Evolution of expenditure by budget programme and sub-programme (R million) Real Terms
Sub-Programme Year -2 Year - 1 Base year Average Year 1 Year 2 Year 3 Average 2000/01 2001/02 2002/03 annual 2003/04 2004/05 2005/06 annual(actual) (actual) Adj Estimate change (budget) (MTEF (MTEF change
(%)² projection) projection) (%)32. Physical Facilities Management 13,246 29,708 93,761 81,316 66,756 65,621 8.1 Community Health Servoces 31,585 47,131 42,527 132,381 200,205 195,814 8.2 District Health Services 509 463 392 2,166 2,037 2,643 8.3 Emergeny Medical Services 61,098 77,169 178,855 134,235 132,534 147,434 8.4 Provincial Hospital Services 93,739 441,171 13,485 62,403 53,306 62,740 8.5 Central Hospital Services 52,906 68,994 69,578 26,429 29,839 23,438 Total programme 253,083 664,636 398,598 - 438,930 484,678 497,689 -

40
7.9.3 EXPENDITURE TRENDS
Expenditure trends over the past three years: When the funding for the Inkosi Albert Luthuli Central Hospital is excluded the expenditure for this Programme shows a gradual increase from 1.75% in 1999/2000 to 3.5%, which is in line with the policy of making an increasing provision for maintenance and the improvement of the general infrastructure of the Department in order to provide safe facilities. This programme is subject to the following expenditure pressures:
Performance of the Rand on international markets and its influence on the cost of medical equipment and general inflation.
Supporting the policy of allocating contracts to SMME’s. To maintain the buildings in a safe and acceptable condition. The enormous backlog and bad state of the infrastructure.
Table:7.9.3 PROGRAMME 3: OBJECTIVES, OUTPUTS, MEASURES AND TARGETS
Programme Structure Performance 2001/02 2002/03 2003/04 2004/05 2005/06Measurable Objectives measures Actual Estimated Target Target Target
(quantity,quality,cost,timeliness)
Programme 8: Health Facilities Management New facilities - number of projectects completed 62 45 Rehabilitation - number of projects completed 274 86
Replacement - number of projectes completed 64 19Upgrading - number of projects completed 590 98

41
8. MEDIUM TERM REVENUES
8.1 SUMMARY OF REVENUE The following table illustrates the sources of funding for this Department.
Table 8.1: Summary of Sources of Revenue
2000/01 2001/02 2002/03 2003/04 2004/05 2005/06R 000 Actual Adj. Budget MTEF MTEF MTEF MTEF
Vote by legislature 4,779,178 5,548,407 6,178,142 6,643,751 7,062,226 7,521,688 Conditional grants 1,100,830 942,970 1,018,521 1,197,899 1,414,604 1,535,877 Other (specify)Total revenue 5,880,008 6,491,377 7,196,663 7,841,650 8,476,830 9,057,565
8.2 DEPARTMENTAL REVENUE COLLECTION
It should be noted that the only meaningful revenue in this Department is that of patient fees. Most of the remaining revenue items are not uniform and are not received on a regular basis. It is therefore very difficult to assess these items accurately. Previous years’ figures were mainly used to estimate the revenue trends. Of note are the following: 8.2.1 Property Income:
The income received under this item includes interest, housing rental and State Property rights. The increase in the interest collection during 2001/02 resulted mainly from a special effort being made by the Department to improve the management of the long outstanding debts. Considering the increasing trends of the previous financial years and the expected stabilisation of the interest collection, a 4% increase was viewed as being reasonable in estimating the revenue of the consecutive years.
42
8.2.2. Fees and Charges:
The main categories of revenue received under this item are the patient fees, health services (for example, deposits for oxygen cylinders and medical report costs, etc), and board and lodging. The other revenue items under this category are mostly received on an irregular basis and estimated at an average of between 5-6% based on previous years’ trends. Approximately 96% of the patients attending the department’s health facilities are unable to make any meaningful contribution for the services provided. It however remains a challenge to the Department to maximise revenue collection.
The Department is also in the process of implementing new tariffs/charges negotiated between National Health and the Provinces, in terms of the Uniform Patient Fees Schedule. The implementation of this new system will be done on a phased basis which commence on 1 November 2002. The main challenge facing the Department at this stage is therefore to develop a uniform system for Patient Revenue as well as to build capacity at all institutions to effectively collect the potential revenue due to the Department. The revenue for patient fees, board and lodging, health services and the other items were estimated on an average of between 5 - 6% based on the trends from the previous years.
8.2.3 Capital Revenue
The two items of revenue collected under this category refer to the sale of redundant and damaged equipment and stock that have been written off during the Board of Survey process at institutions and sold mainly as scrap.
Revenue received for these items are once again inconsistent and an average increase of 6% was used based on the revenue trends since 2000/01.
43
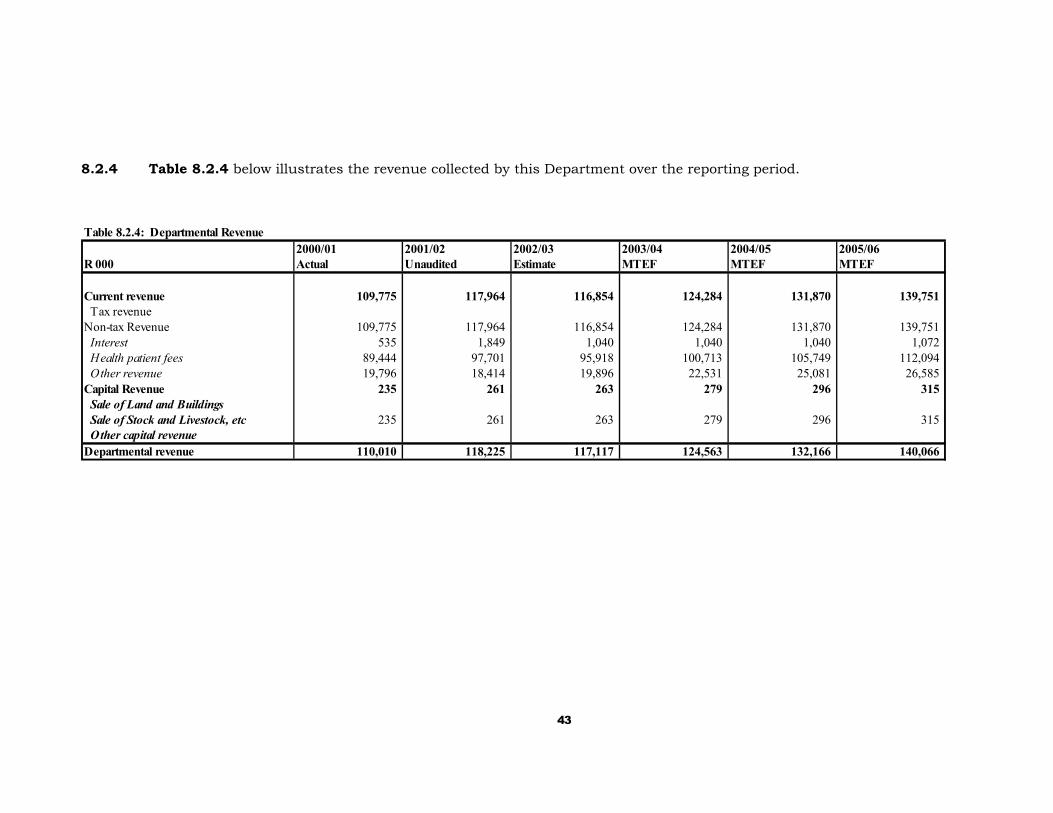
8.2.4 Table 8.2.4 below illustrates the revenue collected by this Department over the reporting period.
Table 8.2.4: Departmental Revenue2000/01 2001/02 2002/03 2003/04 2004/05 2005/06
R 000 Actual Unaudited Estimate MTEF MTEF MTEF
Current revenue 109,775 117,964 116,854 124,284 131,870 139,751 Tax revenueNon-tax Revenue 109,775 117,964 116,854 124,284 131,870 139,751 Interest 535 1,849 1,040 1,040 1,040 1,072 Health patient fees 89,444 97,701 95,918 100,713 105,749 112,094 Other revenue 19,796 18,414 19,896 22,531 25,081 26,585 Capital Revenue 235 261 263 279 296 315 Sale of Land and Buildings Sale of Stock and Livestock, etc 235 261 263 279 296 315 Other capital revenueDepartmental revenue 110,010 118,225 117,117 124,563 132,166 140,066
44
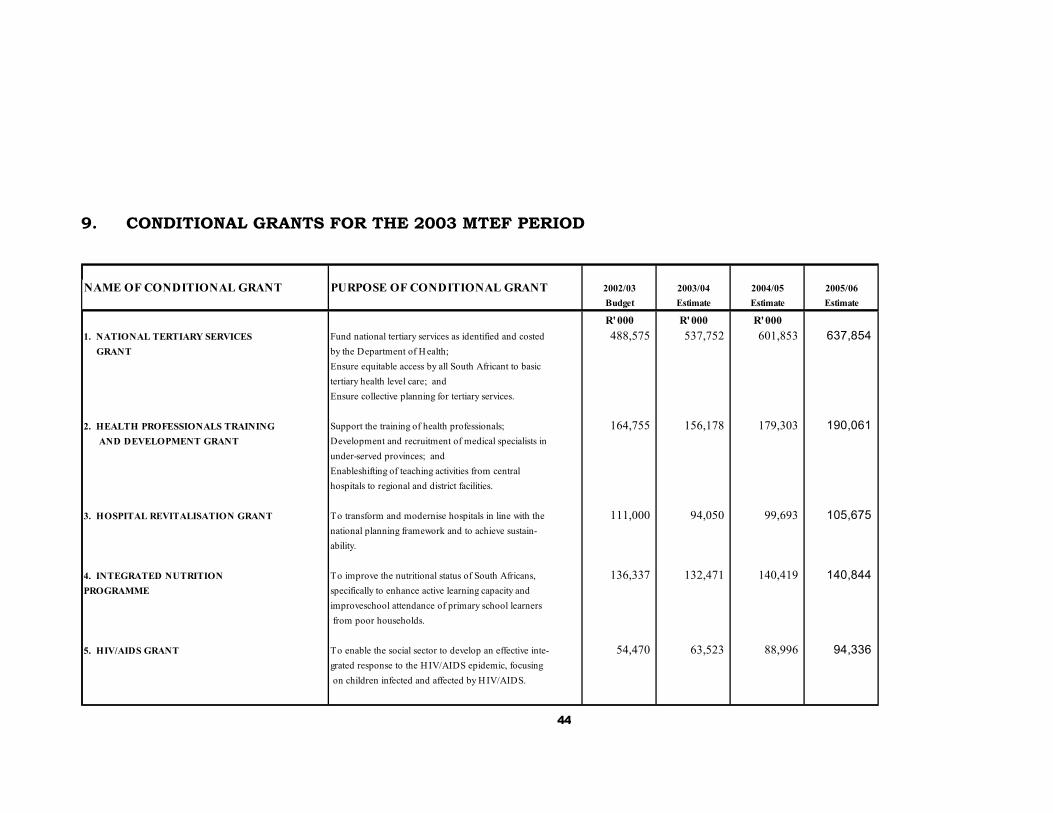
9. CONDITIONAL GRANTS FOR THE 2003 MTEF PERIOD
NAME OF CONDITIONAL GRANT PURPOSE OF CONDITIONAL GRANT 2002/03 2003/04 2004/05 2005/06Budget Estimate Estimate Estimate
R' 000 R' 000 R' 0001. NATIONAL TERTIARY SERVICES Fund national tertiary services as identified and costed 488,575 537,752 601,853 637,854 GRANT by the Department of H ealth;
Ensure equitable access by all South Africant to basictertiary health level care; andEnsure collective planning for tertiary services.
2. HEALTH PROFESSIONALS TRAINING Support the training of health professionals; 164,755 156,178 179,303 190,061 AND DEVELOPMENT GRANT Development and recruitment of medical specialists in
under-served provinces; andEnableshifting of teaching activities from centralhospitals to regional and district facilities.
3. HOSPITAL REVITALISATION GRANT To transform and modernise hospitals in line with the 111,000 94,050 99,693 105,675 national planning framework and to achieve sustain-ability.
4. INTEGRATED NUTRITION To improve the nutritional status of South Africans, 136,337 132,471 140,419 140,844 PROGRAMME specifically to enhance active learning capacity and
improveschool attendance of primary school learners from poor households.
5. HIV/AIDS GRANT To enable the social sector to develop an effective inte- 54,470 63,523 88,996 94,336 grated response to the HIV/AIDS epidemic, focusing on children infected and affected by H IV/AIDS.

45
CONDITIONAL GRANTS CONTINUED
PURPOSE OF CONDITIONAL GRANT 2002/03 2003/04 2004/05 2005/06Budget Estimate Estimate Estimate
R '000 R '000 R '000 R '000
To improve financial management in the health sector. 19,000 17,000 18,020 19,101
To help accelerate construction maintenance and rehabil- 46,358 69,430 85,797 90,945 tation of new and existing infrastructure.
46
10. CO-ORDINATION, CO-OPERATION AND OUTSOURCING PLANS
10.1 INTERDEPARTMENTAL LINKAGES
Although the Department of Health co-operates with the other Departments where services overlap, each Department funds its own core business functions and no joint funding for specific projects is provided.
The following projects are jointly administered and executed by:
1. The Departments of Health, Education and Agriculture:
Primary School Nutrition Programme: Funding is provided by the Department of Health in order to reduce hunger and malnutrition among primary school learners. School Governing Bodies have been established at the schools to administer the feeding scheme An agreement has been signed by the Department of Health and the Department of Education and Culture whereby the monitoring of the administration and financial control is shared by the two Departments.
2. The Departments of Health and Education:
School Health Services: Funding is provided by the Department of Health, which provides health education and renders a primary health service at the schools with the co-operation of the Department of Education and Culture.
3. All the Departments in the Province of KwaZulu-Natal.
HIV/AIDS: The Department of Health provides funding to the
Provincial Aids Action Unit, which plays a co-ordinating role in initiating joint HIV/AIDS-related projects with the above Departments and Local Authorities.
4. The Departments of Health, Education, Water Affairs, Local
Government and Traditional Affairs
Cholera Liaison: Liaison and co-operation between the above Departments enables improvement in the infrastructure giving the people of the Province better access to potable water and health facilities. Funding is provided within each Department to fulfil its own core functions in this respect.
5. Department of Health and Works
Physical Facilities Management: Co-ordination and co-operation is established whereby the Department of Health provides the funding and the Department of Works provides the expertise to manage the capital works projects of Health.
10.2 LOCAL GOVERNMENT LINKAGES
47
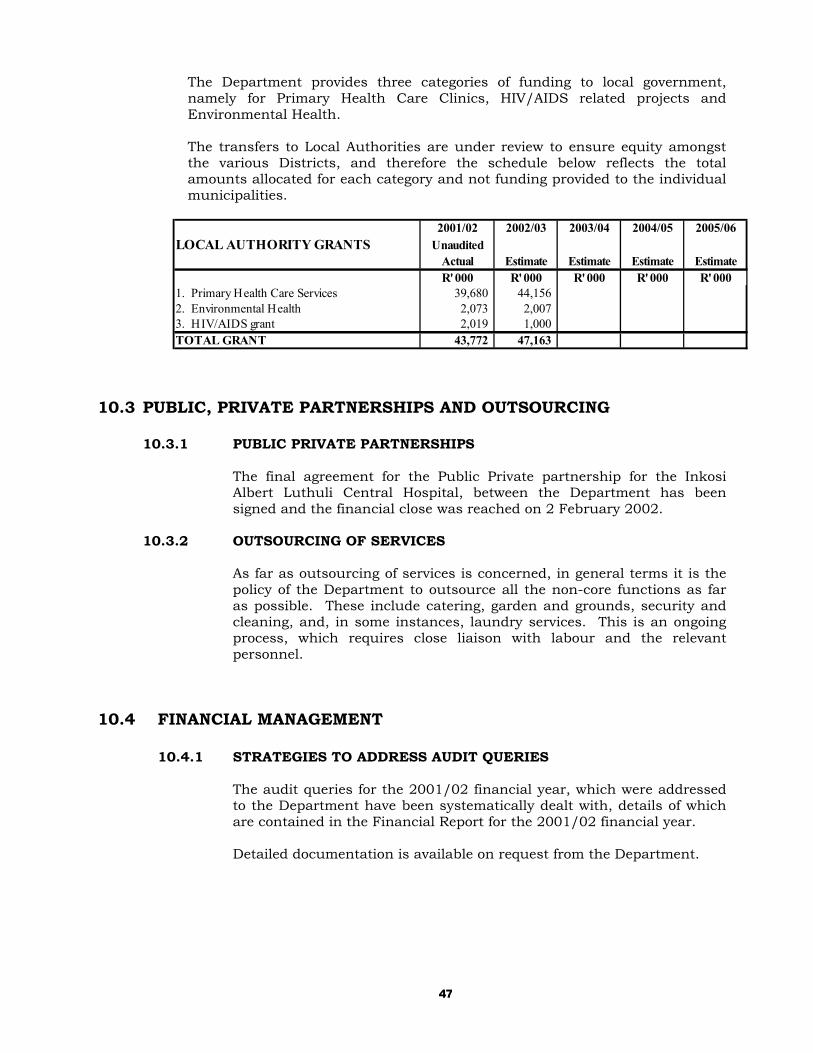
The Department provides three categories of funding to local government, namely for Primary Health Care Clinics, HIV/AIDS related projects and Environmental Health.
The transfers to Local Authorities are under review to ensure equity amongst the various Districts, and therefore the schedule below reflects the total amounts allocated for each category and not funding provided to the individual municipalities.
2001/02 2002/03 2003/04 2004/05 2005/06
LOCAL AUTHORITY GRANTS UnauditedActual Estimate Estimate Estimate EstimateR' 000 R' 000 R' 000 R' 000 R' 000
1. Primary Health Care Services 39,680 44,156 2. Environmental Health 2,073 2,007 3. HIV/AIDS grant 2,019 1,000 TOTAL GRANT 43,772 47,163
10.3 PUBLIC, PRIVATE PARTNERSHIPS AND OUTSOURCING 10.3.1 PUBLIC PRIVATE PARTNERSHIPS
The final agreement for the Public Private partnership for the Inkosi Albert Luthuli Central Hospital, between the Department has been signed and the financial close was reached on 2 February 2002.
10.3.2 OUTSOURCING OF SERVICES
As far as outsourcing of services is concerned, in general terms it is the policy of the Department to outsource all the non-core functions as far as possible. These include catering, garden and grounds, security and cleaning, and, in some instances, laundry services. This is an ongoing process, which requires close liaison with labour and the relevant personnel.
10.4 FINANCIAL MANAGEMENT
10.4.1 STRATEGIES TO ADDRESS AUDIT QUERIES
The audit queries for the 2001/02 financial year, which were addressed to the Department have been systematically dealt with, details of which are contained in the Financial Report for the 2001/02 financial year. Detailed documentation is available on request from the Department.
48
10.4.2 IMPLEMENTATION OF PUBLIC FINANCE MANAGEMENT ACT
The Department has made good progress towards the implementation the above Act. Please refer to the attached document, which was submitted to Provincial Treasury in February 2002 for details.
10.5 TRAINING AND LEARNING
The Department sets aside approximately 2.6 per cent of its budget (Programme 5: Health Sciences) to provide for its training needs. It is also making a concerted effort to double the intake of student nurses as well as increase the number of other medical professionals over the 2003 Medium Term Expenditure Framework period in order to provide sufficient personnel to compensate for those emigrating, and retiring and also those exiting the service as a result of HIV/AIDS related diseases.
11. COMMENT
Part C of this Strategic plan, which is appended hereto contains additional information which is mostly required by the National Department of Health.
49
PART C
APPENDICES WITH ADDITIONAL INFORMATION
APPENDIX 1: ANALYSIS OF SERVICE DELIVERY ENVIRONMENT 1. The following resume is a broad analysis of the service delivery environment in which
the Department operates, taking into consideration the external factors that have/may impact on the demand for its services, as well as those factors that have/may affect its ability to provide services.
2. From information made available in the Provincial Budget Statements for the 2002/03
financial year KwaZulu-Natal is the most populous province in South Africa, with the second largest poverty gap in the country. This indicates grossly insufficient resources and an inability to provide adequate services of a reasonable quality, resulting in, inter alia, more expenditure for health care. In addition, from a health point of view the following information is of relevance:
a. Demographic profile
KwaZulu-Natal is the most highly populated province in South Africa; and has approximately 20.5% of the total population of South Africa
53% of the population is urbanised.
Currently, approximately 2 million of the KwaZulu-Natal population does
not have adequate access to health care.
The Health Department of KwaZulu-Natal provides central services to 50% of the population of Eastern Cape.
The Cross border flow of patients from the Eastern Cape into the Districts of Sisonke and Ugu of KwaZulu-Natal is estimated on a population of 101 661, which represents 1.67% of the total Eastern Cape population.
The Mozambique and Swaziland population served by KwaZulu-Natal is
estimated to be 30 000.
b. Socio-economic profile
According to available figures 39% of the economically active population is unemployed, and estimated third of the population survives on subsistence farming.
Poverty levels in this Province are still amongst the highest in South
Africa. According to the S.A.

50
indicator, 47% of females and 36% of males in KwaZulu Natal were unemployed in January 2000.
Topography and the lack of infrastructure in rural areas, make access to
health facilities particularly difficult.
c. Epidemics
KwaZulu-Natal recently, has the highest incidence of epidemics in the country:
Cholera epidemic in 2000 Malaria Pandemic TB incidence rate of 3/1000
HIV/AIDS where the ante-natal survey showed a prevalence of 35% in 2000.
d. Violence
KwaZulu-Natal has one of the highest murder and rape rates in South Africa, as well as one of the highest motor vehicle accident rates. This places additional pressure on the provision of Medical Rescue Emergency services. The following statistics give an indication of the seriousness of the problem.
Rape - 99,6 per 100 000 of the population reported in 1999. Murder - 70.2 per 100 000 of the population reported in 1999. (S.A. average
55.

51
The tables below give an overall summary of the population characteristics and social conditions relevant to service delivery by this Department.
5.2 SELECTED POPULATION CHARACTERISTICS AND SOCIAL CONDITIONS
RELEVANT TO HEALTH 5.2.1 Overall comment on the Population figures of KwaZulu-Natal
The figures quoted are obtained from Statistics South Africa and the KwaZulu Natal GIS unit (March 2002)
The mid-year estimates for 2002 estimate the population as being 8 857 615
or 20% of the total population. It is estimated that the population would have been 8 986 857 without the increased deaths due to HIV/AIDS.
5.2.2 The following table gives an overview of the main Demographic and Socio-Economic
Indictors for the Province of KwaZulu-Natal. The population figure is based on the 1996 Census:
KEY DEMOGRAPHIC AND SOCIO-ECONOMIC
INDICATORS FOR KWAZULU-NATAL
Area (km²) 92,100 Population density 91.4 Population 8,417,021 % Population 20.7 Rural as % population 56.9 % Population < 5 years 11.5 Poverty rates 53.0 % Population > 20 yrs with no schooling
22.9
% Population > 20 yrs with matric or high qualification
20.7
% Women > 20 years with no schooling
25.2
% economically active population unemployed
39.1
% households living in 2 or less rooms
29.6
% households living in 1 or less rooms
15.6
% Using electricity for cooking 46.1 % with tap in house 39.8 % with tap in house or yard 48.7 % with flush or chemical toilet 42.0 Disabled as % of population 6.0
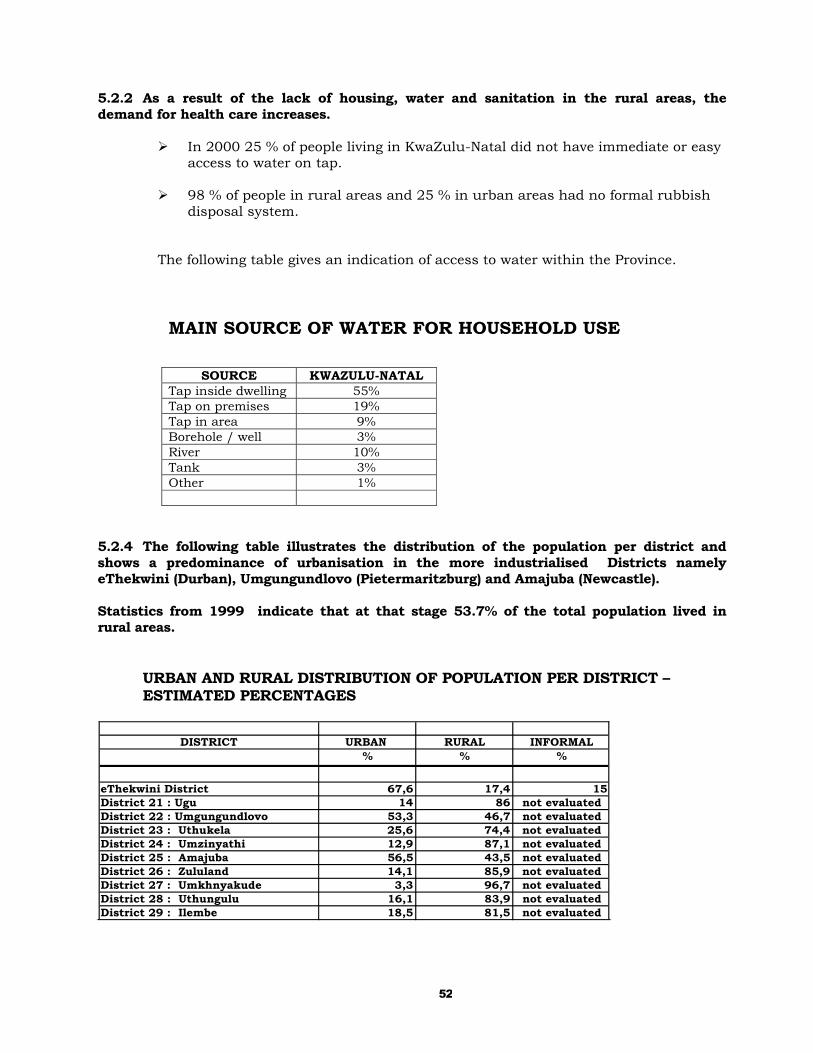
52
5.2.2 As a result of the lack of housing, water and sanitation in the rural areas, the demand for health care increases.
In 2000 25 % of people living in KwaZulu-Natal did not have immediate or easy access to water on tap.
98 % of people in rural areas and 25 % in urban areas had no formal rubbish
disposal system. The following table gives an indication of access to water within the Province.
MAIN SOURCE OF WATER FOR HOUSEHOLD USE
SOURCE KWAZULU-NATAL
Tap inside dwelling 55% Tap on premises 19% Tap in area 9% Borehole / well 3% River 10% Tank 3% Other 1%
5.2.4 The following table illustrates the distribution of the population per district and shows a predominance of urbanisation in the more industrialised Districts namely eThekwini (Durban), Umgungundlovo (Pietermaritzburg) and Amajuba (Newcastle).
Statistics from 1999 indicate that at that stage 53.7% of the total population lived in rural areas.
URBAN AND RURAL DISTRIBUTION OF POPULATION PER DISTRICT – ESTIMATED PERCENTAGES
DISTRICT URBAN RURAL INFORMAL% % %
eThekwini District 67,6 17,4 15District 21 : Ugu 14 86 not evaluatedDistrict 22 : Umgungundlovo 53,3 46,7 not evaluatedDistrict 23 : Uthukela 25,6 74,4 not evaluatedDistrict 24 : Umzinyathi 12,9 87,1 not evaluatedDistrict 25 : Amajuba 56,5 43,5 not evaluatedDistrict 26 : Zululand 14,1 85,9 not evaluatedDistrict 27 : Umkhnyakude 3,3 96,7 not evaluatedDistrict 28 : Uthungulu 16,1 83,9 not evaluatedDistrict 29 : Ilembe 18,5 81,5 not evaluated

53
5.2.5 The following table illustrates the distribution of males and females per district with an
overall dominance of females, which is attributable to the longer life expectancy of females as well as males gravitating to Gauteng for employment.
POPULATION OF KWAZULU-NATAL BY DISTRICT AND GENDER
Source: GIS Unit: KwaZulu-Natal March 2002.
Health District Female % Female Male % Male Total Total per
cent
Durban Metro Ethekwini 1,519,624 51.26% 1,444,653 48.74% 2,964,277 32.68%
DC 21 Ugu 379,407 54.68% 314,520 45.32% 693,927 7.65%
DC22 UMgungundlovo 500,277 52.77% 447,792 47.23% 948,069 10.45%
DC 23 Uthukela 324,033 54.24% 273,411 45.76% 597,444 6.59%
DC 24 Umzinyathi 257,041 55.83% 203,360 44.17% 460,401 5.08%
DC 25 Amajuba 231,717 52.34% 210,959 47.66% 442,676 4.88%
DC 26 Zululand 417,616 54.32% 351,175 45.68% 768,791 8.48%
DC 27 Umkhanyakude 295,286 54.39% 247,668 45.61% 542,954 5.99%
DC28 Uthungulu 444,719 54.13% 376,832 45.87% 821,551 9.06%
DC 29 Ilembe 305,837 53.00% 271,237 47.00% 577,074 6.36%
DC 43 Sisonke 137,303 54.35% 115,304 45.65% 252,607 2.79%
TOTAL 4,812,860 53.06% 4,256,911 46.94% 9,069,771 100.00%
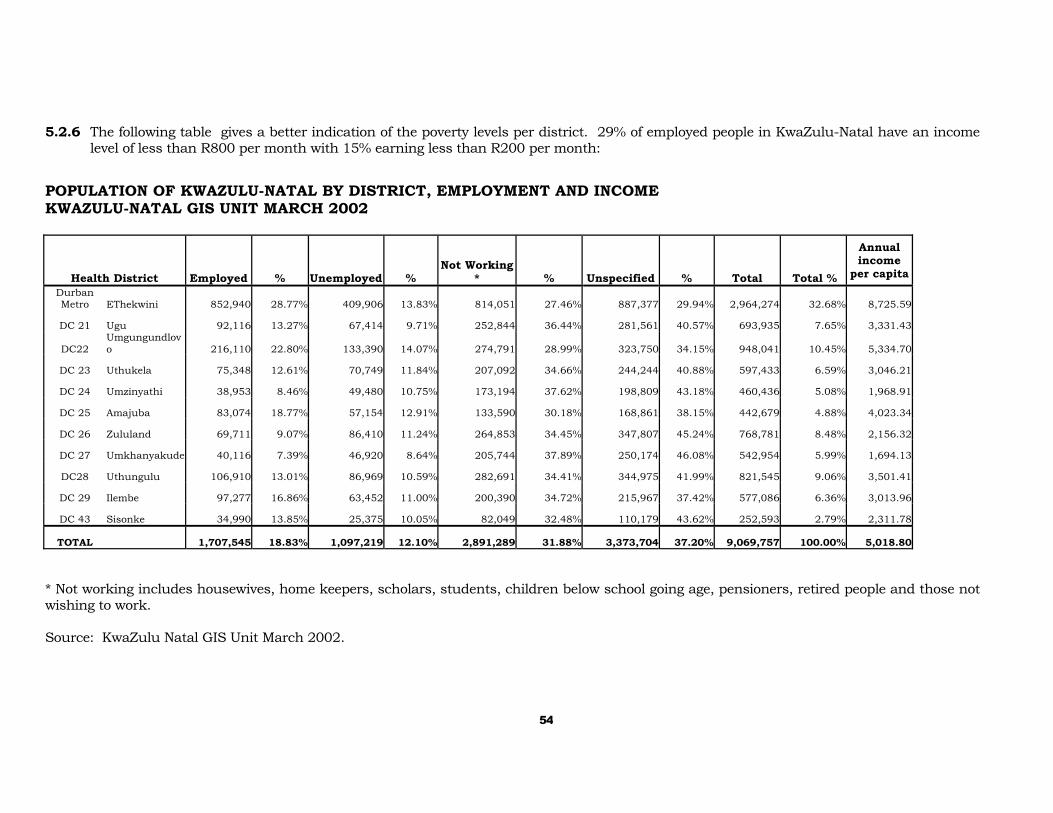
54
5.2.6 The following table gives a better indication of the poverty levels per district. 29% of employed people in KwaZulu-Natal have an income level of less than R800 per month with 15% earning less than R200 per month:
POPULATION OF KWAZULU-NATAL BY DISTRICT, EMPLOYMENT AND INCOME KWAZULU-NATAL GIS UNIT MARCH 2002
Health District Employed % Unemployed % Not Working
* % Unspecified % Total Total %
Annual income
per capita Durban Metro EThekwini 852,940 28.77% 409,906 13.83% 814,051 27.46% 887,377 29.94% 2,964,274 32.68% 8,725.59
DC 21 Ugu 92,116 13.27% 67,414 9.71% 252,844 36.44% 281,561 40.57% 693,935 7.65% 3,331.43
DC22 Umgungundlovo 216,110 22.80% 133,390 14.07% 274,791 28.99% 323,750 34.15% 948,041 10.45% 5,334.70
DC 23 Uthukela 75,348 12.61% 70,749 11.84% 207,092 34.66% 244,244 40.88% 597,433 6.59% 3,046.21
DC 24 Umzinyathi 38,953 8.46% 49,480 10.75% 173,194 37.62% 198,809 43.18% 460,436 5.08% 1,968.91
DC 25 Amajuba 83,074 18.77% 57,154 12.91% 133,590 30.18% 168,861 38.15% 442,679 4.88% 4,023.34
DC 26 Zululand 69,711 9.07% 86,410 11.24% 264,853 34.45% 347,807 45.24% 768,781 8.48% 2,156.32
DC 27 Umkhanyakude 40,116 7.39% 46,920 8.64% 205,744 37.89% 250,174 46.08% 542,954 5.99% 1,694.13
DC28 Uthungulu 106,910 13.01% 86,969 10.59% 282,691 34.41% 344,975 41.99% 821,545 9.06% 3,501.41
DC 29 Ilembe 97,277 16.86% 63,452 11.00% 200,390 34.72% 215,967 37.42% 577,086 6.36% 3,013.96
DC 43 Sisonke 34,990 13.85% 25,375 10.05% 82,049 32.48% 110,179 43.62% 252,593 2.79% 2,311.78
TOTAL 1,707,545 18.83% 1,097,219 12.10% 2,891,289 31.88% 3,373,704 37.20% 9,069,757 100.00% 5,018.80 * Not working includes housewives, home keepers, scholars, students, children below school going age, pensioners, retired people and those not wishing to work. Source: KwaZulu Natal GIS Unit March 2002.
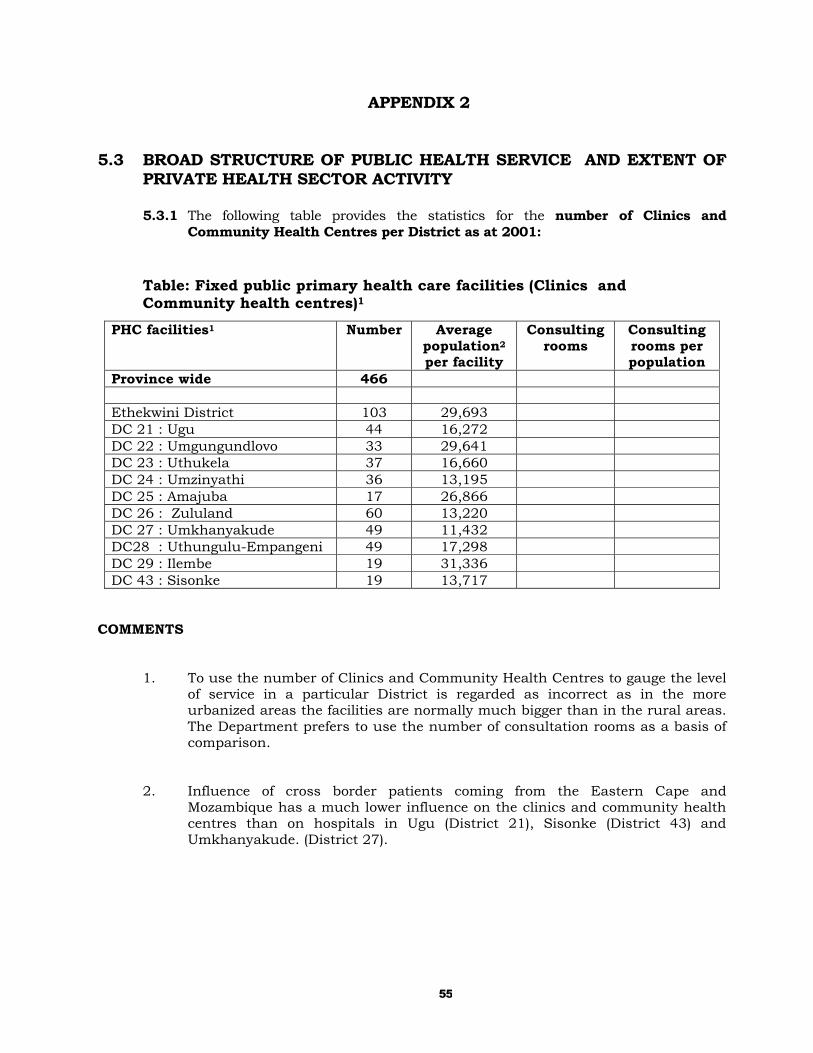
55
APPENDIX 2 5.3 BROAD STRUCTURE OF PUBLIC HEALTH SERVICE AND EXTENT OF
PRIVATE HEALTH SECTOR ACTIVITY
5.3.1 The following table provides the statistics for the number of Clinics and Community Health Centres per District as at 2001:
Table: Fixed public primary health care facilities (Clinics and Community health centres)1
COMMENTS
1. To use the number of Clinics and Community Health Centres to gauge the level of service in a particular District is regarded as incorrect as in the more urbanized areas the facilities are normally much bigger than in the rural areas. The Department prefers to use the number of consultation rooms as a basis of comparison.
2. Influence of cross border patients coming from the Eastern Cape and Mozambique has a much lower influence on the clinics and community health centres than on hospitals in Ugu (District 21), Sisonke (District 43) and Umkhanyakude. (District 27).
PHC facilities1 Number Average population2 per facility
Consulting rooms
Consulting rooms per population
Province wide 466 Ethekwini District 103 29,693 DC 21 : Ugu 44 16,272 DC 22 : Umgungundlovo 33 29,641 DC 23 : Uthukela 37 16,660 DC 24 : Umzinyathi 36 13,195 DC 25 : Amajuba 17 26,866 DC 26 : Zululand 60 13,220 DC 27 : Umkhanyakude 49 11,432 DC28 : Uthungulu-Empangeni 49 17,298 DC 29 : Ilembe 19 31,336 DC 43 : Sisonke 19 13,717
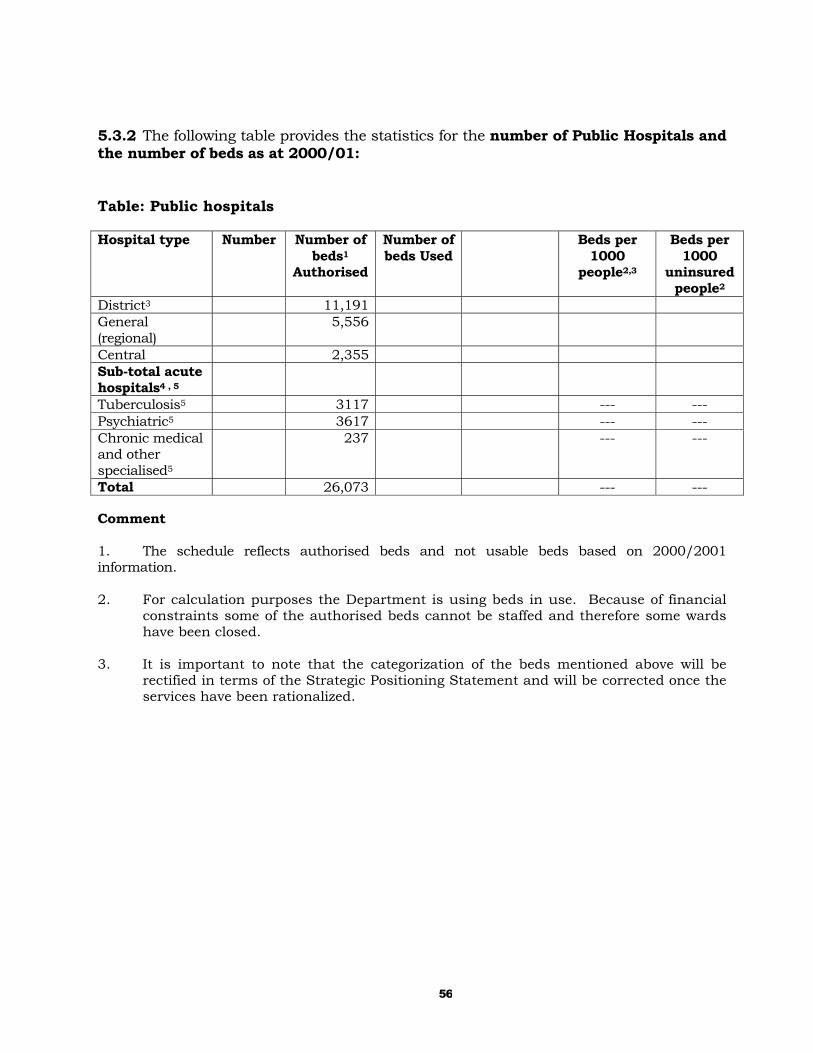
56
5.3.2 The following table provides the statistics for the number of Public Hospitals and the number of beds as at 2000/01: Table: Public hospitals Hospital type Number Number of
beds1
Authorised
Number of beds Used
Beds per 1000
people2,3
Beds per 1000
uninsured people2
District3 11,191 General (regional)
5,556
Central 2,355 Sub-total acute hospitals4 , 5
Tuberculosis5 3117 --- --- Psychiatric5 3617 --- --- Chronic medical and other specialised5
237 --- ---
Total 26,073 --- --- Comment 1. The schedule reflects authorised beds and not usable beds based on 2000/2001 information. 2. For calculation purposes the Department is using beds in use. Because of financial
constraints some of the authorised beds cannot be staffed and therefore some wards have been closed.
3. It is important to note that the categorization of the beds mentioned above will be
rectified in terms of the Strategic Positioning Statement and will be corrected once the services have been rationalized.
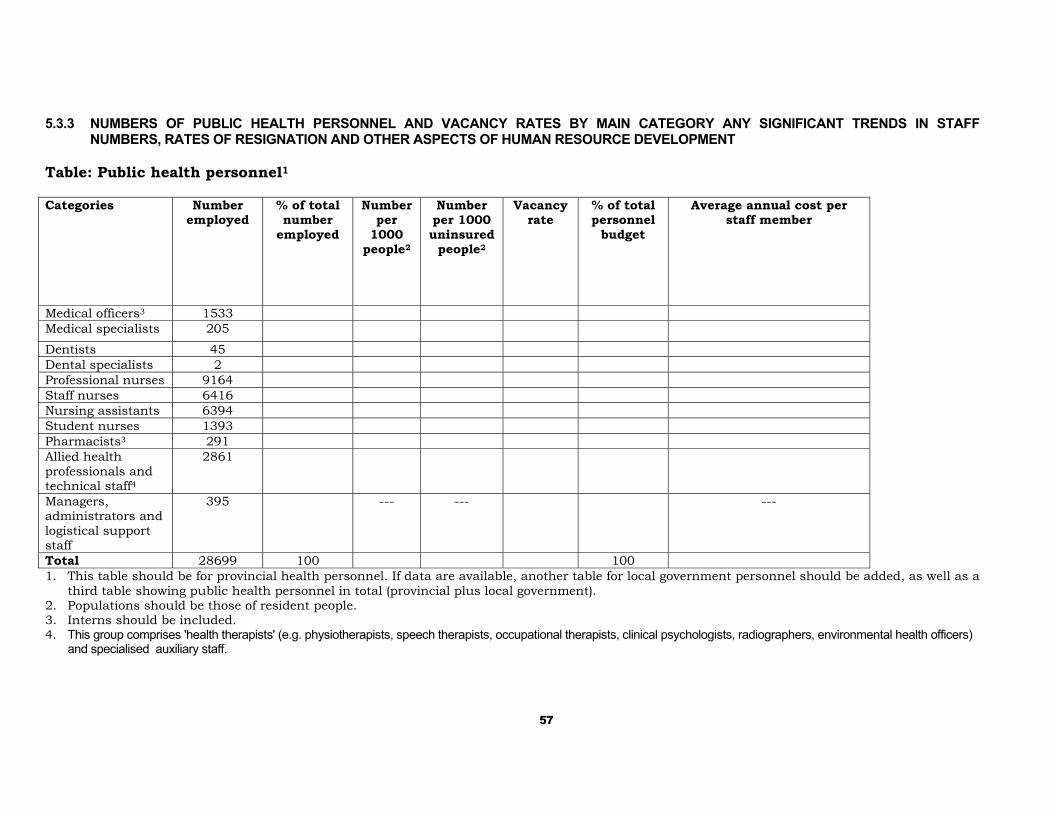
57
5.3.3 NUMBERS OF PUBLIC HEALTH PERSONNEL AND VACANCY RATES BY MAIN CATEGORY ANY SIGNIFICANT TRENDS IN STAFF
NUMBERS, RATES OF RESIGNATION AND OTHER ASPECTS OF HUMAN RESOURCE DEVELOPMENT Table: Public health personnel1
Categories Number
employed % of total number
employed
Number per
1000 people2
Number per 1000 uninsured
people2
Vacancy rate
% of total personnel
budget
Average annual cost per staff member
Medical officers3 1533 Medical specialists 205
Dentists 45 Dental specialists 2 Professional nurses 9164 Staff nurses 6416 Nursing assistants 6394 Student nurses 1393 Pharmacists3 291 Allied health professionals and technical staff4
2861
Managers, administrators and logistical support staff
395 --- --- ---
Total 28699 100 100 1. This table should be for provincial health personnel. If data are available, another table for local government personnel should be added, as well as a
third table showing public health personnel in total (provincial plus local government). 2. Populations should be those of resident people. 3. Interns should be included. 4. This group comprises 'health therapists' (e.g. physiotherapists, speech therapists, occupational therapists, clinical psychologists, radiographers, environmental health officers)
and specialised auxiliary staff.
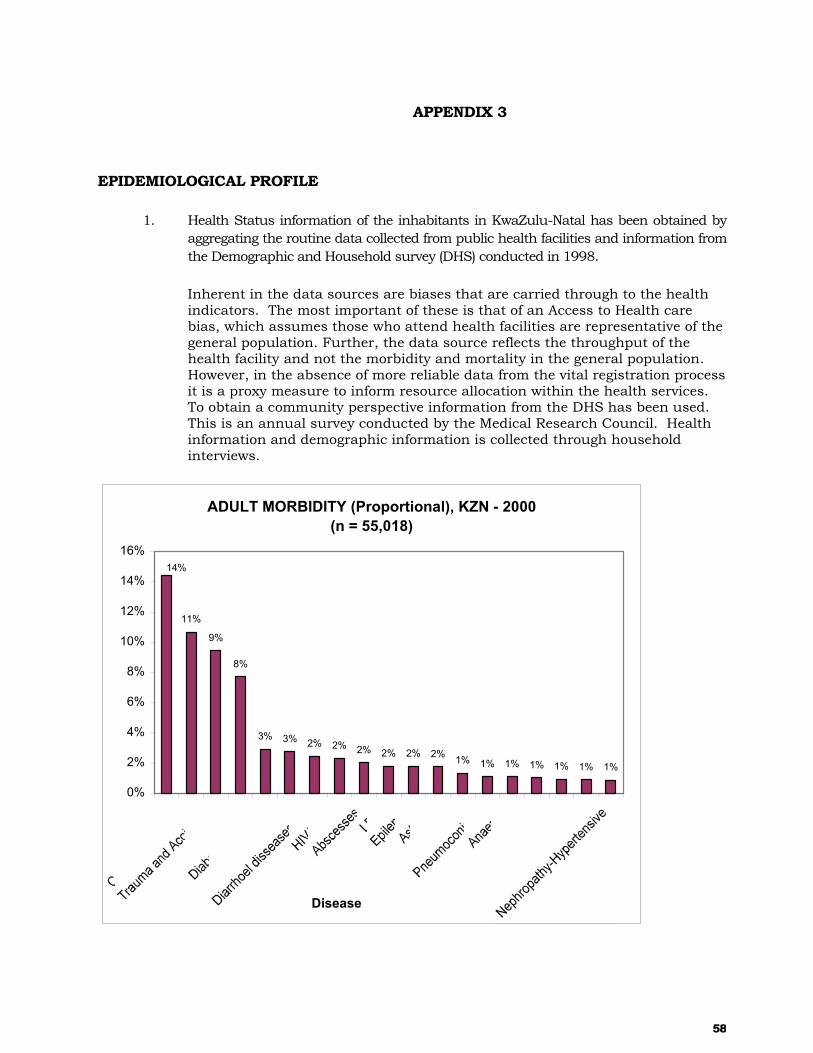
58
APPENDIX 3 EPIDEMIOLOGICAL PROFILE
1. Health Status information of the inhabitants in KwaZulu-Natal has been obtained by aggregating the routine data collected from public health facilities and information from the Demographic and Household survey (DHS) conducted in 1998.
Inherent in the data sources are biases that are carried through to the health indicators. The most important of these is that of an Access to Health care bias, which assumes those who attend health facilities are representative of the general population. Further, the data source reflects the throughput of the health facility and not the morbidity and mortality in the general population. However, in the absence of more reliable data from the vital registration process it is a proxy measure to inform resource allocation within the health services. To obtain a community perspective information from the DHS has been used. This is an annual survey conducted by the Medical Research Council. Health information and demographic information is collected through household interviews.
ADULT MORBIDITY (Proportional), KZN - 2000(n = 55,018)
11%
9%
8%
3% 3% 2% 2% 2% 2% 2% 2% 1% 1% 1% 1% 1% 1% 1%
14%
0%
2%
4%
6%
8%
10%
12%
14%
16%
Disease

59
1 Double Burden of Disease
The above graph displays the juxtaposition of Tuberculosis and Malaria, with that of Cardiac Disease and Diabetes. This is referred to as the double of burden of disease. It is often seen in developing countries where populations are undergoing an Epidemiological Transition, which reflects the burden of Infectious Diseases and the Chronic Diseases of Lifestyle indicating the differential levels of development within a population. This trend is perpetuated in the Morbidity patterns seen at health facilities. Adult Morbidity
KZN Adult Morbidity Comparison for 2000 and 1998
1411
9 8
3 3 2 2 2 2
96
21
03
0
8
3 20
0
5
10
15
20
25
Diseases 2000 1998
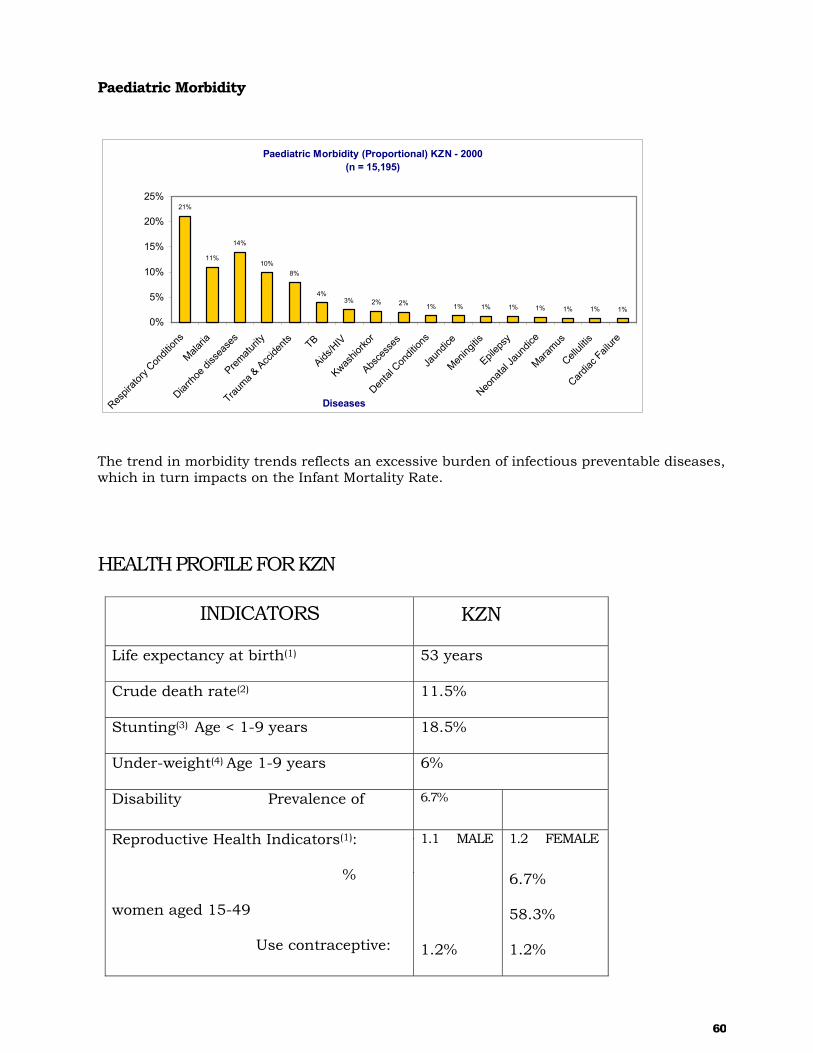
60
Paediatric Morbidity
Paediatric Morbidity (Proportional) KZN - 2000(n = 15,195)
21%
11%
14%
10%8%
4%3% 2% 2% 1% 1% 1% 1% 1% 1% 1% 1%
0%
5%
10%
15%
20%
25%
Respir
atory
Condit
ions
Malaria
Diarrho
e diss
ease
s
Prematu
rity
Trauma &
Accide
nts TB
Aids/H
IV
Kwashio
rkor
Absce
sses
Dental
Con
dition
s
Jaun
dice
Mening
itis
Epilep
sy
Neona
tal Ja
undic
e
Maramus
Celluli
tis
Cardiac
Failure
Diseases
The trend in morbidity trends reflects an excessive burden of infectious preventable diseases, which in turn impacts on the Infant Mortality Rate.
HEALTH PROFILE FOR KZN
INDICATORS KZN
Life expectancy at birth(1) 53 years
Crude death rate(2) 11.5%
Stunting(3) Age < 1-9 years 18.5%
Under-weight(4) Age 1-9 years 6%
Disability Prevalence of 6.7%
Reproductive Health Indicators(1):
%
women aged 15-49
Use contraceptive:
1.1 MALE
1.2%
1.2 FEMALE
6.7%
58.3%
1.2%

61
Immunization Coverage
Children<1 year(7)
12-23 months(6)
82.6%
49.5%
Childhood mortality(6):
Infant Mortality Rate
Under 5 Mortality Rate
52.1 per 1000 live births
74.5 per 1000 live births
Infectious Diseases (per 100,000
population
Malaria 2000
Measles
Tuberculosis
Typhoid
Viral Hepatitis
STD
Prevalence of Diarrhoea Under 5 years
HIV Prevalence:
Antenatal
General Population
471
1.6
316.6
0.4
2.3
96.7
17.8%
34.2%
60%
Reference:
1. Stats SA HHI 2001
2. IFR Projections 1999
3. SAVACG Survey
4. Food Consumption Survey

62
5. CASE Disability Survey for the Dept. of Health 1998.
6. South African Demographic Health Survey 1998.
7. National Report on DHIS Data: Gathering, Analysing and Using Information to
Accelerate PHC Delivery 2002.
8. DOH, Pretoria. Malaria Report 2001
9. DHIS 2001, DOH Pretoria, Page 17
10. National HIV and Syphilis sero-prevalence survey in South Africa 2001.
11. October Household Survey for the Dept. of Health 1995.
12. PERSAL 2001.
13.Provincial Health Informatics

63
APPENDIX 4 5.6 SEE ATTACHED MAP
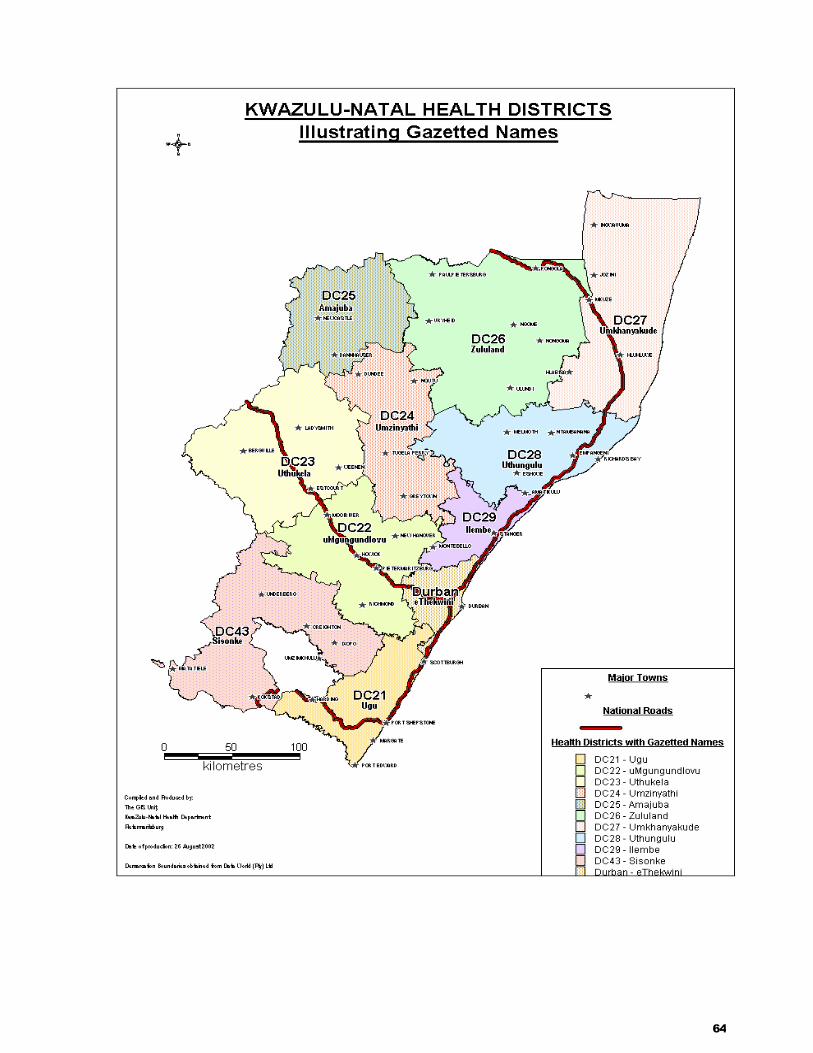
64

65
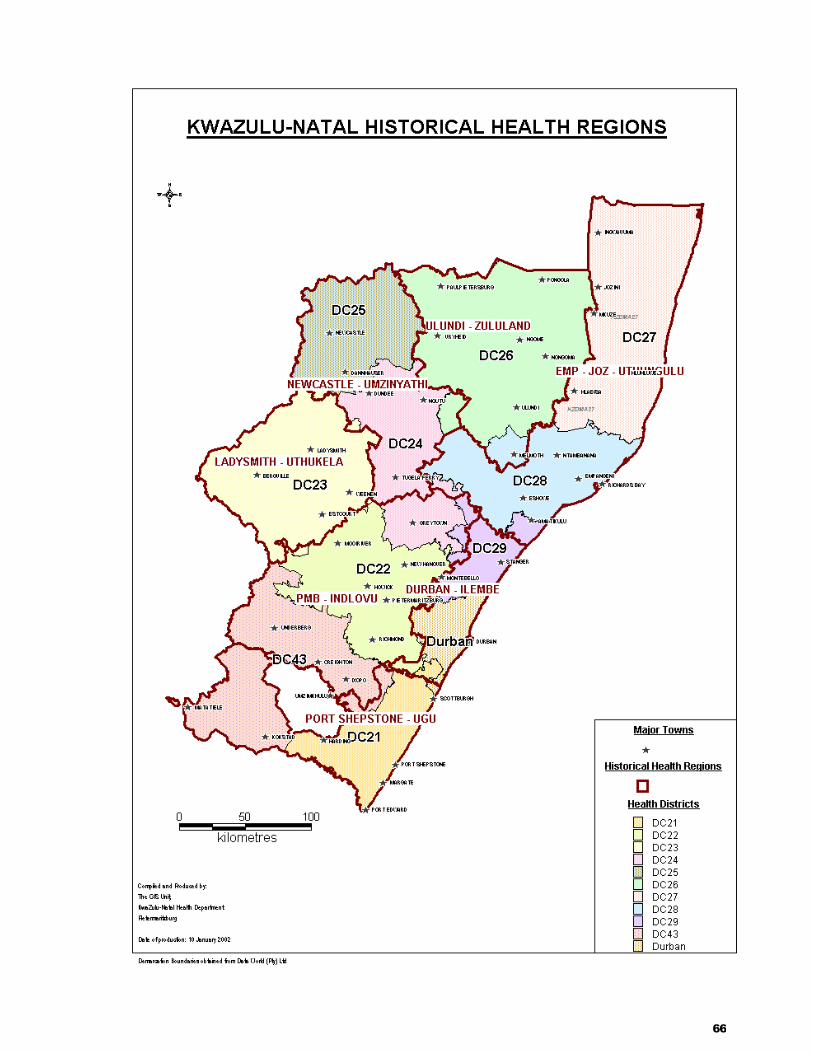
66

67

68


![[Jane's] - Janes Strategic Weapon Systems. 2003 [Web Edition]](https://static.fdocuments.in/doc/165x107/577ce4cb1a28abf1038f2a97/janes-janes-strategic-weapon-systems-2003-web-edition.jpg)