Strategic Plan 2016-2020* - European Commission · 1 Version of 15/03/2016 Strategic Plan...
42
1 Version of 15/03/2016 Strategic Plan 2016-2020* DG Maritime Affairs and Fisheries *The current Commission's term of office runs until 31 October 2019. New political orientations provided by the incoming Commission for the subsequent period will be appropriately reflected in the strategic planning process. Ref. Ares(2016)1374289 - 18/03/2016
Transcript of Strategic Plan 2016-2020* - European Commission · 1 Version of 15/03/2016 Strategic Plan...
1
Version of 15/03/2016
Strategic Plan 2016-2020* DG Maritime Affairs and Fisheries
*The current Commission's term of office runs until 31 October 2019. New political orientations
provided by the incoming Commission for the subsequent period will be appropriately reflected in the strategic planning process.
Ref. Ares(2016)1374289 - 18/03/2016

2
Contents
Foreword ................................................................................................................................... 3
PART 1. Strategic vision for 2016-2020 ................................................................................... 4
A. Mission statement ........................................................................................................... 4
B. Operating context ........................................................................................................... 4
C. Strategy ........................................................................................................................... 6
D. Key performance indicators (KPIs) .............................................................................. 31
PART 2. Organisational management ..................................................................................... 32
A. Human Resource Management .................................................................................... 32
B. Financial Management: Internal control and Risk management .................................. 35
C. Better Regulation .......................................................................................................... 38
D. Information management aspects ................................................................................. 40
E. External communication activities ............................................................................... 42
Annex to the Strategic Plan: Intervention logic ...................................................................... 42
3
Foreword
If we want future generations to inherit healthy, productive oceans, we need to take better care of our marine and maritime resources today. The reform of the EU's Common Fisheries Policy (CFP) has given us a valuable toolkit to make our fisheries more sustainable. Regionalisation, scientific advice, multi-annual planning – these are some of the tools at our disposal. Now it is time for us to shift gears and move to implementation mode. Looking ahead to 2020, the reform has set the following aims: achieving our objective to exploit fish stocks at maximum sustainable yield (MSY) levels by 2020 at the latest, and successfully phasing in the landing obligation for various fisheries. We are already taking steps along this path, but it will be crucial to keep up the momentum.
The drive for a sustainable use of our oceans is also part of the core values that we project in our engagement with partners beyond the EU. Our oceans are by definition a shared resource, and their good management is a shared responsibility. That is why we are joining forces with partners around the world for better international ocean governance. From aquaculture and coastal tourism to ocean energy and marine biotech – the "blue economy" offers huge potential for jobs and growth. Better managed oceans – both at home and abroad – will allow us to tap into that potential. In this way, we can build a thriving ocean economy, to the benefit of European citizens today and tomorrow.
4
PART 1. Strategic vision for 2016-2020
A. Mission statement
The mission of the Directorate-General for Maritime Affairs and Fisheries (or "DG MARE") is: "To develop the potential of the European maritime economy and to secure sustainable fisheries, a stable supply of seafood, healthy seas and prosperous coastal communities – for today's Europeans and for future generations. This involves promoting an integrated approach to all maritime policies with a view to foster the blue economy; and formulating the development and implementation of the Common Fisheries Policy – the cornerstone of our actions for a sustainable exploitation of fisheries resources." This mission statement infuses all policy areas of DG MARE with a sense of purpose and long-term vision.
B. Operating context
The EU has exclusive competence for the conservation of marine biological resources1, both in EU waters and in relation to the international obligations deriving from UNCLOS2 and from other UN agreements to which the EU is a Party (e.g. the UN Fish Stocks Agreement). The exclusive competence equally applies to the bilateral fisheries agreements signed with third countries. All these areas are regulated by the Common Fisheries Policy (CFP). The CFP also includes areas of shared competences between the EU and its Member States3, where the subsidiarity principle4 applies. For aquaculture, for instance, the EU's added value resides in finding solutions to the sector's most common problems; in market policy, which is essential to create a single market in fishery and aquaculture products and ensure fair competition, Member States and economic actors (such as producer organisations) maintain a high degree of autonomy in applying the various market policy instruments at their disposal.
Next to the CFP, the other main policy strand of DG MARE is that of maritime policy. Our Integrated Maritime Policy (IMP) provides a coherent approach to all other maritime issues through close coordination and cooperation across sectors and between international, national, regional and local decision makers. Similarly, our Blue Economy policy encourages EU governments, industry and stakeholders to develop joint approaches to drive growth, while safeguarding the marine environment and Europe's unique maritime assets.
The financial instrument to support the implementation of the CFP and certain actions under IMP is the European Maritime and Fisheries Fund (EMFF) 2014-2020. This is one of the five European Structural and Invesment Funds (ESIF)5 operating under the Common Provision Regulation. It covers funds both under direct management and under shared management with the Member States.
1 3 (1) (d) of the Treaty on the Functioning of the European Union (TFEU). 2 United Nations Convention for the Law of the Sea. 3 Article 4 (2) (d) TFEU. 4 Article 5(3) of the Treaty on the European Union. 5 The ESI funds are the following:
EMFF (European Maritime and Fisheries Fund)
ERDF (European Regional Development Fund)
ESF (European Social Fund)
CF (Cohesion Fund)
EAFRD (European Agricultural Fund for Rural Development).
5
Expenditure under direct management covers:
measures to develop and implement the IMP;
measures supporting scientific advice and knowledge, Advisory Councils, voluntary contributions to international and regional organisations, measures supporting market intelligence, measures related to control, inspection and enforcement, and communication activities;
technical assistance managed by the European Commission. The bulk of the funds are managed jointly with the Member States (shared management) and are destined to support:
CFP implementation, aquaculture and bottom-up local development;
marketing and processing, producer organisations, production sectors, and compensation for operators in the outermost regions;
control, inspection and enforcement;
fisheries-related data collection;
a number of key pan-European objectives such as marine knowledge and integrated maritime surveillance.
Each Member State details the use of the funds received in shared management in an operational programme, covering the period 2014-2020, which has to contribute to four of the eleven thematic objectives6 of the ESI funds and translate the Europe 2020 strategic objectives into investment priorities. The EMFF is not only directed to fisheries and innovation in fisheries, aquaculture and processing but also to support diversification and promote the economic development of fisheries dependent areas. The Blue Growth agenda of IMP can be mainly supported through the other ESI funds. The control and management of EMFF expenditure is aligned to that of the cohesion funds, with some limited differences due to the proportionality principle7 and the specificities of the CFP. The main partners for DG MARE are the blue economy industries, including fishing and aquaculture, and related organisations, public bodies (other EU institutions, Member States and their national or regional administrations, coastal regions), a wide range of maritime stakeholders (maritime professions, NGOs and civil society, opinion makers, marine and maritime research, academia). The public at large, and particularly informed consumers or citizens of coastal regions, are an important target. We work closely with the Advisory Councils, the European Fisheries Control Agency, the Executive Agency for Small and Medium-sized Enterprises, other Commission services as well as administrations of partner countries and international organisations. Every year we perform a risk assessment to ascertain if any critical factors in DG MARE's operating environment can prevent us from delivering on our mission or attain the general and specific objectives defined in this Strategic Plan. For each identified risk, mitigating measures or specific actions are undertaken.
6 Thematic objectives (TO): TO 3: competitiveness of SMEs in the fisheries sector; TO 4: supporting the shift towards a carbon-free economy; TO 6: preserving and protecting the environment and promoting resources efficiency; TO 8: promoting sustainable and quality employment. 7 The EMFF operational programmes are on most cases smaller than those under cohesion policy.

6
C. Strategy
DG MARE aims to contribute to the following four general objectives of the Commission:
General objective I: A New Boost for Jobs, Growth and Investment
General objective II: A Resilient Energy Union with a Forward-Looking Climate Change Policy
General objective III: Towards a New Policy on Migration
General objective IV: A Stronger Global Actor
Our three specific objectives contribute to the general objectives as indicated in the following graph8:
8 The graph represents the main inter-linkages between the specific objectives and the general objectives. It does
not exclude other links such as the contribution from specific objective 3 to general objectives I, II and III as
improved ocean governance creates business opportunities for EU operators (general objective I), promotes
ocean energy (general objective II) and contributes to sustainable use of resources in developing countries,
thereby limiting migration incentives (general objective III).

7
General objective I: A New Boost for Jobs, Growth and Investment
According to available studies, the maritime economy provides over 5 million jobs in Europe. Half of these are in coastal tourism, while the other half is divided up mostly between fishing and fish-farming, mineral extraction (largely oil and gas), shipbuilding and shipping.
Our Blue Economy policy aims at both strengthening the traditional sectors and stimulating the new ones, so that the maritime world can bring an even more substantial – and smart – contribution to growth and jobs in Europe.
The potential is there. Today, for instance, the fastest growing sector is offshore renewable energy, mostly wind energy, which has gone from virtually zero seven years ago to 75,000 jobs today. Marine biotechnologies are developing new products as well, and other emerging industries are bound to gain ground in the immediate future.
But there are a number of bottlenecks to growth in each sector. For example, investors in new infrastructure need access to harmonised data over a sea basin. This would reduce costs and uncertainty and encourage innovation, but Member States on their own seem unable to coordinate such processes: projects collapse once EU support ceases. A sustainable EU process is therefore required. Moreover many potential investors still think on a national scale and are unaware of what other countries are doing or of the possibilities provided by EU structural or strategic funding. Between 2016 and 2020 DG MARE will therefore work to remove obstacles to growth, in particular by:
reducing investment risk by increasing accessibility, availability and interoperability of data
on the marine environment;
assisting Member States in adopting spatial plans for their waters (as per the Maritime
Spatial Planning Directive);
encouraging public authorities in each sea basin to work together on common strategies and
action plans;
raising awareness on the potential of the blue economy and mobilising public and private
bodies to invest in research, skills and infrastructure; stimulating innovation by building
bridges between researchers and industry.
This will be done across the blue economy spectrum. There has been particular emphasis on five areas where an additional push at EU level can stimulate jobs and help European companies compete internationally whilst ensuring high environmental standards. These are: aquaculture, coastal and cruise tourism, blue energy, marine mineral resources and blue biotechnology. For all maritime activities, and in line with the third pillar of the Investment Plan for Europe, we will identify and remove obstacles to investment such as red tape or access to capital; we will be fostering European know-how; and we we will drive innovation through targeted financial support.
Aquaculture is a case in point. Not only does aquaculture help us satisfy the market's demand for seafood with high-quality produce; it also contributes to developing coastal areas through several ancillary activities, like technology, infrastructure etc., which are made in the EU. In Europe the sector has high environmental and animal welfare standards. Despite that, it has been stagnant for the last decade and our objective is to create the conditions for it to leap forward sustainably. We have provided a framework for national strategy development and are facilitating a voluntary process for cooperation through which Member States can exchange good practices in policies, programmes and institutional arrangements.

8
Both aquaculture and fisheries may seem like rather small segments of the European economy in absolute terms – but in relative terms in many coastal regions of Europe they are essential. Firstly, they are a source of jobs and income to communities that have few alternative options. Secondly, in many areas the importance of these sectors goes beyond pure economics and touch upon the social fabric of communities, and upon the preservation and promotion of ancient traditions and cultures. It is essential that economic activity in these areas be consolidated or expanded whenever possible towards other maritime activities.
For consolidation, the CFP sets the objective to achieve Maximum Sustainable Yield9 for all commercial fish stocks at the latest by 2020. Having more fish in the sea means higher yields, better salaries and better working conditions for fishermen - and a more competitive industry altogether. The EMFF will also contribute to creating jobs and improving life on board, so that the profession can become more appealing to European youth.
For expansion, it should be noted that a thriving fisheries sector can easily spin into new initiatives or find synergies with other sectors. Through our policy and funding, we strongly encourage local communities to diversify into new maritime activities, such as tourism and adding value locally to fisheries products.
Through its Blue Economy policy, including fisheries and aquaculture, DG MARE's objective is to make coastal areas attractive for investment and let them become poles of innovation. At the same time, we monitor closely these activities to make sure blue growth is sustainable.
General objective: A New Boost for Jobs, Growth and Investment
Impact indicator: Employment rate population aged 20-64. Source of the data: Eurostat.
Baseline (2014) Target (2020) Europe 2020 target
69.2% At least 75%
9 Fishing at MSY (Maximum Sustainable Yield) rates means: fishing a stock at the highest possible rate without
jeopardizing the stock's ability to reproduce.

9
1. Specific measurement of Growth for Fisheries: Economic growth potential and environmental
sustainability measured by the proportion (Atlantic) or number of stocks (Mediterranean and Black Sea)
that are fished at MSY levels10.
This indicator measures the potential for economic growth derived from the sustainable exploitation of
marine biological resources. Fishing at MSY (Maximum Sustainable Yield) means fishing at a rate such that
the average long-term catches are the highest that the stock can provide over the long-term. This ensures
stable revenue for fishermen. The fishing mortality rate is the annual catch divided by the annual average
biomass of exploitable fish in the sea.
Source of data:
For the Northeast Atlantic and adjacent waters: STECF report "Monitoring the performance of the Common Fisheries Policy", STECF-15-04, Tables 1 and 2;
For the Mediterranean and Black Seas, COM(2015) 239 final, Annex II Table 1 and the final report of the STECF-EWG 15-11 (https://stecf.jrc.ec.europa.eu/ewg1511)
Baseline 2013 Interim Milestone Target: by 2020 at the latest
In 2014, 89% of the stocks in the Northeast Atlantic and
adjacent waters had a scientific advice on MSY.
No interim milestones
have been set in EU
legislation.
Exploitation at MSY rate for all commercially exploited stocks.
Target set by Article 2 of Regulation (EU) No 1380/2013 of the European Parliament and of the Council of 11 December 2013 on the CFP.
10 In the Mediterranean and Black Seas, the "proportion" of stocks fished sustainably is not provided because the total
number of stocks is unknown. The respective catches, in live weight, of the known stocks correspond to a limited part of the total catches (i.e. approx. 495 Kt out of 1.4.Mt total estimated, Source: STECF, GFCM-SAC, and FAO Capture Production). The total number of known stocks may therefore be still very limited compared to the total number of stocks.
43 43
59
44
52
0
10
20
30
40
50
60
70
Northeast Atlantic & adjacent waters: Proportion (%)of stocks fished at MSY rate
Stock status
2010 2011 2012 2013 2014

10
In 2014, 90 stocks in the Mediterranean and Black Seas
had a scientific advice on MSY. For greater clarity, the
percentages are given for each year's assessments
instead of a cumulative total.
For 2015, the data for the Mediterranean and Black Seas
are still pending.
Situation as per Annual Activity Report 2015: The results for 2015 still need to be endorsed by the respective scientific committees, which should take place by April 2016 (both for GFCM-SAC and STECF). According to the latest available information 32 out of 62 assessed fish stocks in the Northeast Atlantic and adjacent waters are fished at or below the rate corresponding to MSY. In the Mediterranean and Black Seas, out of the 90 stocks assessed most recently, 7 stocks were fished sustainably.
Planned evaluations:
Ex-post evaluation of the regulation concerning management measures for the sustainable
exploitation of fishery resources in the Mediterranean Sea11
: 2nd quarter 2016, fisheries policy.
Evaluation of the impact of the Control regulation on the Common Fisheries Policy (according to Art.
118(3) of the Control regulation). This evaluation will include a synthesis of the Member States'
report on the implementation of the Control regulation (according to Art. 118(2)): 1st quarter 2016,
fisheries control policy.
Achieving MSY exploitation rates depends on a number of external factors that are beyond the legislator's and/or the Commission's control. A main factor is that the annual decisions on fishing opportunities are taken by the Council or, occasionally, by Member States (e.g. setting of maximum allowable catch per vessel per day for Spanish purse seines targeting small pelagic species, BOE-A-2012-15740). Other stocks are managed jointly with non-EU states (notably demersal species such as hake and deep-water rose shrimp in the Strait of Sicily). The Commission can influence this outcome through its proposals and subsequent negotiations on TACs and multiannual plans, and by making sure that scientific advice is available in support of policy choices. In the Mediterranean and Black Seas, where many stocks are exploited jointly with non-EU fishing vessels, the EU plays a crucial role in pushing forward new management measures against overfishing applicable to all involved coastal states.
11 Council Regulation (EC) No 1967/2006 of 21 December 2006 concerning management measures for the sustainable
exploitation of fishery resources in the Mediterranean Sea, amending Regulation (EEC) No 2847/93 and repealing Regulation (EC) No 1626/94.
5
11
4
7 7
0
2
4
6
8
10
12
Mediterranean and Black Seas: Number ofassessed stocks fished at MSY rate
Stock status
2010 2011 2012 2013 2014
11
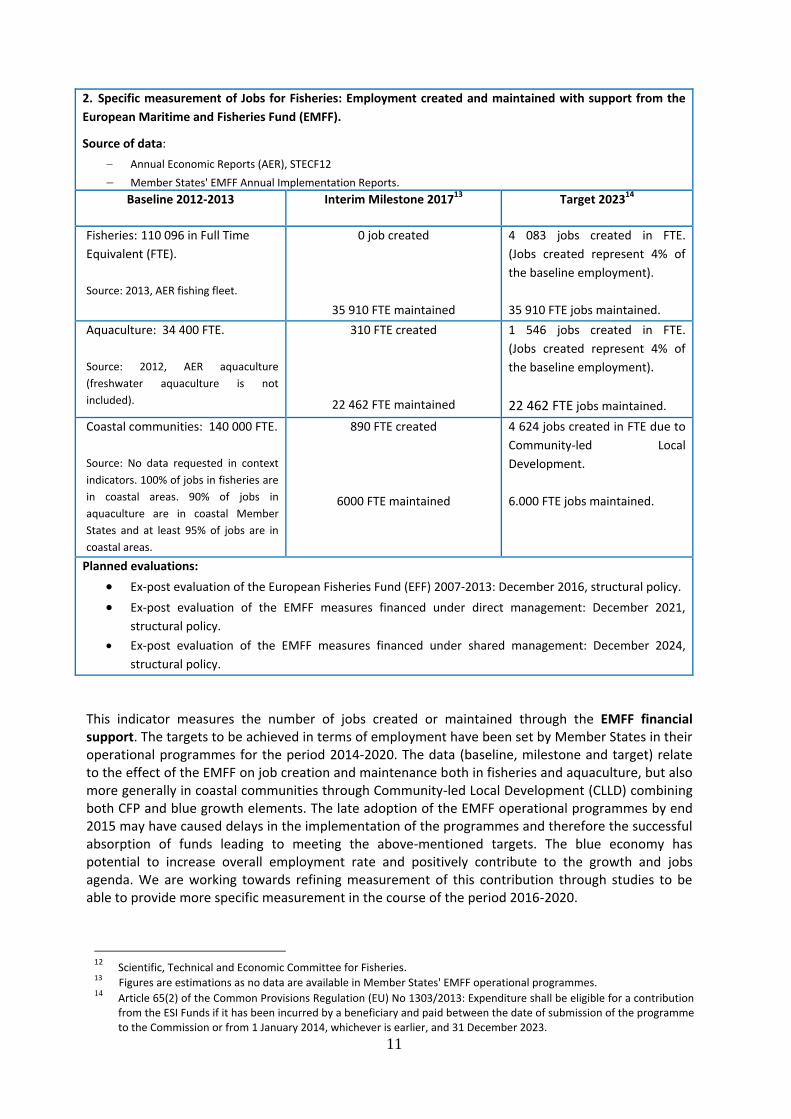
2. Specific measurement of Jobs for Fisheries: Employment created and maintained with support from the
European Maritime and Fisheries Fund (EMFF).
Source of data:
Annual Economic Reports (AER), STECF12
Member States' EMFF Annual Implementation Reports.
Baseline 2012-2013 Interim Milestone 201713 Target 202314
Fisheries: 110 096 in Full Time
Equivalent (FTE).
Source: 2013, AER fishing fleet.
0 job created
35 910 FTE maintained
4 083 jobs created in FTE.
(Jobs created represent 4% of
the baseline employment).
35 910 FTE jobs maintained.
Aquaculture: 34 400 FTE.
Source: 2012, AER aquaculture
(freshwater aquaculture is not
included).
310 FTE created
22 462 FTE maintained
1 546 jobs created in FTE.
(Jobs created represent 4% of
the baseline employment).
22 462 FTE jobs maintained.
Coastal communities: 140 000 FTE.
Source: No data requested in context
indicators. 100% of jobs in fisheries are
in coastal areas. 90% of jobs in
aquaculture are in coastal Member
States and at least 95% of jobs are in
coastal areas.
890 FTE created
6000 FTE maintained
4 624 jobs created in FTE due to
Community-led Local
Development.
6.000 FTE jobs maintained.
Planned evaluations:
Ex-post evaluation of the European Fisheries Fund (EFF) 2007-2013: December 2016, structural policy.
Ex-post evaluation of the EMFF measures financed under direct management: December 2021,
structural policy.
Ex-post evaluation of the EMFF measures financed under shared management: December 2024,
structural policy.
This indicator measures the number of jobs created or maintained through the EMFF financial support. The targets to be achieved in terms of employment have been set by Member States in their operational programmes for the period 2014-2020. The data (baseline, milestone and target) relate to the effect of the EMFF on job creation and maintenance both in fisheries and aquaculture, but also more generally in coastal communities through Community-led Local Development (CLLD) combining both CFP and blue growth elements. The late adoption of the EMFF operational programmes by end 2015 may have caused delays in the implementation of the programmes and therefore the successful absorption of funds leading to meeting the above-mentioned targets. The blue economy has potential to increase overall employment rate and positively contribute to the growth and jobs agenda. We are working towards refining measurement of this contribution through studies to be able to provide more specific measurement in the course of the period 2016-2020.
12 Scientific, Technical and Economic Committee for Fisheries. 13 Figures are estimations as no data are available in Member States' EMFF operational programmes. 14 Article 65(2) of the Common Provisions Regulation (EU) No 1303/2013: Expenditure shall be eligible for a contribution
from the ESI Funds if it has been incurred by a beneficiary and paid between the date of submission of the programme to the Commission or from 1 January 2014, whichever is earlier, and 31 December 2023.

12
3. Specific measurement of Growth for Fisheries: Profitability of the EU fishing fleet.
The net profit margin (calculated as the ratio of net profit and revenues) gives an indication of the relative
profitability of the fishing fleet. It reflects the short-term economic sustainability of the fishing enterprises.
Source of data: DCF15 data obtained from the 2015 Annual Economic Report on the EU Fishing Fleet, STECF:
https://stecf.jrc.ec.europa.eu/documents/43805/1034590/2015-07_STECF+15-07+-
+AER+2015_JRC97371.pdf
Baseline 2013 Interim Milestone 2017 Target 202316
Net profit margin of the EU fishing
fleet: average 8%.
Source: 2015, Annual Economic Report
of the EU fleet (based on data obtained
from the latest DCF fleet economic
data call).
Net profit margin of the EU fishing
fleet: average 9%.
Net profit margin of the EU
fishing fleet: average 10%.
Target set by DG MARE based on
long-term economic projections
in the impact assessment of the
new basic regulation on the CFP
(SEC(2011) 891, SEC(2011)892)17
.
Planned evaluations: N/A
The baseline is built on the Annual Economic Report for the EU fleets of 2015. The projections for 2017 and 2023 assume that fuel prices and other costs as well as the fish prices do not significantly depart from the assumptions made in the impact assessment. Achieving an average of 8% net profit margin by 2023 would ensure that the EU fishing fleet is economically sustainable and operates with a healthy profitability. Although EMFF support and a stable regulatory framework with the new CFP can contribute to ensuring that these projections remain on course, factors such as economic growth or recovery, changing fuel prices, adaptations within the sector and access to fishing grounds remain the most important elements in determining the profitability of the EU fishing fleet.
15 Data Collection Framework. 16 Article 65(2) of the Common Provisions Regulation (EU) No 1303/2013: Expenditure shall be eligible for a contribution
from the ESI Funds if it has been incurred by a beneficiary and paid between the date of submission of the programme to the Commission or from 1 January 2014, whichever is earlier, and 31 December 2023.
17 http://ec.europa.eu/smart-regulation/impact/ia_carried_out/cia_2011_en.htm#mare
13
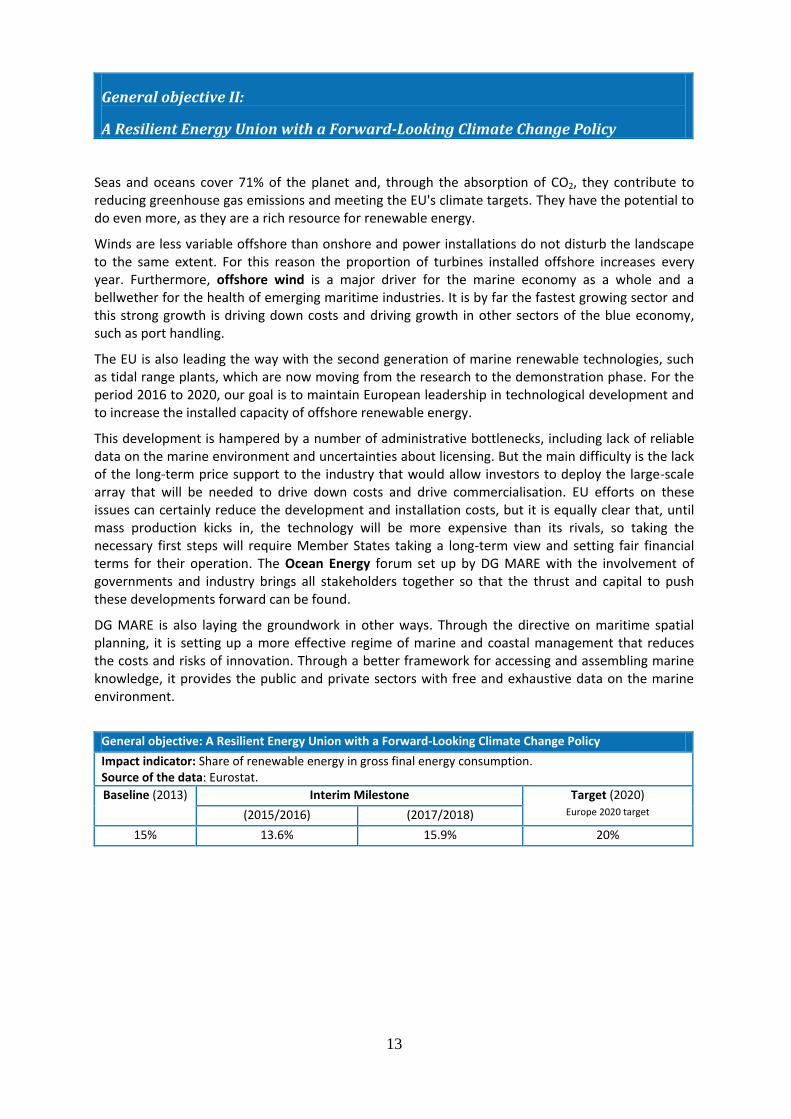
General objective II:
A Resilient Energy Union with a Forward-Looking Climate Change Policy
Seas and oceans cover 71% of the planet and, through the absorption of CO2, they contribute to reducing greenhouse gas emissions and meeting the EU's climate targets. They have the potential to do even more, as they are a rich resource for renewable energy.
Winds are less variable offshore than onshore and power installations do not disturb the landscape to the same extent. For this reason the proportion of turbines installed offshore increases every year. Furthermore, offshore wind is a major driver for the marine economy as a whole and a bellwether for the health of emerging maritime industries. It is by far the fastest growing sector and this strong growth is driving down costs and driving growth in other sectors of the blue economy, such as port handling.
The EU is also leading the way with the second generation of marine renewable technologies, such as tidal range plants, which are now moving from the research to the demonstration phase. For the period 2016 to 2020, our goal is to maintain European leadership in technological development and to increase the installed capacity of offshore renewable energy.
This development is hampered by a number of administrative bottlenecks, including lack of reliable data on the marine environment and uncertainties about licensing. But the main difficulty is the lack of the long-term price support to the industry that would allow investors to deploy the large-scale array that will be needed to drive down costs and drive commercialisation. EU efforts on these issues can certainly reduce the development and installation costs, but it is equally clear that, until mass production kicks in, the technology will be more expensive than its rivals, so taking the necessary first steps will require Member States taking a long-term view and setting fair financial terms for their operation. The Ocean Energy forum set up by DG MARE with the involvement of governments and industry brings all stakeholders together so that the thrust and capital to push these developments forward can be found.
DG MARE is also laying the groundwork in other ways. Through the directive on maritime spatial planning, it is setting up a more effective regime of marine and coastal management that reduces the costs and risks of innovation. Through a better framework for accessing and assembling marine knowledge, it provides the public and private sectors with free and exhaustive data on the marine environment.
General objective: A Resilient Energy Union with a Forward-Looking Climate Change Policy
Impact indicator: Share of renewable energy in gross final energy consumption. Source of the data: Eurostat.
Baseline (2013) Interim Milestone Target (2020)
Europe 2020 target (2015/2016) (2017/2018)
15% 13.6% 15.9% 20%

14
4. Specific measurement for Energy Union: Share of ocean energy and offshore wind energy in the overall EU
renewable energy mix.
Steadier winds and lower disturbance than on land as well as falling costs are driving an increase in the
proportion of offshore wind in the total amount of renewable energy consumption in the EU. A figure that is
itself rising by approximately 6% a year. Towards the end of the decade it is feasible for power from tidal
lagoons to enter the mix with prospects for tidal stream and wave power contributing in the following decade.
DG MARE's initiatives contribute to ensure that the growth does not falter. This not only contributes to the
EU's greenhouse gas emission reduction targets but creates jobs. Presently the sector supports about 75,000
jobs – a total that has been growing at 30% a year.
Source of data: Eurostat Supply, transformation and consumption of renewable energies - annual data [nrg_107a] updated
27 April 2015, extracted 14 December 2015.
The share of offshore in the total consumption of wind energy was estimated from the average proportion of total installed
capacity in the year. These data were obtained from the European Wind Energy Association.
Baseline 2013 Interim Milestone 2017 Target 2020
0.54% 0.72% 1.03%
The target assumes a continuing rise in renewable
energy consumption of 6%, achieving the European
Wind Energy Association's 'medium growth scenario'
estimate of 23.5GW of installed capacity of offshore
wind by 2020 and at least one tidal lagoon in addition
to the tidal barrage at La Rance providing power to the
grid.
Planned evaluations: N/A

15
General objective III: Towards a New Policy on Migration The EU Maritime Security Strategy (EUMSS) intends to combine the efforts of all relevant maritime actors with a view to enhancing their efficiency and cost effectiveness. This coordinated approach towards all maritime security aspects will bring added value to the management of migration flows, in particular in the Mediterranean Sea, and will improve both the protection of the EU’s maritime borders and rescue operations. A coordinated approach by security actors allows faster intervention. A key novelty of the strategy is its cross sectorial approach. Different maritime surveillance functions (boarder control, fisheries control, defence etc.) can and should work much more closely together and systematically share resources such as vessels and radars. Civil-military co-operation can also be enhanced.
A building block of the EUMSS is the Maritime CISE (Common Information Sharing Environment) process, which is set to improve interoperability between over 300 surveillance authorities, in order for them to collaborate better and thus deploy the future EUMSS. This will increase both effectiveness and cost-efficiency: it could reduce the average maritime threat level by 30% and bring over € 4 billion added value to society over ten years. Progress will be measured through the extent to which the information gap between maritime surveillance authorities from various sectors is progressively filled by the maritime CISE.
As to rescue operations at sea, information about migrants leaving the north-African coast for the shores of Europe needs to be automatically shared with all relevant authorities. Faster information sharing allows faster intervention and saves more lives. The real-time exchange among Member States of surveillance and rescue assets positions (patrol vessels and aircrafts) significantly reduces intervention time and allows making the best use of surveillance capabilities.
In December 2015, the Commission adopted the border and coast guard package, which inter alia introduces a proposal for a joint mandate of three EU agencies for European co-operation on coastguard functions to support national authorities at national and EU level. This initiative has been welcomed by the European Parliament and the Council and it is hoped that it can be fast-tracked for swift adoption.
General objective: Towards a New Policy on Migration
Impact indicator: Rate of return of irregular migrants to third countries. Explanation: The indicator measures the % of effected returns compared to return decisions issued by the Member States. Source of the data: Eurostat, Frontex.
Baseline (2014) Target (2020)
40% Increase

16
5. Specific measurement for Maritime security: Closing the information gap18 across borders and sectors to improve maritime surveillance.
The Common Information Sharing Environment for the EU maritime domain (Maritime CISE) is one of the strands of the European Maritime Security Strategy. The goal is to improve the awareness picture of relevant authorities by closing the information sharing 'gap' involving maritime safety, security, environment and migration, currently estimated at ~70%. Progress will be measured by the extent to which this gap is reduced over time.
Source of data: information from the Member State Expert sub Group (MSEsG)19.
Baseline 2013 Interim Milestone 2018 Target 2020
The baseline consists of the 70% information sharing 'gap' identified by maritime surveillance experts (only 30% of relevant existing surveillance information is shared between authorities across sectors and borders).
The identified baseline gap is
reduced by ~15% meaning that
~40% of relevant surveillance
information is shared.
The identified baseline gap is reduced by ~40% meaning that ~60% of relevant surveillance information is shared.
Target set by DG MARE in the Impact
Assessment accompanying the CISE
Communication.
Planned evaluations:
Regular implementation reviews of the EUMSS Action Plan.
18 The information gap analysis was carried out by the expert group in charge of the CISE project.
It identified the unsatisfied cross-sectoral demand (gap) for ~500 generic maritime surveillance data elements. Depending on the sectors, the gap revealed to range between 40% and 90% of total information necessary for relevant sectors.
19 https://webgate.ec.europa.eu/maritimeforum/
17
General objective IV: A Stronger Global Actor With its zero-tolerance policy against illegal, unreported and unregulated (IUU) fishing and sustainability objectives, the EU has become a driving force of sustainable fisheries and maritime affairs worldwide.
DG MARE will continue to contribute to the EU's efforts to shape international ocean governance with a view to ensuring a sustainable use of the oceans and their resources for the benefit of blue economy. For the next few years the main ocean governance issues will include: the improved enforcement of international rules and the coordination between international bodies governing the seas, the fight against IUU fishing, the reduction of fishing overcapacity, the transparency of access arrangements and the effectiveness of Regional Fisheries Management Organisations (RFMOs). More specifically, the review of the United Nations Fish Stocks Agreement in 2016, and the UNCLOS Implementation Agreement on biodiversity will be important milestones for DG MARE's work on ocean governance.
The Commission will therefore continue to proactively promote sound ocean governance on a global scale, and will do so by keeping its presence and strong voice in the UN, the FAO and all the RFMOs. A number of working partnerships are established with key counterparts – such as the US, Japan, Canada, New Zealand, Australia and China - to develop a common approach for international negotiations, and particularly on the fight against IUU. This systematic approach is accompanied by regular outreach towards negotiating partners before and during international meetings.
Today the sustainable fisheries partnership agreements (SFPAs) that DG MARE concludes with third countries also set the standard for international fishing policy. By virtue of these agreements, EU vessels can fish in the third countries’ exclusive economic zone and only tap into resources that are in excess of the hosting the country's needs. In exchange, the EU pays for part of the right of access and provides financial aid destined to develop sustainable fishing in the country itself. EU vessels operators also pay a license fee for access. The agreements are all centred on resource conservation and environmental sustainability, with EU vessels subject to strict supervision and transparency rules. All protocols contain a clause concerning respect for human rights in the hosting country. SFPAs are instrumental for the EU to set high standards at the global level, and have become a reference for other fleets and licences outside the scope of SFPAs. There are currently 14 SFPAs in force, and DG MARE's objective is to manage, maintain and expand this network and thus contribute to sound ocean governance.
One of the most important factors undermining sustainable management of oceans and their resources is IUU fishing. It depletes fish stocks, destroys marine habitats, endangers food security, distorts competition, puts honest fishermen at an unfair disadvantage and weakens coastal communities. To counter this, the EU cooperates with third countries on this matter. The EU actively leads the process of strengthening the compliance of third countries with their international legal obligations as flag, coastal, port or market States in the fight against IUU fishing. This enables them to conserve and manage marine living resources under their purview and reform their fisheries management policies. In some cases this cooperation led to a process of pre-identification in order to solve the established breach of international legal requirements.

18
To date (end 2015), twenty countries20 were pre-identified and therefore, received from the Commission a proposed action pan to address established shortcomings. It was only necessary to impose restriction on access to the EU market of marine fisheries products (trade ban) for four countries21. For one of these countries, Belize, the restriction on access to the EU market was lifted following completion of reforms addressing compliance with international law and standards. Eight countries22 have seen their pre-identification terminated because they have resolved their problems through the successful implementation of an action plan. With the remaining eight countries23, the EU is cooperating actively helping them to achieve their structural reforms in fisheries management.
Our trade negotiations with third countries or regions lead to the conclusion of comprehensive Economic Partnership Agreements and Free Trade Agreements that cover trade in fisheries and aquaculture products and open up market opportunities. Moreover trade agreements ensure a competitive supply for the EU's processing industry through tariff concessions; they ensure that market opening does not harm EU producers, they increase our producers' potential to export to or invest in third countries, and they create a level-playing field with third countries.
In addition to the trade negotiations, the EU opens tariffs quotas for certain fisheries products in order to ensure competitiveness and growth for the EU fish processing industry. It is an autonomous system, revised every three years to take into account the needs of the EU's producing and processing industry and the general trade context.
As an indicator we chose the sustainable management of those tuna species that are most significant in EU consumption patterns and for which we have information on the state of the stocks across different regions. It is difficult to assess and compare the state of stocks globally, as different RFMOs have different rules and obligations in terms of data collection and release. In terms of the externalities affecting the indicator and target, it must be noted that it is up to Member States to endorse and implement our policies in RFMOs. An even more severe impact on fish stocks could come from the stance and degree of compliance of other RFMO members.
General objective: A Stronger Global Actor
Impact indicator: Sustainable Development Goal 1.1.1: Proportion of population below international poverty line. Source of the data: World Bank (poverty rate); UN Population Division (population weights).
Baseline (2015) Interim Milestone Target (2030) UN Sustainable Development Goals
18.9% (including the graduated countries
- Partnership countries for which bilateral
assistance is phased out)
32.8% (excluding the graduated
countries)
For the calculation of the baseline beneficiary countries under the Development Cooperation Instrument and European Development Fund have been taken into account. Beneficiaries under the European Neighbourhood Instrument and EU- Greenland Partnership Instrument have been excluded.
Rolling On course for 2030 based on annual progress
report prepared by UN Secretary General.
0%
20 Belize, Cambodia, Fiji, Guinea, Panama, Sri Lanka, Togo, Vanuatu, Korea, Ghana, Curacao, Philippines, Papua New
Guinea, Solomon Islands, Tuvalu, Saint Kitts and Nevis, Saint Vincent and the Grenadines, Thailand, Taiwan and the Comoros.
21 Belize, Sri Lanka, Cambodia, Guinea. 22 Fiji, Panama, Togo, Vanuatu, Korea, the Philippines, Papua New Guinea, Ghana. 23 Curacao, Solomon Islands, Tuvalu, Saint Kitts and Nevis, Saint Vincent and the Grenadines, Thailand, Taiwan and
Comoros.
19
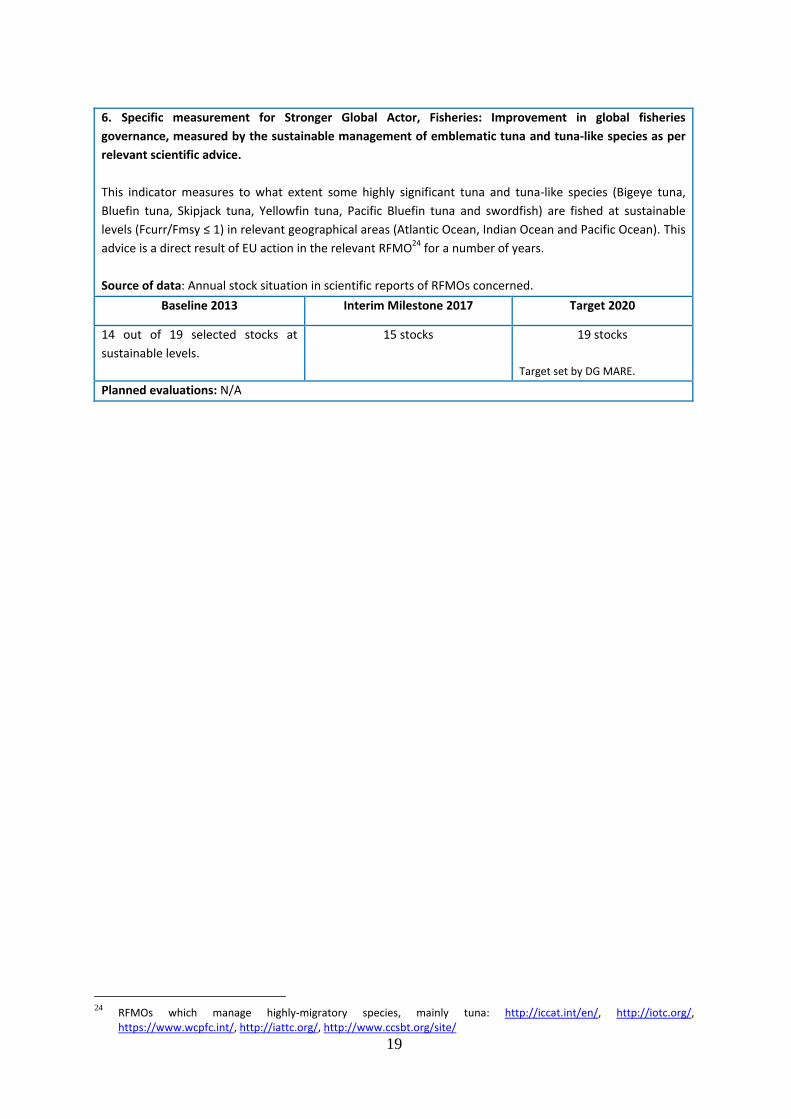
6. Specific measurement for Stronger Global Actor, Fisheries: Improvement in global fisheries
governance, measured by the sustainable management of emblematic tuna and tuna-like species as per
relevant scientific advice.
This indicator measures to what extent some highly significant tuna and tuna-like species (Bigeye tuna,
Bluefin tuna, Skipjack tuna, Yellowfin tuna, Pacific Bluefin tuna and swordfish) are fished at sustainable
levels (Fcurr/Fmsy ≤ 1) in relevant geographical areas (Atlantic Ocean, Indian Ocean and Pacific Ocean). This
advice is a direct result of EU action in the relevant RFMO24 for a number of years.
Source of data: Annual stock situation in scientific reports of RFMOs concerned.
Baseline 2013 Interim Milestone 2017 Target 2020
14 out of 19 selected stocks at
sustainable levels.
15 stocks 19 stocks
Target set by DG MARE.
Planned evaluations: N/A
24 RFMOs which manage highly-migratory species, mainly tuna: http://iccat.int/en/, http://iotc.org/,
https://www.wcpfc.int/, http://iattc.org/, http://www.ccsbt.org/site/
20
25
The number of new countries having significant IUU deficiencies is included for indicative purposes. It should not be understood as an objective of the Commission. 26
The number of new countries having significant IUU deficiencies is included for indicative purposes. It should not be understood as an objective of the Commission. 27
The number of new countries having significant IUU deficiencies is included for indicative purposes. It should not be understood as an objective of the Commission.
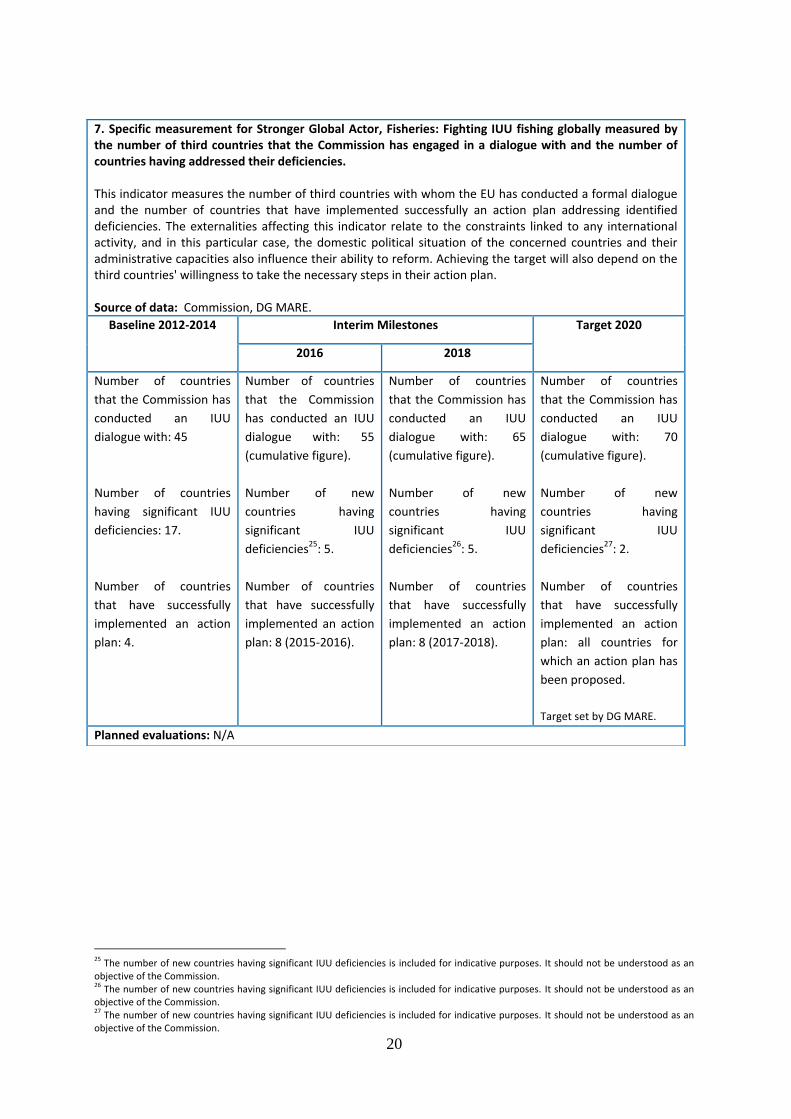
7. Specific measurement for Stronger Global Actor, Fisheries: Fighting IUU fishing globally measured by the number of third countries that the Commission has engaged in a dialogue with and the number of countries having addressed their deficiencies. This indicator measures the number of third countries with whom the EU has conducted a formal dialogue and the number of countries that have implemented successfully an action plan addressing identified deficiencies. The externalities affecting this indicator relate to the constraints linked to any international activity, and in this particular case, the domestic political situation of the concerned countries and their administrative capacities also influence their ability to reform. Achieving the target will also depend on the third countries' willingness to take the necessary steps in their action plan. Source of data: Commission, DG MARE.
Baseline 2012-2014 Interim Milestones Target 2020
2016 2018
Number of countries
that the Commission has
conducted an IUU
dialogue with: 45
Number of countries
having significant IUU
deficiencies: 17.
Number of countries
that have successfully
implemented an action
plan: 4.
Number of countries
that the Commission
has conducted an IUU
dialogue with: 55
(cumulative figure).
Number of new
countries having
significant IUU
deficiencies25: 5.
Number of countries
that have successfully
implemented an action
plan: 8 (2015-2016).
Number of countries
that the Commission has
conducted an IUU
dialogue with: 65
(cumulative figure).
Number of new
countries having
significant IUU
deficiencies26: 5.
Number of countries
that have successfully
implemented an action
plan: 8 (2017-2018).
Number of countries
that the Commission has
conducted an IUU
dialogue with: 70
(cumulative figure).
Number of new
countries having
significant IUU
deficiencies27: 2.
Number of countries
that have successfully
implemented an action
plan: all countries for
which an action plan has
been proposed.
Target set by DG MARE.
Planned evaluations: N/A

21
Our three specific objectives contribute as follows to the four general objectives:
General objective I: A New Boost for Jobs, Growth and Investment
Specific objective 1: More sustainable and competitive fisheries and aquaculture by 2020
Related to spending programme(s)
Programme-based: EMFF Non programme-based
The CFP gives prominence to EU aquaculture with the objective to have, by 2020, a more competitive EU business able to satisfy the growing global demand for seafood. The CFP promotes the development of sustainable EU aquaculture through an open method of coordination. It is our main objective to create the conditions for this sector to develop sustainably providing a framework for national strategy development and to facilitate a voluntary process for cooperation. The open method of coordination aims primarily to develop a mutual learning process across Member States. A key tool in this respect is good practice exchange seminars where Member States can share and assess the effectiveness of identified good practices in policies, programmes and institutional arrangements.
Result indicator 1: Volume and value of aquaculture production in the EU.
This indicator measures the volume and value of EU aquaculture production. It provides an indication of the economic performance of the sector. Increases in volume and value will contribute to the CFP objectives (by reducing pressure on wild stocks) and to the Blue Growth strategy (by securing jobs and growth in coastal and rural areas). This is one of the common indicators in the Member States' EMFF operational programmes.
Source of the data: Eurostat data; DCF data28; The 2014 Annual Economic Report on the EU Aquaculture, STECF29, Publications Office of the EU, Luxembourg.
Baseline 2013 Milestone 2017 Target 2020
Volume: 1.18 million tonnes.
Annual growth of +2% in
2016 and in 2017. +10% compared to the baseline 2013.
Target set by DG MARE based on:
long term projections in multiannual national plans for aquaculture of main producers
the study "Long-Term Economic and Ecological Impact of Larger Sustainable Aquaculture" (European Parliament, 2014)
recent production and economic trends in the EU aquaculture production.
Value: €3.85 billion. Annual growth of +2,25%
in 2016 and in 2017. +17% compared to the baseline 2012.
Target: see above.
28 EU framework for the collection, management and use of data in the fisheries sector ("Data Collection Framework"). 29 Scientific, Technical and Economic Committee for Fisheries.

22
Fishing occurs over a common good. The control of fishing activities is essential to ensure that this common good is exploited sustainably and in compliance with the CFP. The aim of the EU control system is twofold:
To ensure that Member States comply with their control obligations and operate effective control structures and systems in order to guarantee a successful implementation of the CFP.
To ensure that rules are applied in all fisheries and across the EU with no disparities; that only the allowed quantities of fish are caught and that fisheries products can be traced throughout the supply chain.
In this sense an effective fisheries control ensures a level playing field for all operators and goes to the economic benefit of fishing communities and of consumers.
The main external factor is the economic crisis, which curbs the human and financial resources available to the competent authorities. The division of competencies between central and regional governments might weaken certain national control systems.
Result indicator 2: Number of Member States with an effective control system.
When it identifies shortcomings in the control system of a Member State by means of verifications, autonomous inspections or audits, the Commission establishes an action plan through an implementing decision. Each action plan is established in agreement with the Member State concerned and contains a detailed and time-bound roadmap for the improvement of the Member State's control system.
Source of data: Commission, DG MARE – Commission decisions establishing action plans.
Baseline December 2013
Interim Milestone 2017 Target 2020
6 Member States (ES, MT, IT, LV, PT, FR) are under an action plan to overcome shortcomings in their fisheries control system.
5 Member States are under an action plan meaning that almost all Member States have an effective control system. All Member States that were under an action plan in 2013 have successfully fulfilled it.
No Member State is under an action plan, meaning that all Member States have an effective control system. Target: Compliance with the Control regulation and its implementing rules.
Planned evaluations:
Evaluation of the impact of the Control regulation on the Common Fisheries Policy (according to Art. 118(3) of the Control regulation). This evaluation will include a synthesis of the Member States' report on the implementation of the Control regulation (according to Art. 118(2)): 1st quarter 2016, fisheries control policy.

23
Specific objective 2: A sustainable blue economy generating growth, jobs and prosperity by 2020
Related to spending programme(s)
Programme-based: EMFF Non programme-based
There are a number of bottlenecks to growth in the blue economy and EU activity is aiming to overcome these. For example, investors in new infrastructure need access to harmonised data over a sea basin. This reduces costs, encourages innovation and reduces uncertainty. Experience has shown that Member States on their own are unable to set up a sustainable way of achieving this and that limited-duration projects collapse once EU support ceases. A sustainable EU process is required.
At the same time, each country has developed separate approaches to the common opportunities and common threats in each sea basin. Sharing best practice can accelerate innovation and certain investments, such as cabling for offshore infrastructure, can be shared. EU structural or strategic funding can help but many potential investors are unaware of the possibilities.
Result indicator 1: EU investment relating to the blue economy expressed as percentage of total European
Structural and Investment Funds (ESIF).
An analysis of ESIF operational programmes indicated that of the 120 categories of spending, only 3 (2 on ports and one that included ocean energy) could be directly linked to the blue economy, apart from the funding that the EMFF will bring to fisheries and aquaculture and other maritime issues. The same goes for Smart Specialisation Strategies. Nevertheless, maritime projects could fit easily into many of the other categories – support to SMEs, research infrastructure, wind energy, making use of cultural or natural heritage to enhance attractiveness for tourism etc. Initial estimates suggest about 3% of total structural and investment funding could be spent on maritime issues. DG MARE has been raising awareness of these opportunities through events in all the sea basins and now the work has been taken up by regional and national administrations in the countries concerned. Source of data: Reports sent by Management Authorities and accessed through Infoview.
Baseline 2015 Interim Milestone 2017 Target 2023
3% of total
Source: estimate based on analysis of
the Member States' ESIF operational
programmes.
4% of total 5% of total
Target set by DG-MARE.
Planned evaluations:
Will be evaluated for each sea basin separately. For instance, for the Atlantic sea basin it will part of the evaluation of the Atlantic Action plan in 2017.
24
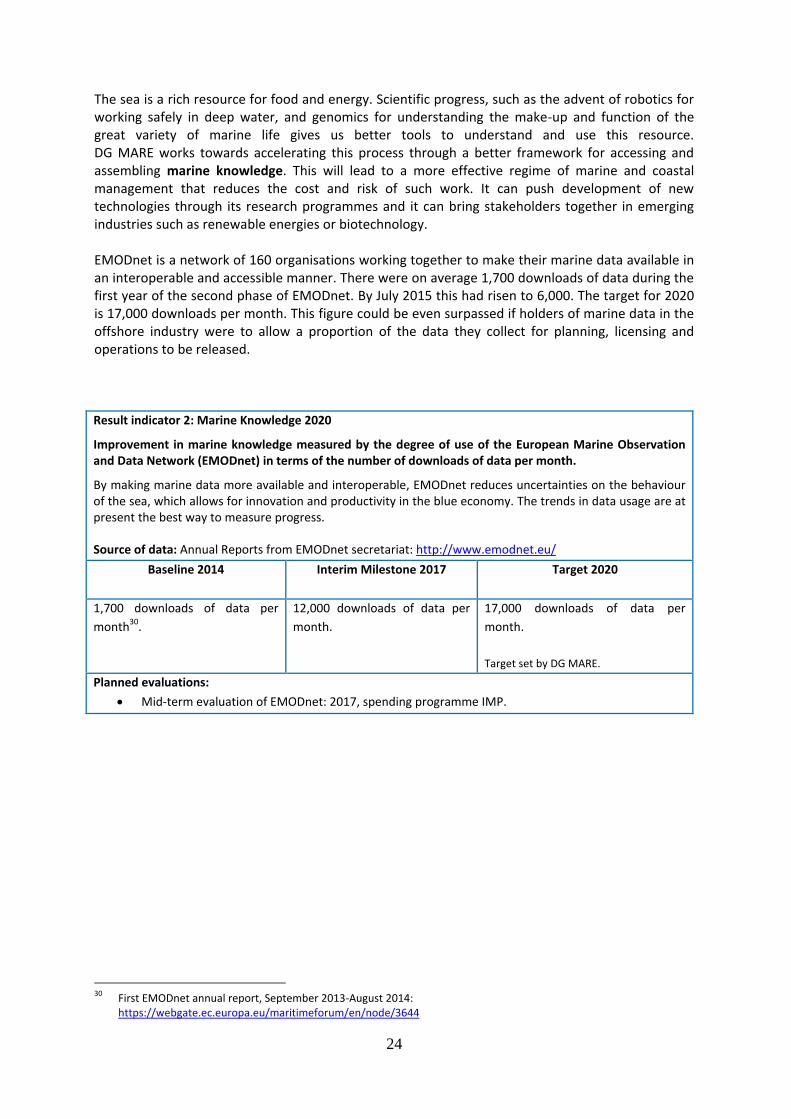
The sea is a rich resource for food and energy. Scientific progress, such as the advent of robotics for working safely in deep water, and genomics for understanding the make-up and function of the great variety of marine life gives us better tools to understand and use this resource. DG MARE works towards accelerating this process through a better framework for accessing and assembling marine knowledge. This will lead to a more effective regime of marine and coastal management that reduces the cost and risk of such work. It can push development of new technologies through its research programmes and it can bring stakeholders together in emerging industries such as renewable energies or biotechnology. EMODnet is a network of 160 organisations working together to make their marine data available in an interoperable and accessible manner. There were on average 1,700 downloads of data during the first year of the second phase of EMODnet. By July 2015 this had risen to 6,000. The target for 2020 is 17,000 downloads per month. This figure could be even surpassed if holders of marine data in the offshore industry were to allow a proportion of the data they collect for planning, licensing and operations to be released.
Result indicator 2: Marine Knowledge 2020
Improvement in marine knowledge measured by the degree of use of the European Marine Observation and Data Network (EMODnet) in terms of the number of downloads of data per month.
By making marine data more available and interoperable, EMODnet reduces uncertainties on the behaviour of the sea, which allows for innovation and productivity in the blue economy. The trends in data usage are at present the best way to measure progress.
Source of data: Annual Reports from EMODnet secretariat: http://www.emodnet.eu/
Baseline 2014 Interim Milestone 2017 Target 2020
1,700 downloads of data per
month30.
12,000 downloads of data per
month.
17,000 downloads of data per
month.
Target set by DG MARE.
Planned evaluations:
Mid-term evaluation of EMODnet: 2017, spending programme IMP.
30 First EMODnet annual report, September 2013-August 2014:
https://webgate.ec.europa.eu/maritimeforum/en/node/3644

25
General objective II: A Resilient Energy Union with a Forward-Looking Climate Change Policy
Specific objective 2: A sustainable blue economy generating growth, jobs and prosperity by 2020
Related to spending programme(s)
Programme-based: EMFF Non programme-based
The objective is to increase the installed capacity of offshore renewable energy throughout the period 2016-2020. Development of offshore renewable energy, like other sectors of the blue economy, is hampered by lack of reliable data on the marine environment and uncertainties about licensing. So EU efforts on these issues can reduce the development and installation costs and thus increase the competitiveness with other means of electricity generation.
Ocean renewable energy is emerging from the research to the demonstration phase. A number of the administrative bottlenecks can be tackled at an EU level such as the appropriate implementation of environmental protection regulations. The Ocean Energy Forum also aims to tackle financial and technical bottlenecks to the full commercialisation of the ocean energy sector.
Agreement amongst utilities in different Member States to share investments in cabling infrastructure between wind farms and from wind farms to shore would reduce the cost of offshore wind farm development and hence accelerate their deployment.
For ocean energy the main threat is a lack of a long-term stable price support to the industry that would allow investors to deploy the large-scale array that will be needed to drive down costs and drive commercialisation.
Result indicator 1a - Ocean Energy: installed capacity in offshore ocean energy.
Ocean energy includes, among others, tidal range, tidal stream and wave energy. It is a relatively new
renewable energy sector. Current capacity is limited but substantial growth is expected by 2020.
Source of data: Ocean Energy Europe, the trade association for ocean energy.
Baseline 2010 Interim Milestone 2017 Target 2020
250MW of ocean energy capacity installed (240MW of tidal range, 10MW tidal stream and wave).
271MW of ocean energy capacity installed.
848MW of ocean energy capacity installed (includes tidal range, tidal stream, wave, OTEC and salinity gradient technologies, pipeline analysis by OEE). Source of the target: JRC
31.
Planned evaluations: N/A
31 Ocean Energy Status Report, JRC, 2014: https://ec.europa.eu/jrc/en/publication/eur-scientific-and-technical-research-reports/2014-jrc-ocean-energy-status-report
26
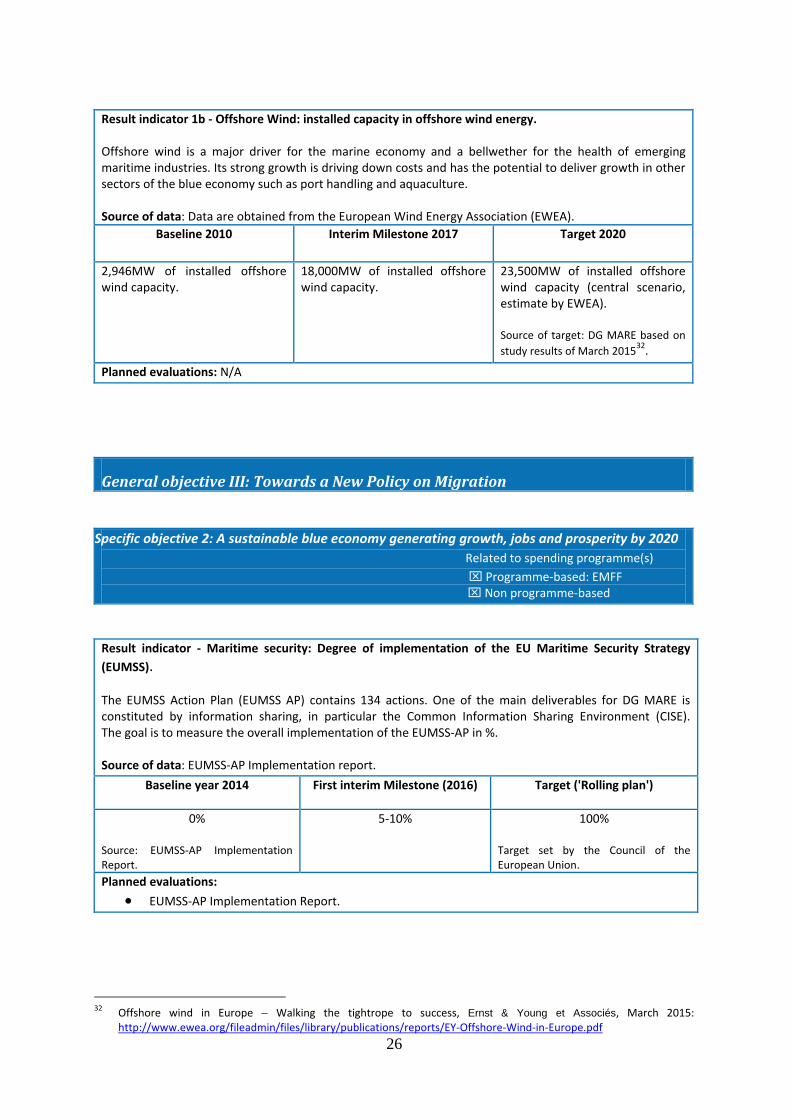
Result indicator 1b - Offshore Wind: installed capacity in offshore wind energy. Offshore wind is a major driver for the marine economy and a bellwether for the health of emerging maritime industries. Its strong growth is driving down costs and has the potential to deliver growth in other sectors of the blue economy such as port handling and aquaculture. Source of data: Data are obtained from the European Wind Energy Association (EWEA).
Baseline 2010 Interim Milestone 2017 Target 2020
2,946MW of installed offshore wind capacity.
18,000MW of installed offshore wind capacity.
23,500MW of installed offshore wind capacity (central scenario, estimate by EWEA). Source of target: DG MARE based on
study results of March 201532.
Planned evaluations: N/A
General objective III: Towards a New Policy on Migration
Specific objective 2: A sustainable blue economy generating growth, jobs and prosperity by 2020
Related to spending programme(s)
Programme-based: EMFF Non programme-based
Result indicator - Maritime security: Degree of implementation of the EU Maritime Security Strategy
(EUMSS). The EUMSS Action Plan (EUMSS AP) contains 134 actions. One of the main deliverables for DG MARE is constituted by information sharing, in particular the Common Information Sharing Environment (CISE). The goal is to measure the overall implementation of the EUMSS-AP in %. Source of data: EUMSS-AP Implementation report.
Baseline year 2014 First interim Milestone (2016) Target ('Rolling plan')
0%
Source: EUMSS-AP Implementation Report.
5-10% 100%
Target set by the Council of the European Union.
Planned evaluations:
EUMSS-AP Implementation Report.
32 Offshore wind in Europe Walking the tightrope to success, Ernst & Young et Associés, March 2015:
http://www.ewea.org/fileadmin/files/library/publications/reports/EY-Offshore-Wind-in-Europe.pdf
27
General objective IV: A Stronger Global Actor
Specific objective 3: Sustainable fisheries worldwide and improved international governance by 2020
Related to spending programme(s) Programme-based: EMFF Non programme-based
The performance of Regional Fisheries Management Organisations (RFMOs) is crucial to the sound management of marine resources worldwide and to ensure a more stable and secure supply of food.
DG MARE is very active within all international organisations dealing with fisheries including
RFMOs to make sure conservation rules, especially those against illegal fishing, are enforced. In parallel we seek to strengthen the RFMOs' performance and effectiveness because that, combined with a strict enforcement of rules, improves the environment for our economic operators and results in a more stable supply of sustainably caught fish. We foster cooperation amongst RFMOs and consistency between their respective regulatory frameworks, and we support the development of scientific knowledge and advice to base recommendations on.
The main external factors that can influence the achievement of targets are the policies of Member States and those of other RFMO members.
Result indicator 1: Conservation measures based on scientific advice adopted, for all species under the purview of RFMOs of which the EU is a member.
The stance of the EU in international organisations dealing with fisheries management, in particular RFMOs, is based on the best available scientific advice33 so as to ensure that fishery resources are managed in accordance with the objectives laid down in Article 2 of Regulation (EU) No 1380/2013.
Source of data: RFMO reports34.
Baseline 2012 Interim Milestone 2017 Target 2020
49 out of 53 conservation measures adopted by RFMOs in their annual meeting are in line with the best available scientific advice.
95% of the conservation measures
adopted by RFMOs in their annual
meetings are in line with the best
available scientific advice.
All conservation measures adopted by RFMOs in their annual meetings are in line with the best available scientific advice. Target set by Article 29 of
Regulation (EU) No 1380/2013,
RFMOs conventions and
recommendations or resolutions.
Planned evaluations: N/A
33 The 'best available scientific advice' is the term used by the UN Fish Stock Agreement 1995. It is generally the advice
provided by the Scientific Committee of the specific RFMO in line with international standards. 34 RFMOs which manage highly-migratory species, mainly tuna: http://iccat.int/en/, http://iotc.org/,
https://www.wcpfc.int/, http://iattc.org/, http://www.ccsbt.org/site/ RFMOs which manage straddling fish stocks: http://neafc.org/, http://nafo.int/, http://www.nasco.int/, http://www.seafo.org/, SIOFA: http://www.fao.org/fishery/rfb/siofa/en, http://www.sprfmo.int/, http://www.ccamlr.org/, http://www.gfcm.org/gfcm/en
28
The rationale for concluding Sustainable Fisheries Partnership Agreements (SFPAs) between the EU and third countries is to have a legal and transparent framework for the fishing activities of the EU's fleet in third-country waters. This contributes to the sustainability of fish stocks worldwide and to good ocean governance. The agreements aim to allow EU vessels to exploit surplus resources in the third country’s exclusive economic zone (EEZ). The tuna agreements allow EU vessels to catch highly migratory fish stocks. The mixed agreements provide access to a wide range of fish stocks, especially ground fish species (mainly shrimps and cephalopods) and/or pelagic species. SFPAs improve fisheries governance in that they are subject to strict scientific assessments, close monitoring of the fleets and clear reporting obligations. Financial and technical support is given by the EU to the partner countries for them to improve their own fisheries governance capacity (control, fight IUU fishing, research, etc.). Transparency and accountability are driving principles in the negotiation and all the SFPAs concluded by the EU are made public and scrutinised by public institutions and civil society.
As with any multilateral action, the success of our action depends on the solid support of stakeholders and Member States and on the cooperation of other international partners. Possible risks relate to the incorrect implementation of an SFPA or its non-renewal. Indeed, unexpected changes in a country's political or administrative situation or in the economic and operational strategies of ship-owners can influence the implementation of the SFPAs and are beyond the Commission's control. Moreover if a third country, because of its strategy and policy priorities, decides not to renew an agreement, this affects the indicator related to number of SFPAs in force.
Result indicator 2: Number of SFPAs in force.
The number of SFPAs in force is directly linked to the capacity of the EU fleet to extend its fishing operations in non-EU waters in a highly regulated and transparent framework. The objective is to ensure as much as
possible continuity between fishing grounds in particular for the tuna fleet through the existence of a network of SFPAs in force based on CFP reform principles: sustainability, value for money, improved governance and consistency with other EU policies. Each year, on average 25% of the SFPA protocols will expire and in order to ensure continuity of fishing and maintain a network of SFPAs, new protocols must be negotiated and enter into force at the right moment.
Source of data: the new or renewed SFPAs and Protocols published in the Official Journal of the EU.
Baseline 2013 Interim Milestone 2017 Target 2020
10 14 15
Target set by DG MARE.
Planned evaluations:
Ex-post evaluation of the SFPA and the ex-ante evaluation and analysis of the impact of a new
SFPA protocol with the following third countries (policy area of SFPAs): Comoros (1st quarter 2016),
Mauritius (1st half 2016), Guinea Bissau (2nd half 2016), Morocco, Ivory Coast, Sao Tomé and
Principe (2017), Madagascar, Cape Verde (2018), Mauritania, Senegal, Seychelles, Cook Island
(2019), Greenland and Liberia (2020).
Ex-ante evaluation for possible new SFPAs with the following third countries: Ghana and Equatorial
Guinea (2016), possibly Gambia (2017).
29
Illegal, Unreported and Unregulated (IUU) fishing in world fisheries is a serious and mounting concern. There are no precise data on the economic significance of IUU fishing activities, but it is estimated that IUU fishing represents around 11 to 26 million tonnes of fish each year, with a value of around US$10 to 23 billion. The EU market is a valuable outlet for IUU operators since it is the largest importer of fishery products in the world (in 2014 20.6 billion euros). It also has many trading partners on all continents on both the import and export sides. For these reasons the implementation of the IUU Regulation35 is one of the key priorities of the EU in fisheries management. Internationally, to reduce IUU fishing activities and contribute to the conservation and sustainable use of fishing resources worldwide, our position is that world countries need to fulfil their international obligations as flag, coastal, port or market States, including their commitments following from the United Nations Convention on the Law of the Sea (UNCLOS) and the United Nations Fish Stocks Agreement. We uphold this process by cooperating with third countries and by using both dialogue mechanisms and formal processes so that they improve their management and control systems. This in turns makes the countries' use of fishing resources and marine habitats more sustainable, improving the economic perspectives of fishermen and coastal communities. Domestically the EU's ultimate objective is to stop imports of illegal products. Our catch certification system applies to all imports of maritime fishery products, processed or not, whether they are caught by third country vessels or by EU fishing vessels fishing abroad. Strict controls ensure the full traceability of all marine fishery products traded with the EU, thus preventing IUU products from entering the EU market. It also ensures a level playing field for law abiding fishermen.
As per the IUU Regulation, refusing an import is a prerogative of the importing Member State, so the control of fisheries imports is outside the Commission's remit. Nevertheless, as guardian of the treaties the Commission can check whether Member States implement the Regulation and may take enforcement actions to ensure harmonized import controls across the EU. Problems on the ground can stem from cooperation between national services (customs, fisheries, health services), between Member States or with flag State authorities that validate catch certificates. The behaviour of economic operators (fisherman, processing companies, traders, importers, exporters) both in the EU and in third countries can also affect the effectiveness of these controls.
35 Council Regulation (EC) No 1005/2008 of 29 September 2008 establishing a Community system to prevent, deter and
eliminate illegal, unreported and unregulated fishing, amending Regulations (EEC) No 2847/93, (EC) No 1936/2001 and (EC) No 601/2004 and repealing Regulations (EC) No 1093/94 and (EC) No 1447/1999.
30
Result indicator 3: Control of imports of fisheries products in the EU.
This indicator relates to the fight to prevent, deter and eliminate IUU fishing. One of the main objectives of the fight against IUU fishing is to ensure the legality of imported fishery products and landings by fishing vessels. The control of imports is the best way to reach that objective. The IUU Regulation establishes a system of import controls of fisheries products for IUU related issues based on EU criteria for verifications. DG MARE provides guidance and information on cases of risk and discusses with Member States on the harmonized implementation of import controls. Member States are tasked with the control of imports and refusals and report to DG MARE on the latter.
Source of data: Commission, DG MARE, reporting of refusals by Member States.
Baseline 2013 Interim Milestone 2017 Target 2020
Number of refusals of imports into the
EU36: 7437
74 No IUU consignment is accepted. Target set by Article 18 of the IUU
regulation38.
Number of non-cooperating countries39 in fighting IUU fishing as a percentage of the number of countries allowed to export to the EU: 12 %
6% Reduce the number of countries that are non-cooperating to zero. Target set by Chapter VI of the IUU
regulation.
Planned evaluations: N/A
The externalities affecting this indicator relate to the constraints linked to any international activity, and in this particular case, the domestic political situation of the concerned countries and their administrative capacities also influence their ability to reform. Achieving the target will also depend on the third countries' willingness to take the necessary steps in their action plan.
36 This number depends on the effectiveness of Member States' implementation as well as actual attempts to import
illegal products into the EU by operators. 37 Number of import refusals as reported to the Commission by Member States. 38 The IUU regulation prevents, deters and eliminates IUU fishing, and prohibits any import of IUU products. 39 Countries which fail to adhere to their responsibility as a flag, coastal, port or market State and refuse to cooperate in
the fight against IUU fishing.

31
D. Key performance indicators (KPIs)
We have selected five key performance indicators, of which four operational impact indicators and one management indicator. DG MARE will report on these indicators in the 2016 Annual Activity Report. The key performance indicators are the following:
1. Specific measurement related to fisheries conservation in the EU: Economic growth potential and environmental sustainability measured by the proportion (Atlantic) or number of stocks (Mediterranean and Black Sea) that are fished at MSY levels.
2. Specific measurement related to the Blue Economy:
Employment created and maintained with support from the European Maritime and Fisheries Fund (EMFF).
3. Specific measurement related to our external relations:
Improvement in global fisheries governance, measured by the sustainable management of emblematic tuna and tuna-like species as per relevant scientific advice.
4. Result indicator related to the Blue Economy:
EU investment relating to the blue economy expressed as percentage of total European Structural and Investment Funds (ESIF).
5. Management indicator:
Estimated residual error rate (cf. part 2 – B. Financial management).

32
PART 2. Organisational management
General objective: To help achieve the overall political objectives, the Commission will effectively and efficiently manage and safeguard assets and resources, and attract and develop the best talents
A. Human Resource Management
DG MARE deploys effectively its resources in support of the delivery of the Commission's priorities and core business, has a competent and engaged workforce, which is driven by an effective and gender-balanced management and which can deploy its full potential within supportive and healthy working conditions.
DG MARE applies a strategic HR policy that ensures organisational efficiency and effectiveness, as well as good people management, with the aim of delivering high quality output in line with business objectives. In the period 2016-2020, HR policy and actions in DG MARE will focus on the following areas:
Middle management
Female representation in middle management in DG MARE has been well above the Commission average for a number of years. DG MARE is committed to ensuring that the gender balance objectives are fully attained. DG MARE will maintain its current practice over the 2016-2020 period in order to increase the percentage and achieve the 2019 target of 50% set for DG MARE by the Commission in July 2015.
Wellbeing of staff
In the 2014 Commission Staff Survey, 38,65% of DG MARE staff replied that the Commission cares about their wellbeing. This is above the Commission average, but there is clearly room for improvement. The HR team of DG MARE analysed the results and engaged with staff and management to better understand the approaches and concerns and to find ways to improve working conditions. This resulted in an Action Plan for Staff Engagement, which includes inter alia specific actions related to wellbeing. The implementation of this Action Plan started in 2015 and will continue in 2016. Over the 2016-2020 period, DG MARE will carry out a substantial number of actions aimed at enhancing the wellbeing of staff. These initiatives will be aligned with the corporate fit@work programme. To ensure optimal use of limited resources, DG MARE will cooperate with other DGs and with the central services to promote wellbeing and fit@work actions across the Commission. To the extent possible, the physical environment at DG MARE premises will be improved. DG MARE will also continue to promote flexible working methods (including flexitime and part-time arrangements) as a key tool for adapting to changing workloads and demands.

33
Staff engagement
In the 2014 Commission Staff Survey DG MARE achieved a very high Staff Engagement Index: 73, in comparison with the Commission average of 54. As explained under the previous point, an Action Plan for Staff Engagement was elaborated. The Action Plan includes 10 points for staff engagement to be implemented over the next years, including the creation of a Staff Engagement, Diversity and Inclusion Working Group, chaired by the Director-General. DG MARE will be following closely the results of the Commission Staff Survey in the coming years and will take action aimed at enhancing staff engagement wherever necessary.
Efficiency of resource allocation and of internal processes
Having reached the fourth year of staff reductions, there is a need to carry out a thorough workload assessment to make sure that resources are allocated according to political priorities and to consider possible ways of ensuring a more efficient organisational development. The corporate Synergies and Efficiencies Review carried out in 2015 also provided a relevant overview and useful insights into different aspects of the organisational structure and the internal resource management in the DG. It will serve as a good basis for reflection when carrying out the review. The assessment of the workload in DG MARE will be launched in early 2016 and is expected to enhance organisational efficiency and contribute to the delivery of key political objectives.
Talent management
In the period 2016-2020, the main focus in the field of talent management will be on enhancing managerial competencies and on securing the existence and availability of specialist staff. On managerial competencies, DG MARE will continue to invest in 360° evaluations for middle managers as well as in coaching for Heads of Unit and for Deputy Heads of Units. Improving middle managers' people management skills will help DG MARE to attract and retain talented staff, develop potential, and to boost staff engagement and satisfaction, which will contribute to increased productivity and operational outputs.
On specialised profiles, DG MARE is building on the successful organisation of temporary agent selections in specialised fields in recent years. For early 2016, a list of successful candidates from the temporary agent selection for fisheries science and marine/maritime sciences will be available and will ensure that DG MARE's needs for highly specialised expertise in those specific areas are met in the coming years. In 2017, it will be necessary to renew the temporary agent selection in the field of fisheries inspection and audit which was organised in 2012.
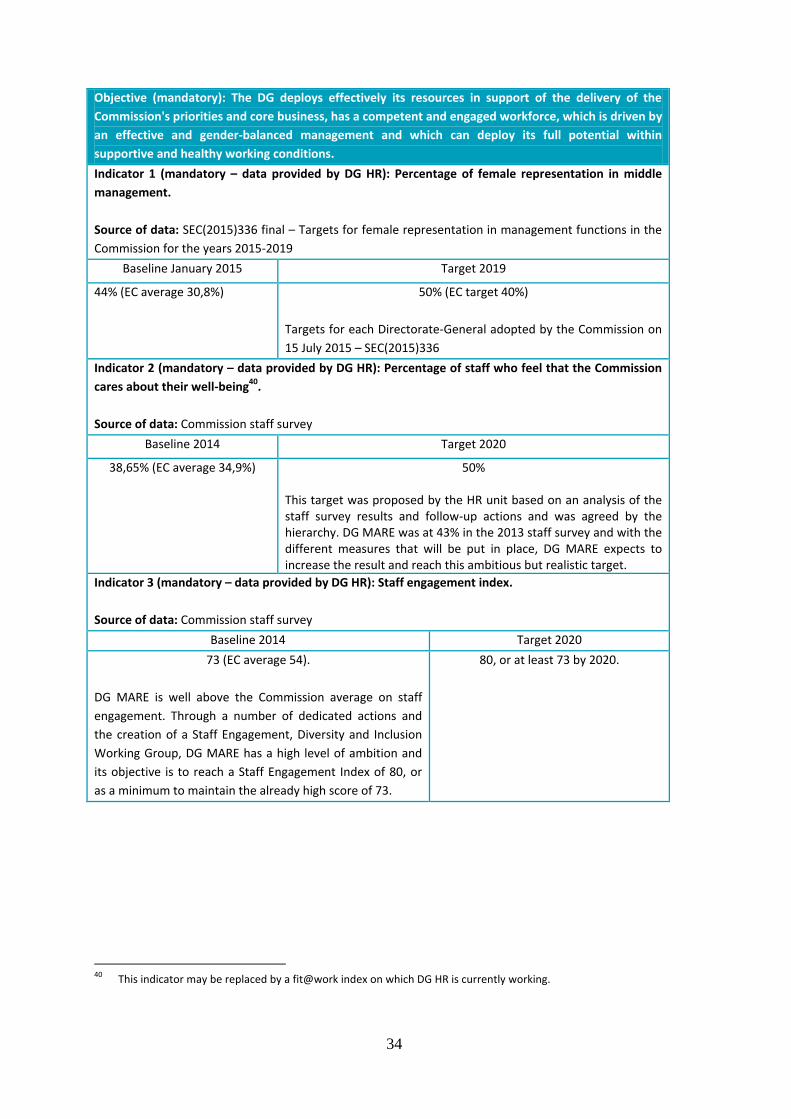
34
Objective (mandatory): The DG deploys effectively its resources in support of the delivery of the
Commission's priorities and core business, has a competent and engaged workforce, which is driven by
an effective and gender-balanced management and which can deploy its full potential within
supportive and healthy working conditions.
Indicator 1 (mandatory – data provided by DG HR): Percentage of female representation in middle
management.
Source of data: SEC(2015)336 final – Targets for female representation in management functions in the
Commission for the years 2015-2019
Baseline January 2015 Target 2019
44% (EC average 30,8%) 50% (EC target 40%)
Targets for each Directorate-General adopted by the Commission on
15 July 2015 – SEC(2015)336
Indicator 2 (mandatory – data provided by DG HR): Percentage of staff who feel that the Commission
cares about their well-being40.
Source of data: Commission staff survey
Baseline 2014 Target 2020
38,65% (EC average 34,9%) 50%
This target was proposed by the HR unit based on an analysis of the staff survey results and follow-up actions and was agreed by the hierarchy. DG MARE was at 43% in the 2013 staff survey and with the different measures that will be put in place, DG MARE expects to increase the result and reach this ambitious but realistic target.
Indicator 3 (mandatory – data provided by DG HR): Staff engagement index.
Source of data: Commission staff survey
Baseline 2014 Target 2020
73 (EC average 54).
DG MARE is well above the Commission average on staff
engagement. Through a number of dedicated actions and
the creation of a Staff Engagement, Diversity and Inclusion
Working Group, DG MARE has a high level of ambition and
its objective is to reach a Staff Engagement Index of 80, or
as a minimum to maintain the already high score of 73.
80, or at least 73 by 2020.
40 This indicator may be replaced by a fit@work index on which DG HR is currently working.
35
B. Financial Management: Internal control and Risk management
Overarching objective: The Authorising Officer by Delegation should have reasonable assurance that resources have been used in accordance with the principles of sound financial management, and that the control procedures put in place give the necessary guarantees concerning the legality and regularity of the underlying transactions including prevention, detection, correction and follow-up of fraud and irregularities.
EFF programming period (2007-2013)
The residual error rate, represented by the cumulative residual risk (CRR), has been estimated for all European Fisheries Fund (EFF) operational programmes since the beginning of the programming period, based on the best available sources of information.
The estimated CRR is an additional check applied to confirm whether each programme is managed correctly on a cumulative basis, i.e. whether the corrective measures (withdrawals, recoveries) already implemented by Member States have adequately mitigated the risks of irregularities since the beginning of the programming period.
In achieving the target for the estimated residual error rate, DG MARE is heavily dependent on the Member States' implementation and operation of effective control systems. A low CRR requires Member States to act promptly to correct ineligible expenditure.
DG MARE manages the risk by interrupting payments to Member States whose programmes show material levels of error, thereby protecting the EU budget. The recent low CRR illustrates that the corrective capacity of the controls operated by DG MARE is effective in shielding the Budget from material levels of irregular expenditure.
The CRR calculation will be made for the last time in 2016 (taking into account the audit results from the 2015 Annual Control Report).
EMFF programming period (2014-2020)
With no CRR mechanism in operation, the objective of ensuring that the expenditure declared is free of material error will be achieved, i.a. by:
Retention of 10% from each interim payment during the year and until programme accounts are accepted;
Submission by the programme authorities by 15 February each year of the assurance package", which includes: 1) the certified accounts from the certifying authority; 2) the management declaration and annual summary from the managing authority; 3) the annual control report and audit opinion from the audit authority;
Implementation of net financial corrections and early communication to the Member States on the benefits of a strong control system that detects serious deficiencies before the Commission or the European Court of Auditors detect them;
The information, results and evidence stemming from "effective and proportionate anti-fraud measures" implemented for each programme and based on assessments of fraud and corruption risks.
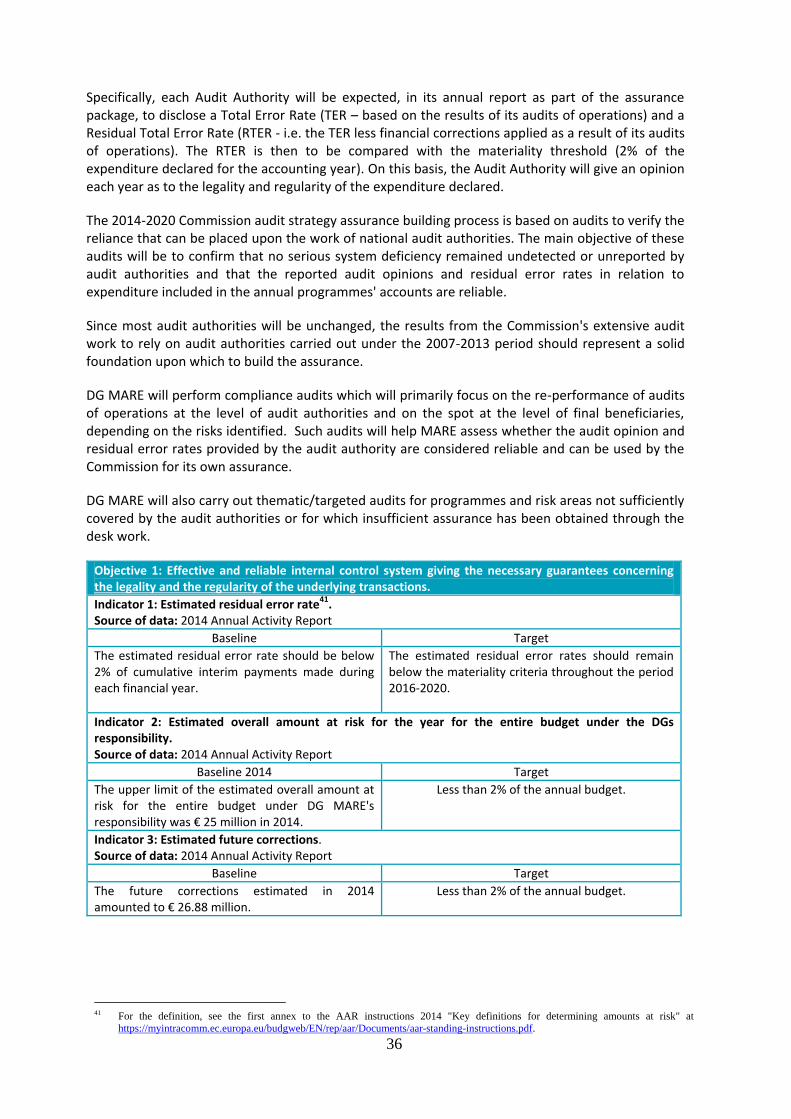
36
Specifically, each Audit Authority will be expected, in its annual report as part of the assurance package, to disclose a Total Error Rate (TER – based on the results of its audits of operations) and a Residual Total Error Rate (RTER - i.e. the TER less financial corrections applied as a result of its audits of operations). The RTER is then to be compared with the materiality threshold (2% of the expenditure declared for the accounting year). On this basis, the Audit Authority will give an opinion each year as to the legality and regularity of the expenditure declared.
The 2014-2020 Commission audit strategy assurance building process is based on audits to verify the reliance that can be placed upon the work of national audit authorities. The main objective of these audits will be to confirm that no serious system deficiency remained undetected or unreported by audit authorities and that the reported audit opinions and residual error rates in relation to expenditure included in the annual programmes' accounts are reliable.
Since most audit authorities will be unchanged, the results from the Commission's extensive audit work to rely on audit authorities carried out under the 2007-2013 period should represent a solid foundation upon which to build the assurance.
DG MARE will perform compliance audits which will primarily focus on the re-performance of audits of operations at the level of audit authorities and on the spot at the level of final beneficiaries, depending on the risks identified. Such audits will help MARE assess whether the audit opinion and residual error rates provided by the audit authority are considered reliable and can be used by the Commission for its own assurance.
DG MARE will also carry out thematic/targeted audits for programmes and risk areas not sufficiently covered by the audit authorities or for which insufficient assurance has been obtained through the desk work.
Objective 1: Effective and reliable internal control system giving the necessary guarantees concerning the legality and the regularity of the underlying transactions.
Indicator 1: Estimated residual error rate41. Source of data: 2014 Annual Activity Report
Baseline Target
The estimated residual error rate should be below 2% of cumulative interim payments made during each financial year.
The estimated residual error rates should remain below the materiality criteria throughout the period 2016-2020.
Indicator 2: Estimated overall amount at risk for the year for the entire budget under the DGs responsibility. Source of data: 2014 Annual Activity Report
Baseline 2014 Target
The upper limit of the estimated overall amount at risk for the entire budget under DG MARE's responsibility was € 25 million in 2014.
Less than 2% of the annual budget.
Indicator 3: Estimated future corrections. Source of data: 2014 Annual Activity Report
Baseline Target
The future corrections estimated in 2014 amounted to € 26.88 million.
Less than 2% of the annual budget.
41 For the definition, see the first annex to the AAR instructions 2014 "Key definitions for determining amounts at risk" at
https://myintracomm.ec.europa.eu/budgweb/EN/rep/aar/Documents/aar-standing-instructions.pdf.

37
Objective 2: Effective and reliable internal control system in line with sound financial management.
Indicator 1: Conclusion reached on cost effectiveness of controls.
Source of data: 2014 Annual Activity Report
Baseline 2014 Target
Controls are cost effective for shared management
and direct management (markets, control and data
collection).
Controls are cost effective.
Indicator 2: Comparison of costs and benefits (shared management).
Baseline 2014 Target
Cost-benefit ratio of 1:5 Cost-benefit ratio 1
Indicator 3: Cost of controls over expenditure compared with a reference (direct management).
Baseline 2014 Target
Overall cost of controls as percentage of payments
made = 5%
Overall cost of controls as percentage of payments
made 5%
DG MARE (in cooperation with DGs REGIO and EMPL) will undertake a qualitative analysis of Member States' fraud risk assessments covering the 2014-2020 programming period, specifically verifying to what extent:
the managing authorities' fraud risk assessments are reliable, complete and effective;
sufficient mitigating measures have been taken by the managing authorities to address the
identified residual risks.
The output will be a global fraud risk assessment which will be the basis for the revision of the Joint Anti-Fraud Strategy (JAFS) towards the end of 2016.
Concerning awareness, the DGs will provide training to desk officers and auditors on anti-fraud issues. Presentations will be organised in the DGs (the contents will include, for example, the manual on relations with OLAF, the JAFS for 2015-2020 and results from collaboration with academics). There will be two internal training actions in the DG annually, and desk officers and auditors will be alerted to possible fraud cases.
Key developments in the implementation of the JAFS will be reported in the semester report to the Commissioner.

38
Objective 3: Minimisation of the risk of fraud through application of effective anti-fraud measures, integrated in all activities of the DG, based on the DG's anti-fraud strategy (AFS) aimed at the prevention, detection and reparation of fraud.
Indicator 1: Updated anti-fraud strategy of DG MARE, elaborated on the basis of the methodology provided by OLAF42. Source of data: DG MARE
Baseline Interim Milestone Target
Date of the last update: November 2015 AFS adopted for 2015-2020.
Review by end of 2016 Update by end of 2016
Indicator 2: Fraud awareness is increased for target population(s) as identified in the DG’s AFS. Source of data: DG MARE's AFS
Baseline Interim Milestone Target
Two training sessions organised per year (1 for auditors and 1 for geographical desks).
N/A 100% target population reached
Indicator 3: Regular monitoring of the implementation of the anti-fraud strategy and reporting on its result to management. Source of data: DG MARE's AFS
Baseline Interim Milestone Target
Bi-annual reporting to Commissioner.
N/A Bi-annual reporting.
C. Better Regulation
Objective (mandatory): Prepare new policy initiatives and manage the EU's acquis in line with better
regulation practices to ensure that EU policy objectives are achieved effectively and efficiently.
Indicator 1 (mandatory – monitored by the DGs concerned): Percentage of Impact assessments
submitted by DG MARE to the Regulatory Scrutiny Board (RSB) / Impact Assessment Board (IAB) that
received a favourable opinion on first submission.
The opinion of the RSB will take into account the better regulation practices followed for new policy
initiatives. Gradual improvement of the percentage of positive opinions on first submission is an indicator
of progress made by the DG in applying better regulation practices.
Source of data: DG MARE
Baseline 2015 Interim Milestone 2016 Target 2020
0% (2/2)
Two impact assessment reports43 were submitted to and scrutinized by the RSB/IAB in 2015 from both received a positive opinion only after a resubmission. This rate was 50% in 2014 when one immediately received a positive opinion the other only after a resubmission. In comparison the Commission average in 2014 was 68%.
Positive trend compared to
DG's situation in 2015.
Positive trend compared to
DG's situation in 2016.
42 The methodology can be found on the FPDNet website: https://myintracomm.ec.europa.eu/serv/en/fraud-
prevention/ToolBox/Documents/Methodology%20and%20guidance%20for%20DGs%20anti-fraud%20strategies.pdf. In particular paragraph 3 of the methodology is relevant.
43 Impact Assessment report concerning the proposal for a Regulation of the European Parliament and the Council on technical measures for the protection of marine organisms on conservation of fishery; Impact Assessment report concerning the proposal for a Regulation of the European Parliament and the Council establishing a long-term plan for the North Sea demersal fisheries.
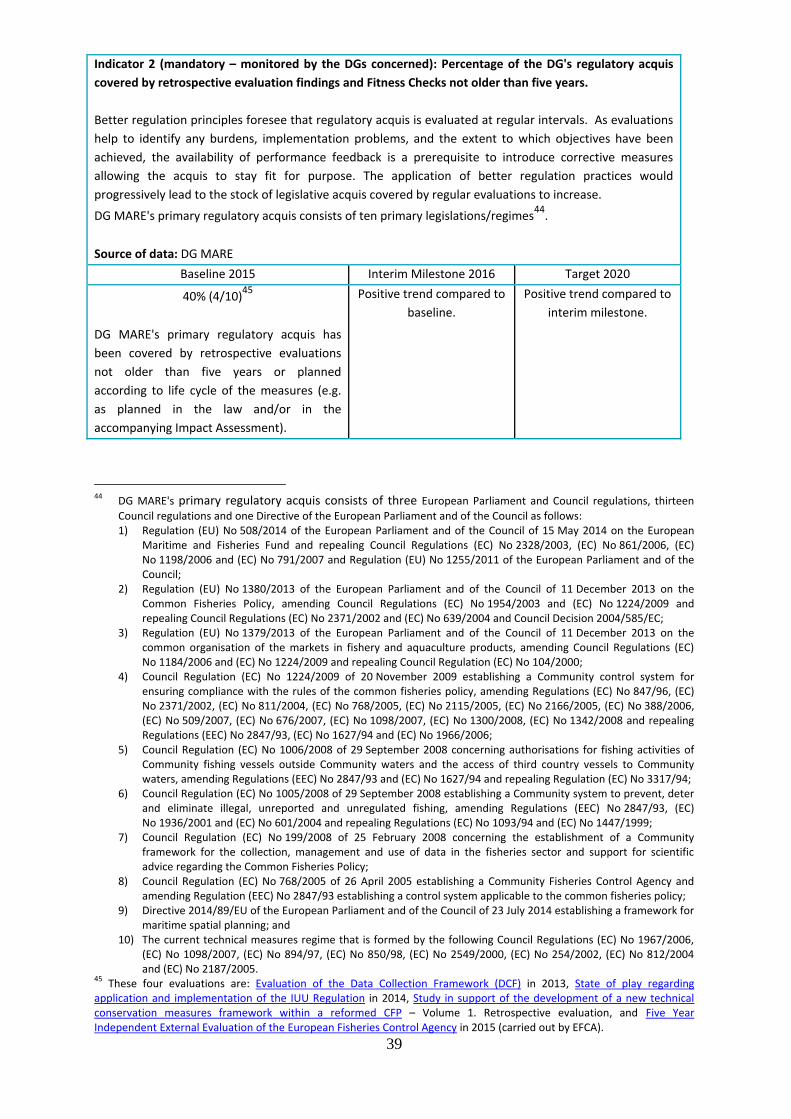
39
Indicator 2 (mandatory – monitored by the DGs concerned): Percentage of the DG's regulatory acquis
covered by retrospective evaluation findings and Fitness Checks not older than five years.
Better regulation principles foresee that regulatory acquis is evaluated at regular intervals. As evaluations
help to identify any burdens, implementation problems, and the extent to which objectives have been
achieved, the availability of performance feedback is a prerequisite to introduce corrective measures
allowing the acquis to stay fit for purpose. The application of better regulation practices would
progressively lead to the stock of legislative acquis covered by regular evaluations to increase.
DG MARE's primary regulatory acquis consists of ten primary legislations/regimes44
.
Source of data: DG MARE
Baseline 2015 Interim Milestone 2016 Target 2020
40% (4/10)45
DG MARE's primary regulatory acquis has
been covered by retrospective evaluations
not older than five years or planned
according to life cycle of the measures (e.g.
as planned in the law and/or in the
accompanying Impact Assessment).
Positive trend compared to
baseline.
Positive trend compared to
interim milestone.
44 DG MARE's primary regulatory acquis consists of three European Parliament and Council regulations, thirteen
Council regulations and one Directive of the European Parliament and of the Council as follows: 1) Regulation (EU) No 508/2014 of the European Parliament and of the Council of 15 May 2014 on the European
Maritime and Fisheries Fund and repealing Council Regulations (EC) No 2328/2003, (EC) No 861/2006, (EC) No 1198/2006 and (EC) No 791/2007 and Regulation (EU) No 1255/2011 of the European Parliament and of the Council;
2) Regulation (EU) No 1380/2013 of the European Parliament and of the Council of 11 December 2013 on the Common Fisheries Policy, amending Council Regulations (EC) No 1954/2003 and (EC) No 1224/2009 and repealing Council Regulations (EC) No 2371/2002 and (EC) No 639/2004 and Council Decision 2004/585/EC;
3) Regulation (EU) No 1379/2013 of the European Parliament and of the Council of 11 December 2013 on the common organisation of the markets in fishery and aquaculture products, amending Council Regulations (EC) No 1184/2006 and (EC) No 1224/2009 and repealing Council Regulation (EC) No 104/2000;
4) Council Regulation (EC) No 1224/2009 of 20 November 2009 establishing a Community control system for ensuring compliance with the rules of the common fisheries policy, amending Regulations (EC) No 847/96, (EC) No 2371/2002, (EC) No 811/2004, (EC) No 768/2005, (EC) No 2115/2005, (EC) No 2166/2005, (EC) No 388/2006, (EC) No 509/2007, (EC) No 676/2007, (EC) No 1098/2007, (EC) No 1300/2008, (EC) No 1342/2008 and repealing Regulations (EEC) No 2847/93, (EC) No 1627/94 and (EC) No 1966/2006;
5) Council Regulation (EC) No 1006/2008 of 29 September 2008 concerning authorisations for fishing activities of Community fishing vessels outside Community waters and the access of third country vessels to Community waters, amending Regulations (EEC) No 2847/93 and (EC) No 1627/94 and repealing Regulation (EC) No 3317/94;
6) Council Regulation (EC) No 1005/2008 of 29 September 2008 establishing a Community system to prevent, deter and eliminate illegal, unreported and unregulated fishing, amending Regulations (EEC) No 2847/93, (EC) No 1936/2001 and (EC) No 601/2004 and repealing Regulations (EC) No 1093/94 and (EC) No 1447/1999;
7) Council Regulation (EC) No 199/2008 of 25 February 2008 concerning the establishment of a Community framework for the collection, management and use of data in the fisheries sector and support for scientific advice regarding the Common Fisheries Policy;
8) Council Regulation (EC) No 768/2005 of 26 April 2005 establishing a Community Fisheries Control Agency and amending Regulation (EEC) No 2847/93 establishing a control system applicable to the common fisheries policy;
9) Directive 2014/89/EU of the European Parliament and of the Council of 23 July 2014 establishing a framework for maritime spatial planning; and
10) The current technical measures regime that is formed by the following Council Regulations (EC) No 1967/2006, (EC) No 1098/2007, (EC) No 894/97, (EC) No 850/98, (EC) No 2549/2000, (EC) No 254/2002, (EC) No 812/2004 and (EC) No 2187/2005.
45 These four evaluations are: Evaluation of the Data Collection Framework (DCF) in 2013, State of play regarding application and implementation of the IUU Regulation in 2014, Study in support of the development of a new technical conservation measures framework within a reformed CFP – Volume 1. Retrospective evaluation, and Five Year Independent External Evaluation of the European Fisheries Control Agency in 2015 (carried out by EFCA).

40
D. Information management aspects
The activities of DG MARE rely heavily on IT systems to achieve the strategic objectives of both the Common Fisheries Policy (CFP) and the Integrated Maritime Policy (IMP). The IT sector assists DG MARE in achieving its strategic objectives by providing modern Information and Communication Technology services.
The identification of IT priorities and the monitoring of its implementation are governed by the DG MARE IT Steering Committee (ITSC). In a long-term perspective the DG MARE IT Strategy will be drafted in the first quarter of 2016 under the mandate of the DG MARE IT Steering Committee.
Objective (mandatory): Information and knowledge in your DG is shared and re-usable by other DGs.
Important documents are registered, filed and retrievable.
DG MARE files its registered documents. All statistics provided by now have been based on this indicator. DG MARE has consistently had an excellent track record on corporate Document Management objectives and indicators on filing the documents. The target under indicator 1 is almost achieved as the percentage of filed documents is nearly 100%. Our mid-term target for 2016 is to have a minimum of unfiled documents and keep this record for the coming years. DG MARE defined in the Internal Rules of Document Management the importance of filing obligation and regularly recalls the services of this requirement.
Indicator 1 (mandatory – data provided by DG DIGIT): Percentage of registered documents that are not
filed46 (ratio).
Source of data: Hermes-Ares-Nomcom (HAN)47 statistics
Baseline 2015 Milestone 2016 Target 2020
* 1,92% 1% 1%
* According to the statistics provided by SG/DIGIT for 2015: Total registered documents in 2015: 21,555
Not filed documents registered in 2015: 413
As far as the HAN files readable/accessible by all units in DG MARE are concerned, all files are by default visible for reading by all the users in DG MARE with access to ARES. However, in certain cases, services need to limit access to certain files. Some folders cannot be accessible to all staff as they include sensitive information. Out of 2,369 files, 385 files approximately are limited. These files treat HR and sensitive political issues. The target under indicator 2 is to maintain the percentage of accessible folders within the framework of transparency although there is a tendency of slightly increased demand of limited folders as DG MARE handles increasingly more sensitive information. One could also apply a marking on a document that may limit access.
46 Each registered document must be filed in at least one official file of the Chef de file, as required by the e-Domec
policy rules (and by ICS 11 requirements). The indicator is measured via reporting tools available in Ares. 47 Suite of tools designed to implement the e-Domec policy rules. HERMES / ARES / NOMCOM (HAN).
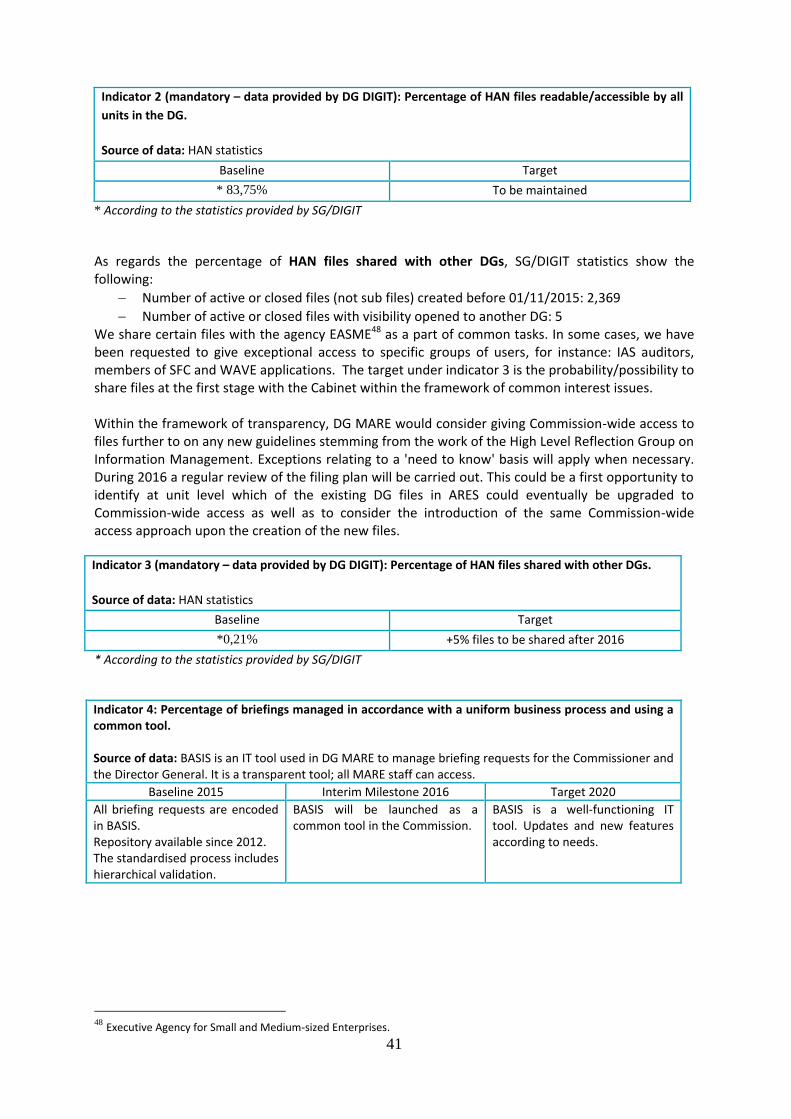
41
Indicator 2 (mandatory – data provided by DG DIGIT): Percentage of HAN files readable/accessible by all
units in the DG.
Source of data: HAN statistics
Baseline Target
* 83,75% To be maintained
* According to the statistics provided by SG/DIGIT
As regards the percentage of HAN files shared with other DGs, SG/DIGIT statistics show the following:
Number of active or closed files (not sub files) created before 01/11/2015: 2,369
Number of active or closed files with visibility opened to another DG: 5 We share certain files with the agency EASME48 as a part of common tasks. In some cases, we have been requested to give exceptional access to specific groups of users, for instance: IAS auditors, members of SFC and WAVE applications. The target under indicator 3 is the probability/possibility to share files at the first stage with the Cabinet within the framework of common interest issues. Within the framework of transparency, DG MARE would consider giving Commission-wide access to files further to on any new guidelines stemming from the work of the High Level Reflection Group on Information Management. Exceptions relating to a 'need to know' basis will apply when necessary. During 2016 a regular review of the filing plan will be carried out. This could be a first opportunity to identify at unit level which of the existing DG files in ARES could eventually be upgraded to Commission-wide access as well as to consider the introduction of the same Commission-wide access approach upon the creation of the new files.
Indicator 3 (mandatory – data provided by DG DIGIT): Percentage of HAN files shared with other DGs.
Source of data: HAN statistics
Baseline Target
*0,21% +5% files to be shared after 2016
* According to the statistics provided by SG/DIGIT
Indicator 4: Percentage of briefings managed in accordance with a uniform business process and using a common tool. Source of data: BASIS is an IT tool used in DG MARE to manage briefing requests for the Commissioner and the Director General. It is a transparent tool; all MARE staff can access.
Baseline 2015 Interim Milestone 2016 Target 2020
All briefing requests are encoded in BASIS. Repository available since 2012. The standardised process includes hierarchical validation.
BASIS will be launched as a common tool in the Commission.
BASIS is a well-functioning IT tool. Updates and new features according to needs.
48 Executive Agency for Small and Medium-sized Enterprises.

42
E. External communication activities
DG MARE develops monitors and adapts an external communication strategy to actively promote
the Common Fisheries Policy, the Integrated Maritime Policy and ocean governance, to make them
more visible and understandable to different audiences and highlighting their concrete benefits to
the EU citizens. To do this, DG MARE focuses on communicating on the potential of the blue
economy for investment in key areas such as ocean energy, biotechnology, aquaculture and
transport and how these translate into growth and jobs. In parallel, we communicate on how our
policies ensure the environmental sustainability of human activities in and around the sea with
special emphasis on the role of fisheries. DG MARE carries out information and implements various
internal information and communication activities for media, maritime and fisheries professionals
and the general public.
The overall purpose is to link our policies to the overall Commission's priorities and the EU 2020
Strategy, in particular smart growth and new jobs in the maritime economy and fishing industry.
Finally, DG MARE contributes to corporate communication both financially and by following the
work of the corporate communication projects.
Objective: Citizens perceive that the EU is working to improve their lives and engage with the EU. They
feel that their concerns are taken into consideration in European decision making and they know about
their rights in the EU.
Indicator: Percentage of EU citizens having a positive image of the EU.
DG MARE promotes the Common Fisheries Policy and the Integrated Maritime Policy through its internal
and external communication, including awareness-raising and dialogue with stakeholders.
Eurobarometer measures the state of public opinion in the EU Member States. This global indicator is
influenced by many factors, including the work of other EU institutions and national governments, as well
as political and economic factors, not just the communication actions of the Commission. It is relevant as a
proxy for the overall perception of the EU citizens. Positive visibility for the EU is the desirable corporate
outcome of Commission communication, even if individual DGs’ actions may only make a small
contribution.
Source of data: Standard Eurobarometer (DG COMM budget) [monitored by DG COMM here].
Baseline: November 2014 Target: 2020
Total "Positive" image of the EU: 39% Neutral: 37 % Total "Negative": 22%
Positive image of the EU ≥ 50%
Annex to the Strategic Plan: Intervention logic
Electronically signed on 18/03/2016 15:05 (UTC+01) in accordance with article 4.2 (Validity of electronic documents) of Commission Decision 2004/563