Strategic Overview - moh.govt.nz
37
Respiratory Disease in New Zealand 1 Executive Summary Respiratory disease places a major burden on the New Zealand health system. In 2011/12, it accounted for $265 million worth of public casemix hospital discharges. The National Health Committee (NHC) is the body tasked with improving health outcomes whilst maintaining or reducing costs through the prioritisation of the most cost effective new and existing health technologies. It does this by assessing ‘value for money’ in terms of health outcomes and cost to the health sector. By recommending investment in technologies (including models of care) that provide the greatest value for money, the NHC’s goal is to improve both health outcomes and health sector sustainability. The process by which the NHC chooses the technologies it assesses, consequently, becomes vitally important. This document is the first of its kind in that process. Because of the large burden respiratory disease places on health outcomes and the health budget, it is a potential source of significant health gains through the improvement of health services across the continuum of care. As respiratory disease is a broad area, the NHC has adopted a ‘tiered’ approach to establish what work should be undertaken within respiratory disease. This ‘Tier 1’ document presents a high-level overview of each respiratory condition in terms of prevalence and incidence, health outcomes and health utilisation and cost. The findings are then assessed against the relevant NHC decision-making criteria. The purpose of this document is to provide the Committee with context around a recommendation as to which disease area the Committee should conduct ‘Tier 2’ work. At Tier 2, the evidence for the interventions that comprise the pathway of care for a particular disease from prevention to secondary/tertiary care is presented and assessed against the relevant decision- making criteria for prioritisation into ‘Tier 3’ health technology assessments (HTAs). An HTA is a type of assessment methodology that presents the evidence for a particular intervention across a multi-disciplinary set of assessment domains. For the NHC, those domains are clinical safety and effectiveness; economic; societal and ethical; and feasibility of adoption. The final tier in the process is to develop an implementation and monitoring/evaluation plan for the recommendations. Based on the evidence in this report, it is recommended that Chronic Obstructive Pulmonary Disease (COPD) is assessed for the 2013/14 year as per the tiered approach. Strategic Overview Respiratory Disease in New Zealand December 2013
Transcript of Strategic Overview - moh.govt.nz

Respiratory Disease in New Zealand 1
Executive Summary
Respiratory disease places a major burden on the New Zealand health system. In 2011/12, it accounted for $265 million worth of public casemix hospital discharges. The National Health Committee (NHC) is the body tasked with improving health outcomes whilst maintaining or reducing costs through the prioritisation of the most cost effective new and existing health technologies. It does this by assessing ‘value for money’ in terms of health outcomes and cost to the health sector. By recommending investment in technologies (including models of care) that provide the greatest value for money, the NHC’s goal is to improve both health outcomes and health sector sustainability. The process by which the NHC chooses the technologies it assesses, consequently, becomes vitally important. This document is the first of its kind in that process.
Because of the large burden respiratory disease places on health outcomes and the health budget, it is a potential source of significant health gains through the improvement of health services across the continuum of care. As respiratory disease is a broad area, the NHC has adopted a ‘tiered’ approach to establish what work should be undertaken within respiratory disease.
This ‘Tier 1’ document presents a high-level overview of each respiratory condition in terms of prevalence and incidence, health outcomes and health utilisation and cost. The findings are then assessed against the relevant NHC decision-making criteria. The purpose of this document is to provide the Committee with context around a recommendation as to which disease area the Committee should conduct ‘Tier 2’ work.
At Tier 2, the evidence for the interventions that comprise the pathway of care for a particular disease from prevention to secondary/tertiary care is presented and assessed against the relevant decision-making criteria for prioritisation into ‘Tier 3’ health technology assessments (HTAs).
An HTA is a type of assessment methodology that presents the evidence for a particular intervention across a multi-disciplinary set of assessment domains. For the NHC, those domains are clinical safety and effectiveness; economic; societal and ethical; and feasibility of adoption.
The final tier in the process is to develop an implementation and monitoring/evaluation plan for the recommendations. Based on the evidence in this report, it is recommended that Chronic Obstructive Pulmonary Disease (COPD) is assessed for the 2013/14 year as per the tiered approach.
Strategic Overview
Respiratory Disease in New Zealand
December 2013

Respiratory Disease in New Zealand 2
Table of Contents
Introduction ................................................................................................................................ 3
Purpose ..................................................................................................................................... 4
Methods ..................................................................................................................................... 4
Asthma ...................................................................................................................................... 6
Chronic Obstructive Pulmonary Disease (COPD) ...................................................................... 7
Lung Cancer ............................................................................................................................ 11
Obstructive Sleep Apnoea (OSA) ............................................................................................. 12
Lower Respiratory Tract Infections (LRTI) and Influenza.......................................................... 13
Cystic Fibrosis (CF) ................................................................................................................. 15
Bronchiectasis ......................................................................................................................... 16
Interstitial Lung Disease (ILD) and Sarcoidosis ........................................................................ 17
Tuberculosis (TB) ..................................................................................................................... 18
Pulmonary Arterial Disease/Hypertension (PAD/H) .................................................................. 19
Other Respiratory Diseases ..................................................................................................... 20
Public Health ............................................................................................................................ 21
New and Growing .................................................................................................................... 21
Discussion and Limitations ....................................................................................................... 22
Recommendation ..................................................................................................................... 29
References .............................................................................................................................. 33
Disclaimer ................................................................................................................................ 37

Respiratory Disease in New Zealand 3
Introduction
Respiratory disease is a general term for a complex set of conditions that affect the lungs and
respiratory tract. Globally, it is responsible for a large proportion of both negative health outcomes
and economic burden. In New Zealand, the case is no different.
Figure 1 shows the economic burden relative to other disease areas based on original programme
budget analysis from 2010/11. The figure uses the national minimum dataset (NMDS) of public
casemix hospitalisations (inpatient and day patient) to illustrate the relative spends on different
diseases and the numbers of people affected. After further analysis on data from 2011/12 using a
modified disease classification system, it is now believed that respiratory disease hospitalisations
account for $265 million or about 10% of all public casemix hospitalisation costs (Appendix 1). A
further breakdown of these costs is available in Appendix 2.
Figure 1: Programme Budget (public casemix hospitalisations) by ICD Code
Note: Size of the bubble represents total price whilst the colour represents mean price growth Source: 2012 NHC Executive Analysis of 2010–2013 NMDS
Because of the large burden that respiratory disease places on the health system, the National
Health Committee (NHC) has flagged it as a priority disease area for the 2013/14 financial year.
Using the tiered approach, the NHC will further explore respiratory disease as per the process
outlined in the Executive Summary. This report is the first document in a series of documents that
Infectious (Price= $60M Growth= 2.7%)
Neoplams (Price= $283M Growth= 4.7%)
Blood (Price= $23M Growth= 3.8% )
Endocrine (Price= $67M Growth= 6.7%)
Mental (Price= $5M Growth= -0.4%)
Nervous (Price= $47M Growth= 6.1%)
Eye ( Price= $41M Growth= 7.7% )
Ear (Price= $22M Growth= 1.2%)
Circulatory (Price= $401M Growth= 3.6%)
Respiratory (Price= $188M Growth= 4.9%)
Digestive (Price= $256M Growth= 5.8% )
Skin (Price= $51M Growth= 3.6%)
Musculoskeletal(Price= $208M Growth= 5.1%)
Genitourinary (Price= $126M Growth= 4.2%)
Pregnancy (Price= $192M Growth= 1.7%)
Perinatal (Price= $108M Growth= 1.9%)
Congenital (Price= $47M Growth= 6.2%)
Symptoms (Price= $106M Growth= 3.1%)
Injury (Price= $563M Growth= 0%)
Health Status (Price= $36M Growth= -14.2%)
0$0
$1
$2
$3
$4
$5
$6
$7
$8
$9
$10
0 10 20 30 40 50 60 70 80 90
Mea
n Pr
ice
($1,
000
per i
ndiv
idua
l per
yea
r)
Individuals (n, thousands)
<0% 0%<2% 2%<4% 4%<6% 6%+

Respiratory Disease in New Zealand 4
provides a broad overview of respiratory disease with the intention of highlighting priority areas within
respiratory disease through the perspectives of prevalence and incidence, health outcomes and
health utilisation/costs. The document is divided into individual disease sections:
• Asthma
• Chronic Obstructive Pulmonary Disease (COPD)
• Lung Cancer
• Obstructive Sleep Apnoea (OSA)
• Lower Respiratory Tract Infections (LRTI) and Influenza
• Cystic Fibrosis (CF)
• Bronchiectasis
• Interstitial Lung Disease (ILD) and Sarcoidosis
• Tuberculosis (TB)
• Pulmonary Arterial Disease/Hypertension (PAD/H)
• Other Respiratory Diseases
A discussion section follows that compares the diseases and outlines the limitations. Finally, a
recommendation is made as to which disease area(s) the NHC should investigate further for the
2013/14 financial year and subsequent years based on the relevant decision-making criteria.
Purpose
This document is intended to provide the Committee with a broad overview of respiratory disease to
prioritise further work in this area in order to improve health outcomes and efficiency.
Methods
This section details the methodology used to group the diseases, synthesise information and
prioritise the diseases for further work. Two main sources of information were used-- the National
Minimum Dataset (NMDS) for hospital events (used to estimate the financial burden) and existing
published studies for information on prevalence/incidence and outcomes.
The diseases in this document are based on the New Zealand Burden of Disease standard
classification, used in the New Zealand Burden of Diseases, Injuries and Risk factors Study, 2006 –
2016 (NZBDS) to represent respiratory disease. All mortality and disability-adjusted life year (DALY)
figures used in this report are 2006 based, the most recent available with the NZBDS. DALYs
combine years of life lost (YLLs) and years lived with disability (YLDs) such that one DALY is
equivalent to loss of one year of healthy life. As such, they are more than just a metric for death;
they include both fatal and non-fatal outcomes. For the purposes of this report lung cancer, lower
respiratory tract infections/influenza, tuberculosis and pulmonary artery disease have been included

Respiratory Disease in New Zealand 5
with respiratory conditions as these are all conditions that primarily affect the lungs and/or respiratory
tract.
Literature Searches
Between April 2013 and June 2013, various non-systematic searches were conducted using Google
Scholar and the New Zealand Ministry of Health website. Where possible, New Zealand population-
based surveys were used for prevalence and incidence information. Where New Zealand
population-based surveys were unavailable, New Zealand-based epidemiological studies were
searched and international epidemiological studies were used where New Zealand ones did not
suffice. Because of this search strategy some disease sections contain more information than
others, a reflection of the amount of evidence easily available for various diseases.
Hospital Events
The filtered (to exclude non-publically funded and/or non-casemix purchased events) 2011/12
NMDS was used for the hospitalisation event (inpatient and day patient) data. Each hospital
discharge has one or more diagnosis codes associated with it. These codes are based on the
Australian Modification of the World Health Organization’s International Classification of Diseases
(ICD-10-AM). The diagnosis code used was either the primary diagnosis, the secondary diagnosis if
the primary diagnosis was a ‘Z’ code (Factors influencing health status and contact with health
services), or the primary external cause code if the event was recorded as being an accident. These
codes were mapped to the condition codes used in the NZBDS. For the purposes of the hospital
event data the redistribution process used in the NZBDS was not used as this is specific to
calculating years of life lost.
Price has been used as a proxy for cost as it is more readily available and is highly correlated with
the cost of the services being summarised. Each (filtered) hospitalisation event has a resource-
based volume measure of the relative resources used in the delivery of inpatient heath care based
on the diagnosis code (derived using Weighted Inline Equivalent Separation methodology). For this
analysis the WIESNZ10 caseweight has been multiplied by the purchase unit price for 2011/12
($4,567.49).
The National Health Index is a unique alpha-numeric identifier assigned to each person accessing
New Zealand’s health services. The National Health Index dataset (Quarter 4, 2012) was used to
differentiate how many individuals were hospitalised. The mean patient price was calculated as the
total price per condition group divided by the number of individuals hospitalised for that condition in
the 2011/12 year. Time in care, a proxy for lost time or disability, is the sum of the length of stay for
each discharge. Mean percentage budget growth is based on three years of NMDS caseweight price
data, 2009/10, 2010/11, and 2011/12; price consistency has been controlled using the one purchase
unit price for all years.

Respiratory Disease in New Zealand 6
Asthma
Disease Description
Asthma is a chronic disease of the airways characterised by inflammation and bronchial hyper-
responsiveness resulting in intermittent episodes of reversible airway obstruction(1). There are
numerous factors thought to be responsible for the development of asthma, but its exact aetiology
remains unclear(2). During an exacerbation, patients present with wheezing, shortness of breath and
may require hospitalisation(1). Treatment may include inhaled corticosteroids and bronchodilators.
The key distinction between asthma and other chronic airway diseases is that the airflow obstruction
is reversible in the initial stages of the disorder, but as time goes on, and as a consequence of
remodelling some patients will develop COPD.
Prevalence and Incidence
One in nine New Zealand adults suffers from asthma (11.2% in 2006/07; 11.0% in 2011/12)(3, 4) .
One in seven children aged under 16 years suffers from asthma (14.2% in 2006/07; 14.0% in
2011/12). In 2006/07, this equated to 109,900 children and 348,400 adults, or nearly 460,000 New
Zealanders in total. Women are more likely to suffer from asthma than men, and Māori and New
Zealand Europeans are more likely to have asthma than Pacific peoples and Asian people. Asthma
is more common among women who live in an area of higher deprivation than the rest of the
population. Asthma rates also did not differ significantly by District Health Board (DHB).
Health Outcomes
Asthma was responsible for approximately 68 deaths in 2006. Over half of all asthma deaths (57.4%)
occurred in individuals aged over 65 years. Although asthma mortality was small relative to other
respiratory diseases, its impact on quality of life was pronounced, especially in younger individuals.
Asthma resulted in the loss of 15,084 DALYs with approximately 27% occurring in individuals aged
less than 20 years.
Health Utilisation and Cost
Asthma hospitalisation rates are highest among 2-16 year olds. In 2011/12, there were 4,618
hospitalisations with asthma listed as the primary diagnosis, up from 4,430 and 3,524 in the two
previous financial years(5). Table 1 shows hospitalisation rates for Māori and non-Māori individuals
aged 5-34 years (Ministry of Health 2010); hospitalisation rates are almost twice as high for Māori.

Respiratory Disease in New Zealand 7
Table 1: Asthma Hospitalisation Rates per 100,000 Individuals Aged 5–34 Years by Gender and Ethnicity
Māori non-Māori
Males Females Total Males Females Total
216.3 (200.2–233.7)
269.6 (252.6–287.7)
245.1 (233.2–257.6)
122.2 (114.6–130.5)
129.7 (121.9–138.0)
126.4 (120.8–132.2)
Source: Tautau Kahukura: Māori Health Chart Book 2010, 2nd Edition, NMDS 2006-2008
According to a New Zealand study, the economic costs of asthma were estimated to be around $825
million per year in the late1990s(6). This comprised about $125 million in direct medical costs and
about $700 million in indirect non-medical costs, including days off work, premature disability, and
death from asthma. The small proportion of asthmatics with chronic severe and/or poorly controlled
disease is responsible for a disproportionately large portion of the cost. Additionally, asthma
accounted for between 2%-3% of all avoidable respiratory deaths and 7.4% of all avoidable
hospitalisations(7, 8).
Of the estimated 524,176 asthma sufferers, 6,600 individuals contributed to 8,400 hospitalisations
for a hospitalisation rate of 1.3% with an average hospitalisation cost of $2,500. Their average length
of stay was 1.3 days. In total, asthma hospitalisations contributed to $17 million worth of costs (6.4%
of all respiratory casemix hospitalisation costs).
Chronic Obstructive Pulmonary Disease (COPD)
Disease Description
COPD is a chronic disease characterised by airway obstruction that is not fully reversible. The airflow
limitation is usually progressive and associated with an abnormal inflammatory response of the lung
to noxious particles or gases(9). Small-airway narrowing (with or without chronic bronchitis) and
emphysema caused by smoking are the most common conditions resulting in COPD.
COPD is characterised by the gradual development of symptoms (over many years), and an
estimated 70%-80% of cases are caused by tobacco smoke(10). Environmental smoke inhalation and
genetic abnormalities are rarer causes. Patients with COPD typically present with shortness of
breath, but symptoms are less easily controlled in contrast to asthma and patients often recover
more slowly due to poor underlying lung function. Increasing disease severity leads to multi-organ
complications and eventually death(1).
Treatment is multi-disciplinary with a variety of interventions that may include pulmonary
rehabilitation, long-term oxygen therapy and medications. Exacerbations are typically managed in
the primary care setting using medical management, but hospitalisations also occur. There is a
limited role for surgical management(1).
Respiratory Disease in New Zealand 8
Prevalence and Incidence
COPD is a major respiratory disease in New Zealand in terms of prevalence. In the 2006/2007 New
Zealand Health Survey, the prevalence rate of 6.6% of adults equated to 96,100 adults or 1 in every
15 individuals over 45 years. These prevalence figures are likely to underestimate the true rate of
disease since many COPD patients are undiagnosed as signs and symptoms of the disease only
appear later in the disease course and GPs do not always use spirometry (only 50% are believed to
own a spirometer1) to screen for the condition even in smokers with a large smoking history. One
published study from New Zealand found the GOLD (Global initiative for Chronic Obstructive Lung
Disease)-defined, age-adjusted prevalence (95% confidence interval) for adults aged over 40 years
was 14.2 (11.0–17.0)% compared with an LLN (Lower Limit of Normal)-defined, age-adjusted, post-
bronchodilator prevalence in the same group of 9.0 (6.7–11.3)%(11). In a recent evaluation of lung
cancer in the Auckland region 47% of lung cancer patients were found to have COPD(12).
COPD is very uncommon in individuals aged under 45 years. However, damage to the small airways
can affect younger patients and probably affects another 5-10% of the population, many of whom
acquire the condition in the first few years of life and as a consequence of passive smoking and
infections in the first few years of life. Whilst not affecting lung function substantially, the condition
often resurfaces in later life and can be the cause of recurrent or persistent bronchitis in patients
over 45 years. These patients are often wrongly diagnosed and managed as having late onset
asthma.
COPD disproportionately affects Māori and women, with Māori having a prevalence that is twice that
of people of other ethnic groups. Women from areas with high deprivation were also more likely
than women from more affluent areas to have COPD.
Health Outcomes
COPD accounted for 1,523 deaths in 2006. COPD deaths tend to occur in individuals aged over 65
years. COPD was responsible for 35,339 DALYs in 2006. Of all of the respiratory diseases, COPD
was the biggest cause of both deaths and DALYs. Nearly 75% of those DALYs were lost in
individuals aged over 60 years.
1 Source: Personal Communication, 2013

Respiratory Disease in New Zealand 9
Health Utilisation and Cost
COPD hospitalisation rates were highest in individuals aged over 50 years. In the 2006-2009 years,
ethnic-standardised hospitalisation rates were as follows in Tables 2 and 3 (Ministry of Health 2011):
Table 2: COPD Hospitalisation Rates per 100,000 for Adults Aged over 45 Years by Gender and Ethnicity
Māori non-Māori
Males Females Total Males Females Total
1800.7 (1683.6–1925.9)
2217.6 (2095.9–2346.4)
2021.7 (1936.3–2110.9)
549.8 (532.1–568.1)
439.3 (422.6–456.7)
484.1 (471.9–496.5)
Source: Tatau Kura Tangata: Health of Older Māori Chart Book, NMDS 2006-2008
Table 3: COPD Hospitalisation Rates per 100,000 Adults Aged over 50 Years by Age, Gender and Ethnicity
Males Females
50–64 years 65+ years 50–64 years 65+ years Māori non-Māori Māori non-Māori Māori non-Māori Māori non-Māori
991.8 (916.7–1073.0)
201.6 (190.0–213.8)
3333.9 (3074.4–3615.4)
1010.1 (969.4–1052.5)
1560.6 (1466.6–1660.7)
232.3 (218.5–246.9)
3823.0 (3542.6–4125.6)
803.2 (764.2–844.2)
Source: Tatau Kura Tangata: Health of Older Māori Chart Book, NMDS 2006-2008
As evident in the data, hospitalisations are more common in both women and Māori (with the
exception of non-Māori women aged over 65 years), a reflection of the prevalence burden. In terms
of ambulatory sensitive hospitalisations (avoidable), COPD ranks among the top 20 causes
accounting for about 10% of avoidable hospitalisations in Australia(8). COPD accounts for 95% of all
avoidable respiratory deaths(7); however, the disease classification in the cited report did not include
lung cancer which is a significant cause of avoidable mortality. Internationally, New Zealand has the
second highest rate of hospitalisations due to COPD in the OECD (Figure 2)(13), which may be due
to fewer barriers to emergency department access than GP access in New Zealand2.
2 Source: Personal Communication, 2013

Respiratory Disease in New Zealand 10
Figure 2: COPD Hospitalisation Rates in the OECD
Source: OECD Health Data 2011
The main costs to the health system in New Zealand attributable to COPD include medications,
hospital care and primary care visits. Additional costs accrue from laboratory services, emergency
department visits, smoking cessation programmes, other laboratory testing and the provision of
rehabilitation services.
Depending on the number of prevalent cases, the direct costs in New Zealand have been estimated
at $102 million to $192 million per annum(14). The average cost per patient per year is estimated at
$2,566 without considering loss of income, the costs to family or loss of quality of life.
In terms of hospitalisations, 7,716 individuals with COPD were hospitalised an average of 1.5 times
for a total of 11,619 discharges. This translates to a hospitalisation rate of about 0.08% of all COPD
patients with a 30 day readmission rate of 17.9%. Hospitalisations were relatively long at an average
of 4.2 days whilst the average cost per hospitalised patient was about $7,700. Overall, COPD
contributed to $54 million in hospitalisation costs (20.3% of total respiratory hospitalisation costs).
Respiratory Disease in New Zealand 11
Lung Cancer
Disease Description
The broad term lung cancer refers to a number of conditions characterised by the malignant
transformation of cells of lung origin(1). The nature of the particular type of cancer is derived from the
type of cell which has become cancerous. The two most common forms are non-small cell lung
cancer (NSCLC) and small cell lung cancer (SCLC) with rare variants including carcinoid tumours
and mesothelioma(1).
Tobacco smoking is the predominant cause of lung cancer, accounting for 80% to 90% of cases.
Other significant causes include asbestos, air pollution, radon gas exposure, previous radiotherapy
and genetic predisposition(1). Lung conditions such as COPD, bronchiectasis and interstitial lung
diseases increase the risk of lung cancer 2-3 fold. Diagnosis is aimed at determining the type of
cancer and the extent of spread (stage). Survival in advanced disease varies but is approximately
one year on average(15).
Localised disease is treated with curative intent; surgery is the first line therapy. Combined
chemotherapy and radiotherapy is used with curative intent for localised disease for patients who
are not surgical candidates. Up to half of these patients with localised disease later relapse(1).
Advanced disease is incurable and treatment is aimed at decreasing symptoms, improving quality
of life and extending survival. Radiotherapy and chemotherapy are the main treatments as is
palliative care toward end of life(1).
Prevalence and Incidence
Lung cancer has an incidence of about 30/100,000 individuals each year(16). Lung cancer is often
diagnosed in the late stages of the disease and affects older individuals (60+ years) more than
younger individuals. In 2009, males had a slightly higher incidence than females (55% versus 45%).
Māori represented about 18.3% of all cases.
Health Outcomes
In 2006, lung cancer was responsible for 1,481 deaths, 15.8% of which occurred in individuals aged
between 70-75 years. It is the biggest cause of death among cancers and was attributable to 2,857
lost DALYs, second only to COPD among respiratory diseases. New Zealand has poor survival
figures compared with other developed countries which is thought to be mainly due to delays in
diagnosis rather than access to therapy(12).
Health Utilisation and Cost
Hospitalisations are the main costs to the health system in New Zealand for lung cancer, with
General Practitioner (GP) visits the second largest(17). Medications, outpatient care and specialist
visits are also major cost items. The direct costs to the New Zealand health care system for lung

Respiratory Disease in New Zealand 12
cancer amounted to at least $18.0 million in the year 2002, but may be as much as $28.1 million(17).
Costs per patient per year are estimated at $7,500 on average.
Nearly 95% of yearly lung cancer patients (1,401 individuals) were hospitalised an average of 1.4
times for a total of 1,908 hospital discharges. Hospitalisations lasted for an average of 7 days and
the mean price per hospitalised individual was $9,300. Total hospitalisation costs were $13 million
(4.9% of total respiratory hospitalisation costs).
Obstructive Sleep Apnoea (OSA)
Disease Description
OSA is characterised by obstruction of the upper airway during sleep preventing normal breathing(1).
It is generally thought that the obstruction is the result of upper airway muscles failing to maintain
sufficient upper airway patency thereby limiting or obstructing normal airflow.
Obesity is a main cause. Other causes include abnormal upper airway anatomy or other obstructions
of the upper airways. Patients with OSA hypopnoea syndrome (OSAHS) experience snoring,
apnoeas (periods of breathing cessation) and significant sleep disturbance caused by repeated
arousals related to the obstructive events that are associated with desaturation (fall in oxygen
levels)(1). This results in daytime sleepiness, which may result in motor vehicle accidents and poor
work performance in addition to adversely impacting quality of life. Other physical complications of
OSA include high blood pressure, mood change, sexual dysfunction and heart failure. Continuous
positive airway pressure (CPAP) devices are used to treat OSA by maintaining a patent airway
during sleep.
For children, snoring is the most common presentation along with diaphoresis, restlessness and
frequent awakening(18). Compared to adults children report less daytime drowsiness; many of the
signs and symptoms are behavioural(19). One study found that many children treated for
hyperactivity/inattentiveness also had underlying sleep-disordered breathing(20). Because of its
similarities with behavioural problems, sleep-disordered breathing disorders are thought to be
underdiagnosed in children(21). Treatment for children is with CPAP, adenotonsillectomy and allergy
management(18).
Prevalence and Incidence
OSA is the most common sleep-related breathing disorder. According to a New Zealand-based
population survey, OSA is likely to affect about 4.4% and 4.1% of Māori and non-Māori men,
respectively. For Māori and non-Māori women, the rates are 2.0% and 0.7%, respectively(22). In
children, the prevalence of sleep-disordered breathing has been estimated at 1%-10%(18, 23-25).

Respiratory Disease in New Zealand 13
Health Outcomes
Eleven deaths were attributable to OSA in 2006 resulting in a loss of 3,055 DALYs. Individuals aged
40-65 years carried about 50% of the DALY burden.
Health Utilisation and Cost
Total annual societal costs of OSA for New Zealanders aged 30–60 years were estimated at $40
million (range $33–$90 million) or $419 per case, with accidents being the major contributor. This
included 58% direct medical, 13% direct non-medical, 25% indirect, and 3% intangible costs(26).
OSA patients had a 0.5% chance of requiring a hospitalisation. For the 721 hospitalised individuals,
there was about 1 hospitalisation per patient (736 total discharges) at an average length of stay of 2
days. The $3 million worth of hospitalisations (1.1% of total costs) averaged to about $4,500 per
hospitalised patient.
Lower Respiratory Tract Infections (LRTI) and Influenza
Disease Description
These diseases vary and may include certain hospital or community-acquired infections such as
pneumonia. It also includes common infections such as bronchitis and bronchiolitis. The causes of
these infections are wide-ranging and they may impact on any part of the lower respiratory tract.
These diseases may affect anyone, but children and the elderly are especially vulnerable to
complications with bronchiolitis being the most common paediatric respiratory admission among
infants(27, 28).
Influenza is a term that describes both the influenza virus and the illness it causes. It is a highly
contagious, airborne virus that is one of the most common human infections(1). The symptoms are
typically a high fever, muscle aching, sore throat, headache, cough and other respiratory symptoms
but may result in several other symptoms depending on the severity of the infection(1). There are
various subtypes of influenza and the virus is characterised by genetically "lability", i.e. the virus'
genetic code is relatively unstable and mutations that alter the virulence and infectivity are not
uncommon. Over recent years there have been several reports of highly virulent strains of influenza
(e.g. "swine flu", "avian flu"), resulting in a limited number of deaths(29, 30).
Treatment is usually supportive for mild infections (pain relief, paracetamol and fluids), but antiviral
therapy is often used for more severe infections. Seasonal flu vaccines are available to help prevent
infection. Severe infections may result in pneumonia, either directly or due to secondary bacterial
infection, and require hospitalisation(1).
Prevalence and Incidence
The estimated incidence of lower respiratory tract infection (LRTI) is 30 per 1,000 children per year
in the UK(31). LRTIs are also very prevalent in older patients in hospital. The incidence of lower

Respiratory Disease in New Zealand 14
respiratory tract infections among persons aged 85–90 years was 94 per 1000 person years in the
Netherlands(32). GP consultation rates in the UK suggest the overall incidence of LRTI is 1,581 per
100,000 individuals of all ages(33).
Influenza has a seasonal pattern with a peak between May and September. In 2010, it was
estimated that about 1,036/100,000 individuals experienced flu-like symptoms during the influenza
season(34). For the rest of the year, this rate dropped to about 49/100,000 individuals. Children
under 4 years of age were more likely to experience influenza than other age groups.
Health Outcomes
Nearly 460 deaths occurred as the result of LRTIs in 2006. The majority of these deaths (67.2%)
occurred in individuals aged over 85 years. These infections also contributed to 1,106 DALYs with
a sizeable proportion lost in newborns (20.1%). Only individuals aged over 85 years had more
DALYs lost than newborns (about 1388 compared to 1106).
Influenza was responsible for 14 deaths in 2006 with about 57.1% of those deaths occurring in
individuals aged over 85 years. DALYs were relatively modest at about 310 spread fairly evenly
over all age groups.
Health Utilisation and Cost
These two conditions contributed to over 28,000 hospitalisations for about 24,000 individuals (1.2
hospitalisations per hospitalised individual). In 2011/12, LRTI/influenza patients had a combined
probability of requiring a hospitalisation of about 36%. The average length of stay was about 3.5
days and the average price per hospitalised individual was $4,700. This aggregated to $112 million
or 42.3% of all respiratory hospitalisation costs.

Respiratory Disease in New Zealand 15
Cystic Fibrosis (CF)
Disease Description
CF is New Zealand’s most common life-threatening genetically inherited condition. One in twenty-
five Caucasian New Zealanders is a carrier of the ‘faulty’ gene(35). The disease has a recessive
inheritance pattern, i.e. affected children are born to parents who both carry the abnormal gene but
do not have the disease. The abnormal gene results in a malfunctioning chloride channel, preventing
normal movement of salt and water across cells(1).
It affects the lungs by reducing water secretion and preventing the production of normal airway
mucus(36). This interferes with the normal lung defence mechanisms thereby creating an environment
conducive to bacterial growth and leading to recurrent chest infections. CF patients typically suffer
from chronic cough and sputum production. The recurrent infections lead to progressive lung
damage over time and ultimately patients are limited by shortness of breath(1).
The mainstays of therapy are chest physiotherapy, medications to enhance mucus clearance and
control of infection and nutritional supplementation. Most CF patients will develop respiratory failure
as disease progresses and lung transplantation is typically considered the only remaining treatment
option.
Prevalence and Incidence
CF is a relatively rare condition. In New Zealand, the Port CFNZ registry captures a significant
proportion of all CF patients in New Zealand(35). With 415 registered patients, it is estimated that this
registry captures about 85% of all CF patients in New Zealand. Extrapolating from this estimate, it
is possible that there are approximately 488 CF patients in New Zealand. The median age of registry
patients is about 16 years due to the shortened lifespan of patients with CF.
Health Outcomes
CF deaths numbered about 7 in 2006 with the vast majority of deaths occurring in individuals aged
between 15-24 years (71.4%). No deaths occurred after 44 years in 2010. The 517 DALYs
associated with CF were borne mostly by 15-24 year olds.
Health Utilisation and Cost
Over half (51.1%) of CF patients required an average of 2.5 hospitalisations in 2011/12. Hospitalised
CF patients had an average length of stay of 9.6 days per discharge and an average cost of $28,100,
the highest average cost of any respiratory condition. In total, CF hospitalisations cost the health
system about $6 million (2.3% of respiratory hospitalisation costs).

Respiratory Disease in New Zealand 16
Bronchiectasis
Disease Description
Bronchiectasis is an airway disease characterised by damage to small and medium sized airways
that results in impaired mucus clearance and airflow obstruction. Pathologically there is abnormal
dilatation of bronchi(1). While the disease can be secondary to an underlying immune deficiency, in
most cases of bronchiectasis a specific cause cannot be identified; these cases are termed
idiopathic. Conventional wisdom is that most idiopathic cases are due to severe viral infection or
whooping cough occurring in early childhood years leading to an initial insult to small airways. In
almost half the cases a specific aetiology can be identified such as previous pulmonary tuberculosis,
smoking related COPD, allergic bronchopulmonary aspergillosis or pneumonia(37).
Patients typically present with recurrent chest infections due to impaired mucus clearance which can
lead to excessive airway inflammation and chronic bacterial colonisation of the abnormal bronchi.
Treatment for bronchiectasis includes airway clearance techniques to remove mucus from airways,
bronchodilators and antibiotics to treat inter-current infections. There is an emerging role for anti-
inflammatory therapy to dampen the excessive airway inflammation(1).
Prevalence and Incidence
In 2000, a retrospective review of children attending the bronchiectasis clinic found a crude
prevalence rate of about 17/100,000 in the Auckland paediatric population(38). A prospective,
national study reporting all new cases diagnosed in 2001-2003 using the NZ Paediatric Surveillance
Unit gave an incidence of 3.7/100,000 children per year(39). Eighty percent of the children were Māori
or Pacific peoples indicating a disproportionate prevalence of bronchiectasis at 52/100,000 for
Pacific peoples, 24/100,000 for Māori and 4/100,000 for European groups. Overall, the prevalence
of bronchiectasis has been estimated at 51/100,000 individuals in the United States and is likely to
be higher in New Zealand due to the higher relative proportion of Pacific and Māori when compared
to the United States(40). Clinical estimates of bronchiectasis in New Zealand are between 272 and
341 per 100,000. This disparity between published estimates and clinical estimates may be due to
the fact that bronchiectasis is often miscoded or misdiagnosed in data sets.
Health Outcomes
Although bronchiectasis is often diagnosed in childhood, in many it is not diagnosed until adulthood
and is often wrongly diagnosed as asthma for many years first(41). The majority of the 273 deaths
associated with the disease occurred in adults aged over 60 years. Individuals aged less than 60
years bore a sizeable DALY burden, estimated at 8,629 DALYs.

Respiratory Disease in New Zealand 17
Health Utilisation and Cost
Of the 682 hospitalised patients, they required an average of 1.6 hospitalisations for a total of 1,065
discharges. These hospitalisations lasted an average of 5.5 days and contributed to an average
cost of $7,300 per hospitalised patient. Total hospitalisation costs summed to $5 million (1.9% of
total costs). These numbers may be an underestimate due to the difficulty coding bronchiectasis.
Interstitial Lung Disease (ILD) and Sarcoidosis
Disease Description
ILD is a term that describes a large group of diseases that affects the interstitium (the tissue and
space around the alveoli)(1). This classification is used to separate it from obstructive chronic lung
diseases since the mechanism of disease causes restricted lung movement and impaired gas
transfer and does not result in airway obstruction. Many diseases fall into this category with a variety
of possible causes including drug induced and environmental exposures. Often no cause is
identified; these are termed idiopathic interstitial pneumonias. Treatment is varied and includes
corticosteroids or other immune suppressant medications(42). Related to ILD is sarcoidosis.
Sarcoidosis is a multi-system inflammatory disease of unknown cause characterised by the
development of granulomas (chronic inflammatory cell deposits) in various organs(1). The lungs are
the most common site and patients tend to exhibit dry cough and shortness of breath(1). This is due
in large part to the inflammatory response in the lungs. While the cause of sarcoidosis is not fully
known, genetics and environmental factors are thought to influence a person’s susceptibility for
contracting the disease(43). Treatment is with corticosteroids although observation alone is often
used because the disease can resolve on its own.
Prevalence and Incidence
ILD is a grouping of diseases considered by the European Union Committee of Experts on Rare
Diseases (EUCERD) as a rare disease. A study in the Czech Republic reported 7-12 cases per
100,000 population while data from a Finnish registry indicated 16-18 cases per 100,000
population(44). Since no prevalence data is available for New Zealand, this report assumes that
prevalence of ILD is 5–18 per every 10,000 individuals, the EUCERD threshold for rare diseases
and the upper Finnish estimation(45).
There are no New Zealand specific estimates of sarcoidosis as at May 2013. Using data from the
United Kingdom (UK), sarcoidosis may affect about 1 in every 10,000 individuals in the New Zealand
population or about 442 individuals(46). It mostly affects individuals aged 20-40 years. Additionally,
it is more prevalent in women than in men.

Respiratory Disease in New Zealand 18
Health Outcomes
ILD contributed to about 123 deaths in 2006 with most of these deaths occurring in individuals aged
over 75 years. The majority of the 1,755 DALYs occurred in individuals aged over 70.
In 2006, 11 deaths occurred as the result of sarcoidosis. With 633 DALYs lost, this disease mostly
impacted individuals aged over 30 years.
Health Utilisation and Cost
There were 454 hospitalisations spread over 352 individuals in 2011/12 (average 1.3 hospitalisations
per person). As a proportion of total ILD/sarcoidosis patients, this equated to a hospitalisation rate
of between 4.2% and 13.3%. Average length of stay and cost per hospitalised patient was 7.3 days
and $8,700, respectively. In total, $3 million was spent on hospitalisations attributable to these
conditions or 1.1% of total respiratory hospitalisation costs.
Tuberculosis (TB)
Disease Description
Tuberculosis is an infection caused by the bacteria Mycobacterium tuberculosis (MTb)(1). It is the
most common cause of disease-related morbidity worldwide(47). Although it characteristically affects
the lungs, it is a multisystem disease which can affect the brain, meninges, gastrointestinal tract,
genitourinary organs and bones(48).
TB is usually acquired through exposure of the lungs or mucous membranes to infected air-borne
particles. Following initial infection with MTb it can either be cleared, suppressed by the immune
system (latent TB) or cause active disease(1). Symptoms of disease depend on the site affected but
are most commonly cough (at times with blood stained sputum), weight loss, night sweats, fevers,
chest pain or symptoms localised to other affected areas. Latent infection has the potential to re-
activate many years later.
A full recovery would be expected with non-drug resistant TB and an adequately adhered to
treatment course. TB is usually treated with a four-drug antibiotic combination, but increasingly
strains of M. tuberculosis are showing varying degrees of drug resistance(1). Multi-drug resistant TB
(MDR-TB) and extensively-drug resistant TB (XDR-TB) are presenting new challenges to current
treatment regimens internationally.

Respiratory Disease in New Zealand 19
Prevalence and Incidence
There were 626 cases of TB notified in 2011 or about 7 cases per 100,000 individuals(49). These
notifications comprised 308 cases of TB disease (new and relapse/reactivation cases) and 318
cases of TB infection (treatment of latent infection and old disease on preventive treatment). Annual
TB disease notification rates have more than halved between 1980 (15.1 per 100,000 population)
and 2011 (7.0 per 100,000 population), although there has been little change in rates over the last
five years. Disease notification rates in 2011 were highest in those aged 20 to 29 years and in the
Middle Eastern/Latin American/African ethnic group. More than half of the disease notifications were
reported by the three District Health Boards (DHBs) in the Auckland region possibly related to the
high population of immigrant communities from TB prevalent countries. The highest rates of TB
disease were in Auckland DHB, followed by Capital and Coast and Hawke's Bay DHBs.
Health Outcomes
Seventy-eight deaths were recorded as TB-related in 2006. About 70.4% of those deaths occurred
in individuals aged over 70 years for a DALY loss of 370.
Health Utilisation and Cost
TB has an expensive average cost of $14,100 per hospitalised patient. For the 150 hospitalised
individuals (24% of incident TB patients), they had an average of 1.2 hospitalisations (185 in total)
with an average length of stay of 14 days per hospitalisation. Total costs were $2 million (0.8% of
all costs).
Pulmonary Arterial Disease/Hypertension (PAD/H)
Disease Description
Pulmonary arterial disease (PAD) comprises a multitude of diseases that obstruct blood flow through
the pulmonary arteries such as cor pulmonale and pulmonary arterial hypertension (PAH). Cor
pulmonale is failure of the right side of the heart brought on by long-term high blood pressure in the
pulmonary arteries and right ventricle of the heart(50).
PAH is an abnormal elevation of the blood pressure within the pulmonary arteries(1). It may be caused
by left heart failure, pulmonary parenchymal disease, pulmonary vascular disease,
thromboembolism or a combination of these factors(51). The most common presenting symptom is
exertional breathlessness, but fatigue, angina, syncope and peripheral oedema are also common.
Diagnosis is usually achieved through echocardiography and right heart catheterisation to establish
the pulmonary artery pressure and right ventricular function(51).
PAD comprises a heterogeneous group of disorders and treatment varies depending on the exact
diagnosis. Treatment is initially with medicines (e.g. calcium channel blockers, prostanoids,

Respiratory Disease in New Zealand 20
phosphodiesterase inhibitors or iloprost), but occasionally more invasive procedures are required
with some patients eventually requiring heart and lung transplant(51).The prognosis is poor with
approximately 15% mortality at 1 year on modern therapy and a 2-3 year median survival(52, 53).
Prevalence and Incidence
There are very few reliable estimates for the diseases that comprise PAD due to the relative difficulty
of diagnosing large populations for the purpose of a population study using invasive right heart
catheterisation. Additionally, PAD usually presents with other chronic diseases such as COPD and
is difficult to separate from concomitant conditions(54). For PAH, there are some prevalence
estimates.
Although previously thought to be uncommon, data from a French registry suggests the prevalence
is approximately 15 per million(55). Idiopathic pulmonary arterial hypertension (IPAH) has a global
incidence of about 2-3 per million per year and a prevalence of about 15 per million(56). Adult females
are almost three times more likely to present with IPAH than adult males. The presentation of IPAH
within children is more evenly split along gender lines.
Health Outcomes
Pulmonary arterial disease was responsible for 34 deaths in 2006. A total DALY loss of 1,213 was
fairly evenly split among all age groups with a lower figure in the 35–39 year population.
Health Utilisation and Cost
There were 1,273 individuals hospitalised for PAD. They each had an average of 1.1 hospitalisations
(1,421 in total) that were an average of 2.6 days in length. Each hospitalised individual cost about
$3,300 for a total of $4 million in hospitalisations (1.5% of total costs).
Other Respiratory Diseases
Disease Description
This final category includes any other respiratory disease not mentioned above. These diseases
may be the result of trauma (pneumothorax), a procedure-related illness (pulmonary effusion) or
primarily affect newborns (pulmonary hyperplasia). Treatment is most varied for this group as well
as the range of causes.
Prevalence and Incidence
As there are many diseases categorised in this category, there are no prevalence or incidence
estimates to adequately describe this group.
Health Outcomes
These conditions accounted for 54 deaths and 1,716 DALYs.

Respiratory Disease in New Zealand 21
Health Utilisation and Cost
These respiratory diseases were responsible for the 11,089 hospitalisations of 10,190 people
(average of 1.1 hospitalisations). These hospitalisations had an average length of stay of 2.2 days
and an average cost per hospitalised individual of $4,400 totalling $45 million or nearly 17% of all
respiratory hospitalisation costs.
Public Health
Most respiratory diseases are associated with smoking. As such, public health in respiratory disease
tends to focus on smoking cessation. The Health Promotion Agency (HPA) in partnership with the
Ministry of Health has created various campaigns and tools to help curb tobacco use and track
progress(57).
Of the smoking cessation programmes, Smokefree 2025 represents the broad overall goal of the
smaller, targeted programmes. The goal is to reach smoking levels of less than 5% of the population
by 2025 through a combination of price increases and youth-centred anti-smoking campaigns.
These campaigns are primarily focused on Māori youth since smoking disproportionately affects this
population. Through the ‘Smoking Not Our Future’ campaign, smoke free rock concerts and
partnerships with schools, the proportion of 14-15 year olds who have never smoked increased from
33% in 2000 to 70% in 2011. Given that these programmes were implemented concurrently with tax
increases and pictorial warnings, the exact proportion of this reduction attributable to public health
campaigns is unknown.
In addition to anti-smoking campaigns, the health sector has also provided support for reducing
obesity (a leading cause of OSA) and increasing influenza vaccine uptake. Lastly, public health
initiatives to reduce air pollution are also underway. It is thought that air pollution contributes to over
600 extra respiratory and cardiac hospitalisations and may partially explain why New Zealand has
relatively high rates of certain respiratory diseases(58).

Respiratory Disease in New Zealand 22
New and Growing
In addition to the information above, various disease areas are growing in terms of economic burden.
This section highlights those areas.
Over the 3 financial years 2009/10 to 2011/12, five disease areas decreased in terms of
hospitalisation cost burden whilst six grew. TB has seen the biggest decline in costs at 19.5% and
ILD/sarcoidosis has been growing the fastest at 6.1% on average followed by bronchiectasis at 4.5%.
As far as the significance of growth goes, the non-aggregated disease category with the largest
nominal hospitalisation cost growth was COPD which grew 1.5% during the 2009/10 to 2011/12
period equating to an increase of $810,000.
Discussion and Limitations
This section synthesises the evidence above for each disease. For a summary of hospitalisations
and costs by disease, see Appendix 1. This section concludes with a discussion of the limitations of
this report. It is divided into a section for each of the Committee’s relevant decision-making criteria:
• Health and Independence Gain • Equity • Materiality • Policy Congruence • Risk
Since this document explores disease states as opposed to specific interventions, some of the
NHC’s decision-making criteria and assessment domains used in health technology assessments
are not appropriate. For example, whilst clinical safety and effectiveness are important
considerations for making a recommendation as to whether or not an intervention should be funded,
they are not applicable to diseases since a disease cannot be defined as clinically safe or effective.
Similarly, the affordability, feasibility of adoption and value for money criteria were not assessed.
Health and Independence Gain
Deaths and DALYs were the main health outcomes reported. As evident in Figure 3, COPD, lung
cancer and asthma accounted for the highest proportion of both deaths and DALYs. In fact, COPD
and lung cancer accounted for 64% and 77% of DALYs and deaths, respectively (Figures 4 and 5).
Asthma also had a large DALY burden. These results are significant in that the Committee considers
the potential health and independence gain in a particular disease area. Areas with the highest
mortality and DALY burden have the most potential improvement for health and independence gains.
Of course, the distribution of DALYs and deaths is also an important indicator of equity.

Respiratory Disease in New Zealand 23
Figure 3: Total deaths and DALYs
Source: NZBDS 2013
Figure 4: DALY Breakdown by Percentage
Source: NZBDS 2013
02004006008001000120014001600
05000
10000150002000025000300003500040000
Deat
hs
DALY
s
Disease
DALYs
Deaths
COPD40%
Lung Cancer24%
Asthma17%
LRTI6%
OSA3% Other Causes
10%

Respiratory Disease in New Zealand 24
Figure 5: Death Breakdown by Percentage
Source: NZBDS 2013
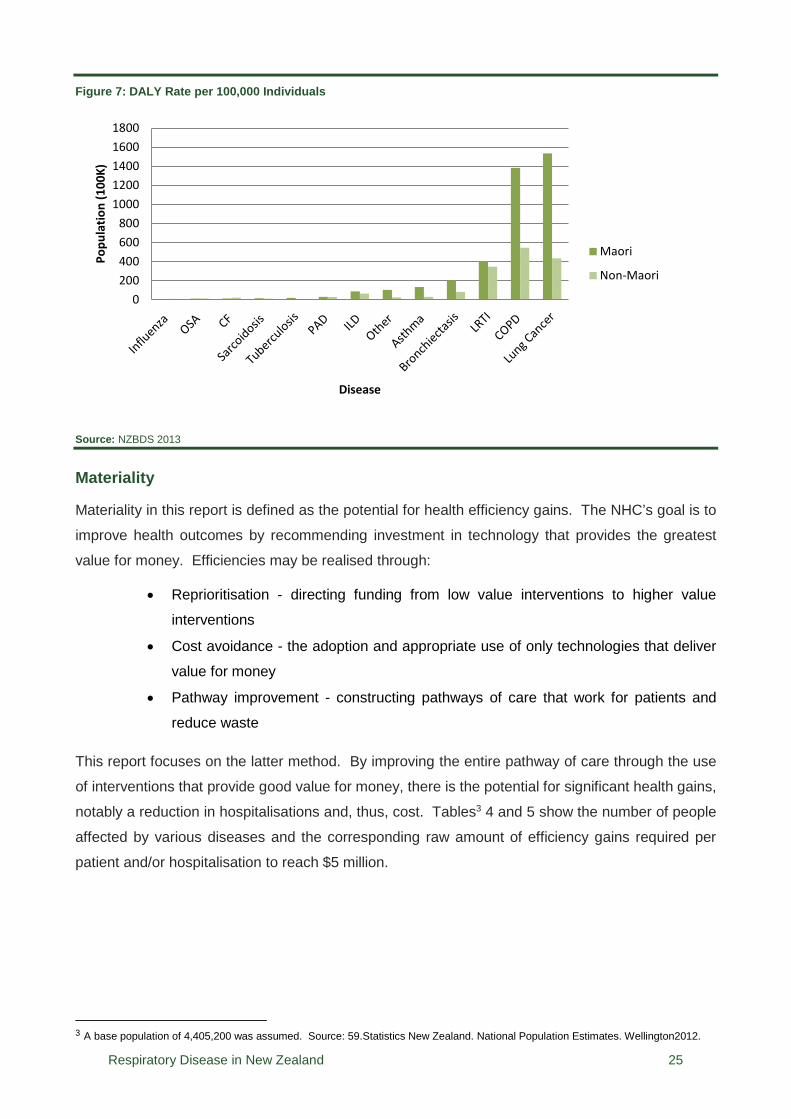
Equity
For nearly every disease, Māori were affected more than the general population with the exception
of influenza, CF and PAD (Figures 6 and 7). As such, a focus on any of the conditions where inequity
exists either in terms of deaths or DALYs would stand to benefit Māori. Based on age-standardised
death and DALY rates, a focus on lung cancer and COPD has the most potential to increase equity.
Figure 6: Death Rate per 100,000 Individuals
Source: NZBDS 2013
COPD39%
Lung Cancer38%
Asthma2%
LRTI12%
Bronchiectasis2%
ILD3%
Other Causes4%
01020304050607080
Popu
latio
n (1
00K)
Disease
Maori
Non-Maori
Respiratory Disease in New Zealand 25
Figure 7: DALY Rate per 100,000 Individuals
Source: NZBDS 2013
Materiality
Materiality in this report is defined as the potential for health efficiency gains. The NHC’s goal is to
improve health outcomes by recommending investment in technology that provides the greatest
value for money. Efficiencies may be realised through:
• Reprioritisation - directing funding from low value interventions to higher value
interventions
• Cost avoidance - the adoption and appropriate use of only technologies that deliver
value for money
• Pathway improvement - constructing pathways of care that work for patients and
reduce waste
This report focuses on the latter method. By improving the entire pathway of care through the use
of interventions that provide good value for money, there is the potential for significant health gains,
notably a reduction in hospitalisations and, thus, cost. Tables3 4 and 5 show the number of people
affected by various diseases and the corresponding raw amount of efficiency gains required per
patient and/or hospitalisation to reach $5 million.
3 A base population of 4,405,200 was assumed. Source: 59. Statistics New Zealand. National Population Estimates. Wellington2012.
0200400600800
10001200140016001800
Popu
latio
n (1
00K)
Disease
Maori
Non-Maori

Respiratory Disease in New Zealand 26
Table 4: Prevalent Diseases: Efficiency Gains Required to Reach $5 million
Disease Population Savings required (Per Person)
Savings required (Per
Hospitalisation) Percentage of Average
Hospitalisation Cost
Asthma 524,176 $10 $595 38.8%
COPD 96,100 $52 $430 9.2%
OSA 132,400 $38 $6,800 167%
CF 488 $10,250 $8,800 83.3%
Bronchiectasis 13,250 $377 $4,700 100%
ILD/Sarcoidosis 2,645-8,371 $600-$1,890 $11,000 166%
PAD 1,2734 $3,900 $3,500 124%
Per Person gains were calculated by dividing $5 million by the patient population. Per Hospitalisation gains were calculated by dividing $5 million by the number of hospital discharges. Percentage of Average Hospitalisation Cost was calculated by dividing the gains per hospitalisation by the average hospitalisation cost and converting to a percentage. 2013 NHC Executive Analysis of 2011/2012 NMDS
Table 5: Incident Diseases: Efficiency Gains Required to Reach $5 million
Disease Population Savings required (Per Person)
Savings required (Per
Hospitalisation) Percentage of Average
Hospitalisation Cost
LRTI/Influenza 77,716 $64 $177 4.4%
Lung Cancer 1,322 $3,780 $2,620 38.5%
TB 626 $7,990 $27,000 250%
2013 NHC Executive Analysis of 2011/2012 NMDS
It is important to consider both the absolute gains required per person or hospitalisation as well as
the relative reduction in costs. This report uses average hospitalisation prices (inpatient or day
patient) per person as a proxy for average total costs per person. Whilst this assumption has some
limitations, it does provide some insight as to the feasibility of reaching a material efficiency gain.
There is not enough efficiency potential in OSA, CF, ILD/sarcoidosis, PAD or TB as it would take a
reduction in hospitalisation costs greater than or virtually equal to total cost to reach the $5 million
mark. This leaves asthma, COPD, LRTI/influenza and lung cancer as possible candidates for
improved health service provision.
For asthma and lung cancer, it would require a nearly 40% reduction in hospitalisation costs to reach
the $5 million target. This could be accomplished either by reducing the average cost of each
hospitalisation by 40% (i.e. cut length of stay in half), reducing the total number of hospitalisations
4 The prevalence estimate for PAD was taken from the NMDS hospitalisation due to the paucity of a suitable population estimate. It is likely the actual population is larger than the NMDS estimate.

Respiratory Disease in New Zealand 27
by about 40% or a combination of the two. Given that the relative rate of asthma for children and
adults in Canada(60) is similar to that of New Zealand’s (15.6% and 8.3% versus 14.2% and 11.2%),
a suitable reduction in hospitalisations seems plausible since Canadian hospitalisation rates are
well below that of New Zealand(60).
Canadian asthma hospitalisation rates from 2004/05 were 9 to134 per 100,000 for individuals aged
5–44 years whilst New Zealand estimates were 122 to 270 per 100,000 for individuals aged 5–34
years. Reducing the upper New Zealand hospitalisation rate by 40% would equate to a rate of 162
per 100,000 individuals, well above the highest Canadian estimate. While it may be possible to
reduce asthma hospitalisations significantly, COPD seems like a more likely candidate if the goal is
to have the greatest positive impact on health outcomes while improving value for money.
Although Canadian COPD estimates for adults aged over 34 are about 50% less than New Zealand’s
rate for individuals over 45 years (4.4% versus 6.6%), it has been suggested that Canada’s
prevalence rate could underestimate actual prevalence by at least 50% which would make the
prevalence rate similar to New Zealand’s rate(61). Reducing COPD hospitalisations by 9.2% seems
achievable since a 9.2% reduction in COPD hospitalisations would reduce the total number of
discharges to 10,550. Assuming the majority of these hospitalisations occur in individuals aged over
40 years; the non-standardised rate would reduce to 522 per 100,000 which is significantly higher
than the average Canadian rate of 295 per 100,000 individuals aged 55–64 years. Because of the
disparity between New Zealand and Canadian hospitalisation rates, there appears to be room for
improvement in COPD care.
Lung cancer hospitalisation rates are not disparate enough to expect such a reduction, yet the
difference in lung cancer incidence rates implies there is room for improvement. A nearly 40%
reduction in lung cancer hospitalisations seems unlikely since the New Zealand non-standardised
rate of 9.4 per 100,000 individuals aged over 40 is similar to the equivalent Canadian rate. However,
the Canadian lung cancer incidence rate is more than double the New Zealand rate (70 versus 30
per 100,000) which implies that Canadian lung cancer patients may be hospitalised less often than
New Zealand patients. More information would be needed to assess whether or not a reduction in
hospitalisations would be plausible given New Zealand’s lower incidence rate.
Perhaps most achievable of all of these options is a reduction in hospitalisation rates for LRTI and
influenza. A 4.4% reduction in influenza and LRTI hospitalisation rates seems achievable; hence,
there has been a 0.9% decline in hospitalisation costs already during the 2009-2012 periods.
Moreover, there are already a range of sector initiatives devoted to reducing these figures further.
On this basis, the NHC may only add marginal value to a highly saturated research area that is
already in decline.

Respiratory Disease in New Zealand 28
Policy Congruence
The government has established various health targets for the health system. Relevant to
respiratory disease are the health targets of smoking reduction, reduced emergency department
(ED) wait times and reduced cancer treatment wait times.
Most respiratory diseases are affected by smoking. As such, any attempt to lower respiratory
disease rates will likely focus on smoking cessation. In terms of this health target, lung cancer and
COPD are most closely associated with smoking rates and align well with government policy.
Diseases that may present in the ED, most notably asthma, COPD, LRTI and influenza, align well
with the target to reduce ED wait times.
Lastly, reduced cancer treatment wait times most closely aligns with lung cancer.
Risk
Respiratory disease places a large burden on the health system, both socially and economically, so
any improvement in this disease area is likely to have a large impact. Thus, risk has been interpreted
as the risk of both conducting further analysis on a particular disease and not conducting such
analysis.
As established above, the main risk of conducting further analysis is that the gain in health outcomes
or savings will not be material for that chosen disease. To mitigate this risk, the Committee’s other
decision-making criteria favour disease areas that affect a large number of people and, thus, require
a smaller reduction in costs/gains in health outcomes per person to realise materiality. As a result,
some diseases that have a lower prevalence burden are prioritised below diseases with a higher
prevalence burden.
Relative health gains may be greater for individuals in these diseases but when aggregated do not
reach the materiality guideline used in this report. For example, CF is a relatively expensive disease
to treat and significantly impacts individual health outcomes. Compared to the whole of respiratory
disease, though, it represents a relatively small health and economic burden. So while potential
population health gain may be greater for COPD than for CF, potential individual health gain may be
greater for CF.
Limitations
The methods used in this report have both strengths and weaknesses. This section outlines some
of those limitations, notably the use of NMDS price data.
NMDS prices include the inter-district flow (IDF) price of a cost weight, the price that one DHB pays
another DHB to perform services for its own population. These NMDS prices are not the actual cost
of each hospital stay and vary significantly from the real cost, especially when new procedures are

Respiratory Disease in New Zealand 29
involved. NMDS prices include public casemix discharges which comprise about 20% of the Vote:
Health spend. Other costs not represented in our NMDS analysis include the following:
• Primary care consultations such as with General Practitioners (GPs) and community nurses
• Community pharmaceuticals
• Community laboratory tests
• Disability support services
• Emergency Department attendances
• Outpatient attendances
• Health promotion programmes and
• Community hospice palliative care
The NHC recognises that these costs are significant and is developing ways of incorporating these
into future analysis of this kind. Although NMDS prices alone are insufficient to cover the entire cost
of a particular disease, they are a good proxy for relative economic disease burden and we have a
relatively comprehensive data set in New Zealand compared to other countries.
Indirect costs (i.e. lost productivity, costs to sectors other than health) were not considered for every
disease. There is a great disparity in how different studies measure these costs, so the decision
was made to compare disease costs primarily on NMDS hospitalisation costs as those are
consistently applied to each disease. Another limitation of this report was the use of non-systematic
searches.
One of the limitations of conducting non-systematic searches is the possibility that the non-appraised
studies reported unreliable results that may have biased the evidence in this report. This limitation
was further compounded by the lack of respiratory disease prevalence data in New Zealand. Clinical
opinion is that COPD and bronchiectasis have especially sparse data. OSA is also thought to be
underdiagnosed in New Zealand (62). To mitigate these risks, multiple sources were checked to
gauge accuracy and where no suitable evidence was available this was clearly stated and
supplemented with clinical opinion.
Lastly, a general limitation of this report is the focus on specific diseases as opposed to a more
integrated look at respiratory disease. Many patients with one disease have other co-morbidities
that were not included in the health outcomes calculation. Whilst this may limit the full impact of
analysis, further work conducted in one area will likely have positive impacts on other diseases with
similar risk factors. Consultation in subsequent tiers will ensure co-morbidities and their relation to
patient outcomes will be discussed. To ensure a robust recommendation these limitations were
considered alongside the other risks outlined in this document.

Respiratory Disease in New Zealand 30
Recommendation
Based on the evidence presented in this report and the above discussion section, it is recommended that the NHC conduct further analysis on COPD during the 2013/14 financial year.
COPD fits the established decision-making criteria most fully and has the greatest potential for health
gain and material savings. Subsequent years may include further work on asthma and lung cancer
as they, too, fit the Committee’s decision-making criteria reasonably well. Figure 8 graphically
summarises how each disease compares to the decision-making criteria used in this report.
Figure 8: Appraisal of different respiratory disease against selected NHC decision-making criteria
Disease Health/Independence Materiality Policy Congruence Equity Risk
COPD
Asthma
Lung Cancer
LRTI and Influenza
OSA
Cystic Fibrosis
PAD
ILD/Sarcoidosis
Tuberculosis
Bronchiectasis
Other
Key Fit Very Well/Low Risk of Assessment/High Risk of No Assessment Well/Some Risk of Assessment or No Assessment Somewhat/Some Risk of Assessment/Low Risk of No Assessment Not Really/Some Risk of Assessment/High Risk of No Assessment None/High Risk of Assessment/Low Risk of No Assessment
Source: 2013 NHC Executive Appraisal

Respiratory Disease in New Zealand 31
Appendix 1: NMDS Summary Data for Publically Funded Hospital Casemix Events (inpatient or day patient) for 2011/12
Total Price ($M)
Mean Price ($k)
Individuals (n)
Mean growth (%)
Discharges (n)
30 Day Acute Readmission (%)
2010 Mortality (n)
2010 Years of Life Lost (YLL)
Time in Care (Years)
Tuberculosis 2 14.1 150 -19.5 185 16.8 17 261 7
Obstructive Sleep Apnoea 3 4.5 721 0.3 736 0.8 11 328 4
ILD/Sarcoidosis 3 8.7 352 6.1 454 12.6 156 2,110 7
Pulmonary Artery Disease 4 3.3 1,273 -0.8 1,421 7.6 39 730 10
Bronchiectasis 5 7.3 682 4.5 1,065 17.4 94 1,560 16
Cystic Fibrosis 6 28.1 229 0.4 568 14.1 8 421 15
Lung Cancer 13 9.3 1,401 -2.7 1,908 15.3 1,622 29,828 27
Asthma 17 2.5 6,619 -5.7 8,403 9.6 57 1,625 34
Other Respiratory Disorders 45 4.4 10,190 2.9 11,089 6.1 82 878 68
COPD 54 7 7,716 1.5 11,619 17.9 1,588 20,121 134
Lower Resp Tract Infection /Influenza 112 4.7 24,092 -0.9 28,261 9.3 554 5,537 270
TOTAL 265 5.2 50,664 -0.3 65,709 10.6 4,228 63,397 592
Source: 2013 NHC Executive analysis of 20010–2011/12 NMDS and 2010 National Mortality Collection

Respiratory Disease in New Zealand 32
Appendix 2: Respiratory Disease Growth in terms of Mean Price for Publically Funded Hospital Casemix Events (inpatient or day patient) from 2009/10 to 2011/12
Source: 2013 NHC Executive Analysis of 2009/10–2011/2012 NMDS
Tuberculosis (Total=$2M Growth=-19.5%)
Asthma (Total=$17M Growth=-5.7%)
Lung cancer (Total=$13M Growth=-2.7%)
Lower tract infection (Total=$112M Growth=-0.9%)
Cystic fibrosis (Total=$6M Growth=0.4%)
COPD (Total=$54M Growth=1.5%)
Other (Total=$45M Growth=2.9%)
0
5
10
15
20
25
30
35
0 5000 10000 15000 20000 25000 30000
Mean price ($k)
Individuals (n)
Decay (<0%)Low growth (0<2%)Medium growth (2<4%)High growth (4-8%)

Respiratory Disease in New Zealand 33
References
1. Fauci AS, Longo DL, Kasper DL, Hauser SL, Jameson JL, Loscalzo J, et al. Harrison's Principles of Internal Medicine: McGraw-Hill Medical New York; 2008. 2. Bateman E, Hurd S, Barnes P, Bousquet J, Drazen J, FitzGerald M, et al. Global Strategy for Asthma Management and Prevention: Gina Executive Summary. European Respiratory Journal. 2008;31(1):143-78. 3. Ministry of Health. The Health of New Zealand Adults 2006/07. Wellington: Ministry of Health, 2007. 4. Ministry of Health. New Zealand Health Survey 2011/2012. Wellington: Ministry of Health, 2012. 5. Ministry of Health. National Minimum Dataset (Hospital Events). In: Ministry of Health, editor. Wellington. 6. Holt S, Beasley R. The Burden of Asthma in New Zealand: Asthma and Respiratory Foundation of New Zealand; 2002. 7. Technical Advisory Services Limited. Health Needs Assessment for the Central Region's District Health Boards. Central Region's Technical Advisory Services Limited, 2008. 8. Page A, Ambrose SJ, Glover JD, Hetzel D. Atlas of Avoidable Hospitalisations in Australia: Ambulatory Care-Sensitive Conditions: Commonwealth of Australia; 2007. 9. Pauwels RA, Buist AS, Calverley PM, Jenkins CR, Hurd SS. Global Strategy for the Diagnosis, Management, and Prevention of Chronic Obstructive Pulmonary Disease Nhlbi/Who Global Initiative for Chronic Obstructive Lung Disease (Gold) Workshop Summary. American Journal of Respiratory and Critical Care Medicine. 2001;163(5):1256-76. 10. Barnes PJ, Drazen JM, Rennard SI, Thomson NC. Asthma and Copd: Basic Mechanisms and Clinical Management: Academic Press; 2009. 11. Shirtcliffe P, Weatherall M, Marsh S, Travers J, Hansell A, McNaughton A, et al. Copd Prevalence in a Random Population Survey: A Matter of Definition. European Respiratory Journal. 2007;30(2):232-9. 12. Stevens W, Stevens G, Kolbe J, Cox B. Lung Cancer in New Zealand: Patterns of Secondary Care and Implications for Survival. Journal of Thoracic Oncology. 2007;2(6):481-93. 13. Organization for Economic Cooperation Development. Health at a Glance 2011: Oecd Indicators: OECD; 2011. 14. Town I, Taylor R, Garrett J, Patterson J. The Burden of Copd in New Zealand. The Thoracic Society of Australia and New Zealand and The Asthma Respiratory Foundation of New Zealand, 2003. 15. US Department of Health and Human Services. The Health Consequences of Smoking: A Report of the Surgeon General. Atlanta: US Department of Health and Human Services, Centers for Disease Control and Prevention, National Center for Chronic Disease Prevention and Health Promotion, Office on Smoking and Health; 2004. 16. Ministry of Health. New Zealand Cancer Registry. In: Ministry of Health, editor. Wellington2012. 17. Broad J, Jackson R. Copd and Lung Cancer in New Zealand. Auckland: University of Auckland, 2003. 18. Chan J, Edman JC, Koltai PJ. Obstructive Sleep Apnea in Children. American family physician. 2004;69(5):1147.
Respiratory Disease in New Zealand 34
19. Blunden S, Lushington K, Kennedy D, Martin J, Dawson D. Behavior and Neurocognitive Performance in Children Aged 5-10 Years Who Snore Compared to Controls. Journal of Clinical and Experimental neuropsychology. 2000;22(5):554-68. 20. Chervin RD, Archbold KH, Dillon JE, Panahi P, Pituch KJ, Dahl RE, et al. Inattention, Hyperactivity, and Symptoms of Sleep-Disordered Breathing. Pediatrics. 2002;109(3):449-56. 21. Gozal D. Obstructive Sleep Apnea in Children. Minerva pediatrica. 2000;52(11):629. 22. Mihaere KM, Harris R, Gander PH, Reid PM, Purdie G, Robson B, et al. Obstructive Sleep Apnea in New Zealand Adults: Prevalence and Risk Factors among Māori and Non-Māori. Sleep. 2009;32(7):949. 23. Owen G, Canter R, Robinson A. Overnight Pulse Oximetry in Snoring and Non‐Snoring Children. Clinical Otolaryngology & Allied Sciences. 1995;20(5):402-6. 24. Hultcrantz E, Löfstrand-Tidestföm B, Ahlquist-Rastad J. The Epidemiology of Sleep Related Breathing Disorder in Children. International journal of pediatric otorhinolaryngology. 1995;32:S63-S6. 25. Ferreira AM, Clemente V, Gozal D, Gomes A, Pissarra C, César H, et al. Snoring in Portuguese Primary School Children. Pediatrics. 2000;106(5):e64-e. 26. Gander P, Scott G, Mihaere K, Scott H. Societal Costs of Obstructive Sleep Apnoea Syndrome. Journal of the New Zealand Medical Association. 2010;123(1321). 27. López GA, Casado FJ, Martín SM, Espínola DB, de la Calle CT, Serrano A, et al., editors. Severe Bronchiolitis. Epidemiology and Clinical Course of 284 Patients]. Anales de pediatría (Barcelona, Spain: 2003); 2007. 28. Craig E, Jackson C, Han DY, Grimwood K. Monitoring the Health of New Zealand Children and Young People: Indicator Handbook: Paediatric Society of New Zealand and New Zealand Child and Youth Epidemiology Service; 2007. 29. Real-Time R. Emergence of a Novel Swineorigin Influenza a (H1n1) Virus in Humans. N Engl j Med. 2009;360:2605-15. 30. de Jong MD, Simmons CP, Thanh TT, Hien VM, Smith GJ, Chau TNB, et al. Fatal Outcome of Human Influenza a (H5n1) Is Associated with High Viral Load and Hypercytokinemia. Nature medicine. 2006;12(10):1203-7. 31. Niederman MS, Luna CM, editors. Community-Acquired Pneumonia Guidelines: A Global Perspective. Seminars in Respiratory and Critical Care Medicine; 2012. 32. Sliedrecht A, den Elzen WP, Verheij TJ, Westendorp R, Gussekloo J. Incidence and Predictive Factors of Lower Respiratory Tract Infections among the Very Elderly in the General Population. The Leiden 85-Plus Study. Thorax. 2008;63(9):817-22. 33. British Thoracic Society. The Burden of Lung Disease. 2006. 34. Lopez L, Bandaranayake D, Huang QS. Influenza Surveillance in New Zealand. 2011. 35. Cystic Fibrosis New Zealand. Port Cystic Fibrosis New Zealand Data Registry. 2011. 36. Boucher RC. Airway Surface Dehydration in Cystic Fibrosis: Pathogenesis and Therapy. Annu Rev Med. 2007;58:157-70. 37. Bartley J, Garrett J, Grant CC, Camargo Jr CA. Could Vitamin D Have a Potential Anti-Inflammatory and Anti-Infective Role in Bronchiectasis? Current infectious disease reports. 2013:1-10. 38. Edwards E, Byrnes C. Paedeatric Bronchiectasis in the 21st Centure: Experience of a Tertiary Children's Hospital in New Zealand. Journal of Paediatrics and Child Health 2003. 2003;39(2):111-7.
Respiratory Disease in New Zealand 35
39. Twiss J, Metcalfe R, Edwards E, Byrnes C. New Zealand National Incidence of Bronchiectasis “Too High” for a Developed Country. Archives of Disease in Childhood. 2005;90(7):737-40. 40. Weycker D, Edelsberg J, Oster G, Tino G. Prevalence and Economic Burden of Bronchiectasis. Clinical Pulmonary Medicine. 2005;12(4):205-9. 41. Chang AB, Bell SC, Byrnes CA, Grimwood K, Holmes PW, King PT, et al. Chronic Suppurative Lung Disease and Bronchiectasis in Children and Adults in Australia and New Zealand. A Position Statement from the Thoracic Society of Australia and New Zealand and the Australian Lung Foundation. Med J Aust. 2010;193(6):356-65. 42. Wells A, Hirani N. Interstitial Lung Disease Guideline. Thorax. 2008;63(Suppl 5):v1-v58. 43. Baughman RP, Selroos O. Evidence-Based Approach to the Treatment of Sarcoidosis. Evidence-based respiratory medicine Malden: Blackwell Publishing Ltd. 2005:491-508. 44. Coultas DB, Zumwalt RE, Black WC, Sobonya RE. The Epidemiology of Interstitial Lung Diseases. American Journal of Respiratory and Critical Care Medicine. 1994;150(4):967-72. 45. Ayme S, Rodwell C. 2012 Report on the State of the Art of Rare Disease Activities in Europe of the European Union Committee of Experts on Rare Diseases. European Union Committee of Experts on Rare Diseases, 2012. 46. Gribbin J, Hubbard RB, Le Jeune I, Smith CJ, West J, Tata LJ. Incidence and Mortality of Idiopathic Pulmonary Fibrosis and Sarcoidosis in the Uk. Thorax. 2006;61(11):980-5. 47. WHO. Tuberculosis Fact Sheet N 104 November 2010. World Health Organization 2011. 48. Maher D, Chaulet P, Spinaci S, Harries A. Treatment of Tuberculosis: Guidelines for National Programmes. Treatment of tuberculosis: guidelines for national programmes Second edition. 1997(Ed. 2):1-77. 49. Bissielo A, Lim E, Heffernan H. Tuberculosis in New Zealand: Annual Report 2011. Wellington: Institute of Environmental Science and Research Ltd (ESR); 2012. 50. Mason RJ, Broaddus VC, Martin T, King Jr T, Schraufnagel D, Murray JF, et al. Murray and Nadel's Textbook of Respiratory Medicine: 2-Volume Set: Saunders; 2010. 51. Barst RJ, Gibbs JSR, Ghofrani HA, Hoeper MM, McLaughlin VV, Rubin LJ, et al. Updated Evidence-Based Treatment Algorithm in Pulmonary Arterial Hypertension. Journal of the American College of Cardiology. 2009;54(1s1):S78-S84. 52. Thenappan T, Shah SJ, Rich S, Gomberg-Maitland M. A USA-Based Registry for Pulmonary Arterial Hypertension: 1982–2006. European Respiratory Journal. 2007;30(6):1103-10. 53. D'Alonzo GE, Barst RJ, Ayres SM, Bergofsky EH, Brundage BH, Detre KM, et al. Survival in Patients with Primary Pulmonary Hypertensionresults from a National Prospective Registry. Annals of Internal Medicine. 1991;115(5):343-9. 54. Weitzenblum E. Chronic Cor Pulmonale. Heart. 2003;89(2):225-30. 55. Humbert M, Sitbon O, Chaouat A, Bertocchi M, Habib G, Gressin V, et al. Pulmonary Arterial Hypertension in France Results from a National Registry. American Journal of Respiratory and Critical Care Medicine. 2006;173(9):1023-30. 56. Rudarakanchana N, Trembath R, Morrell N. New Insights into the Pathogenesis and Treatment of Primary Pulmonary Hypertension. Thorax. 2001;56(11):888-90. 57. Health Promotion Agency. Tobacco Control Wellingyon: Health Promotion Agency; 2013. Available from: http://www.hpa.org.nz/what-we-do/tobacco-control.

Respiratory Disease in New Zealand 36
58. HAPINZ. Updated Health and Air Pollution in New Zealand Study. Wellington: Health and Air Pollution in New Zealand, 2012. 59. Statistics New Zealand. National Population Estimates. Wellington2012. 60. Public Health Agency of Canada. Life and Breath: Respiratory Disease in Canada. Ottawa: Public Health Agency of Canada, 2007. 61. Schirnhofer L, Lamprecht B, Vollmer WM, Allison MJ, Studnicka M, Jensen RL, et al. Copd Prevalence in Salzburg, Austriaresults from the Burden of Obstructive Lung Disease (Bold) Study. Chest Journal. 2007;131(1):29-36. 62. Garrett J. Obstructive Sleep Apnoea Syndrome. Journal of the New Zealand Medical Association. 2010;123(1321).
Respiratory Disease in New Zealand 37
National Health Committee (NHC) and Executive
The National Health Committee (NHC) is an independent statutory body which provides advice to the New Zealand Minister of Health. It was reformed in 2011 to establish evaluation systems that would provide the New Zealand people and health sector with greater value for the money invested in health. The NHC Executive are the secretariat that supports the Committee. The NHC Executive’s primary objective is to provide the Committee with sufficient information for them to make recommendations regarding prioritisation and reprioritisation of interventions. They do this through a range of evidence-based reports tailored to the nature of the decision required and time-frame within which decisions need to be made.
Citation: National Health Committee.2013. Strategic Overview: Respiratory Disease in New Zealand (Working Draft). Wellington: National Health Committee.
Published in December 2013 by the National Health Committee PO Box 5013, Wellington, New Zealand
This document is available on the National Health Committee’s website: http://www.nhc.health.govt.nz/
Disclaimer
The information provided in this report is intended to provide general information to clinicians, health and disability service providers and the public, and is not intended to address specific circumstances of any particular individual or entity. All reasonable measures have been taken to ensure the quality and accuracy of the information provided. If you find any information that you believe may be inaccurate, please email to [email protected]. The National Health Committee is an independent committee established by the Minister of Health. The information in this report is the work of the National Health Committee and does not necessarily represent the views of the Ministry of Health. The National Health Committee make no warranty, expressed or implied, nor assumes any legal liability or responsibility for the accuracy, correctness, completeness or use of any information provided. Nothing contained in this report shall be relied on as a promise or representation by the New Zealand government or the National Health Committee. The contents of this report should not be construed as legal or professional advice and specific advice from qualified professional people should be sought before undertaking any action following information in this report. Any reference to any specific commercial product, process, or service by trade name, trademark, manufacturer, or otherwise does not constitute an endorsement or recommendation by the New Zealand government or the National Health Committee.
![Strategic Planning Overview[1]](https://static.fdocuments.in/doc/165x107/553998064a7959c36e8b49bc/strategic-planning-overview1.jpg)