Strategic Noise Maps for Gatwick Airport 2016
39
Environmental Research and Consultancy Department Strategic Noise Maps for Gatwick Airport 2016 ERCD REPORT 1705
Transcript of Strategic Noise Maps for Gatwick Airport 2016

Environmental Research and Consultancy Department
Strategic Noise Maps for Gatwick Airport 2016
ERCD REPORT 1705

ERCD REPORT 1705
February 2018 Page 2
Published by the Civil Aviation Authority, 2018
CAA House, 45-59 Kingsway, London WC2B 6TE
You can copy and use this text but please ensure you always use the most up to date version and use it in context so as not to be
misleading, and credit the CAA.
Enquiries regarding the content of this publication should be addressed to: Environmental Research and Consultancy Department,
Civil Aviation Authority, CAA House, 45-59 Kingsway, London, WC2B 6TE.

ERCD REPORT 1705 Contents
February 2018 Page 3
Contents
Contents 3
Summary 5
Chapter 1 6
Introduction 6
Background 6
Gatwick Airport 7
Chapter 2 8
Noise modelling methodology 8
ANCON model 8
Flight tracks 8
Flight profiles 8
Noise emissions 9
Traffic data 9
Runway modal splits 9
Topography 10
Population data 10
Chapter 3 11
Results 11
2016 Lday contours 11
2016 Levening contours 11
2016 Lnight contours 12
2016 Lden contours 13
2016 annual LAeq,16hr contours 13
Chapter 4 14
Conclusions 14
References 15
Figures 16
Tables 25

ERCD REPORT 1705 Contents
February 2018 Page 4
ANCON type descriptions 36
Glossary 39

ERCD REPORT 1705 Summary
February 2018 Page 5
Summary
1. This report presents the 2016 strategic noise maps generated for Gatwick Airport
to meet the requirements of the Environmental Noise Directive.
2. The noise modelling used mean flight tracks, lateral dispersions, average flight
profiles of aircraft height, speed and thrust, and noise data from the 2016
summer Leq contours analysis.
3. The 2016 average daily 24-hour traffic movements were 767.1 (2011: 687.9).
4. The area of the 2016 Lden 55 dBA contour was 104.9 km2 (2011: 85.7 km2),
enclosing a population of 13,500 (2011: 11,300).
5. The 2016 Lnight 48 dBA contour enclosed an area of 73.2 km2 and a population of
9,000.

ERCD REPORT 1705 Chapter 1: Introduction
February 2018 Page 6
Chapter 1
Introduction
Background
1.1 The EU Directive 2002/49/EC relates to the assessment and management of
environmental noise, and is also referred to as the ‘Environmental Noise
Directive’ (END). The END requires member states to produce strategic noise
maps for the main sources of environmental noise, which include road, rail and
air traffic, and industry. This Directive was transposed into UK law by Statutory
Instrument 2006 No. 2238 The Environmental Noise (England) Regulations 2006
(as amended) (the ‘Regulations’).
1.2 The Environmental Research and Consultancy Department (ERCD) of the Civil
Aviation Authority (CAA) was commissioned by the Department for Transport
(DfT) to produce strategic noise maps for Gatwick Airport for 2016 (i.e. ‘Round 3’
mapping) to meet the requirements of the Regulations. Strategic noise maps for
Gatwick were previously produced by ERCD for 2006 (‘Round 1’) and 2011
(‘Round 2’) to meet the Regulations (Ref 1 & 2, Appendix A).
1.3 The Regulations specify that noise maps are to be produced for the following
noise indicators: Lday, Levening, Lnight, Lden and annual LAeq,16hr. These indicators are
based on air traffic movements over the calendar year, unlike the conventional
Leq noise contours that are based on movements over the 92-day summer
period.
1.4 Lday is the equivalent continuous sound level (Leq) for the local time period
0700-1900. Levening and Lnight are the Leq levels for 1900-2300 and 2300-0700
respectively (local time). Lden is the logarithmic average of Lday, Levening and Lnight,
with the Levening and Lnight components weighted by 5 dB and 10 dB respectively.
The annual LAeq,16hr (0700-2300 local time) is derived from the logarithmic
average of the Lday and Levening results.
1.5 The objectives of this report are to explain the noise modelling methodology
used to produce the 2016 strategic noise maps for Gatwick Airport and to
present the calculated noise maps and associated area, population and dwelling
statistics. At Defra’s1 request, this report presents population and dwelling counts
that have been supplied by Defra’s consultants.
1 The Department for Environment, Food and Rural Affairs (Defra) is responsible for the publication of noise
maps for road, rail, airport and industrial noise sources on behalf of the Secretary of State to meet the
requirements of the Regulations.

ERCD REPORT 1705 Chapter 1: Introduction
February 2018 Page 7
Gatwick Airport
1.6 Gatwick Airport is located approximately 28 miles (45 km) south of London and
about 2 miles (3 km) north of Crawley. Aside from the nearby towns of Crawley
and Horley it is situated in mostly lightly populated countryside (Figure 1,
Appendix B).
1.7 Gatwick Airport has one main runway, designated 08R/26L, which is 3,316 m
long. The Runway 26L landing threshold is displaced by 424 m, and the Runway
08R landing threshold displaced by 393 m.2 There is also one standby runway
(08L/26R) that can be used if the main runway is out of operation, for example,
due to maintenance work. There are two passenger terminals. The layout of the
runways, taxiways and passenger terminals in 2016 is shown in Figure 2.3
1.8 In the 2016 calendar year there were approximately 281,000 aircraft movements
at Gatwick (2011: 251,000) and the airport handled 44.1 million passengers
(2011: 33.7 million).4
2 The runway threshold marks the beginning of the runway available for landing aircraft. A displaced threshold
is a runway threshold that is not located at the physical end of the runway. A displaced threshold is often
employed to give arriving aircraft sufficient clearance over an obstacle. 3 UK AIP, AD 2-EGKK-2-1 (21 Jul 2016)
4 Source: Civil Aviation Authority (www.caa.co.uk/airportstatistics)

ERCD REPORT 1705 Chapter 2: Noise modelling methodology
February 2018 Page 8
Chapter 2
Noise modelling methodology
ANCON model
2.1 Noise contours were calculated with the UK civil aircraft noise model ANCON
(version 2.3), which is developed and maintained by ERCD on behalf of the DfT.
A technical description of ANCON is provided in R&D Report 9842 (Ref 3). The
ANCON model is also used for the production of annual contours for Heathrow
and Stansted airports, and a number of other UK airports.
2.2 ANCON is fully compliant with the European guidance on noise modelling,
ECAC.CEAC Doc 29 (3rd edition), published in December 2005 (Ref 4). This
guidance document represents internationally agreed best practice as
implemented in modern aircraft noise models. An updated 4th edition was
published in December 2016 and will be incorporated in future revised ANCON
software.
Flight tracks
2.3 Aircraft departing Gatwick are required to follow specific flight paths called Noise
Preferential Routes (NPRs) unless directed otherwise by ATC. NPRs were
designed to avoid the overflight of built-up areas where possible. They establish
a path from the take-off runway to the main UK air traffic routes and form the first
part of the Standard Instrument Departure (SID) routes. The Gatwick NPR/SID
routes are illustrated in Figure 3.
2.4 The departure and arrival flight tracks and associated lateral dispersions used for
modelling were based on the mean tracks derived from radar data for the
Gatwick 2016 summer Leq contours (Ref 5).
Flight profiles
2.5 Average flight profiles of height, speed and thrust versus track distance (for
departures and arrivals separately) were modelled for each aircraft type, using
the profile data from the Gatwick 2016 summer Leq contours.
2.6 The application of reverse thrust following touchdown was modelled for all
ANCON types where applicable. Reverse thrust was included in both the day
and night contours.

ERCD REPORT 1705 Chapter 2: Noise modelling methodology
February 2018 Page 9
Noise emissions
2.7 The ANCON model calculates aircraft noise using a noise database expressing
SEL as a function of engine power setting and slant distance to the receiver –
also known as the ‘Noise-Power-Distance’ (NPD) relationship. The ANCON
noise database is continually reviewed and updated with adjustments made
annually when measurements show this to be necessary.
2.8 The noise data used for the Gatwick 2016 END contours were the same as
those for the Gatwick 2016 summer Leq contours.
Traffic data
2.9 The strategic noise maps were based on 2016 annual movement data for the
following three local time periods:
0700-1900 (Lday)
1900-2300 (Levening)
2300-0700 (Lnight)
2.10 The source of this information was the Gatwick NTK system. Traffic statistics
from NTK data were cross-checked with runway logs supplied by Air Navigation
Solutions Ltd5 and close agreement was found.
2.11 The numbers of average daily departure and arrival movements by ANCON
aircraft type, over the Lday, Levening, Lnight, Lden and annual LAeq,16hr periods, are
summarised in Tables C1-C5 of Appendix C. Descriptions of ANCON aircraft
types can be found in Table D1 of Appendix D.
2.12 The average daily 24-hour movements at Gatwick in 2016 were 767.1 (2011:
687.9).
Runway modal splits
2.13 In general, aircraft will take-off and land into a headwind to maximise lift during
take-off and landing. The wind direction, which varies over the course of a year,
will therefore have an important influence on the usage of runways. The ratio of
westerly (Runway 26L) and easterly operations (Runway 08R) is referred to as
the runway modal split.
5 Air Navigation Solutions Limited is the provider of air traffic control services to Gatwick.

ERCD REPORT 1705 Chapter 2: Noise modelling methodology
February 2018 Page 10
2.14 The west / east (W / E) percentage modal splits for each of the 2016 time
periods under consideration are summarised in Table 1.
Table 1 Gatwick 2016 annual modal splits
Noise metric Local time period Modal split (W / E percentage)
Lday 0700-1900 66 / 34
Levening 1900-2300 68 / 32
Lnight 2300-0700 67 / 33
Lden 0000-2400 67 / 33
LAeq,16hr 0700-2300 67 / 33
Topography
2.15 The topography around Gatwick Airport was modelled by accounting for terrain
height, and is of particular relevance on the western side of the airport around
the high ground in the vicinity of Russ Hill (near Charlwood). This was achieved
by geometrical corrections for source-receiver distance and elevation angles.
Other, more complex effects, such as lateral attenuation from uneven ground
surfaces and noise screening/reflection effects due to topographical features,
were not taken into account.
2.16 ERCD holds OS terrain height data on a 200 metre by 200 metre grid for the
whole of England. Interpolation was performed to generate height data at each of
the calculation points on the receiver grid used by the ANCON noise model.
Population data
2.17 Estimates of the population and dwellings within the contours have been
supplied by Defra (Ref 6). Defra utilised population data attained from the mid-
year population estimates from the Office of National Statistics (ONS), dated
June 2015.

ERCD REPORT 1705 Chapter 3: Results
February 2018 Page 11
Chapter 3
Results
2016 Lday contours
3.1 The Gatwick 2016 Lday noise contours (runway modal split 66% west / 34% east)
are shown in Figure 4. The contours are plotted from 54 to 69 dBA at 3 dB
intervals.
3.2 Estimates of the area, population and dwellings within the contours are provided
in Table 2.
Table 2 Gatwick 2016 Lday area, population and dwelling estimates
Lday (dBA) Area (km2) Population Dwellings
> 54 80.4 9,800 4,000
> 57 42.2 3,200 1,350
> 60 24.4 1,400 550
> 63 13.2 600 250
> 66 6.9 200 50
> 69 3.6 < 100 < 50
Note: Population and dwelling counts have been supplied by Defra.
2016 Levening contours
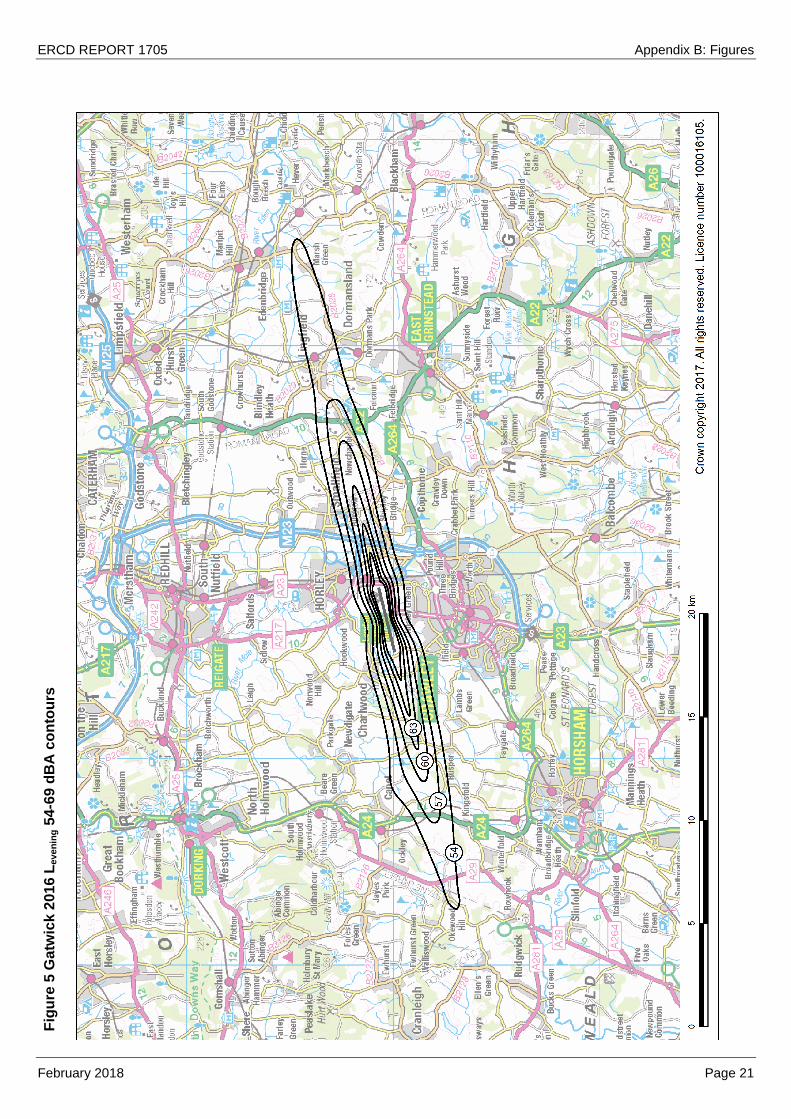
3.3 The Gatwick 2016 Levening noise contours (runway modal split 68% west / 32%
east) are shown in Figure 5. The contours are plotted from 54 to 69 dBA at 3 dB
intervals.
3.4 Estimates of the area, population and dwellings within the contours are provided
in Table 3.

ERCD REPORT 1705 Chapter 3: Results
February 2018 Page 12
Table 3 Gatwick 2016 Levening area, population and dwelling estimates
Levening (dBA) Area (km2) Population Dwellings
> 54 65.1 8,000 3,300
> 57 33.0 2,100 900
> 60 18.6 1,000 450
> 63 9.4 400 150
> 66 4.9 100 < 50
> 69 2.6 0 0
Note: Population and dwelling counts have been supplied by Defra.
2016 Lnight contours
3.5 The Gatwick 2016 Lnight noise contours (runway modal split 67% west / 33%
east) are shown in Figure 6. The contours are plotted from 48 to 66 dBA at 3 dB
intervals.
3.6 Estimates of the area, population and dwellings within the contours are provided
in Table 4.
Table 4 Gatwick 2016 Lnight area, population and dwelling estimates
Lnight (dBA) Area (km2) Population Dwellings
> 48 73.2 9,000 3,650
> 51 36.2 2,800 1,150
> 54 20.3 1,100 500
> 57 10.5 500 200
> 60 5.4 200 50
> 63 2.8 < 100 < 50
> 66 1.6 0 0
Note: Population and dwelling counts have been supplied by Defra.

ERCD REPORT 1705 Chapter 3: Results
February 2018 Page 13
2016 Lden contours
3.7 The Gatwick 2016 Lden noise contours (runway modal split 67% west / 33% east)
are shown in Figure 7. The contours are plotted from 55 to 75 dBA at 5 dB
intervals.
3.8 Estimates of the area, population and dwellings within the contours are provided
in Table 5.
Table 5 Gatwick 2016 Lden area, population and dwelling estimates
Lden (dBA) Area (km2) Population Dwellings
> 55 104.9 13,500 5,450
> 60 34.9 2,300 950
> 65 12.9 600 250
> 70 4.3 < 100 < 50
> 75 1.6 0 0
Note: Population and dwelling counts have been supplied by Defra.
2016 annual LAeq,16hr contours
3.9 The Gatwick 2016 annual LAeq,16hr noise contours (runway modal split 67% west /
33% east) are shown in Figure 8. The contours are plotted from 54 to 69 dBA at
3 dB intervals.
3.10 Estimates of the area, population and dwellings within the contours are provided
in Table 6.
Table 6 Gatwick 2016 annual LAeq,16hr area, population and dwelling estimates
LAeq,16hr (dBA) Area (km2) Population Dwellings
> 54 76.8 9,400 3,850
> 57 39.9 2,900 1,200
> 60 23.0 1,300 550
> 63 12.3 600 200
> 66 6.4 200 50
> 69 3.3 < 100 < 50
Note: Population and dwelling counts have been supplied by Defra.

ERCD REPORT 1705 Chapter 4: Conclusions
February 2018 Page 14
Chapter 4
Conclusions
5.1 Strategic noise maps for 2016 have been generated for Gatwick Airport using the
ANCON noise model.
5.2 The 2016 daily traffic total was 767.1 movements (2011: 687.9 movements).
5.3 The 2016 Lday 54 dBA contour area was 80.4 km2, enclosing a population of
9,800.
5.4 The 2016 Levening 54 dBA contour area was 65.1 km2, enclosing a population of
8,000.
5.5 The 2016 Lnight 48 dBA contour area was 73.2 km2, enclosing a population of
9,000.
5.6 The 2016 Lden 55 dBA contour area was 104.9 km2, enclosing a population of
13,500.
5.7 The 2016 annual LAeq,16hr 54 dBA contour area was 76.8 km2, enclosing a
population of 9,400.

ERCD REPORT 1705 Appendix A: References
February 2018 Page 15
APPENDIX A
References
1. Monkman D J, McMahon J, London Gatwick Strategic Noise Maps 2006, ERCD
Report 0707, December 2007.
2. Lee J, Edmonds L, Patel J, Strategic Noise Maps for Gatwick Airport 2011, ERCD
Report 1205, June 2013.
3. Ollerhead J B, Rhodes D P, Viinikainen M S, Monkman D J, Woodley A C, The UK
Civil Aircraft Noise Contour Model ANCON: Improvements in Version 2,
R&D Report 9842, June 1999.
4. European Civil Aviation Conference, Report on Standard Method of Computing Noise
Contours around Civil Airports, ECAC.CEAC Doc 29, Third edition, December 2005.
5. Civil Aviation Authority, Noise Exposure Contours for Gatwick Airport 2016, ERCD
Report 1702, November 2017.
6. Department for Environment, Food & Rural Affairs, Airport Noise Action Planning Data
Pack 2017: London Gatwick Airport (EGKK), July 2017.

ERCD REPORT 1705 Appendix B: Figures
February 2018 Page 16
APPENDIX B
Figures

ERCD REPORT 1705 Appendix B: Figures
February 2018 Page 17
Fig
ure
1 G
atw
ick A
irp
ort
an
d t
he s
urr
ou
nd
ing
are
a

ERCD REPORT 1705 Appendix B: Figures
February 2018 Page 18
Fig
ure
2 G
atw
ick A
irp
ort
la
yo
ut
in 2
01
6

ERCD REPORT 1705 Appendix B: Figures
February 2018 Page 19
Fig
ure
3 G
atw
ick N
PR
/SID
ro
ute
s

ERCD REPORT 1705 Appendix B: Figures
February 2018 Page 20
Fig
ure
4 G
atw
ick 2
01
6 L
da
y 5
4-6
9 d
BA
co
nto
urs
ERCD REPORT 1705 Appendix B: Figures
February 2018 Page 21
Fig
ure
5 G
atw
ick 2
01
6 L
eve
nin
g 5
4-6
9 d
BA
co
nto
urs

ERCD REPORT 1705 Appendix B: Figures
February 2018 Page 22
Fig
ure
6 G
atw
ick 2
01
6 L
nig
ht 48
-66 d
BA
co
nto
urs

ERCD REPORT 1705 Appendix B: Figures
February 2018 Page 23
Fig
ure
7 G
atw
ick 2
01
6 L
de
n 5
5-7
5 d
BA
co
nto
urs

ERCD REPORT 1705 Appendix B: Figures
February 2018 Page 24
Fig
ure
8 G
atw
ick 2
01
6 a
nn
ua
l L
Aeq
,16
hr 54-6
9 d
BA
co
nto
urs

ERCD REPORT 1705 Appendix C: Tables
February 2018 Page 25
APPENDIX C
Tables

ERCD REPORT 1705 Appendix C: Tables
February 2018 Page 26
Table C1 Gatwick 2016 annual average 12-hour day (Lday) movements
ANCON type Departure movements Arrival movements Total movements
B733 1.8 1.8 3.6
B736 1.9 1.8 3.7
B738 43.3 42.3 85.6
B744G 4.0 3.3 7.3
B744P 0.0 0.0 0.0
B744R 0.0 0.0 0.0
B757C 0.0 0.0 0.0
B757E 6.0 3.7 9.7
B757P 0.0 0.0 0.1
B762 0.0 0.0 0.0
B763G 2.2 2.2 4.5
B763P 0.2 0.2 0.3
B772G 7.4 5.2 12.5
B772R 1.9 2.2 4.1
B773G 0.1 0.1 0.2
B788 4.3 3.0 7.4
B789 2.3 2.0 4.3
BA46 0.0 0.0 0.1
CRJ 0.0 0.0 0.1
CRJ900 0.0 0.0 0.1
EA31 0.5 0.5 1.1
EA318 0.0 0.0 0.0
EA319C 69.1 62.6 131.8
EA319V 21.8 17.9 39.7
EA320C 65.5 56.4 121.8
EA320NEO 0.0 0.0 0.0
EA320V 23.7 16.2 39.8
EA321C 3.9 3.1 7.0
EA321V 12.9 8.9 21.8
EA33 4.4 2.7 7.1
EA34 0.1 0.1 0.1
EA346 0.0 0.0 0.1
EA359 0.2 0.0 0.2

ERCD REPORT 1705 Appendix C: Tables
February 2018 Page 27
ANCON type Departure movements Arrival movements Total movements
EA38GP 2.0 1.9 3.9
ERJ 0.1 0.0 0.1
ERJ170 0.1 0.1 0.2
ERJ190 5.7 6.1 11.8
EXE3 0.7 0.6 1.4
FK10 0.5 0.5 1.1
L4P 0.0 0.0 0.0
LTT 2.1 2.1 4.2
MD11 0.0 0.0 0.0
MD80 0.1 0.1 0.3
SP 0.0 0.0 0.0
STP 0.0 0.0 0.0
STT 0.0 0.0 0.1
Total 289.0 248.2 537.2

ERCD REPORT 1705 Appendix C: Tables
February 2018 Page 28
Table C2 Gatwick 2016 annual average 4-hour evening (Levening) movements
ANCON type Departure movements Arrival movements Total movements
B733 0.1 0.2 0.3
B736 0.1 0.3 0.4
B738 14.8 15.0 29.8
B744G 0.0 0.0 0.0
B744P 0.0 0.0 0.1
B744R 0.0 0.0 0.0
B757C 0.0 0.0 0.0
B757E 0.6 2.0 2.6
B757P 0.0 0.0 0.0
B762 0.0 0.0 0.0
B763G 0.1 0.1 0.1
B763P 0.2 0.3 0.5
B772G 0.0 0.0 0.1
B772R 0.5 0.0 0.5
B773G 0.0 0.0 0.0
B788 0.2 0.2 0.5
B789 0.0 0.0 0.1
BA46 0.0 0.0 0.0
CRJ 0.0 0.0 0.0
CRJ900 0.0 0.0 0.0
EA31 0.0 0.0 0.0
EA318 0.0 0.0 0.0
EA319C 17.0 23.5 40.5
EA319V 3.6 6.4 10.1
EA320C 14.7 19.4 34.2
EA320NEO 0.0 0.0 0.0
EA320V 4.9 9.6 14.5
EA321C 0.7 1.2 1.9
EA321V 1.2 4.5 5.7
EA33 0.2 0.2 0.5
EA34 0.0 0.0 0.0
EA346 0.0 0.0 0.0
EA359 0.0 0.0 0.0

ERCD REPORT 1705 Appendix C: Tables
February 2018 Page 29
ANCON type Departure movements Arrival movements Total movements
EA38GP 1.0 0.6 1.6
ERJ 0.0 0.1 0.1
ERJ170 0.0 0.0 0.0
ERJ190 1.8 1.7 3.5
EXE3 0.2 0.2 0.3
FK10 0.0 0.0 0.0
L4P 0.0 0.0 0.0
LTT 0.4 0.3 0.7
MD11 0.0 0.0 0.0
MD80 0.0 0.0 0.0
SP 0.0 0.0 0.0
STP 0.0 0.0 0.0
STT 0.0 0.0 0.0
Total 62.7 86.1 148.8

ERCD REPORT 1705 Appendix C: Tables
February 2018 Page 30
Table C3 Gatwick 2016 annual average 8-hour night (Lnight) movements
ANCON type Departure movements Arrival movements Total movements
B733 0.2 0.0 0.2
B736 0.2 0.2 0.4
B738 5.9 6.8 12.6
B744G 0.0 0.7 0.7
B744P 0.1 0.0 0.1
B744R 0.0 0.0 0.0
B757C 0.0 0.0 0.0
B757E 1.1 2.0 3.0
B757P 0.0 0.0 0.0
B762 0.0 0.0 0.0
B763G 0.0 0.1 0.1
B763P 0.2 0.0 0.2
B772G 0.0 2.2 2.2
B772R 0.0 0.2 0.2
B773G 0.0 0.0 0.0
B788 0.3 1.6 1.8
B789 0.0 0.3 0.3
BA46 0.0 0.0 0.0
CRJ 0.0 0.0 0.0
CRJ900 0.0 0.0 0.0
EA31 0.0 0.0 0.0
EA318 0.0 0.0 0.0
EA319C 8.4 8.3 16.7
EA319V 0.7 2.0 2.7
EA320C 9.4 14.0 23.3
EA320NEO 0.0 0.0 0.0
EA320V 1.6 4.4 6.0
EA321C 0.9 1.3 2.2
EA321V 2.2 2.9 5.1
EA33 0.1 1.8 1.9
EA34 0.0 0.0 0.0
EA346 0.0 0.0 0.0
EA359 0.0 0.2 0.2

ERCD REPORT 1705 Appendix C: Tables
February 2018 Page 31
ANCON type Departure movements Arrival movements Total movements
EA38GP 0.0 0.4 0.4
ERJ 0.0 0.0 0.1
ERJ170 0.0 0.0 0.0
ERJ190 0.3 0.0 0.3
EXE3 0.1 0.2 0.3
FK10 0.0 0.0 0.0
L4P 0.0 0.0 0.0
LTT 0.0 0.0 0.0
MD11 0.0 0.0 0.0
MD80 0.0 0.0 0.0
SP 0.0 0.0 0.0
STP 0.0 0.0 0.0
STT 0.0 0.0 0.0
Total 31.7 49.5 81.1

ERCD REPORT 1705 Appendix C: Tables
February 2018 Page 32
Table C4 Gatwick 2016 annual average 24-hour day (Lden) movements
ANCON type Departure movements Arrival movements Total movements
B733 2.0 2.0 4.0
B736 2.2 2.2 4.4
B738 63.9 64.1 128.0
B744G 4.0 4.0 8.0
B744P 0.1 0.1 0.2
B744R 0.0 0.0 0.0
B757C 0.0 0.0 0.0
B757E 7.7 7.7 15.4
B757P 0.1 0.0 0.1
B762 0.0 0.0 0.0
B763G 2.3 2.4 4.7
B763P 0.6 0.5 1.1
B772G 7.4 7.4 14.8
B772R 2.4 2.4 4.8
B773G 0.1 0.1 0.2
B788 4.8 4.9 9.7
B789 2.4 2.4 4.7
BA46 0.0 0.0 0.1
CRJ 0.1 0.1 0.1
CRJ900 0.0 0.0 0.1
EA31 0.5 0.5 1.1
EA318 0.0 0.0 0.0
EA319C 94.5 94.5 189.0
EA319V 26.2 26.3 52.5
EA320C 89.6 89.7 179.3
EA320NEO 0.0 0.0 0.0
EA320V 30.1 30.2 60.3
EA321C 5.5 5.6 11.1
EA321V 16.3 16.3 32.6
EA33 4.7 4.7 9.5
EA34 0.1 0.1 0.2
EA346 0.0 0.0 0.1
EA359 0.2 0.2 0.4

ERCD REPORT 1705 Appendix C: Tables
February 2018 Page 33
ANCON type Departure movements Arrival movements Total movements
EA38GP 3.0 2.8 5.8
ERJ 0.1 0.1 0.3
ERJ170 0.1 0.1 0.3
ERJ190 7.8 7.8 15.7
EXE3 1.0 1.0 1.9
FK10 0.6 0.6 1.1
L4P 0.0 0.0 0.0
LTT 2.5 2.5 5.0
MD11 0.0 0.0 0.0
MD80 0.1 0.1 0.3
SP 0.0 0.0 0.0
STP 0.0 0.0 0.0
STT 0.1 0.1 0.2
Total 383.3 383.8 767.1

ERCD REPORT 1705 Appendix C: Tables
February 2018 Page 34
Table C5 Gatwick 2016 annual average 16-hour day (LAeq,16hr) movements
ANCON type Departure movements Arrival movements Total movements
B733 1.8 2.0 3.8
B736 2.0 2.0 4.0
B738 58.0 57.4 115.4
B744G 4.0 3.4 7.4
B744P 0.0 0.1 0.1
B744R 0.0 0.0 0.0
B757C 0.0 0.0 0.0
B757E 6.6 5.7 12.3
B757P 0.1 0.0 0.1
B762 0.0 0.0 0.0
B763G 2.3 2.3 4.6
B763P 0.4 0.5 0.9
B772G 7.4 5.2 12.6
B772R 2.4 2.2 4.6
B773G 0.1 0.1 0.2
B788 4.6 3.3 7.9
B789 2.4 2.1 4.4
BA46 0.0 0.0 0.1
CRJ 0.0 0.1 0.1
CRJ900 0.0 0.0 0.1
EA31 0.5 0.5 1.1
EA318 0.0 0.0 0.0
EA319C 86.1 86.2 172.3
EA319V 25.5 24.3 49.8
EA320C 80.2 75.8 156.0
EA320NEO 0.0 0.0 0.0
EA320V 28.6 25.8 54.3
EA321C 4.6 4.3 8.9
EA321V 14.1 13.5 27.5
EA33 4.7 2.9 7.6
EA34 0.1 0.1 0.1
EA346 0.0 0.0 0.1
EA359 0.2 0.0 0.2

ERCD REPORT 1705 Appendix C: Tables
February 2018 Page 35
ANCON type Departure movements Arrival movements Total movements
EA38GP 3.0 2.4 5.4
ERJ 0.1 0.1 0.2
ERJ170 0.1 0.1 0.2
ERJ190 7.5 7.8 15.3
EXE3 0.9 0.8 1.7
FK10 0.6 0.6 1.1
L4P 0.0 0.0 0.0
LTT 2.5 2.5 4.9
MD11 0.0 0.0 0.0
MD80 0.1 0.1 0.3
SP 0.0 0.0 0.0
STP 0.0 0.0 0.0
STT 0.0 0.1 0.1
Total 351.6 334.3 685.9

ERCD REPORT 1705 Appendix D: ANCON type descriptions
February 2018 Page 36
APPENDIX D
ANCON type descriptions

ERCD REPORT 1705 Appendix D: ANCON type descriptions
February 2018 Page 37
Table D1 ANCON type descriptions
ANCON type Description
B717 Boeing 717
B727 Boeing 727 (Chapter 2&3)
B732 Boeing 737-200 (Chapter 2&3)
B733 Boeing 737-300/400/500
B736 Boeing 737-600/700
B738 Boeing 737-800/900
B747 Boeing 747-100 & 200/300 series (certificated to Chapter 3)
B744G Boeing 747-400 with General Electric CF6-80F engines
B744P Boeing 747-400 with Pratt & Whitney PW4000 engines
B744R Boeing 747-400 with Rolls-Royce RB211 engines
B747SP Boeing 747SP
B748 Boeing 747-8
B753 Boeing 757-300
B757C Boeing 757-200 with Rolls-Royce RB211-535C engines
B757E Boeing 757-200 with Rolls-Royce RB211-535E4/E4B engines
B757P Boeing 757-200 with Pratt & Whitney PW2037/2040 engines
B762 Boeing 767-200
B763G Boeing 767-300 with General Electric CF6-80 engines
B763P Boeing 767-300 with Pratt & Whitney PW4000 engines
B763R Boeing 767-300 with Rolls-Royce RB211 engines
B764 Boeing 767-400
B772G Boeing 777-200 with General Electric GE90 engines
B772P Boeing 777-200 with Pratt & Whitney PW4000 engines
B772R Boeing 777-200 with Rolls-Royce Trent 800 engines
B773G Boeing 777-200LR/300ER with General Electric GE90 engines
B773P Boeing 777-300 with Pratt & Whitney PW4000 engines
B773R Boeing 777-300 with Rolls-Royce Trent 800 engines
B788 Boeing 787-8
B789 Boeing 787-9
BA46 BAe 146/Avro RJ series
CRJ Bombardier CRJ100/200 series
CRJ700 Bombardier CRJ700 series
CRJ900 Bombardier CRJ900

ERCD REPORT 1705 Appendix D: ANCON type descriptions
February 2018 Page 38
ANCON type Description
DC87 McDonnell Douglas DC-8-70 series
DC10 McDonnell Douglas DC-10
EA30 Airbus A300
EA31 Airbus A310
EA318 Airbus A318
EA319C Airbus A319 with CFM56 engines
EA319V Airbus A319 with IAE V2500 engines
EA320C Airbus A320 with CFM56 engines
EA320V Airbus A320 with IAE V2500 engines
EA321C Airbus A321 with CFM56 engines
EA321V Airbus A321 with IAE V2500 engines
EA33 Airbus A330
EA34 Airbus A340-200/300
EA346 Airbus A340-500/600
EA359 Airbus A350-900
EA38GP Airbus A380 with Engine Alliance GP7000 engines
EA38R Airbus A380 with Rolls-Royce Trent 900 engines
ERJ Embraer ERJ 135/145
ERJ170 Embraer E-170
ERJ190 Embraer E-190
EXE2 Chapter 2 executive jets
EXE3 Chapter 3 executive jets
FK10 Fokker 70/100
L101 Lockheed L-1011 TriStar
L4P Large four-engine propeller
LTT Large twin-turboprop
MD11 McDonnell Douglas MD-11
MD80 McDonnell Douglas MD-80 series
SP Single piston
STP Small twin-piston
STT Small twin-turboprop
TU54 Tupolev Tu-154

ERCD REPORT 1705 Glossary
February 2018 Page 39
Glossary
Glossary
AIP Aeronautical Information Publication
ANCON The UK civil aircraft noise contour model, developed and maintained by ERCD.
CAA Civil Aviation Authority
dB Decibel units describing sound level or changes of sound level.
dBA Units of sound level on the A-weighted scale, which incorporates a frequency weighting
approximating the characteristics of human hearing.
Defra Department for Environment, Food and Rural Affairs
DfT Department for Transport (UK Government)
ERCD Environmental Research and Consultancy Department
LAeq,16hr Equivalent sound level of aircraft noise in dBA for the 16-hour day (0700-2300 local time)
period. In this study, the annual average 16-hour day is modelled.
Lday Equivalent sound level of aircraft noise in dBA for the 12-hour annual average day (0700-
1900 local time) period.
Lden Equivalent sound level of aircraft noise in dBA for the 24-hour annual average period with
5 dB weightings for Levening and 10 dB weightings for Lnight.
Leq Equivalent sound level of aircraft noise in dBA, often called ‘equivalent continuous sound
level’.
Levening Equivalent sound level of aircraft noise in dBA for the 4-hour annual average evening
(1900-2300 local time) period.
Lnight Equivalent sound level of aircraft noise in dBA for the 8-hour annual average night (2300-
0700 local time) period.
NPR Noise Preferential Route
NTK Noise and Track Keeping monitoring system
SID Standard Instrument Departure