STRATEGIC HUMAN RESOURCE MANAGEMENT … HUMAN RESOURCE MANAGEMENT AND FIRM ... CHAPTER 3: WHY STUDY...
124
STRATEGIC HUMAN RESOURCE MANAGEMENT AND FIRM PERFORMANCE: WHAT CAN WE LEARN FROM SMALL BUSINESSES? A Dissertation Presented to the Faculty of the Graduate School Of Cornell University In Partial Fulfillment of the Requirements for the Degree of Doctor of Philosophy by Mathew Ray Allen August 2006
Transcript of STRATEGIC HUMAN RESOURCE MANAGEMENT … HUMAN RESOURCE MANAGEMENT AND FIRM ... CHAPTER 3: WHY STUDY...

STRATEGIC HUMAN RESOURCE MANAGEMENT AND FIRM
PERFORMANCE: WHAT CAN WE LEARN FROM SMALL BUSINESSES?
A Dissertation
Presented to the Faculty of the Graduate School
Of Cornell University
In Partial Fulfillment of the Requirements for the Degree of
Doctor of Philosophy
by
Mathew Ray Allen
August 2006

© 2006 Mathew Ray Allen

STRATEGIC HUMAN RESOURCE MANAGEMENT AND FIRM
PERFORMANCE: WHAT CAN WE LEARN FROM SMALL BUSINESSES?
Mathew R. Allen, Ph.D.
Cornell University 2006
This study develops a theory of how human resource management systems
contribute to the performance of small businesses. Based on theories from the field of
strategic human resource management and small business performance, I argue that
high involvement human resource management systems will be positively related to
the performance of small businesses above and beyond known drivers of small
business performance. A set of moderating variables for this relationship is also
presented. I conclude by outlining a set of hypotheses and methods for testing the
relationship between human resource management and performance in small
businesses.
iii
BIOGRAPHICAL SKETCH
Mathew Ray Allen was raised in Kaysville Utah by Ray and Pat Allen along
with three brothers and one sister. After graduation from high school Matt completed
a two year mission in Chile for the Church of Jesus Christ of Latter Day Saints. Matt
earned a B.S. in Accounting from the University of Utah and worked for his father’s
accounting firm, Ray H. Allen and Associates, before pursuing a Master of Business
Administration degree from the University of Notre Dame. After working for two
years at both IBM and Hewlett Packard, Matt returned to Cornell to pursue a PhD.
Matt and his wife Heather are the parents of three children, McKenzie, Megan and
Noah. Matt has recently accepted a position at Northeastern University as an
Assistant Professor of Entrepreneurship in the College of Business Administration.

iv
This dissertation and everything that it represents are dedicated to my wife Heather

v
ACKNOWLEDGEMENTS
I would like to express my appreciation to Dr. Christopher Collins, my
dissertation chair, for his patience and unwavering willingness to provide direction
and support throughout this process in spite of my weaknesses. I would also like to
express thanks to the members of my dissertation committee, Drs. Tove Hammer,
Martin Wells and Patrick Wright, for their time and constructive feedback.
Specifically I would like to thank Dr. Patrick Wright for his willingness to involve me
in the research process early on in my program, an opportunity which has proved to be
of great value to me.
I would also like to thank my parents, Ray and Pat Allen for helping me to
become the person that I am today and for providing me with an example to follow
and love and support through the process.
Last, but certainly not least, I would like to thank my family for their willingness to
give up a portion of their lives so that I could complete this degree. I am grateful to
McKenzie for her tender heart and enthusiasm for life, to Megan for her curiosity and
determination and to Noah for his energy and the smiles that seem to follow him
wherever he goes. Most of all I would like to thank my wife Heather for her
unending support and love. Without her, this degree would never have been possible.
She has stood by my side through almost twelve years of marriage and as many moves
and has given up more that I would like to admit as I have painfully discovered my
own career and life’s ambitions. She, more than anyone, deserves the recognition and
credit for this accomplishment and all that it represents.
vi
TABLE OF CONTENTS
CHAPTER 1: INTRODUCTION 1
CHAPTER 2: LITERATURE REVIEW 5
Strategic Human Resource Management 5
SHRM and The Resource Based View 7
Measurement and HRM 10
Additional Issues in Testing Relationships between
HRM and Performance 15
SHRM and Causation 18
CHAPTER 3: WHY STUDY HRM IN SMALL BUSINESSES 22
Extension of HRM Research to Small Businesses 23
Small Businesses and Levels of Analysis 23
Small Businesses and Proper Controls 24
Small Businesses and Contextual Issues 26
CHAPTER 4: HRM AND SMALL BUSINESS PERFORMANCE 28
Importance of HRM in Small Businesses 28
Small Businesses and High Involvement Work Systems 31
Small Businesses and Performance 34
Individual Characteristics 37
Organizational Characteristics 38
Environmental Characteristics 40
CHAPTER 5: MODERATION OF HRM IN SMALL BUSINESSES 43
Moderating Effects of Individual Characteristics 44
Moderating Effects of Organizational Characteristics 45

vii
Moderating Effects of Environmental Characteristics 47
Moderating Effects of Firm Size 48
CHAPTER 6: METHODS 50
Research Overview 50
Measures 53
CHAPTER 7: RESULTS 66
CHAPTER 8: DISCUSSION 83
Summary of Findings and Implications 83
Study Limitations and Future Research 90
Conclusion 93
APPENDIX A 95
APPENDIX B 99
REFERENCES 108

viii
LIST OF FIGURES
Page
Figure 1. Levels of HR Measurement 11
Figure 2. Basic model of the HRM to performance Relationship 14
Figure 3. Size Distribution of Organizations 52
Figure 4. Industry Representation of Organizations 52
Figure 5. High Involvement Work Systems and Business Level
Strategy Interactions 80
Figure 6. High Involvement Work Systems and Environment
Interactions 81
Figure 7. High Involvement Work Systems and Size Interactions 82
Figure 8. R2 Comparisons 86
ix
LIST OF TABLES
Page
Table 1. Factor Loadings for the Four-Factor HIWS Model N= 270 55
Table 2. Employee Perceptual Performance Measure 60
Table 3. Means and Standard Deviations 67
Table 4. Pairwise Correlations 68
Table 5. Results of Regression for HIWS, Small Business
Performance Drivers and Voluntary Turnover 69
Table 6. Results of Regression for HIWS , Small Business
Performance Drivers and Perceptual Operational Performance 70
Table 7. Results of Regression for HIWS , Small Business
Performance Drivers and Employee Perceptual Performance 71
Table 8. Results of Regression for HIWS , Small Business
Performance Drivers and Perceptual Financial Performance 72
Table 9. Results of Regression for HIWS , Small Business
Performance Drivers and Commercial Credit Score 73
Table 10. Confidence Intervals for Effect Size Changes 77

1
CHAPTER 1:
INTRODUCTION
Small businesses, defined by the U.S. Small Business Administration as
independent U.S. businesses with less than 500 employees, play an important role in
our economy. It is estimated that there are over 23 million small businesses in the
U.S. making up over 99% of all U.S. businesses. In addition, these small businesses
employ 50% of all private sector employees and have accounted for between 60% and
80% of all job growth in the U.S. over the last 10 years (US SBA). Given the
importance of small businesses to our economy, it is important for researchers to
understand what tools small businesses can leverage to improve their performance and
increases their chances of survival.
Employees and employee management practices appear to be one way that
companies are able to improve their performance. Strategic human resource
management scholars have argued that an organization’s success is at least partially
dependent on its employees and their behaviors in carrying out the strategies of the
business (Becker & Gerhart, 1996; Delery & Doty, 1996; Wright & McMahan, 1992;
Dyer, 1984). Organizations that can effectively influence the behaviors and
motivation of their employees through human resource management systems will be
able to increase their performance and viability (Huselid, 1995). Small firms should
also be able to leverage their employees through human resource management to
improve their performance, but very little research has addressed the role of human
resource management in small businesses. In this paper I will address the relationship
between human resource management (HRM) and the performance of small
businesses and explore the benefits that the context of small businesses provides for
the study of strategic human resource management (SHRM).

2
A significant amount of research has been conducted examining the
relationship between human resource management and firm performance. In a recent
review of the literature, Wright et al., (2005) found a total of 68 empirical studies
looking at the relationship between HRM and some aspect of firm performance. The
review focused specifically on published, empirical studies testing a relationship
between an HRM system and performance. Notably, all of the reviewed studies
reported at least one significant relationship between HR systems and performance.
Clearly from this review of the literature, there is an increasing agreement that a
relationship does exist between HRM and firm performance. In spite of this
agreement, however, there is still disagreement about the nature of this relationship
(Wright et al., 2005; Becker & Gerhart, 1996).
While it is clear that past research on SHRM has consistently shown a positive
relationship between various conceptualizations of HRM and firm performance
(Wright et al., 2005), this research has focused almost exclusively on large
multidivisional, multi-product, multinational corporations. Very little research has
examined the generalizability of these findings to small businesses and our current
understanding of the role that HRM plays in small businesses is limited (Cardon &
Stevens, 2004). By testing the relationship between HRM and firm performance in
small businesses, my study expands our understanding of SHRM into a new context.
In addition to providing a new arena in which to test the relationship between
HRM and firm performance, the context of small businesses also provides the
opportunity to more thoroughly test this relationship. Despite the growing body of
research on the relationship between HRM and firm performance, several questions
still exist around variable measurement, research design, and the role of contingencies
in SHRM research. In spite of the success of this research in demonstrating a
relationship between HRM and performance past research has not sufficiently made

3
the argument for HRM causing performance (Wright et al., 2005). Specifically past
research has had difficulty controlling for or otherwise ruling out possible alternative
drivers of performance. Many of these questions are driven by the complexity in both
the relationship itself as well as the context of large organizations typically used to
study this relationship (Becker & Gerhart, 1996).
SHRM research in large organizations involves dealing with multiple
complexities making it difficult to measure and control for alternative drivers of
performance such as the human capital of the top manager or the environment in
which the firm operates (Blau & Schoenherr, 1971). By their very nature, large firms
are extremely complex and present many research difficulties such as multiple levels,
multiple products, complex strategies, and operations spread across multiple
geographies to name just a few. Small businesses have none of these complexities
and present a context in which the measurement of HRM as well as alternative drivers
of performance for control purposes is not hindered by complexity. Thus, studying the
effects of HRM in small businesses allows me to more directly look at the relationship
between HRM and firm performance and understand whether HRM contributes to the
performance of small businesses. Second, and possibly as important, studying the
relationship in the context of small businesses enables me to understand the effects of
HRM on firm performance above and beyond other known drivers of performance.
Finally, studying the relationship between HRM and performance also allows
me to test potential moderating effects of these other known drivers of performance in
small businesses. Delery & Doty, (1996) argued that it was likely that the effect of
HRM on performance was contingent on the existence of another variable or variables
such as strategy (Youndt, Snell, Dean & Lepak, 1996; Delery & Doty, 1996).
Understanding these contingency relationships will help us to understand when and
under what conditions HRM might be more or less instrumental in contributing to the

4
performance of the firm. Therefore, I make an additional significant contribution to
the field by testing contingency relationships between known performance drivers in
small businesses and the HRM to performance relationship leading to a broader
understanding of the conditions under which HRM might lead to performance.
The purpose of this research then is threefold. First, to understand if human
resource management contributes to the performance of small businesses; second, to
explore and take advantage of the benefits related to using small firms as a context for
studying the HRM to performance relationship; and third, to use the reduced
complexity provided by the small business context to test for various contingencies in
the HRM to performance relationship.

5
CHAPTER 2:
LITERATURE REVIEW
Strategic Human Resource Management
Wright and McMahan (1992) defined strategic human resource management as
“the pattern of planned human resource deployments and activities intended to enable
the firm to achieve its goals” (1992, p. 298). There are two assumptions implied in
this definition. First, organizations are able to impact firm level outcomes through
their human resource management and second, it is the combination or system of
HRM activities working in concert rather than single practices that defines the ability
of HRM to impact the firm at a strategic level.
Although there has been some criticism, past and emerging research in SHRM
indicates that human resource management does indeed have an impact on firm as
well as other levels of outcomes. An increasing number of studies have found
significant relationships between various measures of human resource management
and performance. Measures of HRM that have been used in these studies include:
high performance and high involvement work systems (Huselid, 1995; Batt, 2002;
Arthur 1994), HR orientation (Snell & Youndt, 1995; Welbourne & Cyr, 1999), Work
life balance: (Perry-Smith & Blum, 2000; Konrad & Mangel, 2000) and single HR
practices: (Shaw, Gupta, & Delery, 2002; Gerhart & Milkovich, 1990). Global
competition, technological advances, shortening of the business cycle as well as the
shift from a manufacturing to a knowledge based economy have all influenced the
business community in its search for sources of sustained competitive advantage (Dyer
& Reeves, 1995). These changes put pressure on organizations to find new sources of
competitive advantage. Employees and the systems of practices that are set up to

6
manage them are increasingly seen as a source of this competitive advantage (Wright,
Dunford, & Snell, 2001).
Historically, the field of human resource management has been concerned with
the study of specific HR functional areas often categorized as selection, training,
appraisal and compensation by the field of industrial and organizational psychology
(Boxall & Purcell 2001). Past research involved the study of these specific HR
functional areas as means and ends within themselves. For example, training was
studied in isolation from other functions with an emphasis on the inputs processes and
outputs or outcomes specific to the training function. Not much research attention was
given to how training might work in combination with other HRM functions such as
compensation or selection or how individual level HR functions might impact firm
level performance.
This focus on specific HR functional areas led to knowledge about specific HR
functions evolving in isolation from each other without much coordination between
different functional areas (Wright & McManan, 1992). The rise of the concept of
strategy and strategic management (Miles & Snow, 1984, Porter, 1985) created an
increased interest in how firms can position themselves strategically to compete. This
was followed closely by an increased interest in how HRM might contribute to that
process (Wright & McManan, 1992).
Initial studies addressing HRM and its relationship to business strategies
continued to focus on specific HRM functional areas such as compensation and its
individual impact on the accomplishment of business strategy. The findings from
these initial studies suggested that HRM functions such as training or compensation
could be aligned with firm strategy and proper alignment between these individual
HRM functional areas and strategy contributed to sustainable competitive advantage
(Schuler & Jackson, 1987; Miles & Snow, 1984). Russel, Terborg, and Powers (1985)
7
for example, examined human resource training at an organizational level and linked
training to organizational performance. While this research addressed the issue of
individual HR practices and performance as well as aligning specific HR practices
with strategy, it did not address the alignment of individual HR practices with each
other or the impact of the entire HRM system on firm performance.
With the advent of more internally focused strategic theories such as the
resource based view (RBV), the practice of linking separate HR functions to the firm
strategy evolved into a more integrated view of how HRM as a system impacted firm
level strategies which in turn impact performance. SHRM became more a question of
how bundles of HRM practices or philosophies and the HR function as a whole
contributed to the accomplishment of firm strategies at a system level. This opened
the door for research seeking to understand the strategic nature of human resources
and human resource systems (Wright, Dunford & Snell, 2001).
SHRM and the Resource Based View
Although multiple theories have been used to explain the relationship between
HRM and performance outcomes (Wright & McMahan, 1992), the predominant
theory currently used by researchers studying SHRM is the resource based view
(Wright, Dunford, & Snell, 2001; Delery, 1998). The resource based view proposes
that competitive advantage comes from the internal resources that it possessed by an
organization (Wernerfelt, 1984; Barney, 1991). The idea that internal resources of a
firm can lead to competitive advantage was a significant departure from previous
views of strategy which focused on the external environment and such factors as
industry, customers, and competitors (Miles and Snow 1984; Porter 1985). The RBV
provided a theoretical explanation of how the human resources of a firm could in fact
contribute to performance and competitive advantage.

8
Though others had addressed the concept of the RBV previously, Barney
(1991) solidified its application to SHRM research by outlining how firm resources
contribute to the sustained competitive advantage of the firm. Resources that are
valuable, rare, inimitable and non-substitutable will lead to competitive advantage. To
the extent that the human resources within a firm meet these criteria, they will
contribute to the competitive advantage of the firm by providing the firm with a
valuable resource not easily replicated by competitors.
This raises the question as to which aspect of the human resources within a
firm constitutes a resource. Wright, McMahan, and McWilliams (1994) argued that it
is the actual human resources or human capital of a firm that constitute the resource
leading to competitive advantage. From their view, HR practices or HR systems could
easily be duplicated (imitated) by other firms and only the knowledge skills and
abilities possessed by individuals within a firm would meet the criteria outlined by
Barney (1991). Lado and Wilson (1994) on the other hand took an alternative point of
view arguing that HR practices combined into an overall HR system can be unique
and difficult to imitate and constitute a resource meeting the conditions necessary for
sustained competitive advantage. While both views seem to be accepted in the
literature, most SHRM researchers using RBV as its theoretical framework have
focused on the HR system or overarching HR philosophy as a resource functioning to
develop the human capital of the firm (Boxall, 1998).
In addressing the criticisms of Wright, McMahan and McWilliams (1994) that
HRM practices or systems could be easily duplicated by competitors and thus could
not be a source of sustained competitive advantage, Becker and Gerhart (1996)
outlined two different reasons why HR systems of successful firms could not be easily
duplicated. First, causal ambiguity implies that the exact manner in which human
resource management contributes to the competitive advantage of the firm is either

9
unknown or sufficiently ambiguous so as to be difficult or impossible to imitate.
According to Becker and Gerhart (1996), the ability to replicate a successful HR
system would require an understanding of how all of the elements of this complex
system interact, an understanding which is still elusive to HR researchers and
practitioners alike.
Second, the path dependency of HR systems makes their understanding and
replication extremely difficult if not impossible. HR systems are developed over time.
Take for example a single HR practice such as the use of a variable pay system for
management compensation. The development and implementation of this single HR
practice takes place over time including time to solicit management input and buy-in,
work out discrepancies, and align the practice with current strategies as well as firm
culture and needs. The end result would be a practice that reflects the philosophies
and culture of the firm and its management created to solve the specific needs of the
organization. Compound that single HR practice with a whole system of practices
each with its own history and evolution specific to a particular firm, its philosophies
and current situation and you have an HR system that cannot be bought or easily
replicated without a significant investment both of time and financial resources.
The RBV with its focus on the internal resources possessed by a firm has given
the field a theoretical understanding of why human resource systems might lead to
sustained competitive advantage. The application of the RBV in SHRM research has
allowed the SHRM field to move away from individual HR functional areas and
practices to focus more on the HR system and how this system of HR practices or
philosophies contributes to competitive advantage. This in turn has opened the door
for further development of the field by answering questions about HRM and firm
performance such as whether the relationship between HRM and performance is
causal and if so, by what mechanisms does HR lead to performance or what variables
10
might moderate that relationship? These questions built around the RBV are questions
that the field of SHRM is currently attempting to address.
Measurement and SHRM
In order to understand the relationship between HRM and sustained
competitive advantage or performance, a brief discussion of measurement is
necessary. While a complete discussion of measurement in SHRM is beyond the
scope of this paper, I will identify the general frameworks that have been used to
measure HRM and performance variables and the key measurement issues that have
limited our understanding of the relationship between HRM and competitive
advantage or performance. For a more thorough discussion of measurement issues
see Rogers and Wright (1998).
Measurement of HRM. Following Lado and Wilson (1994), I argue that it is
the HR system made up of practices, policies, and philosophies that constitute a
resource for the firm. This view is consistent with prior research addressing the
relationship between HRM and performance (Rogers & Wright, 1998). The HRM
system facilitates the acquisition, development and motivation of human capital and
when combined within the complex firm environment creates unique resource for the
firm (Wright, Dunford & Snell, 2001). A recent review of the literature found that of
some 73 studies empirically testing the relationship between HRM and organizational
outcomes, all of these studies employed some measure of the HRM system as the
independent variable as opposed to using direct measures of human capital (Wright,
Gardnern, Moynihan & Allen, 2005).
In spite of the apparent agreement among researchers that measures of the
HRM system represent the resource that potentially leads to competitive advantage,
there are several different levels at which the HRM system is measured. Becker and
Gerhart (1996) outlined these different levels as the practice level, the policy level and

11
the architecture level (see figure 1). They further argued that measurement of HRM at
these different levels has different implications from a research standpoint.
The practice level is the most detailed level of HRM system measurement and
deals with the measurement of very specific HR practices such as the use of
standardized interview questions for recruiting. Because of its detail this level of
measurement is the least generalizable across different contexts. The use of specific
HR practices might differ greatly across different organizational variables such as size,
age, industry etc.
The next level at which the HRM system can be measured is the policy level.
This level is defined by Becker and Gerhart (1996) as the measurement of bundles of
specific practices into more broad policies. An example might be a set of selection
HR
Architecture
HR
Policies
HR
Practices
Guiding
Principles
Values or
Philosophies
Universial
Generalizable
Figure 1: Levels of HR measurement (Becker & Gerhart, 1996)

12
practices whose intended purpose was to select employees with high knowledge or
skills. While this level is less specific than the practice level, it is still directly related
to specific practices and thus lacks some generalizability especially in diverse data
sets.
The highest level at which the HR system can be measured is at the
architecture level. This level refers to the measurement of guiding principles, values
or philosophies related to HRM within a firm. These values or philosophies while
differing from firm to firm are considered to be more universal and thus more
generalizable than the other two. Theoretically, practices and policies are driven by
HRM philosophies. An example of measurement at this level might be the existence
of a general philosophy of hiring employees who fit well with the culture of the
organization. This level of measurement would be most appropriate in situations
where a high degree of generalizability is needed such as looking at HRM across a
diverse set of companies. For the purposes of this research, I will focus on this
architecture or philosophy view of HRM as opposed to specific HRM practices or
policies. Small businesses differ greatly by size, industry, age, goals etc. Thus, it is
important when measuring HRM in small businesses to chose a level for measurement
that is generalizable across this diverse set of companies.
In addition small businesses tend to vary greatly in the level of sophistication
of the HR system and often do not have an HR department or dedicated HR employee
(Hornsby & Kuratko, 1990). Given this fact, I would not expect all small businesses
to understand specific HR practices in the same way as might be the case in a sample
of larger organizations. For example, a small business with only 8 employees may not
have a formalized selection system in that they are using specific and documented
practices to select employees. However, the fact that formalized practices do not exist
does not mean that that firm does not need to or is not able to select employees. In
13
this case an understanding of the general philosophy around hiring would be more
beneficial in understanding the HRM system than knowing whether or not the
business has specific practices.
Measurement of Performance. Measurement of the dependent variable,
competitive advantage or sustained competitive advantage is most often through
performance outcomes. A look at the general SHRM model is helpful in
understanding what these performance outcomes might be. While there are multiple
views on what the SHRM model looks like, most follow the general outline presented
by Dyer (1984), (see figure 2). In this outline, HRM impacts the firm at different
levels starting with its direct impact on employees referred to as HR impact. Measures
at this level would include such items as job satisfaction, employee helping behaviors
employee discretionary behaviors or employee turnover. The next level of impact
would be at the operational level. The operational level is one step away from the HR
level in that it is not directly impacted by HR systems, but rather the systems impact
the people who in turn impact the operations. Measures at this level would include:
output levels, quality, speed, labor productivity, customer service and others. Finally
operational impacts are followed by financial outcomes. HR impacts the employees
which in turn impact the operations which would then in turn impact financial
performance. This level can be measured through profit, revenues, sales or even more
distal market measures of firm performance as market reacts to the signals given by
operational and financial results which in turn would impact stock price or other
market based measures of performance.

14
Figure 2: Basic model of the HRM to performance Relationship based on Dyer, 1984
As can be seen from the discussion above, the impacts of HR on performance
proposed by Dyer (1984) get progressively further from the actual HR function. HRM
first impacts HR or personnel outcomes which in turn impact operational outcomes
followed by financial and market level outcomes with these latter measures being
removed from the actual HR practices by several levels. Although the most direct
effect of HR practices on performance would be at the HR level, because of the
strategic interest as well as difficulty in measurement, most of the research has
focused on the financial and market levels of performance (Rogers & Wright, 1998,
Dyer & Reeves, 1995). This complexity in measuring the HR impact to performance
is especially apparent in large organizations where the distance between HR systems
and financial measures of performance is greater creating questions around
appropriate levels of analysis. In addition, increased complexity makes understanding
the relationship much more difficult. Because of this complexity, researchers should
Human
Resource
Management
Employee
Outcomes
Operational
Outcomes
Firm Level
Outcomes

15
focus on contexts where the distance between the HRM system and performance is
shorter and levels of complexity are reduced such as smaller business units of large
organizations, departments within larger organizations or small businesses.
Additional Issues in Testing Relationships between HRM and Performance
In spite of the increased attention on HRM and its performance implications,
there is no consensus on the best way to measure HRM or competitive advantage
(Becker & Gerhart, 1996; Rogers & Wright, 1998). In addition, the complexity of
large organizations makes meaningful measurement of these variables difficult.
Imagine at one extreme a firm level measurement of both HRM and performance from
a large organization. Regardless of any relationship that is discovered, it is difficult to
imagine that those firm level measures have accounted for differences in product lines,
geographies, leadership and other variations within that organization from both an
HRM standpoint as well as performance.
In addition, the relationship itself is complex by nature. Even in the simplified
model of the HRM to performance relationship outlined by Dyer (1984) a significant
amount of complexity remains in understanding this relationship and factors,
contextual and otherwise that might influence it. This complexity is only compounded
when addressed in a large organization where the distance between the different pieces
of the relationship can be quite large.
Levels of analysis. One dimension of measurement and design that has
received a significant amount of attention in the SHRM literature is that of levels of
analysis. The level of analysis refers to the place or level within the organization at
which the measurements are taken. Questions about the appropriate level of analysis
have been applied to both the independent variable of HR practices as well as the
dependent performance variable. Most large organizations consist of multiple levels
16
of management and employees. In addition, multiple products, geographies, divisions,
and industries add to the complexity within those levels.
The question of which level to use for measurement has a theoretical,
methodological and practical component. From a theoretical standpoint the question
derives from the fact that business strategies can exist at several levels. According to
Schendel and Hofer (1979) strategy occurs on at least three levels within a firm:
corporate, business and functional. Given these differing levels of strategy, it can be
assumed that HRM systems might differ between these levels raising questions about
how they contribute to firm performance at different levels within the firm. From a
methodological standpoint, different levels of analysis raise questions about balancing
accessibility of data with the intent of the research as well as questions regarding the
mixing of data from different levels of the firm such as HR practices measured at the
corporate level and performance measures taken from the business or functional level
and the implications of such research practices (Rogers & Wright 1998, Becker &
Gerhart, 1996). Finally, the levels of analysis discussion has a practical or applied
element in that research done at different levels of the firm can have different
implications for the practical application of said research. For example, firm level
findings indicating that a certain HRM system or philosophy is positively correlated
with firm performance does not necessarily mean that the implementation of the same
HR system at a functional level will lead to increased performance (Becker & Gerhart,
1996).
Becker and Gerhart (1996) argue that in spite of reduced generalizability,
studies that look at the HRM to performance relationship in contexts with reduced
complexity such as the business unit level will contribute to the understanding of the
relationship because the smaller size of the business units compared to parent
organizations reduces much of the complexity driven by levels of analysis. Future

17
research should focus on contexts like business units that reduce the complexity
caused by multiple levels of analysis in order to gain a clearer understanding of how
HRM impacts performance. Small businesses, for example, offer a context that
reduces much if not all of the complexity caused by differing levels of analysis. In the
case of small businesses, the corporate and business unit levels are often one and the
same.
Complexity of the Relationship. Another issue in testing the relationship
between HRM and firm performance involves the complexity of the relationship
between HRM and performance. Performance is a difficult concept to understand and
involves multiple drivers and complex relationships. It is likely that the relationship
between HRM and performance is influenced by many other factors.
Researchers should focus on understanding when HRM contributes to
performance or under what conditions HRM might contribute more or less to the
performance of a firm. Contingency or moderation models argue that the relationship
is likely contingent on various other variables and situations (Delery & Doty, 1996).
Some research has studied variables that might moderate the relationship between
HRM and performance with strategy being the most common contingency tested
(Wai-Kwong, Priem & Cycyota, 2001; Veliyath & Shortell, 1993). Further research is
needed. Additional moderators such as manager attributes or environmental factors
are likely contributing to the complexity of the relationship. Difficulty in measuring
some of these key performance variables has made understanding their moderating
effects on HRM complicated. It is important for researchers to include these potential
moderating variables in HRM research. Contingency effects of these other drivers of
performance on the HRM to performance relationship should be tested to further our
understanding of the relationship between HRM and performance. Knowledge about
how HRM interacts with other performance drivers will help us answer contextual

18
questions about HRM and performance such as: under what conditions will HRM
matter more or less?
Measurement issues, research design issues and problems dealing with
complexity have hindered our ability to completely understand the relationship
between HRM and performance. Specifically, complexity in the context being studied
as well as complexity in the relationship being studied makes proper measurement and
research design in HRM to performance research difficult. By using a less complex
context such as small businesses, researchers can eliminate much of the complexity
inherent in large organizations. This will allow for more meaningful measures for use
in gaining a better understanding of the direct relationship between HRM and
performance as well as potential moderating relationships.
HRM and Causation
The measurement and design difficulties mentioned above combine to hinder
our efforts as a field to infer cause in the HRM to performance relationship. SHRM
researchers are operating on the assumption that HRM leads to or causes performance
outcomes, however, a review of the research indicates that current findings are
insufficient to make this assumption (Wright et al., 2005). Cook and Campbell (1979)
present three criteria which must be met in order to infer cause: covariation between
the cause and effect variables, temporal precedence of the cause, and ruling out
alternative explanations of cause. Because previous research has not addressed each
of these three criteria, researchers’ assertions that HR practices lead to performance
outcomes have been weakened. In a recent paper Wright et al., (2005) examined the
issue of cause in the SHRM literature and concludes that the majority of the research
in the field up to this point has focused on the criteria of covariation between the cause
and effect variables while neglecting the other two. Without the establishment of
19
temporal precedence and the ruling out of other explanations of cause, explanations of
the findings such as reverse causation or spurious relationships cannot be ruled out.
Temporal precedence implies that the cause must occur before the proposed
effect in time. A review of the literature by Wright et al., (2005) found that of 68
empirical studies testing the relationship between HRM and performance only eight
used HRM measures taken prior to the performance measure used. The remainder of
the studies measured the HRM concurrently with performance or in many cases in
time periods that followed the performance measure. There appears to be a need for
SHRM researchers to increase their focus on testing the causal relationship especially
in ensuring that empirical studies establish temporal precedence between the cause and
effect variables. That being said, HR systems tend to be static over long periods of
time raising the question of whether or not even longitudinal studies will significantly
contribute to our understanding of the causal relationship (Wright et al., 2005). Given
the potential difficulty in demonstrating cause using temporal precedence and
longitudinal studies, researchers should focus on the third criteria for establishing
cause.
The third criterion posed by Cook and Campbell (1979) is that of eliminating
alternative explanations of cause. In a simplistic sense, this can be accomplished
through the use of proper controls in the research process. This implies that efforts
should be made to control for as many alternative variables which might possibly be
contributing to performance and covary with the HRM measures. While it is obvious
that researchers will not be able to control for all other variables, the argument for
causation will be strengthened to the extent that as many of those variables possible
can be measured. Variables such as human capital (Hitt, Bierman, Shimizu, &
Kochhar, 2001) or environment (Dess & Beard, 1984) need to be included in future
research in addition to more standard variables used in past SHRM research.

20
Rogers and Wright (1998), in a review of the literature, concluded that 6 basic
control variables had been used to varying degrees in SHRM research: size, industry,
age, location, strategy and unionization. All of these variables were not used in every
study and measurement of the control variables differed across studies indicating a
lack of consistency in the control variables used in past SHRM research (Becker &
Gerhart, 1996). In addition, Rogers and Wright (1998) point out that some of the
control variables used, though included, are not measured in a way that is consistent
with the constructs involved. The control variable of strategy, for example did not
seem consistent with the theories being tested in all of the papers. Instead, strategy
measures focused on familiar ideas such as Miles and Snow (1978) or Porter, (1985)
frameworks. In relation to these measures of strategy used in SHRM research, Becker
& Gerhart (1996) point out that these particular measures of strategy are firm level
concepts and might not be applicable to other levels of analysis such as business unit
level analysis.
Researchers should focus on discovering situations where meaningful
measurement of these variables is possible in order to rule out these alternative
explanations of performance and strengthen the argument that HRM causes or leads to
performance. Small businesses, for example provide an interesting context for the
collection of a set of control variables that can more adequately rule out alternative
explanations of performance.
In summary, past research attempting to study the relationship between HRM
and performance has adequately demonstrated a relationship between HRM and firm
performance. Future research should focus on demonstrating that the relationship is
causal. While actually proving cause is not a true possibility, additional research rigor
such as the collection of proper control variables can add credibility to the causal
assumption. Collecting proper control variables will allow us to rule out alternative

21
drivers of performance. Demonstrating that HRM contributes to performance above
and beyond other known drivers of performance is a step in this direction.

22
CHAPTER 3
WHY STUDY HRM IN SMALL BUSINESSES
Small businesses play an important role in our economy. This is especially
true from a labor standpoint where more than half of US employees are working for a
small business (US SBA). It is important for researchers to understand the human
resource management issues that might exist in these settings and the contribution if
any that human resource management might make to the performance of these small
businesses. In spite of the importance that small businesses play in our economy and
labor force, very little research has sought to understand human resource management
in small businesses (Heneman, Tansky, & Camp, 2000). Therefore, the most
important reason for studying HRM in small businesses is to expand the HRM to
performance research into this important context.
In addition, by studying the effects of HRM in small businesses I will be able
to address or overcome several measurement and design issues prevalent in past
SHRM research. In particular, small businesses provide a context that controls for or
reduces many of the complexities that have hindered research in the past. This will
allow me to 1) address issues related to causality by measuring more appropriate
controls, 2) eliminate the complexity of multiple levels and layers, and 3) further the
understanding of the process of when HRM might lead to performance by testing
various moderator relationships of other performance drivers.
Thus, the benefits of the study of HRM in small businesses is twofold 1) to
better understand this important segment of the business world previously neglected
by HRM researchers and 2) use the context of small businesses to shed some light on
important causality and contextual questions not yet understood by HRM researchers.

23
Extension of HRM Research to Small Businesses
As was demonstrated previously, small businesses play an extremely important
role in the U.S. economy. Given their role in the economy, it is important for business
researchers to understand how small businesses function and what might be the same
and different when compared to what is already known about large corporations. In
spite of the significance of small firms in the US economy, HRM research in small
firms has been limited (Heneman, Tansky, & Camp, 2000). Research addressing the
question of how HRM impacts performance in small firms would benefit the SHRM
field by extending that research into this important area. This research will also
benefit current research on performance in small businesses by providing insights into
the role that HRM plays in the performance of small firms. Finally, research in this
area will benefit small business owners and managers by providing insights into how
they can better run their business and improve their performance through effective
management of their human resources.
Small Businesses and Levels of Analysis
The context of small businesses reduces the complexity caused by multiple
levels of analysis (Becker & Gerhart, 1996). While large organizations operate on
multiple levels such as corporate, division, and business unit, small firms do not
exhibit the same complexity and in most cases operate on a single level where
corporate and business unit are the same thing. By using small businesses as a
context, I will be able to eliminate many, if not all, of the complexity and
measurement difficulties resulting from multiple levels of analysis and decisions about
the appropriate levels for variable measurement (Becker & Gerhart, 1996). Take for
example, business strategy. In large organizations strategies exist on multiple levels
within the firm (Schendel & Hofer, 1979). These strategies are likely to differ across
products, markets or geographies within a firm. Given these complexities it is difficult
24
to imagine a measure of strategy that will be representative of the firm as a whole.
Small businesses on the other hand have a reduced number of levels, products, and
geographies across which a strategy might vary thus simplifying the measurement of
that particular variable. Similar arguments could be made for other dependent,
independent and control variables.
In this way, using small businesses as a context for the study of HRM and
performance is similar to studying the same relationship in smaller pieces of larger
organizations such as business units or departments as was suggested by Becker and
Gerhart, (1996) where it was argued that studying HRM in these smaller contexts
might help reduce some of the complexities that have been discussed previously. In
addition to the benefits of reduced size and complexity, small businesses provide the
opportunity to study the HRM to performance relationship across the whole
organization. Results will not be hindered by the impact of other levels, departments,
or business units within a larger organization as would be the case in studying
business units or subsidiaries.
While a department or business unit of a larger organization might reduce
some of the complexities related to size, they are still plagued with issues stemming
from their ties to a larger organization. The influence of higher levels of leadership,
firm level strategies, or the influence of other parts of the organization on the business
unit or department would be difficult to parse out. Small businesses allow researchers
to look at the entire organization in a context with reduced complexity making them a
desirable context for the study of the HRM to performance relationship.
Small Businesses and Proper Controls
As was discussed previously, prior research in SHRM has focused on
demonstrating a relationship between HRM and performance, but has been weak in
demonstrating cause. Given the static nature of HR systems over time one of the best

25
methods to strengthen the argument of cause is to properly control for alternative
drivers of performance. Becker and Gerhart (1996) present two ways in which
researchers can design controls into their research. Either a more comprehensive set
of control variables, can be used or, a sample can be selected that by its makeup
controls for some of the potentially omitted control variables. The use of small
businesses as a context for SHRM research aids in the accomplishment of the first of
these methods.
Small businesses as a context will allow for the collection of various control
variables that would be much more difficult if not impossible to measure in a large
organization. For example, variables such as managerial human capital or
environment would be very difficult to measure in a large firm. Multiple layers of
leaders across multiple products and geographies impacting employees at various
levels make measuring for the impact of leader attributes in a large firm difficult.
Similarly, the fact that large firms operate in multiple environments and markets
makes it difficult to obtain a representative measure of the environment. Small
businesses on the other hand, are much less complex in relation to these and other
variables. The distance between the leader in a small firm and the employees is much
shorter than in a large organization and often is a direct relationship making the
measurement of leadership such as human capital much more feasible. Likewise,
small businesses operate in smaller markets and less complex environments, thus
improving the feasibility of a representative measure of the environment and its
impact on the firm.
In summary, the reduced complexity provided by the context of small
businesses will allow for meaningful measurement of several important control
variables necessary for understanding the relationship between HRM and
performance. The inclusion of these variables will allow me to create a stronger test

26
of the relationship between HRM and performance because I will be use the measures
collected in this reduced complexity to demonstrate that HRM contributes to
performance above and beyond other known drivers of performance.
Small Businesses and Contextual Issues
In addition, the use of small businesses will enable me to test interactions that
have not previously been understood. Researchers have suggested that the
relationship between HRM and performance is not necessarily linear and likely
involves complex interactions with other variables (Dyer & Reeves 1995; Delerey &
Doty 1994). While this idea of moderating or contingency effects in the HRM to
performance relationship is not new, results of research attempting to understand this
relationship have been mixed. Pfeffer, (1994) went so far as to argue that support for
these contingencies was so weak that a focus on best practices would be preferable to
continued efforts to understand contingencies. It is likely that this difficulty in
understanding contingencies in the HRM to performance relationship is caused at least
in part by the complexity of the context in which they have been studied and the
difficulty of obtaining meaningful measures of key contingency variables.
Small businesses like their larger counterparts operate under many different
contexts. It is likely that the role HRM plays in the performance of small businesses is
contingent on many of these contextual differences. Because of the reduced
complexity provided by the small business context, feasible measurement of potential
contingency or moderating variables such as measures of alternative performance
drivers will be facilitated. Because measures of these constructs may be collected
more readily in a small business context, I will be able to test for possible moderation
effects with HRM allowing me to answer contextual questions regarding HRM and
performance. For example, do attributes of the leader impact the relationship between
HRM and performance? Does HR play a different role depending on the knowledge
27
or experience of the leader? Similar questions could also be posited around other
important control variables such as strategy or the environment. The answering of
such questions will contribute greatly to the field of HRM by broadening our
understanding of how HRM interacts in the context of small businesses with these
variables not previously understood in research using large organizations.
28
CHAPTER 4:
HRM AND SMALL BUSINESS PERFORMANCE
Prior research suggests that HRM systems as a resource can lead to
competitive advantage (Wright, Dunford, & Snell, 2001). A number of studies have
demonstrated relationships between different bundles of HR practices or philosophies
and firm performance in larger firms (see Wright et al., 2005 review). In spite of the
significant research in the area of SHRM in large firms, little has been done to test
similar relationships in small businesses (Heneman, Tansky, & Camp, 2000).
Because of the demand placed on small business owners and managers to
create and exploit growth opportunities, there is a potential for them to benefit from
understanding and implementing HRM systems in a strategic way. Indeed, there is
evidence to suggest that human resource management matters to small business
managers and plays a role in the performance of small businesses. For example, small
business owners have cited human resource issues including recruitment, motivation
and retention as major issues that they deal with in managing their firms (Heneman,
Tansky, & Camp, 2000; Hess, 1987; & Hornsby & Kuratko, 1990).
Importance of HRM in Small Businesses
The bulk of work on HRM in small businesses has tended to focus on
surveying firms to identify the frequency of use of different HR practices. This
research has shown that small firms implement a wide variety of HR practices, though
in a less sophisticated way than larger organizations (Heneman, Tansky, & Camp,
2000; Hornsby & Kuratko, 1990). Importantly, a study by Hornsby & Kuratko (1990)
found that HR practices are significantly more prevalent in small businesses than had
been previously thought, and mirrored those found in larger organizations. In a
comparative study of both large and small manufacturing firms, Deshpande & Golhar

29
(1994) found that the small firms and large firms shared similar views on a set of
workforce characteristics driven by HR practices. More importantly, this study
indicated that the characteristics driven by HR practices such as lower turnover or
higher levels of employee discretionary behavior were considered to be even more
critical in the small businesses. Although limited, this body of research suggests that
1) HRM is being used in small businesses 2) Practices in small businesses are similar
but less sophisticated than those of larger organizations and 3) Small business
managers consider HRM to be of vital importance to the management and success of
their businesses.
Therefore, it seems likely that smaller organizations should be able to reap
similar benefits to those found in larger organizations from effective HRM. While
previous research on HRM and performance in small businesses is not vast, there has
been some research that supports this idea. Welbourne and Cyr (1999), using a
sample of small, fast growing, high-tech firms found that having a senior HRM
manager on the staff as an indication of the importance of HRM to the firm resulted in
better performance in the form of growth and survival. Welbourne and Andrews
(1996) found that placing higher value on employees in initial public offering firms
was related to the long term survival of the firm. In addition, Collins and Clark (2003)
found that bundles of HR practices were related to social networks in the top
management team which were in turn related to financial performance in smaller high-
technology firms. While not testing a direct relationship between HRM and firm
performance, these studies do indicate that such a relationship is likely. More research
is needed to understand the role that HRM plays in the performance of small
businesses.
There is currently no research that looks at differences in the impact of HRM
on performance based on size, but given the nature of small businesses, it is possible

30
that the role of HRM in the performance of small businesses is even more critical than
in larger organizations. Because of their size, the impact of changes in the
environment, supply, demand or competitors can significantly impact small
businesses. While all organizations experience changes in the environment, small
businesses, unlike larger organizations are not able to buffer themselves from these
environmental changes or spread these changes across multiple product lines,
geographies or business units. Because of this, small businesses are less able to shield
their employees from the effect of these changes or impacts. From an small business
employee standpoint, this means that these changes in the external or competitive
environment can have a direct impact on the nature of their jobs. This leads to an
environment where the employment conditions for employees of small businesses can
be constantly changing.
This constant change creates unique challenges for small business managers to
maintain, find, develop and motivate employees in spite of the turbulent environment
in which they and their employees operate. The potential for effective HRM to aide in
that process is high. To the extent that small businesses are able to effectively manage
their human resources, they will be able to mitigate the effects of this constantly
changing environment on their employees. By doing this I argue that small businesses
with effective HRM systems will be more likely to find, motivate and retain valuable
employees and that employees working for small businesses with effective HRM
systems will be more likely to act in a way that is beneficial to the business in spite of
the impacts to small businesses caused by the changing environment.
In addition, small businesses are not able to spread their risk across multiple
products, product markets geographies or sheer size. Because of this lack of ability to
spread risk, the potential impact of mistakes or poor decision making is higher in small
businesses than that of larger, more diversified firms (Mansi & Reeb, 2002). This

31
applies to mistakes or poor decision making in HRM as well. The potential impact to
a small business of hiring the wrong person or not retaining a key employee is greater
for small businesses where the impact cannot be spread across its size or diversified
portfolio. For example a small business with only one or two salespeople would be
impacted to a much greater degree by the hiring of an ineffective salesperson or losing
an effective salesperson than would a large organization with hundreds of salespeople.
Here again, effective HRM in a small firm has the potential to provide a substantial
benefit by helping the small business to avoid or at least minimize costly HRM
mistakes or poor HRM decision making.
Small Businesses and High Involvement Work Systems
As was discussed previously, various measures and concepts have been used to
define human resource management systems. One HRM system that is of particular
relevance to small firms is known as the high involvement work system. (Applebaum,
Bailey, Berg & Kallenberg, 2000; Osterman, 1995; Tsui et al, 1997). Though defined
in various ways, high involvement works systems generally include 3 basic
components. High skill requirements demonstrated by selective recruiting, high levels
of employee discretion, and incentives that increase motivation and a focus on creating
an atmosphere of commitment to the organization. These conditions it is argued in
turn lead to a set of employees with both the ability (high skill levels and high levels
of discretion to complete their jobs) and motivation (incentives and opportunity) to act
in ways that are beneficial to the organization thus leading to higher levels of
performance (Batt, 2002). Wright, McMahan, and McWilliams, (1994) describe this
as the skill/behavior distinction where both the right skills as well as the right
behaviors are necessary for a HRM system to be effective in leading to higher
performance.

32
High involvement work systems have been shown to contribute to higher
levels of organizational performance in multiple settings (Arthur, 1994; Batt, 2002,
Snell & Youndt, 1995). The focus of high involvement work systems on creating an
atmosphere of motivation and commitment is of particular interest to small businesses
(Ciavarella, 2004). Employees operating in the environment of small businesses can
be forced to deal with constant changes and demands related to the inability of the
small businesses to shield their employees from changes in the environment. An
HRM system that increases employee commitment, motivation and discretion will
help by mitigating the impact of external changes on and minimizing the occurrence of
costly HRM mistakes.
A common approach to looking at the dimensions of high involvement work
system is to assume that the impact of each dimension on performance is additive
(Batt, 2002). An organization can receive some incremental results by investing in
one component, but additional benefits will result from an investment in all
components of the system. This approach has important implications for studying
HRM in small businesses. Past research has shown that small businesses employ
similar, but less sophisticated HRM systems than those in larger organizations. This
may be the result of reduced resources or understanding on the part of small
businesses. Because of this lack of sophistication, small businesses may not be able to
effectively implement all components of a high involvement work system, but the
more they are able to do the higher the benefit that they should receive.
Thus, HIWS can lead to benefits for small businesses by providing employees
with the means and motivation to act in a way that is beneficial to the organization.
The means is provided by the selective recruiting and high levels of employee
discretion. In this way, organizations employing a HIWS are able to select employees
that fit well with the organization and its goals. Those employees are then empowered
33
by being given high levels of discretion in choosing how they complete their jobs
(Ciaverella, 2003; Batt, 2002). The motivation is provided by having incentives and
opportunities that will motivate employees to act in ways that are beneficial to the
organization. By providing employees with motivating rewards and opportunities,
employees form an emotional attachment with the organization that results in higher
levels of motivation (Ciaverella, 2003). The result of the combination of an enabled
and motivated workforce is an increase in discretionary behaviors from employees.
Motivated and enabled employees act in ways that are beneficial to the organization
with employee outcomes such as increases in helping behaviors, creativity,
productivity, and service quality (Ciaverella, 2003; Batt, 2002; Applebaum, Bailey,
Berg & Kallenberg, 2000; Wright, McMahan & McWilliams, 1994; Arthur, 1994).
The first performance impact of a HIWS will be felt at the employee level
(Dyer, 1984). Employees with higher levels of motivation and commitment to the
organization will experience lower levels of intentions to leave the organization. This
impact of the use of a HIWS will be seen in lower levels of voluntary turnover as
fewer employee desire to leave the organization. Indeed, prior research has
demonstrated the use of HIWS is in fact negatively related to turnover Batt, 2002;
Huselid, 1995; Arthur, 1994).
Hypothesis 1a: The use of high involvement work systems in small businesses
will be negatively related to voluntary turnover.
In addition to the more immediate impacts to the employees of reducing
turnover, I also expect that effective HRM in small businesses will also impact more
distal operational outcomes such as product quality, innovation or customer
satisfaction. By bringing in higher quality employees and providing them with the
ability and motivation to achieve, small businesses employing HIWS will benefit by
selecting and retaining employees who are better able to fulfill their job

34
responsibilities by better serving customers or building products that are higher in
quality and responding to changes in the competition and environment (Batt, 2002;
Wright, McMahan, & McWilliams, 1994). In addition, employees with higher levels
of motivation and a higher commitment to the organization will be more likely exhibit
discretionary behaviors that are beneficial to the organization resulting in resulting in
higher levels of operational level performance in the form of innovation, customer
service and quality (Batt, 2002; MacDuffie, 1995; Arthur, 1994).
Hypothesis 1b: The use of high involvement work systems in small businesses
will be positively related to operational performance.
Finally, in spite of its distance from the immediate employee impact, I expect
that the use of high involvement work systems in small firms will also impact the
more distal financial outcomes. Lower turnover rates and higher levels of motivation,
quality, customer service and innovation on the part of the employees do have
financial performance implications. Organizations with employees possessing both
the means and the motivation to perform well will benefit in the form of higher
performance. Indeed, the firm level outcome is the outcome most often studied in
HRM to performance research (Rogers & Wright, 1998) and multiple researchers have
demonstrated a connection between effective HRM and firm level performance (Batt,
2002; Delaney & Huselid, 1996; Welbourne & Andrews, 1996; Huselid, 1995).
Hypothesis 1c: The use of high involvement work systems in small businesses
will be positively related to financial performance.
Small Businesses and Performance
As was discussed previously, past research on the HRM to performance
relationship has neglected to rule out alternative drivers of performance as a potential
cause of the observed relationship between HRM and performance. The testing of the
relationship between HRM and performance in small businesses without other known

35
drivers of performance equates to a replication of past SHRM research in a new
context. It answers the question of whether or not the relationships observed in larger
organizations holds true in small businesses. While the objective of expanding this
research into the area of small businesses is an important part of this research,
stopping there would be ignoring the benefit that the reduced complexity of the small
business context provides for HRM research.
The context of small businesses will enable me to collect meaningful measures
of other potential drivers of performance and then demonstrate that HRM contributes
to performance above and beyond these other known performance drivers. While this
will not prove cause, it will lend more credibility to the effect of HRM on
performance.
In order to understand the relationship between human resource management
in the context of these other performance drivers, it is important to understand what is
known about performance of small businesses in general. By identifying other key
drivers of performance in small businesses, I will be able to test whether HRM
contributes to firm performance above and beyond known drivers of performance thus
lending credibility to the idea that HRM leads to or causes performance.
There is a significant and growing literature addressing the performance of
small businesses. Small businesses are described as operating businesses with less
than 500 employees (SBA). Much of the research contributing to our understanding
of small businesses and performance comes out of the entrepreneurship literature.
While this is not a study specifically on entrepreneurship or entrepreneurial firms,
there is a significant amount of overlap between the two areas of research (Shane &
Venkataraman, 2000; Gartner, 2001) and many of the studies purporting to study
entrepreneurship actually use samples of small businesses. Given this fact, I will
36
draw on both small business research and entrepreneurship research to inform my
understanding of what contributes to the performance of small businesses.
Past research on the performance of small businesses has focused on specific
single aspects of performance such as founder or manager traits (Brockhaus, 1980;
Ginn & Sexton, 1990; Montagno, Kuratko, & Scarcella, 1986), firm level strategy
(Feeser & Willard, 1990; Chaganti, Chaganti, & Mahajan, 1989), or the environment
in which the business operates (Bourgeois & Eisenhardt, 1988; Cooper, Willard, &
Woo, 1986). Additional research has suggested that performance of small businesses
can be better understood by looking at a combination of these factors rather than the
individual factors in isolation. Sandberg & Hofer (1987) suggested that small business
performance resulted from a combination of attributes of the entrepreneur or manager,
the strategy of the business, and the environment or industry in which the business
operates. This idea that the performance of small businesses is a product of a
combination of attributes of the top manager, attributes of the organization and
attributes of the environment is now well accepted in the literature (Chrisman,
Bauerschmidt & Hofer, 2001; Baum, Locke & Smith, 2001; Shane, Locke, & Collins,
2003).
Given that individual, organizational and environmental dimensions of
performance have been shown to contribute to performance in isolation, it has been
predicted that when looked at in combinations these various levels of impact will
provide a more comprehensive prediction of performance than any one of them alone.
Baum, Locke & Smith, (2001) tested what they referred to as a “multidimensional”
model of small business performance and found support for the multiple drivers of
performance arguments. Given this multidimensional model of small business
performance, I propose that any research attempting to demonstrate that HRM

37
contributes to performance in small businesses will have to demonstrate that this
relationship exists in the presence of these other performance dimensions.
Individual Characteristics
There is evidence that one driver of performance in small firms is the
individual owner or manager (Baum, Locke, and Smith, 2001; Chrisman,
Bauerschmidt, & Hofer, 1998). Hambrick and Mason (1984) argued that
organizations are reflections of their leadership or top managers. The knowledge,
skills and abilities of the top manager influence the decision making of the
organization as well as strategy implementation. In this way the top managers have an
impact on the performance of the organization (Hambrick & Mason, 1984). Because
of the size of small businesses, individual owners or managers are able to directly
impact the performance of the businesses they manage through their personalities,
knowledge and experience. Research has demonstrated that the individual traits of
the owner or manager in small businesses contribute to their performance (Baum,
Locke, and Smith, 2001; Chrisman, Bauerschmidt, & Hofer, 1998).
Human Capital. According to the resource based view, the resources that a
firm possesses can contribute to competitive advantage (Barney, 1991). Intangible
resources are often thought to provide significant competitive advantage to businesses
because they are complex and difficult to imitate (Hitt, Bierman, Shimizu, and
Kochhar, 2001). One of these intangible resources is the human capital of the owner
or manager. Human capital has been described as the attributes; education, skills and
experience possessed by individuals (Finkelstein & Hambrick, 1996). Managers with
higher levels of human capital represent an intangible resource to the firm in that they
have higher levels of knowledge and skills that are relevant to management of a
business. Managers with high levels of human capital are able to use that capital in
decision making and management of the business in ways that are superior to

38
managers with lower levels of human capital (Hitt, Bierman, Shimizu, & Kochhar,
2001; Wright, Smart & McMahan, 1995, Finkelstein & Hambrick, 1996). In this way,
the human capital of managers can be considered a resource to the firm providing
competitive advantage (Barney, 1991). Human capital, defined in terms of education,
experience and skills of individual firm members has been shown to contribute to firm
level outcomes (Baum & Locke, 2004, Lee & Tsang, 2001, Box & White, 1993;
Finkelstein & Hambrick, 1996; Wright, Smart, & McMahon, 1995).
Organizational Characteristics
In addition to the individual characteristics of the entrepreneur or manager,
organizational level factors also impact the performance of small businesses. One
organizational level factor that is argued to impact the performance of both large and
small firms alike is strategy. Strategy has been defined as “an integrated and
coordinated set of commitments and actions designed to exploit core competencies
and gain a competitive advantage” (Hitt, Ireland & Hoskisson, 2005 p 7). Following
on that definition, strategy is the way in which a business chooses to utilize its
resources to compete. Firms that are better able to align their actions and
commitments with their core competencies would be expected to perform better than
those that can not. In line with this argument, research has demonstrated that strategy
is an important component of the performance of small firms. In a review of the
literature on strategy and performance of new ventures and small firms, Chrisman,
Bauerschmidt & Hofer (1998) found that measures of strategy formulation, goals and
objectives, strategic direction, entry strategy, competitive weapons, segmentation,
scope, investment strategy, and political strategy have all been shown to impact the
performance of small businesses.
Measures of Business Level Strategy One specific concept of strategy that has
been used extensively in SHRM research is that of cost verses differentiation proposed

39
by Porter (1980) (Youndt, Snell, Dean & Lepak, 1996; Wai-Kwong, Priem, and
Cycyota, 2001, Rogers & Wright, 1998). Low cost strategies focus on efficiency and
cost reduction or cost minimization in all areas of the organization. Differentiation
strategies are intended to compete on some differentiating factor other than lower cost
thus providing additional value to the customer. It has been argued that past strategy
measures such as cost verses differentiation might be inadequate and too high level to
explain the competitive strategy that is being employed at the business level (Rogers
& Wright, 1998; Becker & Gerhart, 1996). This is especially true when they are used
to measure the strategy of large and complex organizations.
In a review of strategies employed by small businesses, Chrisman,
Bauerschmidt and Hofer (1999) found that small businesses did indeed employ cost
and differentiation strategies, but that these strategies were often broken down further
in order to explain the manner in which the business had chosen to compete. Cost
strategies are fairly simple in their structure. The purpose is to increase efficiency and
reduce or eliminate costs in all areas of the business. Differentiation strategies are not
as simple to understand. The idea is to differentiate oneself from the competition in
order to provide value to the customer. Businesses have a number of ways that they
might use to achieve this differentiation. Chrisman, Bauerschmidt and Hofer (1999)
found that small businesses use differentiatiors such as service, quality, and innovation
in order to separate themselves from their competitors. It is likely that each type of
differentiation as well as the use of a cost based strategy has different implications for
firm level performance be it employee level, operational or financial. Indeed, studies
looking at cost versus differentiation strategies have found that there are different
performance implications of the chosen strategy (Baum, Locke & Smith, 2001;
Youndt, Snell, Dean and Lepak, 1996).

40
Environmental Characteristics
Porter (1980) argued that industry and environmental factors also impact firm
performance. According to Porter (1980) the industry structure can impact the choice
of whether or not to enter an industry through the creation of a new venture.
Eisenhardt and Schoonhoven (1990) expanded on that idea and argued that the
industry or more broadly, the environment in which a firm operates can impact the
ability of a business once established to garner resources and compete. The
environment in which a firm operates can vary by concentration (Melicher, Rush, &
Winn, 1976), complexity (McNamara, Luce & Thompson, 2002), munificence (Baum
& Wally, 2003), and dynamism (Dess & Beard, 1984). These differences in the
environment can impact the ability of a business obtain resources that are essential for
survival (Dess & Beard, 1984) which should in turn impact their performance. In a
review of the literature, Chrisman, Bauerschmidt and Hofer (1998) found multiple
studies that provided evidence that different measures of industry structure, industry
rivalry and the nature of the buyers and suppliers within the environment in which
they operated all had an impact on the performance of small firms.
Small businesses operate in a unique industry environment compared to that of
larger firms and given their size; they may not compete within that industry beyond
their localized market. Given this local market orientation I argue that the
environment in which the firm operates will have a greater impact on performance
than industry in general. Rate of change of the environment in which an organization
operates is one important environmental condition (Dess & Beard, 1984). The higher
or the faster the rate of change, the lower the predictability of that environment and
managers operating in that environment will be less able to prepare for the future than
in environments with lower rates of change (Dess & Beard, 1984). This inability to
understand and anticipate changes in the environment will make it difficult for

41
businesses to obtain or develop resources that are important to their success which will
impact their performance. Studies have demonstrated that the rate of change of the
environment in which small businesses operate does indeed impact the performance of
those businesses (Baum, Locke, & Smith, 2001; Wilklund & Shepherd, 2003; Miles,
Covin, & Heeley, 2000)
Past research has demonstrated that the individual traits of the manager, the
strategy chosen by the organization and the environment in which the organization
operates all have an impact on the performance of that organization. Because of its
ability to impact the employees, HRM should impact the employee, operational, and
financial outcomes of the firm above and beyond any impact of these alternative or
other known drivers of performance.
Hypothesis 2a: The use of high involvement work systems in small businesses
will continue to be negatively related to voluntary turnover in the presence of
alternative small business performance drivers.
Hypothesis 2b: The use of high involvement work systems in small businesses
will continue to be positively related to operational performance in the
presence of alternative small business performance drivers.
Hypothesis 2c: The use of high involvement work systems in small businesses
will continue to be positively related to financial or firm level performance in
the presence of alternative small business performance drivers.
Past SHRM research has consistently demonstrated a positive relationship
between HRM and firm performance. Most of this research has been done without
controlling for alternative drivers of performance as was mentioned previously. This
absence of key controls in past research raises the possibility that any relationships
found are spurious and are not actually caused by the HRM, but by some other
variable not included in the model (Wright et al, 2005). At a minimum, it is likely that
42
strength of previous HRM to performance relationships is inflated or exaggerated due
to the lack of proper control variables. This is especially true when looking at
outcomes such as operational or firm level performance where the impact of HRM is
less direct. Because of this I argue that while HRM in small businesses will contribute
to performance above and beyond alternative performance drivers, the strength of that
relationship will be reduced by the inclusions of key small business performance
drivers. In essence, the model that I am proposing for hypotheses 2a, b and c is a
stronger model for testing the relationship between HRM and performance than has
been used in the past because of the inclusion of alternative performance drivers.
While I do not believe that the relationship itself is completely spurious, I do argue
that the addition of alternative drivers of performance will weaken the relationship
between HRM and performance.
Hypothesis 3a: The presence of small business performance drivers will
reduce the impact of the use of high involvement work systems on operational
performance
Hypothesis 3b: The presence of small business performance drivers will
reduce the impact of the use of high involvement work systems on operational
performance.

43
CHAPTER 5:
MODERATION OF HRM IN SMALL BUSINESSES
Finally, given the diversity of the general makeup of small firms, it is likely
that the role of HRM in contributing to performance is moderated by multiple
variables. Sometimes referred to as contingency effects, (Delery & Doty, 1996),
moderation in the HRM to performance relationship implies that the relationship
between HRM and performance is contingent upon some other variable. While direct
effects of HRM on performance are more generalizable, understanding moderating
relationships in HRM research is important for understanding situationally specific
aspects of the HRM to performance relationship (Youndt, Snell, Dean, & Lepak,
1996; Delery & Doty, 1996; Becker & Gerhart, 1996). Past contingency research in
HRM has focused on the role of strategy as a moderator of the HRM to performance
relationship and there is evidence that strategy does indeed moderate the relationship
between HRM and performance. (Youndt, Snell, Dean & Lepak, 1996, Delery &
Doty, 1996; Guthrie, Spell, Chester & Namori, 2002) Findings related to other
potential moderators of the HRM to performance relationship have demonstrated
mixed results (Becker & Gerhart, 1996; Pfeffer, 1994)
Given the complexity of the relationship between HR practices and
performance and the performance relationship itself, I expect that other variables in
addition to strategy moderate the relationship between HRM and performance.
Specifically, I expect that the other drivers of performance in small businesses such as
environmental and individual leader characteristics discussed previously moderate the
relationship between HRM and performance.
Importantly, addressing the HRM to performance relationship in small
businesses will enable me to control for variables that have not previously been used

44
in the SHRM research. I will also be able to make a significant contribution to the
field of SHRM by also testing possible moderating effects of those variables.
Specifically I expect that Individual, firm level and environmental variables will
moderate the relationship between HRM and performance. In addition, there is some
research demonstrating that the size of the business will also play a role in the ability
of HRM to impact performance (Deshpande & Golhar, 1994; Hornsby & Kuratko,
1990), and that relationship will be tested as well.
Moderating Effects of Individual Characteristics
Human capital is a potential resource for organizations management
(Finkelstein & Hambrick, 1996). Small businesses with managers who possess higher
levels of human capital in the form of skills, education and experience have a potential
advantage over businesses whose managers do not possess high levels of human
capital. These managers are able to apply their knowledge and experience to the
decision making and day to day operations of the organization and will arguable be
able to use that experience to make better decisions and more effectively manage
business operations.
I argue that this advantage also applies to the management of people within an
organization. A small business manager or owner with higher levels of human capital
should be able to apply his or her knowledge and experience to the management of
people within the organization. Following on the arguments of Finkelstein and
Hambrick, (1996), a manager’s philosophy or view of how people should be managed
will be influence by the knowledge and experience possessed by that manager.
Managers with greater experience will have greater people management knowledge at
their disposal when making decisions regarding people management issues.
Specifically, small business managers with high levels of human capital will be able to
gain greater benefits from effective HRM by applying their experience and knowledge
45
to the implementation and use of HRM systems and tools. Managers with high levels
of human capital will be able to apply their knowledge and experience to the
implementation and management of HRM systems allowing them to get more out of
those systems. Therefore, managers with higher levels of human capital will
experience greater benefits from effective HRM than those managers with lower levels
of human capital.
Hypothesis 4: The positive effect of high involvement HRM systems on
performance will be stronger for organizations whose top mangers possess
higher levels of human capital.
Moderating Effects of Organizational Characteristics
As was discussed previously, past research has demonstrated that the role
between HRM and performance in large organizations is moderated by strategy. I
expect that this same relationship exists in small businesses. One perspective that has
consistently been used to explain the moderating role of strategy is the behavioral
perspective (Jackson, Schuler, & Rivero, 1989). According to the behavioral
perspective, organizational characteristics are expected to elicit certain behaviors or
responses from employees. For example, Guthrie, Spell, & Nyamori (2002) looked at
the moderating role of differentiation strategies vs. cost based strategies in the role of
HRM on performance. Different strategies are thought to require different behaviors
from employees which in turn require different needs from the HRM system.
Using the behavioral perspective they argued that differentiation, which they describe
as innovation, required greater discretion from employees because differentiation
based companies are likely to have more broadly defined jobs as compared to
companies employing a cost based strategy. This increased discretion requires more
depth and breadth of skills from employees as well as more commitment to the
organization. In this sense it was argued that HRM systems would be more likely to

46
positively impact firms employing a differentiation strategy because the increased
flexibility and discretion from employees required by the strategy allowed for greater
impact from the HRM in helping to foster those needed behaviors from employees. In
a sense, the more complex or demanding the behaviors required by a certain strategy,
the greater the potential impact of HRM on performance if it is able to encourage
those needed behaviors (Guthrie, Spell, & Nyamori, 2002).
Firms exhibiting a higher use of differentiating strategies such as customer
service, innovation or quality will require more from their employees. Following on
the moderating role of differentiation strategies and the behavioral perspective, I
expect that firms focusing more on customer service, quality or innovation in order to
compete would require higher levels of flexibility and innovation from employees than
businesses with lower levels of these characteristics. Likewise competing on these
factors would require employees with higher depth and breadth of skills in order to
meet the added demands of following this kind of a strategy. This in turn would lead
to a greater ability of the HRM system to impact those employees which would in turn
impact the performance. Because of the higher demands placed on employees as the
result of a differentiation strategy, organizations choosing to use a differentiation
strategy will be able to reap greater benefits from an effective HRM system. This
leads me to conclude that strategy, specifically the use of the different forms of a
differentiation will moderate the relationship between HRM and performance in small
firms. Specifically, those businesses using a differentiation strategy to compete will
experience a greater benefit from the use of an effective HRM system than those
businesses using a cost based strategy.
Hypothesis 5a: The positive effect of high involvement work systems on the
performance of small businesses will be stronger for businesses with a higher
focus on a customer service strategy.

47
Hypothesis 5b: The positive effect of high involvement work systems on the
performance of small businesses will be stronger for businesses with a higher
focus on a quality strategy
Hypothesis 5c: The positive effect of high involvement work systems on the
performance of small businesses will be stronger for businesses with a higher
focus on an innovation strategy.
Hypothesis 5d: The positive effect of high involvement work systems on the
performance of small businesses will be weaker for businesses with a higher
focus on a low cost strategy.
Moderating Effects of Environmental Characteristics
Small businesses represent a unique employment setting. Employees of small
firms are subject to increased variation in demand in their jobs. In addition, due to the
lack of a large employee base over which risk can be spread, I argue that small
businesses will feel the negative impact of HRM mistakes in the form of not hiring the
right person or being unable to retain key employees. I further expect that these
potentially negative effects of employment in small businesses will be amplified when
a small business is operating in a complex environment.
Environmental rate of change. As I discussed previously, environments that
change quickly will make it difficult for businesses to predict and understand the
environment. This inability to predict the environment will have direct ramifications
for employees in the form of changes in demands of the job and increased uncertainty
because organizations would be less able to anticipate and plan for the future.
Likewise, businesses operating in environments that are changing quickly are likely to
make more HRM mistakes such as hiring the wrong employee or not being able to
retain key employees. Inability to predict the future will make forecasting future
employment needs difficult and as mentioned, they make creating a stable

48
environment for employees difficult. Because of the potentially negative impact on
employees of environments high in complexity, the potential for HRM systems to
mitigate the effects caused by the environment should be higher than for businesses
operating in more stable environments. The role that HRM plays in the performance
of small businesses should be moderated by the environment in which they operate.
Specifically, those businesses that are operating in a fast changing environment will
receive a greater benefit from the use of an effective HRM system than those
operating in a slower changing environment.
Hypothesis 6: The positive effect of high involvement work systems on the
performance of small businesses will be stronger for firms operating in
environments with a high or fast rate of change
Moderating Effects of Firm Size
Even within the context of small businesses, the size of the business plays a
role in moderating the impact of HRM. The larger the company, the higher the
complexity involved in its management. Very small companies are low in complexity
with few, if any layers of management and few products distributed in a small market.
As a company gets larger, complexity increases, and likewise the number of
employees increases creating increased complexity in the management of its people.
In addition, the ability of the top leader or managers to foster personal relationships
with each and every employee decreases as the size of the organization increases.
Because of the increase of complexity and bureaucracy and the decrease in personal
touch from top management, the need for and the benefit from and effective HRM
system will increase with the size of the company. Because of this, larger small
businesses will see a greater benefit from an effective HRM system than smaller small
businesses because the effective HRM system will help larger businesses to overcome
increased complexity, bureaucracy and lack of personal touch.

49
A concept which is helpful in understanding how increased size leads to added
complexity is that of span of control. Span of control refers to the number of
subordinates managed by a single manager. Past studies have demonstrated that
average managerial span of control is around 7 (Hattrup & Kleiner, 1993). Thus, as
the number of employees increases, the number of managers needed to manage those
employees increases as well. This process continues as the size of the firm increases
with additional managers and additional layers being added. Additional managers and
layers of management decrease the ability of the leader to directly impact employees
and increase the overall complexity of the people management needs.
Given this increase in managerial complexity brought on by growth, it is
expected that HRM systems to deal with this complexity will be needed. There is
some evidence to support this idea. Hornsby and Kuratko (1990) found that within the
context of small businesses the frequency as well as the complexity of HR practices
tended to increase with the size of the business. Presumably this increase in
sophistication of HR practices is in an effort to deal with the increased complexity in
the people management processes. Given this, I expect that as firms get larger and
thus more complex, they will experience a greater benefit from their HR systems that
will translate into greater performance effects of those systems.
Hypothesis 7: The positive effect of high involvement work systems on
performance will be stronger for larger businesses than for smaller businesses
within the context of small businesses.

50
CHAPTER 6:
METHODS
Research Overview
My population for the study was owners or managers of small businesses
representing multiple industries. The unit of analysis is the firm. The names of the
firms to be used in this study were provided by a consulting firm that focused on small
businesses. Participants were both clients of the above mentioned firm as well as
potential clients. From this population companies with at least 10 employees and no
more than 500 employees were chosen.
A significant amount of fieldwork preceded the development of the survey
instruments. Because of the lack of prior research on HRM in small businesses, I felt
that the fieldwork was necessary in order to understand more about HRM in small
businesses. In order to gain this understanding I conducted interviews with owners,
managers and employees of small businesses similar to those that would be used in the
study. I wanted to understand what these organizations were doing in the way of
HRM, what level of understanding they had about their HRM system and how they
measured their success both from an HRM standpoint, but also their general
performance.
This fieldwork began in 2004 when I conducted qualitative interviews with
approximately 20 different small business organizations. I conducted interviews with
either the CEO or a key employee responsible for human resource management
functions within the organization. The interviews were semi-structured and addressed
four key questions. These questions were: 1) What was the level of sophistication of
the HR practices and HR philosophies currently employed in the organization? 2)
What were the key human resource problems or issues currently faced by the

51
organization? 3) What were the key strategies used by the organization in order to
compete, and 4) What measurements or key drivers were used by the organization to
assess its success or failure?
I used the information gathered in the semi-structured interviews to guide the
development of the survey instruments. I developed two survey instruments for this
study, one for the top manager and one for employees. This was done by using a
combination of information gathered during the interview process and items and
measures from existing studies. One was developed to be completed by the owner or
top manager of the organization. The other was developed for completion by several
employees of each organization. The purpose of the employee survey is to validate
the self responses of the top manager and to collect a secondary performance measure
not provided by the top manager of the organization.
Procedure. I sent surveys either through regular mail or email to the top
manager of each organization in the sample depending on the contact information with
which I was provided inviting them to participate in the study by completing the
survey. At the end of the CEO or top manager survey, the top managers were asked to
provide contact information for up to 15 employees so that employee surveys could be
sent to those individuals. In return for their participation, top managers received
ongoing reports summarizing the findings of the study. Up to four follow-up mailings
were used to encourage response.
Surveys were then sent to the employee provided by the top managers asking
them to provide information about their organization as well as assess the performance
of their organization
(See Appendix A for a summary of measures used for this research)
(See Appendix B for copies of the original manager and employee surveys)
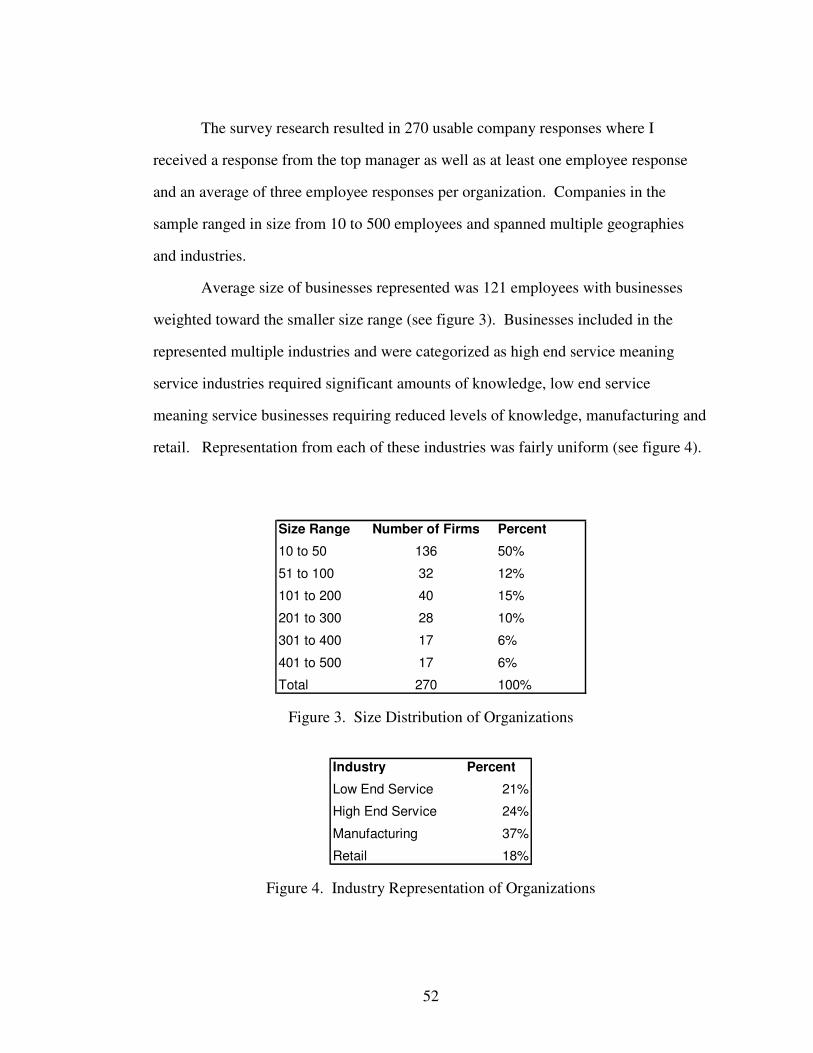
52
The survey research resulted in 270 usable company responses where I
received a response from the top manager as well as at least one employee response
and an average of three employee responses per organization. Companies in the
sample ranged in size from 10 to 500 employees and spanned multiple geographies
and industries.
Average size of businesses represented was 121 employees with businesses
weighted toward the smaller size range (see figure 3). Businesses included in the
represented multiple industries and were categorized as high end service meaning
service industries required significant amounts of knowledge, low end service
meaning service businesses requiring reduced levels of knowledge, manufacturing and
retail. Representation from each of these industries was fairly uniform (see figure 4).
Size Range Number of Firms Percent
10 to 50 136 50%
51 to 100 32 12%
101 to 200 40 15%
201 to 300 28 10%
301 to 400 17 6%
401 to 500 17 6%
Total 270 100%
Figure 3. Size Distribution of Organizations
Industry Percent
Low End Service 21%
High End Service 24%
Manufacturing 37%
Retail 18%
Figure 4. Industry Representation of Organizations

53
The businesses represented were small businesses but not necessarily start ups
or entrepreneurial organizations. The average age of organizations represented was 24
years old and only 50% were still being run by the founder or original CEO. Over
50% of the organizations had a dedicated HR professional, but interviews with these
individuals indicated that their job descriptions varied significantly and the level of
sophistication of the HR function also varied greatly from organization to
organization.
Measures
The HRM System
Item Development Process. Because of the lack of previous research regarding
HIWSs and performance in small businesses, no standard measure was available to
assess the use of HIWS practices or philosophies in small businesses. Because of the
diversity of the sample and the fact that the source for the HRM system measurement
was coming from the top manager of the organization I chose to measure the HRM
system at the philosophical level. Becker and Gerhart, (1996) argued that
measurements at this level are more generalizable across diverse samples. In addition,
my qualitative interviews with top managers revealed that the top mangers were
comfortable with and had a solid understanding of their HRM system at the
philosophy level.
While multiple views of high involvement works systems have been used in
previous research, these studies indicate that the basic components of a high
involvement work system includes selection or selective recruiting for high skills and
or fit, high amounts of employee discretion, and rewards or other forms of motivation
(Batt, 2002). In this way, organizations are selectively recruiting for the right skills or
fit, they are then providing discretion to these employees to allow them to use their
knowledge or skills in carrying out their job responsibilities and are providing

54
incentives or other motivators to insure the discretion and skills are used in ways that
are beneficial to the organization.
Drawing from previous SHRM studies, I developed a list of multiple HRM
philosophies related to the areas of selection, control, and motivation/rewards. These
lists were then converted to statements regarding their use within an organization.
Subject matter experts (faculty and graduate students with expertise in HRM systems)
then performed a Q-sort to ensure that there was general agreement regarding how the
different items fell into those HIWS categories. Items that did not sort consistently in
the Q-sort were dropped from the survey. The result of the development process was
a list of 26 HRM items (statements about the HRM philosophy within the
organization) conforming to the theoretical description of a high involvement work
system and focusing on the areas of selection, discretion, and motivation and rewards
(Batt, 2002). Items were included in the questionnaire using 5 point Likert type scales
asking respondents the extent to which they agreed with each statement (1 = strongly
disagree, 5 = strongly agree) in relation to their organization.
Testing the Factor Structure. I first examined the factor structure of all 26
HIWS items. Items were factored using principal components as the extraction
method and were rotated using varimax rotation. After removing crossloading and
single loading items, I was left with four distinct factors conforming to the selection,
discretion, motivation and rewards components of the high involvment work system.
Based on item factor loadings, I describe the distinct factors as Selection for Fit,
Employee Discretion, Feedback, and Employee Opportunity (See Table 1)

55
Table 1. Factor Loadings for Four-Factor HIWS Model N=270 a b
Factor 1 Formal
feedback to the
employee
regarding
performance
and opportunity
Factor 2
Selection for
company fit
Factor 3
Opportunities
for employee
growth and
social
opportunities
Factor 4
Employee
discretion in
decision
making and
performance of
duties
Feedback 1 .720 .076 .062 -.234
Feedback 2 .690 .052 .247 -.295
Feedback 3 .800 .063 .267 -.072
Feedback 4 .733 .097 .016 .069
Select 1 .062 .822 .154 .127
Select 2 .025 .820 -.049 -.102
Select 3 .174 .803 .177 -.003
Attach/Reward 1 .123 .121 .812 .030
Attach/Reward 2 .414 .115 .681 .018
Attach/Reward 3 .055 .051 .824 -.101
Control 1 R -.132 .015 -.139 .852
Control 2 R -.140 .003 .089 .849a Principle components
b Varimax rotation

56
Reliability Analysis. I also examined the internal consistency (reliability) of
the four HIWS factors using Cronbach’s alpha. Internal consistency of the four
factors was high and ranged from α .70 to .78 in the following breakout: Feedback,
four items α = .78, Select Fit, 3 items α = .76, Employee Opportunity, 3 items, α = .72
and Employee Discretion, 2 items α = .70.
HIWS Measure. The HIWS measure was created by combining the four
factors into an additive index. I expect that the true benefits of the use of a high
involvement work system will be experienced at a system level with each factor
contributing to the performance of the organization, but the overall contribution felt at
the system level. The additive index was used for two reasons. First, the additive
index provides a conservative estimate of the combined benefits of the HIWS
compared to a less conservative multiplicative index (Batt, 2002). Second, past
research has demonstrated that HRM in small businesses is less sophisticated than
larger organizations. It is possible that due to knowledge or resource constraints,
small businesses are not able to effectively implement each component of a high
involvement work system. I wanted to be able to capture the additional benefits that
these small businesses receive as they are able to add different components of an
effective HRM system. By being able to invest in some or one component of an
effective HRM system, small businesses will see some benefits, the more positive
results will be achieved if they are able to use all components of a HIWS.
Dependent Variables.
Following on suggestion from past SHRM research that multiple measures of
performance be used in order to triangulate the effects if any of HRM on performance
I used five different measures of performance, one to measure performance at the
employee outcome level (voluntary turnover) , two to measure performance at the
operational level (perceptual operational performance and employee perceptual

57
performance) and two financial measures of performance (perceptual financial
performance and commercial credit score).
It should be noted at this point that I used perceptual measures of performance
for three of the five performance measures. This was because of the difficulty of
obtaining objective measures of performance in the context of small businesses. The
majority of these businesses are privately held making performance data in the form of
sales figures, stock price and other financial measures used in large company research
publicly unavailable. Because of this, it became necessary to use perceptual measures
of performance.
Past research has suggested that perceptual or subjective measures of
performance are a good source of performance information when objective measures
are not available. Studies have demonstrated that perceptual performance measures
are similar to more objective measures both from a validity as well as a reliability
standpoint. Perceptual measures of performance have been shown to yield results
similar to more objective measures of performance when compared in the same
sample and have also been demonstrated to be an accurate reflection of actual
performance (Dess & Robinson, 1984; Wall, et al, 2004; Delaney & Huselid, 1996).
Voluntary Turnover. I measured voluntary turnover as the percent of total
employees who voluntarily left the company over the previous year (number of
employees who voluntarily left the organization over the previous year divided by the
total number of employees). I measured turnover as a percentage due the large
variation in company size in my sample. I wanted to have a measure of turnover that
was comparable across all organizations in the sample. Due to the sensitivity of
turnover information for small businesses, not all organizations were willing to
provide me with turnover information resulting in an N= 246 for this particular
variable.

58
Perceptual Operational Performance. I measured perceptual operational
performance using a 3 item scale of operational performance. The five point scale
measured the extent to which the CEO or top manager perceived the performance of
their organization to be higher or lower than that of other similar organizations in the
areas of; quality, innovation and customer service (1= worse, 5= much better). These
three items were created using information gathered during the qualitative interview
process. Top managers indicated that these were the factors with which they gauged
their success in relation to their performance at the operational level. The items
factored cleanly on a single factor and reliability was acceptable with a Cronbach’s
alpha α = .67.
Employee Perceptual Performance. In order to avoid potential same source
biases resulting from gathering both HRM and performance information from the top
manager, I also collected performance information from the employees. I measured
performance from the employees using a four item scale developed for the purpose of
this study. The items measured how the employees of the organization felt like the
organization was performing compared to key competitors, in achieving its potential,
satisfying others, and satisfying customers. My interviews with employees indicated
that while the employees did not always have a clear picture of financial performance,
they did understand the nature of the business in relation to competitors and customers
leading me to believe that they were a good source for this kind of performance
information. Items were scaled on a five point scale (1 = strongly disagree, 5 =
strongly agree). While questions regarding performance compared to competitors
could be construed as firm level or financial level performance, my qualitative
interviews with employees revealed that the employee understanding of performance
and performance drivers is almost exclusively centered on operational levels of
performance. This is in line with previous arguments regarding the more direct impact

59
of employee actions on operational performance (Dyer, 1984). The items factored
cleanly on a single factor and reliability was acceptable with a Cronbach’s alpha α =
.88.
Because the employee measure of performance came from multiple
respondents in most cases (avg. of 3 employee responses per organization) I also
conducted agreement analysis to test for consensus between the different raters of
performance within each organization to understand if the responses from the multiple
employees in each organization could be effectively combined for a single employee
performance measure. Aggregation statistics suggest a group level influence on
employee perceptions of performance (average ICC(1) = .24). Reliability of group
means was a bit low, but at an acceptable level as well (average ICC(2) = .66). (See
table 2)

60
Table 2: Employee Perceptual Performance Measure Items ICC1 ICC2 Alpha
1. This organization's performance
is much better than the performance
of our main competitors.
.32 .75
2. This organization is achieving its
full potential.
.20 .61
3. People are satisfified with the
level of performance of this
organization
.27 .69
4. This organization does a good
job of satisfying its customers
.19 .60
Total .24 .66 .88
61
Perceptual Financial Performance. Perceptual financial performance was
measured using a three item scale created for the purpose of this research. The five
point scale measured the extent to which the CEO or top manager perceived the
performance of their organization to be higher or lower than that of other similar
organizations in the areas of sales growth, profitability and market share (1 = worse, 5
= much better). As with the operational performance items, these three items were
adapted from information gathered during the qualitative interview process where top
managers expressed that these were the factors with which they gauged their success
in relation to their performance at the financial or firm level. The items factored
cleanly on a single factor and reliability was acceptable with a Cronbach’s alpha α =
.82.
Commercial Credit Score. In an effort to avoid common method bias as well
as introduce an additional objective measure of performance, I also collected a
commercial credit score from Dunn & Bradstreet for each organization in the sample
where available. The Dunn & Bradstreet commercial credit score is a rating of credit
worthiness of the organization based on past credit history. Each organization is rated
on a scale of one to five with one being the highest possible credit score and five being
the lowest. Organizations with a high credit score have a poor credit history and
organizations with a low credit score have a good credit history. The measure was
reverse scored to match other performance measures with one being lowest credit
rating and five being the highest. While Dunn & Bradstreet tracks a significant
number of companies, not all companies were available in the Dunn & Bradstreet
database resulting in an N=220 for this particular variable.

62
Alternative Drivers of Performance.
Following the previous discussion regarding small business performance,
alternative performance drivers represent key drivers of small business performance
from previous research. Measures of human capital, strategy and the environment in
which the firm operates were included.
Human Capital. Human capital was measured using two distinct measures.
The first was a measure of the amount of experience possessed by the top manager or
CEO, (CEO human capital), and was an additive measure of their self reported years
of experience in the industry in which they are now working and their self reported
years of experience in their current position. This is in line with other human capital
research using years of experience as a proxy for the human capital possessed by the
individual (Hitt, Bierman, Shimizu, & Kochhar, 2001). Because the experience of the
CEOs in the sample was not linear as well as the fact that there are likely diminishing
returns to the amount of experience possessed by a top manager, I used the log of the
CEO experience as my final measure of CEO experience.
My second measure of human capital was a more specific measure of the HRM
related human capital possessed by the top manger or managers within the
organization. This HR human capital measure was measured using a 2 item scale
developed for this research. The five point scale asked top managers or CEOs the
extent to which they felt like they and their top managers in their organization lacked
the knowledge, or time and resources necessary for the design and implementation of
effective employee management practices (1 = strongly disagree, 5 = strongly agree).
Items were reverse coded. The two items factored cleanly on a single factor and
reliability was acceptable with a Cronbach’s alpha α = .83
Business level Strategy. Business level strategy was measured using a
variation of the cost verses differentiation strategy construct proposed by Porter,

63
(1980). This concept was expanded based on previous small business research as well
as responses from the qualitative interviews to include three different types of
differentiation strategies that might be used by a small business 1) innovation, 2)
quality, and 3) customer service (Chrisman, Bauerschmidt and Hofer, 1999).
Top managers and CEOs were asked to rate which organization imperative
best characterized their current approach to the marketplace: 1) Innovation-
Continuously developing new products or services, 2) Quality – Continuously
improving the quality of its products or services, 3) Customer Service – Continually
adapting its products or services to customer needs, and 4) Low Cost – Continually
increasing the efficiency with which it operates. Responses were coded as four
dummy variables for the low cost and each of the three components of a
differentiation strategy.
Because of the difficulty of interpreting dummy variables in a moderation
relationship, managers were also asked to rate the extent to which their company’s
financial performance is dependent on each of the above 4 strategies using a 5 point
scale (1 = strongly disagree, 5 = strongly agree). This second scaled measure of
business strategy was used when assessing the moderating effects of each of the four
different business level strategies.
Environment. The environment in which the firm operates was measured
using a two item five point scale based on the work by Dess and Beard (1984). The
scale measured the rate of change within the environment and asked the top manager
or CEO the extent to which they agreed with statements about the rate of change of
technology and the rate of change generally in the environment ( 1 = strongly
disagree, 5 = strongly agree). The items factored cleanly on a single factor and
reliability was acceptable with a Cronbach’s alpha α = .69

64
Control Variables.
I included several control variables that have been shown to be related to both
HRM and the dependent variables. For example, research indicates that HRM
practices in small firms vary based on the size of the firm (Hornsby & Kuratko, 1990).
Performance can also vary based on firm size. Therefore, I controlled for the size of
the firm using number of employees as my indicator of firm size. Because the
distribution of the size of the firms in my sample was not linear, I logged the size and
used the log of the size as the final size variable. I also control for the age of the
organization as the age can also have an impact on the number of or level of
sophistication of HRM practices in an organization as well as the financial viability or
performance. Similar to the size variable, the distribution of firms by age of the
organizations was not linear and I took the log of the age for the final age control
variable.
I also controlled for the industry. By using a combination of self reported
industry descriptions as well as SIC codes I created 4 basic industry groupings: 1) high
end services, 2) low end services, 3) manufacturing and 4) retail. High end services
were service based organizations for which a high amount of knowledge was needed
such as consulting, medical, engineering , and architecture firms. Low end services
were service based organizations were a lower amount of knowledge was needed such
as lawn care, pest control or repair shops. Manufacturing comprised organizations in
both the manufacturing and construction industries and retail was made up of
organizations whose main focus was retail sales. After categorizing each organization
into one of the four industries, 4 dummy variables were created to control for industry.
Because of the size of organizations in the sample, many of the organizations
did not have a dedicated HR professional. It is expected that HRM will differ based
on the amount of attention that it receives in the organization and the existence of an

65
HR manager is a good indication of resources available for HRM. The presence of the
HR manager was controlled for using a dummy variable coded as 1 for the presence of
an HR manager and 0 if there was no HR manager present.
Past research has also indicated that the original CEO plays an important role
in shaping the HRM system as well as other aspects of the organization (Baron,
Hannan & Burton, 2001). Because of the strong effect that the original CEO can
potentially have, I controlled for the presence of the original CEO using a dummy
variable coded as 1 if the firm was still led by the original CEO or founder and 0 if it
was not.
Finally, because the sample came from clients and potential clients of a payroll
and insurance outsourcing firm, I wanted to be sure that I controlled for any impact of
the use of consultants to outsource different pieces of the employee management
process. This measure of the amount of outsourcing or consulting used by the
organization was measured using a 2 item scale. Top managers or CEOs were asked
the extent to which they agreed with statements indicating that they relied on external
sources to carry out employee management practices ( 1 = strongly disagree, 5 =
strongly agree). The two items factored cleanly on one factor and reliability was
acceptable with a Cronbach’s alpha α = .76.
Interaction Variables.
The interaction variables were created by taking the cross-product of the HIWS
variable with CEO experience, HR resources, innovation strategy, quality strategy,
customer service strategy, low cost strategy, environment, and size. In order to reduce
problems with multicollinearity, all variables were standardized prior to creating the
interaction variables.
66
CHAPTER 7:
RESULTS
Table 3 provides descriptive statistics for the variables and table 4 provides
pairwise correlations for all continuous variables in the model. To test hypothesis 1
and 2, I used hierarchical regression analysis. My overall procedure for each of the
five dependent performance variables remained the same. In step 1, I added the basic
control variables. This was done to control for any extraneous effects of industry,
size, age as well as the other control variables. In step 2, I added the HRM HIWS
variable. A significant effect for the HIWS variable in this step would provide support
for hypothesis 1a, b and c, that HRM specifically HIWS was positively related to the
various levels of performance. With the control variables and the HRM system
variable in place, this model represented a replication of previous HR to performance
research, but in the context of small businesses. In step 3, I added the alternative small
business performance drivers. A significant effect here would indicate that the
performance drivers measured for this study did indeed significantly explain
performance. More importantly, continued significance of the HRM variable in step 3
would indicate that HRM did contribute to the various levels of performance above
and beyond known drivers of small business performance providing support for
hypothesis 2a, b and c (See tables 5-9)

67
Table 3: Means and Standard Deviations
Variable Mean Std. Deviation
Consulting_Help 2.46 1.21
HR_Manager 0.56 0.50
Log_Age 2.73 1.06
Log_Size 4.09 1.24
Original_CEO 0.51 0.50
HI_Service 0.24 0.43
LE_Service 0.21 0.41
Manufacturing 0.37 0.48
Retail 0.18 0.38
CEO Human Capital 4.57 1.55
HR Human Capital 3.30 1.13
Strategy Innovation 0.18 0.39
Strategy Quality 0.29 0.45
Strategy Low Cost 0.30 0.46
Strategy Customer Service 0.24 0.43
Environment 3.29 1.06
Voluntary_Turnover 0.13 0.20
Perceptual Operational Perf 4.05 0.63
Employee Perceptual Perf 3.46 0.71
Perceptual Financial Perf 3.66 0.87
Commercial Credit 3.15 1.12
HPWS 13.92 2.06
HPWS_X_Environment 0.04 1.00
HPWS_X_CEO Human Capital -0.10 1.02
HPWS_X_HR Human Capital 0.33 1.07
HPWS_X_Size 0.27 0.98
HPWS_X_Innovation Strategy 0.10 1.03
HPWS_X_Quality Strategy 0.10 0.91
HPWS_X_LowCost Strategy 0.01 0.93
HPWS_X_CustService Strategy 0.09 0.86

Table 4: Pairwise Correlations a b
Variable 1 2 3 4 5 6 7 8 9 10 11 12 13 14 15 16 17 18 19
1 Consulting Help 1
2 Log Age -.10 1
3 Log Size -.23 .23 1
4 CEO Human Capital -.02 .13 -.11 1
5 HR Human Capital -.12 .05 .12 -.10 1
6 Environmental Change .11 .00 .07 .10 -.01 1
7 Voluntary Turnover -.02 -.11 -.12 -.12 -.07 .07 1
8 Perceptual Operational Perf. .07 -.02 .00 -.02 .33 .00 -.01 1
9 Employee Perceptual Perf .04 -.04 -.18 .02 .11 -.10 .05 .26 1
10 Perceptual Financial Perf. .03 -.08 .10 -.02 .28 -.06 -.02 .49 .35 1
11 Commercial Credit .09 .11 -.15 .11 .05 -.07 -.09 .05 .14 .08 1
12 HPWS -.14 .03 .27 -.10 .33 .04 -.25 .31 .08 .27 -.04 1
13 HPWS X Environment .13 .01 -.05 .10 -.09 .01 -.21 -.05 -.03 -.03 -.10 -.11 1
14 CEO Human Capital .09 -.03 .00 -.07 .07 .10 -.03 .03 -.09 -.02 .06 .02 -.08 1
15 HPWS X HR Human Capital -.11 .18 -.04 .07 -.08 -.08 .05 -.06 .04 -.09 -.07 -.12 .12 -.20 1
16 HPWS X Size -.01 .12 .08 .00 -.05 -.05 .16 -.05 .05 -.02 -.15 -.10 .06 -.11 .30 1
17 HPWS X Innovation Strat. .14 .05 .08 -.06 .09 .09 -.04 .06 .04 .06 -.03 .11 .15 .20 -.26 -.06 1
18 HPWS X Quality Strat. .04 .00 .06 -.12 -.03 .08 -.10 .04 -.04 -.02 -.05 .23 -.07 .06 -.02 -.01 .35 1
19 HPWS X Low Cost Strat. .01 -.05 .05 .03 .13 -.06 -.08 .02 -.03 -.05 -.06 .10 .09 .01 -.05 -.22 .00 -.02 1
20 HPWS X Cust Serv Strat. .03 -.01 .08 -.08 .10 -.02 -.24 .14 .03 .09 -.03 .29 .06 .07 -.07 -.16 .44 .43 .06
a For all correlations greater than .12 p < .05
b For voluntary turnover and commercial credit all correlations grater than .13 p < .05
68

69
Table 5: Results of Regression for HIWS, Small Business Performance Drivers and
Voluntary Turnover. a b c
Variables Model 1 Model 2 Model 3 Model 4
Control
Consulting Help -.06 -.08 -.11 ^
HR Manager -.05 -.01 -.06
Log Age -.09 -.09 -.07
Log Size -.06 -.01 -.02
Original CEO .05 .05 .03
HI Service -.01 .00 .00
LE Service .04 .07 .09
Retail .05 .04 .04
Human Resource Management System
HIWS -.24 ** -.25 **
Small Business Performance Variables
CEO Human Capital -.17 **
HR Human Capital .01
Innovation Strategy -.02
Quality Strategy -.08
Customer Service Strategy -.04
Environment .13 *
HR/Small Business Performance Interactions c
HR x CEO Human Capital -.02
HR x HR Human Capital .04
HR x Innovation Strategy -.02
HR x Quality Strategy -.08
HR x Customer Service Strategy -.18 **
HR x Low Cost Strategy -.05
HR x Environment -.22 **
HR x Size .19 **
∆R2
.05 .04
R2
.03 .08 .12
∆F 12.88 ** 1.78
a N= 246. Standardized regression coefficients are shown
b Voluntary Turnover was collected from the top manager and is the percentage of
employees who voluntarily left the company in the previous year. c Standardized regression coefficients for the interaction variables are the result of
entering each interaction term individually into the model to avoid effects of other
interaction terms. All individual interaction coefficients are shown here for
convenience.
^ p < .10
* p < .05
** p < .01
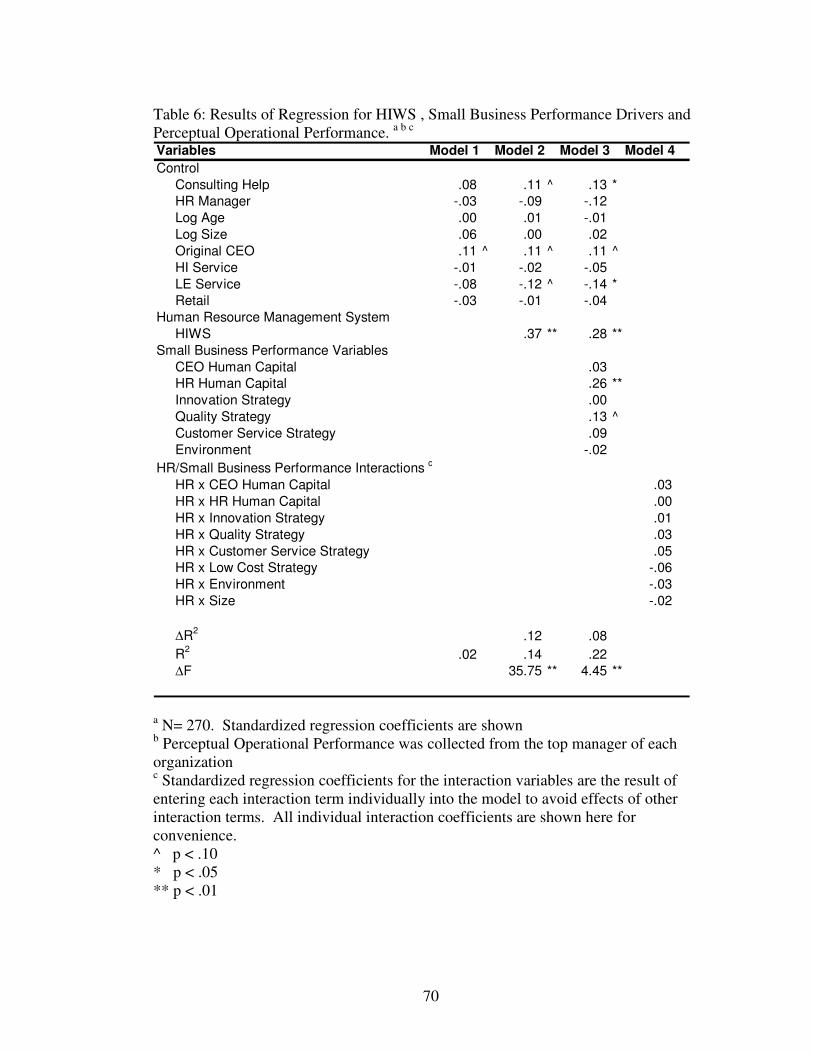
70
Table 6: Results of Regression for HIWS , Small Business Performance Drivers and
Perceptual Operational Performance. a b c
Variables Model 1 Model 2 Model 3 Model 4
Control
Consulting Help .08 .11 ^ .13 *
HR Manager -.03 -.09 -.12
Log Age .00 .01 -.01
Log Size .06 .00 .02
Original CEO .11 ^ .11 ^ .11 ^
HI Service -.01 -.02 -.05
LE Service -.08 -.12 ^ -.14 *
Retail -.03 -.01 -.04
Human Resource Management System
HIWS .37 ** .28 **
Small Business Performance Variables
CEO Human Capital .03
HR Human Capital .26 **
Innovation Strategy .00
Quality Strategy .13 ^
Customer Service Strategy .09
Environment -.02
HR/Small Business Performance Interactions c
HR x CEO Human Capital .03
HR x HR Human Capital .00
HR x Innovation Strategy .01
HR x Quality Strategy .03
HR x Customer Service Strategy .05
HR x Low Cost Strategy -.06
HR x Environment -.03
HR x Size -.02
∆R2
.12 .08
R2
.02 .14 .22
∆F 35.75 ** 4.45 **
a N= 270. Standardized regression coefficients are shown
b Perceptual Operational Performance was collected from the top manager of each
organization c Standardized regression coefficients for the interaction variables are the result of
entering each interaction term individually into the model to avoid effects of other
interaction terms. All individual interaction coefficients are shown here for
convenience.
^ p < .10
* p < .05
** p < .01
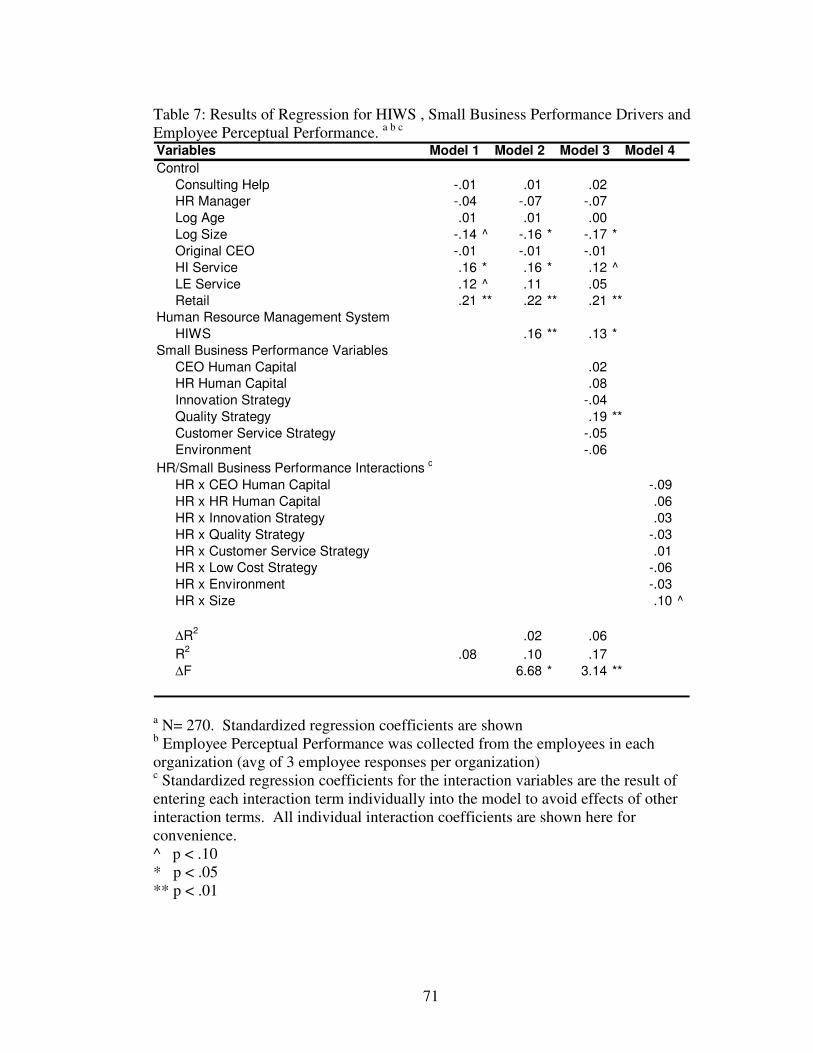
71
Table 7: Results of Regression for HIWS , Small Business Performance Drivers and
Employee Perceptual Performance. a b c
Variables Model 1 Model 2 Model 3 Model 4
Control
Consulting Help -.01 .01 .02
HR Manager -.04 -.07 -.07
Log Age .01 .01 .00
Log Size -.14 ^ -.16 * -.17 *
Original CEO -.01 -.01 -.01
HI Service .16 * .16 * .12 ^
LE Service .12 ^ .11 .05
Retail .21 ** .22 ** .21 **
Human Resource Management System
HIWS .16 ** .13 *
Small Business Performance Variables
CEO Human Capital .02
HR Human Capital .08
Innovation Strategy -.04
Quality Strategy .19 **
Customer Service Strategy -.05
Environment -.06
HR/Small Business Performance Interactions c
HR x CEO Human Capital -.09
HR x HR Human Capital .06
HR x Innovation Strategy .03
HR x Quality Strategy -.03
HR x Customer Service Strategy .01
HR x Low Cost Strategy -.06
HR x Environment -.03
HR x Size .10 ^
∆R2
.02 .06
R2
.08 .10 .17
∆F 6.68 * 3.14 **
a N= 270. Standardized regression coefficients are shown
b Employee Perceptual Performance was collected from the employees in each
organization (avg of 3 employee responses per organization) c Standardized regression coefficients for the interaction variables are the result of
entering each interaction term individually into the model to avoid effects of other
interaction terms. All individual interaction coefficients are shown here for
convenience.
^ p < .10
* p < .05
** p < .01

72
Table 8: Results of Regression for HIWS , Small Business Performance Drivers and
Perceptual Financial Performance. a b c
Variables Model 1 Model 2 Model 3 Model 4
Control
Consulting Help .06 .08 .12 *
HR Manager -.02 -.07 -.08
Log Age -.09 -.09 -.10
Log Size .14 ^ .10 .10
Original CEO .04 .04 .07
HI Service .03 .02 .02
LE Service -.08 -.11 -.12 ^
Retail .02 .04 .05
Human Resource Management System
HIWS .29 ** .23 **
Small Business Performance Variables
CEO Human Capital .06
HR Human Capital .22 **
Innovation Strategy .16 *
Quality Strategy .23 **
Customer Service Strategy .11
Environment -.09
HR/Small Business Performance Interactions c
HR x CEO Human Capital -.03
HR x HR Human Capital -.02
HR x Innovation Strategy .03
HR x Quality Strategy -.02
HR x Customer Service Strategy .02
HR x Low Cost Strategy -.13 *
HR x Environment -.03
HR x Size .00
∆R2
.08 .09
R2
.03 .11 .20
∆F 22.26 ** 4.81 **
a N= 270. Standardized regression coefficients are shown
b Perceptual Financial Performance was collected from the top manager at each
organization. c Standardized regression coefficients for the interaction variables are the result of
entering each interaction term individually into the model to avoid effects of other
interaction terms. All individual interaction coefficients are shown here for
convenience.
^ p < .10
* p < .05
** p < .01

73
Table 9: Results of Regression for HIWS , Small Business Performance Drivers and
Commercial Credit Rating. a b c
Variables Model 1 Model 2 Model 3 Model 4
Control
Consulting Help .07 .07 .08
HR Manager -.01 -.01 .01
Log Age .15 * .15 * .13 ^
Log Size -.16 ^ -.16 ^ -.15
Original CEO .00 .00 -.01
HI Service .02 .02 .01
LE Service .00 .00 .00
Retail -.08 -.08 -.10
Human Resource Management System
HIWS -.01 -.03
Small Business Performance Variables
CEO Human Capital .08
HR Human Capital .08
Innovation Strategy -.07
Quality Strategy -.04
Customer Service Strategy -.10
Environment -.07
HR/Small Business Performance Interactions c
HR x CEO Human Capital .05
HR x HR Human Capital -.09
HR x Innovation Strategy -.05
HR x Quality Strategy -.03
HR x Customer Service Strategy -.05
HR x Low Cost Strategy -.06
HR x Environment -.11
HR x Size -.16 *
∆R2
.00 .03
R2
.05 .05 .08
∆F .02 .98
a N= 220. Standardized regression coefficients are shown
b Commercial Credit Rating came from the Dunn & Bradstreet small business
database. c Standardized regression coefficients for the interaction variables are the result of
entering each interaction term individually into the model to avoid effects of other
interaction terms. All individual interaction coefficients are shown here for
convenience.
^ p < .10
* p < .05
** p < .01

74
Hypothesis 1a, b and c, Main Effects of HRM. With the basic control
variables in place the presence of a HIWS was significantly related to the employee
level measure of voluntary turnover ( ∆R2 = .05, ∆F = 12.88, p < .01 ). This provides
support for hypothesis 1a, that the use of a HIWS in small businesses would be
positively related to employee level measures of performance.
The presence of a HIWS was significantly related to both measures of
operational performance; perceptual operational performance ( ∆R2 = .12, ∆F = 35.75,
p < .01 ) and employee perceptual performance ( ∆R2 = .02, ∆F = 6.68, p < .05 ). This
provides support for hypothesis 1b, that the use of a HIWS in small businesses would
be positively related to operational measures of performance.
With the control variables in place, the presence of a HIWS was significantly
related to one of the measures of firm level or financial performance; perceptual
financial performance ( ∆R2 = .08, ∆F = 22.26, p < .01 ). The use of a HIWS was not
significantly related to the commercial credit score of the organization. This provides
partial support for hypothesis 1c, that the use of a HIWS in small businesses would be
positively related to firm level or financial measures of performance.
Hypothesis 2a, b and c, HRM with Alternative Performance Drivers. Model 3
added in the alternative performance drivers of human capital, business level strategy
and the environment. In hypotheses 2a, b and c, I argued that the use of HIWS would
remain significant even in the presence of these alternative drivers of performance.
Because this is only relevant for those variables that were significant in step two, the
dependent variable of commercial credit rating is not of interest for the testing of
hypothesis two.
While not a specific hypothesis, it should be noted that step 3, which includes
the alternative performance drivers as a model, was a significant predictor of
performance in every case except for those of voluntary turnover and commercial

75
credit. The overall group of small business performance variables were significantly
related to perceptual operational performance (∆R2 = .08, ∆F = 4.45, p < .01 ),
employee perceptual performance (∆R2 = .06, ∆F = 3.14, p < .01 ) and perceptual
financial performance (∆R2 = .09, ∆F = 4.81, p < .01 ). This lends some credibility to
the model of small business performance drivers used and their influence on
performance.
I found support for hypotheses 2a and 2b and partial support for 2c. For
hypothesis 2a, in the presence of alternative performance drivers, the use of HIWS
remained significant in its negative relationship with voluntary turnover ( p < .01 ).
For hypothesis 2b, in the presence of key small business performance drivers, the use
of HIWS remained significant in its positive relationship with perceptual operational
performance ( p < .01 ). In addition, HIWS remained significant in its positive
relationship with employee perceptual performance ( p < 05). For hypothesis 2c, in
the presence of key small business performance drivers, the use of HIWS remained
significant in its positive relationship with perceptual financial performance ( p < .01).
Because commercial credit was not a significant predictor of performance in step 2, its
effect in step three is not relevant.
76
Reduction in Effect Sizes Due to the Inclusion of Key Performance Drivers.
Hypotheses 3a and b were related to the reduction of the effect sizes of the HIWS
variable when the key small business performance drivers were added to the model in
step 3. The significance of a reduction in the effect size was calculated by creating a
95% confidence interval for the un-standardized regression coefficient for the HIWS
variable in step 3. Since the coefficients decreased in all cases from step 2 to step 3 I
was interested in the upper bound of the confidence interval created by taking the
coefficient plus two standard errors. A lack of overlap with the coefficient from step 2
would indicate a significant change in effect size at the .05 level. (See table 10)
Hypotheses 3a and b were not supported. There was significant overlap in the
95% confidence interval for the un-standardized regression coefficients indicating that
there is not sufficient evidence to conclude that there is any change in the effect size of
the HIWS variable as a result of including the key small business performance drivers.

Table 10: Confidence intervals for effect size changes.
HIWS variable
Step 2
unstandardized
coefficient
Step 2 Standard
Error
Step 3
unstandardized
coefficient
Step 3 Standard
Error
Step 3 upper
bound (+2 *
standard error)
Change is
significant at the
.05 level
Perceptual Operational
Performance .112 .019 .087 .019 .125 No
Employee Perceptual
Performance .056 .022 .046 .022 .090 No
Perceptual Financial
Performance .125 .026 .098 .027 .151 No
77
78
HRM Interactions. I tested hypotheses 4- 7 by adding the 8 interaction
variables; HRM with CEO human capital, HRM with HRM human capital, HRM with
an innovation strategy, HRM with a quality strategy, HRM with a customer service
strategy, HRM with a low cost strategy, HRM with environment and HRM with size.
Each interaction variable was entered into the hierarchical regression model as step 4,
one at a time for each of the five dependent performance variables for a total of
8x5=40 interactions tested. In addition, because the interactions involved the scaled
measures of the four strategy types, the dummy strategy variables were replaced by
the scaled measures in step 4. The result of the changes is that step 4 is not a true
hierarchical moderated regression, but rather just a convenient method to report the
individual interaction results. Results for the individual interactions tested can be seen
in step 4 of tables 5-9.
Hypothesis 4, the impact of HIWS in small businesses on performance will be
greater in organizations with higher levels of human capital in their top managers was
not supported. The two human capital interaction variables were not significant with
any measures of performance.
Hypothesis 5a, b, c and d, the impact of HIWS in small businesses on
performance will be greater in organizations with high levels of any of the three
differentiation strategies and lower in organizations using high levels of a low cost
strategy was partially supported. Two interactions were found to be significant at the
.05 level, HR with a customer service strategy on voluntary turnover was significant
(P < .01). In looking at the graph (See figure 3), for interpretation of this result, it is
apparent that the when the level of the customer service strategy being used is high,
the impact of HRM on turnover is greater as indicated by the steeper slope than when
the use of a customer service strategy is low. This indicates that where a customer

79
service strategy is being used, the impact of HIWS on reducing turnover is greater
providing partial support for hypothesis 5c. Countering that finding, the interaction of
HRM with a low cost strategy on perceptual financial performance significant (p<.05).
In looking at the graph for interpretation (See figure 3), the slope for the high use of a
low cost strategy was slightly steeper than the slope for low use of a low cost strategy.
This indicates that where a low cost strategy is being used, the impact of HIWS on
perceptual financial performance is higher. This goes against hypothesis 5d and
overall provides mixes results for the moderating effects of cost vs. differentiation
strategies.
Hypothesis 6, the impact of HIWS use in small businesses will be greater when
the rate of change in the environment is higher or faster was partially supported. I
found one interaction to be significant at the .05 level. HRM with a fast changing
environment on voluntary turnover was significant (p<.01). In looking to the graph
for interpretation, it is apparent that the slope on the line for a high rate of change in
the environment is steeper than the slope for the low rate of change in the
environment. This indicates that when the environment is changing quickly, the
impact of a HIWS on reducing turnover will be greater (See figure 4).
Hypothesis 7, the impact of HIWS use in small businesses will be greater in
larger small businesses was supported. Two interactions were found to be significant;
HR with size on voluntary turnover and HR with size on commercial credit. The
turnover interaction was significant (p<.01). Likewise, the commercial credit
interaction was also significant (p<.05). In looking at the graphs for interpretation of
these results (See figure 5), in both the commercial credit and the voluntary turnover
case, the slope is steeper under the condition of larger organizations than smaller
organizations. This indicates that the impact of HIWS on increasing credit scores and
on lowering turnover is greater as the size of the small business increases.
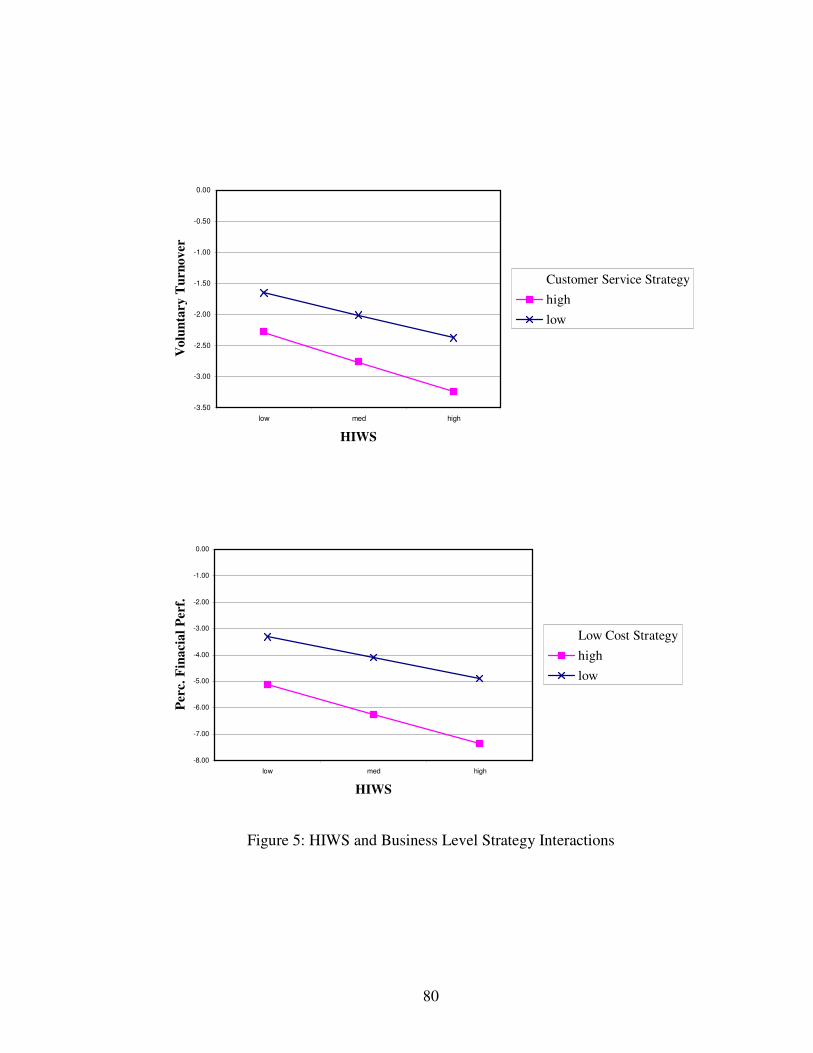
80
-3.50
-3.00
-2.50
-2.00
-1.50
-1.00
-0.50
0.00
low med high
HIWS
Vo
lun
tary
Tu
rn
ov
er
Customer Service Strategy
high
low
-8.00
-7.00
-6.00
-5.00
-4.00
-3.00
-2.00
-1.00
0.00
low med high
HIWS
Perc.
Fin
acia
l P
erf.
Low Cost Strategy
high
low
Figure 5: HIWS and Business Level Strategy Interactions

81
-3.50
-3.00
-2.50
-2.00
-1.50
-1.00
-0.50
0.00
low med high
HIWS
Vo
lun
tary
Tu
rn
ov
er
Fast Changing
Environment
high
low
Figure 6: HIWS and Environment Interaction
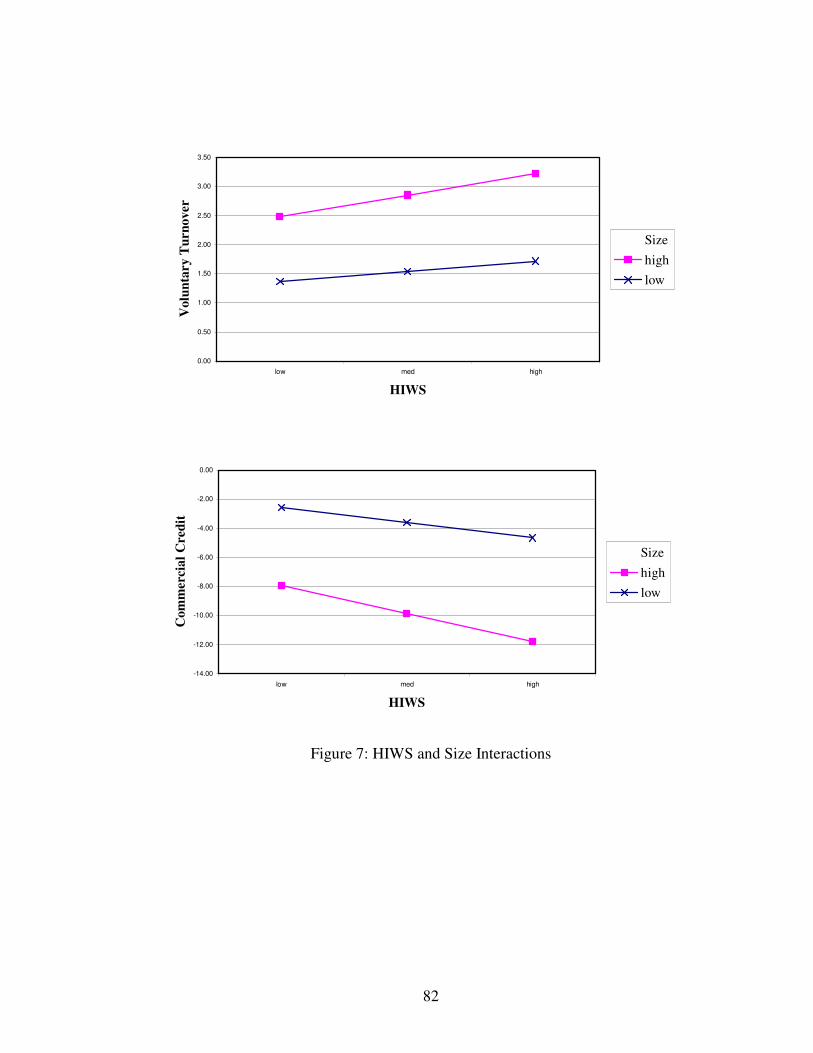
82
0.00
0.50
1.00
1.50
2.00
2.50
3.00
3.50
low med high
HIWS
Vo
lun
tary T
urn
ov
er
Size
high
low
-14.00
-12.00
-10.00
-8.00
-6.00
-4.00
-2.00
0.00
low med high
HIWS
Co
mm
erc
ial
Cred
it
Size
high
low
Figure 7: HIWS and Size Interactions

83
CHAPTER 8:
DISCUSSION
Summary of Findings and Implications
The purpose of this research was threefold 1) to find out whether or not HRM
contributed to performance in small businesses, 2) to use the context of small
businesses in order to gather meaningful measures of control variables not normally
used in past HR to performance research in order to provide a stronger test for the
impact of HRM on performance in small firms and 3) to use the ability to gather
meaningful control variables to test for interactions with those control variables and
HRM in its effect on performance. The research is important because very little
research has addressed the role of HRM in contributing to the performance of small
businesses (Heneman, Tansky, & Camp, 2000). In addition, recent research has
suggested that more needs to be done by the way of proper control variables to better
understand the relationship between HRM and performance (Wright et al, 2005).
HRM in Small Businesses. I hypothesized that HRM, in the form of high
involvement work systems would be positively related to employee level performance,
operational level performance, and financial performance in small businesses. The
data indicate strong evidence that HIWS are significantly related to performance in
small businesses at all three of these levels. The relationship was found to be
significant for all dependent variables except for the financial performance variable of
commercial credit rating.
That being said, the use of a HIWS was found to be significant with all other
dependent performance variables used for this study. This is a strong indication that
the relationships between HRM and performance in larger organizations can be

84
replicated in small organizations and that the relationship does indeed exist for small
businesses.
This is a significant contribution to the field of SHRM in that it expands past
SHRM research into the important area of small businesses. While not much is known
about HRM in small businesses, they make up a significant part of our economy both
from a labor as well as an employment standpoint. By demonstrating the existence of
a relationship between HRM and performance in this context, this research provides a
foundation upon which future SHRM research can build in attempting to better
understand this relationship and how it works.
One possible reason I failed to find a relationship between the use of HIWS
and the commercial credit score is that credit scores are not an effective measure of
firm performance. First, the relationship between an organization’s credit is not
necessarily directly related to performance. While it might be difficult for an
organization that is performing very poorly to meet is obligations to its creditors
resulting in a lower credit score, the inverse is not necessarily true. Organizations
performing very well do not necessarily need to meet their obligations to creditors
resulting in a high credit score. Organizations for reasons other than performance may
choose to pay late or otherwise not meet obligations to creditors resulting in a low
credit score or rating in spite of good performance.
Second, the data indicate that the credit score for the reasons mentioned above
or other reasons unknown is not a meaningful measure of performance (see table 9).
In analyzing the variables included in the different steps 1-3 of the hierarchical
regression analysis, it is interesting to note that commercial credit is not significantly
related to any other known driver of firm performance or HRM. Even size and age
which should be significantly related to the credit of an organization due to the fact
that a longer life and a larger sales base should both help an organization to meet is
85
credit obligations are marginally significant at best. This leads me to conclude that
despite my best efforts to find a more objective measure of performance, commercial
credit is not a meaningful measure of performance for small businesses.
While the purpose of this study was not to compare the effects of HRM in
small businesses to those in larger organizations, I did want to understand if the
models that I had created compared favorably to prior research. In order to gain a
basic understanding of how my research fit in with previous studies, I compared the R2
for my models with those of other studies using turnover and perceptual measures of
performance as dependent variables (see figure 6). The purpose of this exercise was
not to definitively understand how my study compared to others, but rather to compare
the variance explained to demonstrate that my study was explaining a similar amount
of variance when compared to previous work. From table 6 it can be seen that the
base model, which includes the HIWS variable and controls only from my study
produced R2
numbers that are somewhat lower that previous research while the full
model which included alternative performance drivers was in line with previous
research as far as effect sizes for the models. Overall, the models used in my study
appear to be comparable to other work using similar dependent variables. Because of
differences in the variables included in different models from different studies, I am
not able to make any claims about the effect of HRM in the small business setting
verses that of larger organizations, but it does raise some interesting questions for
future research.

86
Turnover
(base model)
Turnover (full
model)
Perceptual
Performance
(base model)
Perceptual
Performance
(full model)
Current Study
Perceptual Operational .14 .22
Perceptual Financial .10 .17
Employee Perceptual .11 .20
Turnover .08 .12
Delaney & Huselid (1996) .18
Bae & Lawler (2000) .34
Batt (2002) .17
Huselid (1995) .38
Figure 8. R2 comparisons with past studies using similar dependent variables
Alternative Performance Drivers. The second purpose of this research was to
use the context of small businesses in order to gather meaningful measures of control
variables not used in prior research. This was done in order to demonstrate a stronger
argument for the impact of HRM on performance by showing that HRM matters above
and beyond known drivers of small business performance.
Here again the data strongly support the hypothesis that HRM, specifically the
use of a HIWS, is significantly related to performance even in the presence of these
other known drivers of performance. With the exception of commercial credit rating
discussed above, this held true for employee level performance, operational
performance and financial performance.
It should be noted also, that while not specifically hypothesized, the change in
F statistic for step three which was the addition of the alternative performance drivers
was significant for all dependent variables except for voluntary turnover. This is a
strong indication that with the exception of voluntary turnover, the small business
performance variables included in this research were indeed alternative drivers of
performance lending even more credibility to the argument that HRM does contribute
to performance above and beyond other small business performance drivers.

87
The lack of significance for the change in F in the case of voluntary turnover is
not surprising. While it could be reasoned that human capital, business level strategy
and the environment are related to turnover, past research in small businesses using
these variables as performance drivers has tended to focus on more operational and
firm level performance rather that the very HR measure of turnover (Chrisman,
Bauerschmidt, & Hofer, 1999).
Overall, my findings provide a significant contribution to HRM research. By
using the context of small businesses, I was able to more thoroughly test the HRM to
performance model and demonstrate that HRM does matter even in the presence of
key performance drivers not historically used in SHRM research. This lends more
credibility to the argument that HRM matters. It is also a step in the right direction in
addressing the issue of causation. While demonstrating that HRM matters above
alternative performance drivers does not prove that HRM causes performance, it does
help by ruling out potential spurious relationships where performance might be caused
by another performance driver not included in the model (Wright et al, 2005).
Reduction in Effect Sizes. Hypotheses 3a and b that the inclusion of the
alternative drivers of performance would reduce the effects of HRM on performance
were not supported. Effect sizes from step 2 were well within confidence intervals
created using standard errors step 3. While this data do not support my hypotheses,
the findings here actually strengthen the argument for the impact of HRM on
performance. Even in the presence of alternative drivers of performance the effect of
HRM on performance is both significant and remains statistically constant. This
counters arguments that the discovered relationship between HRM and performance is
spurious at least with the performance drivers included here for this study.
There two reasons why this might be the case. First, the relationship between
HRM and performance is not spurious. Given my results with the more stringent test,
88
there is stronger evidence that there is a relationship between HRM and performance
and that this relationship is not the result of some other variable causing both HRM
and performance.
Second, the relationship is spurious, but I did not gather the correct variables.
A spurious relationship involves some other variable causing both high levels of HRM
and high levels of performance. It is possible that there are other variables not
included in this study for which this is the case. More research is needed to test for
this potential spurious relationship.
Regardless, my study makes a significant contribution in providing a stronger
test for the relationship between HRM and performance. By including the alternative
performance drivers in this study I have demonstrated that HRM is related to
performance above and beyond these other known drivers of performance. In
addition, I have demonstrated that the effect size or overall effect of HRM on
performance is not significantly reduced by the inclusion of other known drivers of
performance.
HR Interactions. My third purpose of this study was to use the context of small
businesses to test for interaction effects of HRM with other variables in the model.
Because the context of small businesses would allow me to collect meaningful
measures of some of the key performance drivers in small business, I was able to test
for the interactions of these performance drivers with HRM in contributing to
performance.
The data provided strong evidence for some of the hypothesized relationships
between small business performance drivers, HRM and performance. While there was
some evidence that moderating relationships existed, rate of change in the
environment, and size, the majority of the 40 interactions tested did not result in
significant findings.

89
One reason for this might be the general difficulty in finding significant
interactions in SHRM research. Researchers in the field of SHRM have had difficulty
finding meaningful interactions in the HRM to performance relationship (Becker and
Gerhart, 1996; Pfeffer, 1994). Small effect sizes and difficulty in detecting
interactions especially with scaled variables like those used in this study might have
limited my ability to get more support for my interaction hypotheses.
Another potential reason for the low number of significant interactions is that I
did not measure the right things. While my research focused on gathering information
on known small business performance drivers for testing interactions, it is possible
that other variables are driving differences. Variables such as leadership style or
personality might have a stronger impact on the HRM to performance relationship
than the variables I chose to use in this research.
Finally, the diversity of my sample may have constrained my ability to find
more significant interactions. While a diverse sample is good for generalizability, it
may be inhibiting my ability to find key interactions. It is possible that interactions
are specific to certain industries or to a certain size level within the small business
context or even to a certain strategy. My sample spans a wide range of sizes,
industries and business level strategies employed. Sample size limitations at this time
do not allow me to split up the sample and test for interactions under those specific
conditions.
Practical Implications. My findings may have important practical
implications in addition to the academic contributions discussed above. Managers and
owners of small businesses are constantly seeking new ways to improve their
performance and strengthen their condition with competitors. This research indicates
that the way people are managed in those organizations can play an important role.

90
Managers and owners of small businesses would do well to focus on how they
manage their human resources as this study demonstrates that HRM is a significant
predictor of various levels of performance in small businesses. Not only was HRM
shown to be a significant predictor of employee levels of performance by reducing
voluntary turnover, it was also shown that HRM was significantly related to higher
and more distal measures of performance such as financial and operational
performance. These are the very measures of performance found to be most important
in assessing success to the small business owners and managers interviewed as part of
the qualitative portion of this study.
Perhaps even more important from a practical standpoint, I found that the way
people are managed in small businesses was significantly related to performance
above and beyond other known performance drivers. This is significant to
practitioners because it demonstrates that HRM is important above and beyond some
of the more traditional performance drivers such as business level strategy. Managers
can expect to see additional benefits to effective HRM beyond those benefits they
might receive by having an effective business level strategy.
Finally, while the data did not provide strong support for all interactions, the
findings do have some practical implications for managers. For example, it appears
from this research that HRM matters more under certain circumstances such as when
the rate of change in the environment is great or in larger small businesses. While
more research is needed to tease out additional contingencies, it is of extreme
importance for practitioners to understand where effective people management might
matter more or even less.
Study Limitations and Future Research
It is important to acknowledge the limitations of this research and discuss how
they might be addressed in future research. First, with the exception of voluntary
91
turnover and commercial credit, I collected perceptual rather than objective measures
of performance. While research has demonstrated that perceptual measures of
performance are appropriate where more objective measures of performance are not
available, the research could be strengthened by the inclusion of more objective
performance measures (Dess & Robinson, 1984; Wall, et al, 2004; Delaney &
Huselid, 1996). While availability of objective performance measures in small
businesses is limited, future research might focus on small business databases such as
Dunn & Bradstreet to provide more objective performance measures.
A second limitation of this research is that I used only a limited number of
alternative performance drivers. As I discussed previously, past research has
demonstrated that small business performance is the result of top leader attributes,
organizational level attributes and environmental attributes (Baum, Locke and Smith,
2001). While I used components of each of these attributes in this research the
variables were not exhaustive by any means. It is possible that other variables such as
leadership behaviors, leader personality, other measure of business level strategy or
other environmental attributes also contribute to small business performance.
Inclusion of these variables in future research will strengthen the argument that HRM
does indeed contribute to performance even further.
A third limitation of this study is the potential for same source and perception
bias as a result of collecting the HRM variables as well as several of the dependent
variables from the same source at the same time. I attempted to reduce this bias
potential by also collecting more objective performance measure such as turnover and
commercial credit. In addition, performance was also collected from a second source
by asking the employees to rate the performance. In spite of these efforts, there is still
a potential for bias in the data due to the fact that the dependent and independent
variables were collected at the same time and from the same person. Future research

92
should attempt to avoid these biases by seeking multiple responses from individuals in
an effort to collect HR and performance variables at different times or using multiple
respondents to provide the different variables. A focus on more objective performance
measures as suggested above will also alleviate this limitation.
A fourth limitation of this study is the sample size. While a sample of 270 is
sufficient for the current study, as was mentioned previously, it did limit my ability to
perform additional analysis around the effects of specific industries, specific firm sizes
or specific business level strategies employed by organizations within the sample.
Future research using a diverse sample such as the sample in this study should work to
increase the sample size to allow for enough power to perform these additional
analyses. Alternatively, future research could also attempt to use more specified
samples such as within a single industry or a single size grouping in order to address
some of the issues specific to those different groups.
Notwithstanding the methodological limitations of this research, the findings
do raise some interesting questions for future research. For example, this study
provides evidence that the use of a HIWS contributes significantly to the performance
of small businesses, but that does not mean that the HIWS is the only or even the best
system of HRM for small businesses. Future research could extend the findings of this
study by looking at other HR systems such as high performance work systems, or high
commitment work systems to understand the role that different HRM systems play in
the performance of small businesses. In an interesting study, Baron, Hannan and
Burton (2001) found evidence of a cluster model of HRM systems where different
bundles of HRM components were important for different high tech start up firms.
Given this finding, it is possible that the ideal model of HRM for small businesses
does not match any model currently available from past SHRM research.
93
The results of the study showed some support for interactions or situations
under which HRM might matter more or less. Understanding these contingencies is
important for researchers and practitioners alike. Future research on HRM in small
businesses could build on my research by more thoroughly testing for some of these
contingency relationships. As was mentioned previously, the collection of alternative
contingency variables or a focus on specific industries, business size or strategy could
aid in this effort to understand the interactions or contingency relationships.
Finally, I argued that the inclusion of key small business performance drivers
was a step in the right direction to demonstrate cause in the HRM to performance
relationship. The context of small businesses is an ideal context for further
investigation into the issue of causality. In addition to the ability to use the reduced
complexity of the context to control for alternative drivers of performance, the context
of small businesses is an ideal setting for addressing the issue of temporal precedence
(Wright et al, 2005). Because of their size, small businesses are able to make changes
more quickly than larger organizations and likewise the impact of these changes is
likely to be felt more quickly. Because of this fact, the context of small businesses is a
good context for a longitudinal design looking at changes in HRM over time and their
subsequent impact on performance. The ability to implement changes more quickly
and the impact of those changes being felt more quickly will likely help to overcome
some of the limitations of past attempts to look HRM to performance relationships
using a longitudinal design (Wright et al, 2005).
Conclusion
In conclusion, my research contributes to our understanding of the role of
HRM in small businesses. Findings indicate that the use of a HIWS in small
businesses is significantly related to performance at multiple levels. My study extends
current SHRM research by focusing on small businesses, an area ignored by past
94
research, but an extremely important part of our economy. In addition, my study
strengthens our understanding of the HRM to performance relationship by ruling out
alternative performance drivers as the cause for the observed relationship between
HRM and performance. In this way, my study provides a more thorough test of the
HRM to performance relationship. While not fully supported, this research also
provided evidence for various contingency relationships.
By testing these relationships in the context of small businesses, this research
provides a foundation for future research. Because of the role they play in our
economy, the importance of small businesses and understanding the relationship
between HRM and their performance is of significant importance. In addition to this,
continued research using the context of small businesses has the potential to provide
valuable benefits in furthering our understanding of this complex relationship and
making significant strides in demonstrating that the relationship is indeed causal.

95
APPENDIX A
VARIABLE ITEMS
Independent Variable
HR FACTORS
Feedback (α. .78)
1. Managers follow a regular schedule in providing feedback to employees.
2. We have a formal process of performance appraisals to provide feedback to
employees.
3. We have formal job duties and descriptions so that employees know their roles
and responsibilities.
4. We use performance appraisals primarily to help employees identify new skills
to develop.
Discretion (α .70)
1. Managers closely monitor the day-to-day activities of employees.
2. Managers tightly control the pace and schedule at which employees complete
their work.
Selection Fit (α ..77)
1. Our hiring practices focus on how well the individual fits with the culture of
our company.
2. When interviewing applicants, we primarily assess their ability to work with
our current employees.
3. When selecting new employees, we primarily assess their overall fit with the
organization’s values.
Opportunity (α .72)
1. We sponsor company social events so employees can get to know one another.
2. We provide opportunities for employees to continue to learn and grow.
3. We sponsor outside activities (e.g., sports teams, events) to build a sense of
community.

96
Dependent Variables
Using the scale below, compare your organization’s performance over the last three
years to that of other organizations that do the same kind of work in terms of:
1 = worse 2 = slightly worse 3 = about the same
4 = slightly better 5= much better
Perceptual Operational Performance .67 (From the CEO )
1. Quality of products, services, or solutions?
2. Development of new products, services, or solutions?
3. Satisfaction of customers or clients?
Perceptual Operational Performance .82 (From the CEO)
1. Growth in sales?
2. Profitability?
3. Market share?
Please use the scale below to indicate the extent to which you agree with the following
questions regarding your company’s current performance.
1 = strongly disagree 2 = moderately disagree
3 = neutral 4 = moderately agree 5 = strongly agree
Perceptual Performance (From the Employees .88 ICC1- .24 ICC2- .66 )
1. This organization’s performance is much better than the performance of our
main competitors’.
2. This organization is achieving its full potential.
3. People are satisfied with the level of performance of this organization.
4. This organization does a good job of satisfying its customers.
Voluntary Turnover
Voluntary Turnover for prior year = (# of employees) / Total number of employees
Commercial Credit Rating
Dunn & Bradstreet rating of commercial credit scores rated from one to five reverse
coded so that 1 is the worst and 5 is the best.

97
Alternative Drivers of Small Business Performance
CEO Experience
The natural log of the industry experience and job tenure of the CEO added together
HR Resources (α .83)
1. The top managers at this company lack the knowledge needed to design and
implement effective employee management practices. (Reverse Coded)
2. The top managers here do not have the time or resources to effectively design
and implement effective employee management practices. (Reverse Coded)
Rate of Change (α .69)
1. There are frequent changes in technology in our industry.
2. Things change quickly in this industry.
Business Strategy
Businesses rated their top strategy in one of five categories created as dummy
variables
1. Innovation
2. Customer Service
3. Product Quality
4. Efficiency
Which organizational imperative best characterize your organization’s current
approach to the marketplace?
1. Continuously developing new products or services. (Innovation)
2. Continuously improving the quality of its products or services. (Quality)
3. Continually increasing the efficiency with which it operates. (Efficiency)
4. Continually adapting its products or services to customer needs. (Customer
Service)
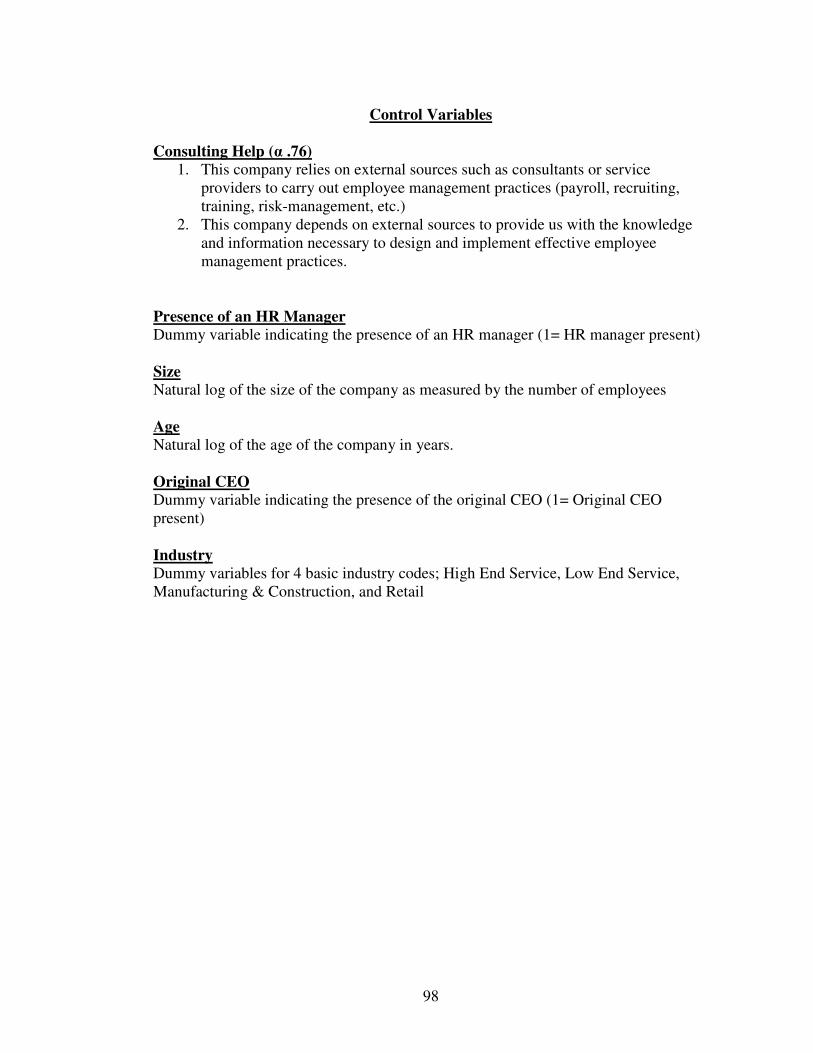
98
Control Variables
Consulting Help (α .76)
1. This company relies on external sources such as consultants or service
providers to carry out employee management practices (payroll, recruiting,
training, risk-management, etc.)
2. This company depends on external sources to provide us with the knowledge
and information necessary to design and implement effective employee
management practices.
Presence of an HR Manager
Dummy variable indicating the presence of an HR manager (1= HR manager present)
Size
Natural log of the size of the company as measured by the number of employees
Age
Natural log of the age of the company in years.
Original CEO
Dummy variable indicating the presence of the original CEO (1= Original CEO
present)
Industry
Dummy variables for 4 basic industry codes; High End Service, Low End Service,
Manufacturing & Construction, and Retail
99
APPENDIX B
ORIGINAL MANAGER AND EMPLOYEE SURVEYS
Included below are relevant portions of both the manager and employee surveys. The
full surveys included additional sections not relevant to this research and have been
omitted from this appendix.

100
GENERAL INSTRUCTIONS—TOP MANAGEMENT SURVEY
Before you begin, If you would prefer to complete this survey online, please go to: www.sri.cornell.edu/topmgmt/ and follow the instructions you find there.
We wish to thank you in advance for your participation in this study. In return for your participation, we will provide you with a summary report of our findings as well as a benchmark report comparing your company to an average of companies which are similar to yours in terms of size and industry. We are confident that these reports will benefit your organization and will provide important insights into ways of increasing organizational effectiveness. Please try to answer the questions as honestly and as candidly as possible. There are no trick questions: this is NOT a test, so there are no right or wrong answers. We suggest that you move through the survey quickly without spending too much time on any one question—your first response usually will be the most accurate. The survey will take some time to complete—we estimate about twenty minutes. You will probably find some redundancy in the questions. This is deliberate and is done for statistical reasons. Please answer the questions even if they seem similar to ones you’ve already answered; you need not go back to the previous questions to make sure that your answers are consistent. This survey is strictly confidential. Under no circumstances will your individual responses be made available to anyone other than the Cornell research team. Information from the survey will be compiled into overall research reports consisting of aggregated results from many companies. The results may be published at a later time in aggregate form only. Please remember, individual responses will not be a part of these reports and participating companies will not be identified in any publications or reports generated from this study. Please complete the survey within the next five business days and return to the Cornell research team using the preaddressed, stamped envelope provided. If you have any questions, please contact one of the research directors at the School of Industrial and Labor Relations at Cornell University:
Matt Allen Jeff Ericksen
[email protected] [email protected]
Dr. Chris Collins (607)255-8859

101
PART 1: PERSONAL AND COMPANY BACKGROUND INFORMATION
1. What is the name of your company?
____________________________________________ 2. In what industry does your company compete?
____________________________________________ 3. What is your title or position?
____________________________________________ 4. How many CEOs has your organization had including
the founder ____________ 5. When was the company founded? _______________ 6. Does your organization currently employ a manager
whose primary responsibilities are Human Resource Management? ( ) Yes ( ) No
7. If you answered yes to question 6, when did you begin
to employ a person in this role? _________________
8. How many years have you worked at your present company? _______ years _______ months
9. How many years have you worked in this industry?
_______ years _______ months 10. How many years have you held a position similar to
the one you currently hold? _______ years _______ months
11. How many employees does your organization currently employ? _____________
12. How many employees did your organization employ
three years ago? ______________ 13. How many employees left your organization in the last
year because they were terminated or released by the organization? ______________
14. How many employees quit your organization in the last
year? ________________
PART 2: BUSINESS ENVIRONMENT
1 = strongly disagree 2 = moderately disagree 3 = neutral 4 = moderately agree 5 = strongly agree Using the scale above, assess the degree to which the following statements characterize the uncertainty of the environment of your business.
_____
1. There is a high degree of fluctuation in the
demand for this organization’s products, services, or solutions.
_____ 2. There are frequent changes in technology in our
industry.
_____ 3. This organization faces stiff competition from
numerous other organizations.
_____ 4. It is easy to make money in this industry segment.
_____ 5. It is easy to understand this industry.
_____ 6. Things change quickly in this industry.
Using the scale above, assess the extent to which your company’s financial performance is dependent on the following:
_____
7. Continuously developing new products or
services.
_____ 8. Continually seeking to acquire new customers.
_____ 9. Continuously improving the quality of its products
or services.
_____ 10. Continually increasing the efficiency with which it
operates.
_____ 11. Continually adapting its products or services to
customer needs.
_____ 12. Continually responding to a rapidly changing
technological environment.
_____ _____
13. Which two organizational imperatives best
characterize your organization’s current approach to the marketplace? Please choose two imperatives from questions 7-12 above:

102
PART 3: CHANGES IN EMPLOYMENT In the following two tables, please record the total number of employees that your organization (1) currently employs and (2) employed 3 years ago in the following areas:
Currently
3 Years Ago
Executives
Professional and managerial
Technical and scientific
Hourly
Currently 3 Years Ago
Regular full-time workers. Individuals on the organization’s payroll who work a full work week and a full work year.
Part-time workers. Individuals on your company’s payroll who work less than a full work week and/or less than a full work year. Examples include part-time, on-call, and seasonal hires.
Contract workers. Individuals who work at your organization but who are paid by another organization. Examples include staff from temporary agencies or contractors.
PART 4: ALIGNMENT AND ADAPTATION Please use the scale below to indicate the extent to which you agree with each of the following statements.
1 = strongly disagree 2 = moderately disagree 3 = neutral 4 = moderately agree 5 = strongly agree
_____
1. This company always has the right number of
people.
_____ 2. We often have more work to do than employees to
do it.
_____ 3. This company always has an appropriately sized
workforce.
_____ 4. This company has all the expertise it needs to be
successful.
_____ 5. This company has the people with the right
knowledge and skill sets.
_____ 6. We sometimes lack people with the knowledge
and skills necessary to do the job right.
_____ 7. This company tightly controls the costs associated
with managing its employees.
_____ 8. We would benefit from investing more heavily in
employee management practices.
_____ 9. This company is at a competitive disadvantage
because of its employee management costs.
_____ 10. The people in this company are highly focused on
realizing organizational results.
_____ 11. The people in this company are always working to
improve company performance.
_____ 12. The people in this company always act in ways
that help the organization achieve its goals.
_____ 13. This company effectively utilizes its people at all
times.
_____ 14. This company provides people with ample
opportunities to do their best possible work.
_____ 15. This company consistently gets the most out of its
employees’ knowledge and skills.
_____ 16. Our employees’ knowledge and skills have
changed greatly over the last three years.
_____ 17. Three years ago, this organization employed
completely different types of employees.
_____ 18. Compared to three years ago, our employees
possess different kinds of knowledge and skills.
_____ 19. The size of this company’s workforce has changed
dramatically over the last three years.
_____ 20. The number of employees who work at this
organization has fluctuated over the last 3 years.
_____ 21. The size of this company’s workforce has
remained stable over the last three years.
_____ 22. Over the last three years, people in this
organization shifted roles many times.
_____ 23. Our employees are working on completely
different assignments now than three years ago.
_____ 24. Every employee’s role at this organization has
changed over the last three years.
_____ 25. We do a better job managing employee
management costs now than three years ago.
_____ 26. Over the last three years, this organization has
become more competitive with respect to employee management costs.
_____ 27. Compared to three years ago, we do a
considerably better job managing the costs of employee management practices.
_____ 28. The way work gets done in this organization has
changed dramatically over the last three years.
_____ 29. In the last three years, the ways that employees
contribute to this organization’s success have changed considerably.
_____ 30. What people in this organization do on a daily
basis has changed a lot over the last three years.

103
PART 5: ASSESSMENT OF EMPLOYEE MANAGEMENT PRACTICES
The items below are about the practices your company uses to manage its employees. Using the scale below, please write in the
number that indicates your agreement with each of the following statements.
1 = strongly disagree 2 = moderately disagree 3 = neutral 4 = moderately agree 5 = strongly agree
_____ 1. When screening job applicants, we mainly assess
their fit to the requirements of specific job openings.
_____ 2. The practices that we use for selection focus on the
potential long-term contribution of applicants.
_____ 3. We tend to evaluate candidates based on their ability
to contribute immediately in their job without training.
_____ 4. Our hiring practices focus on how well the individual
fits with the culture of our company.
_____ 5. When screening applicants for jobs, we focus on the
ability to perform right away.
_____ 6. We will leave a positions open until we can find the
best and brightest possible new employee.
_____ 7. When interviewing applicants, we primarily assess
their ability to work with our current employees.
_____ 8. We look to elite sources (e.g., top universities, head
hunters) to find the best available talent.
_____ 9. When selecting new employees, we primarily assess
their overall fit with the organization’s values.
_____ 10. Managers closely monitor the day-to-day activities of
employees.
_____ 11. We have formal job duties and descriptions so that
employees know their roles and responsibilities.
_____ 12. Peers have a great deal of input into the
performance evaluations of other employees.
_____ 13. We give employees a great deal of discretion to
monitor their own performance.
_____ 14. We employ a high percentage of managers and
supervisors relative to other organizations.
_____ 15. Managers follow a regular schedule in providing
feedback to employees.
_____ 16. In general, employees are expected to provide
feedback to one another on job performance.
_____ 17. Managers tightly control the pace and schedule at
which employees complete their work.
_____ 18. Employees are trusted to get the job done right the
first time without direct oversight.
_____ 19. Employees in this organization are expected to track
one another’s work and effort.
_____ 20. We have a formal process of performance appraisals
to provide feedback to employees.
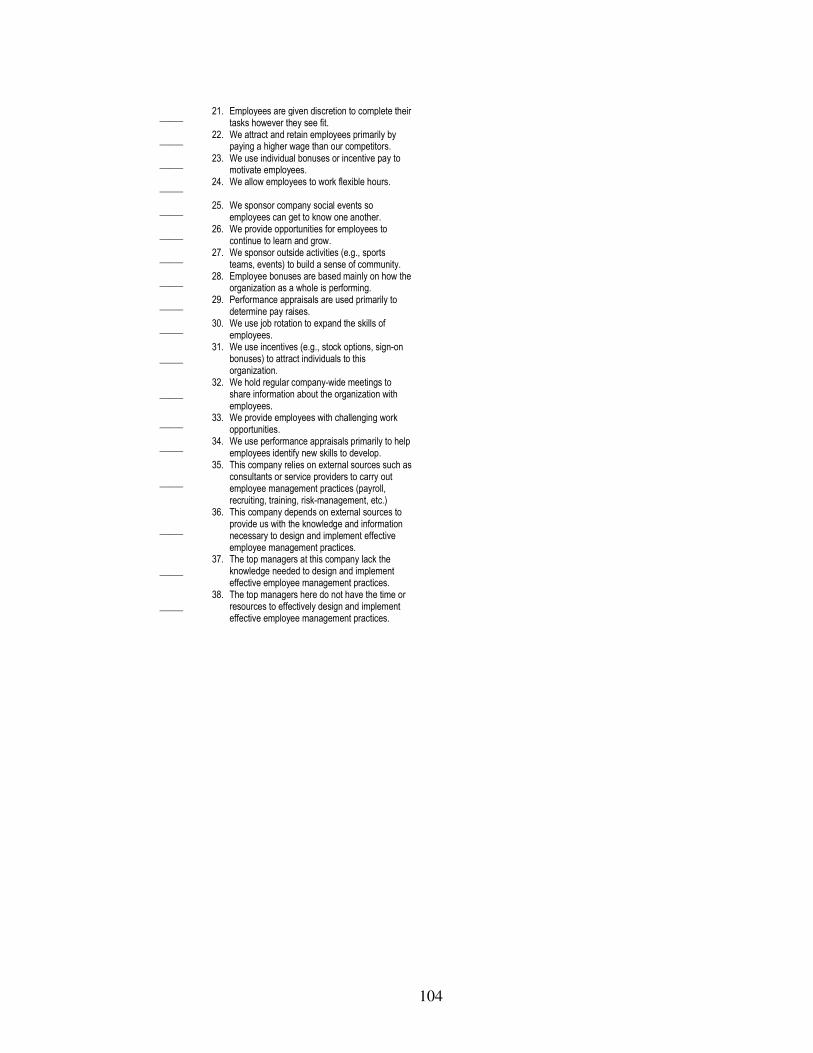
104
_____ 21. Employees are given discretion to complete their
tasks however they see fit.
_____ 22. We attract and retain employees primarily by
paying a higher wage than our competitors.
_____ 23. We use individual bonuses or incentive pay to
motivate employees.
_____ 24. We allow employees to work flexible hours.
_____ 25. We sponsor company social events so
employees can get to know one another.
_____ 26. We provide opportunities for employees to
continue to learn and grow.
_____ 27. We sponsor outside activities (e.g., sports
teams, events) to build a sense of community.
_____ 28. Employee bonuses are based mainly on how the
organization as a whole is performing.
_____ 29. Performance appraisals are used primarily to
determine pay raises.
_____ 30. We use job rotation to expand the skills of
employees.
_____ 31. We use incentives (e.g., stock options, sign-on
bonuses) to attract individuals to this organization.
_____ 32. We hold regular company-wide meetings to
share information about the organization with employees.
_____ 33. We provide employees with challenging work
opportunities.
_____ 34. We use performance appraisals primarily to help
employees identify new skills to develop.
_____
35. This company relies on external sources such as consultants or service providers to carry out employee management practices (payroll, recruiting, training, risk-management, etc.)
_____
36. This company depends on external sources to provide us with the knowledge and information necessary to design and implement effective employee management practices.
_____ 37. The top managers at this company lack the
knowledge needed to design and implement effective employee management practices.
_____ 38. The top managers here do not have the time or
resources to effectively design and implement effective employee management practices.
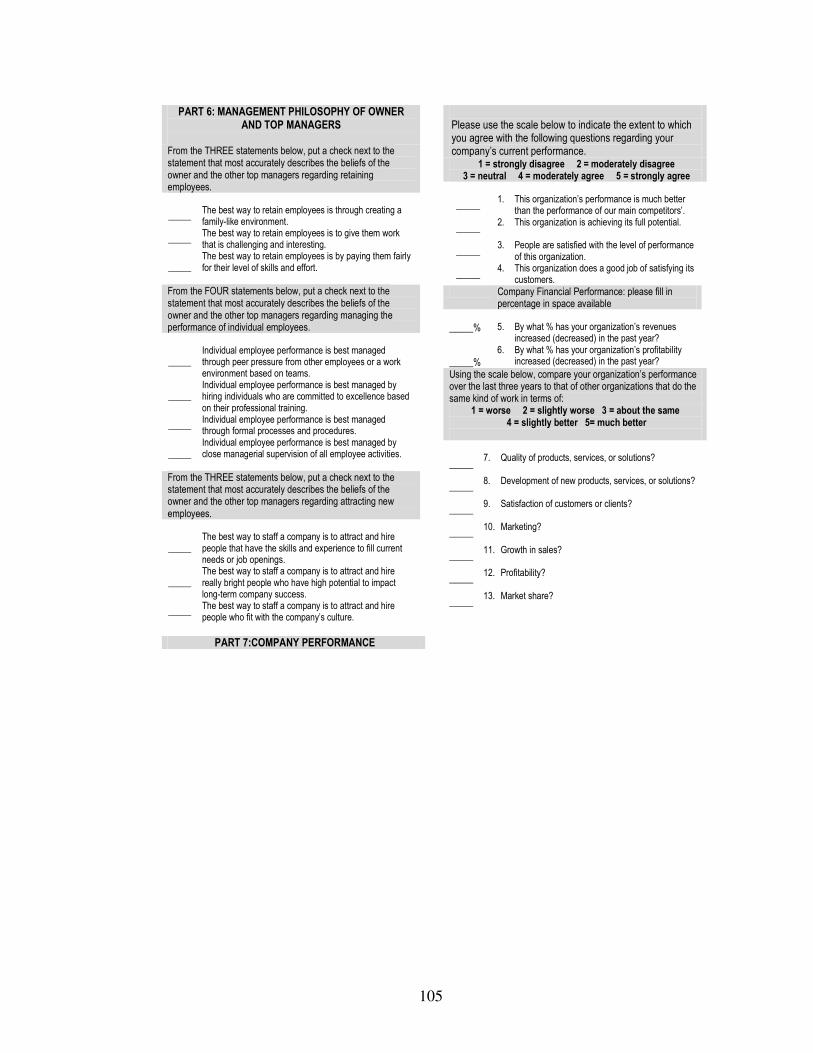
105
PART 7:COMPANY PERFORMANCE
Please use the scale below to indicate the extent to which you agree with the following questions regarding your company’s current performance.
1 = strongly disagree 2 = moderately disagree 3 = neutral 4 = moderately agree 5 = strongly agree
_____
1. This organization’s performance is much better
than the performance of our main competitors’.
_____ 2. This organization is achieving its full potential.
_____ 3. People are satisfied with the level of performance
of this organization.
_____ 4. This organization does a good job of satisfying its
customers.
Company Financial Performance: please fill in percentage in space available
_____%
5. By what % has your organization’s revenues
increased (decreased) in the past year?
_____%
6. By what % has your organization’s profitability increased (decreased) in the past year?
Using the scale below, compare your organization’s performance over the last three years to that of other organizations that do the same kind of work in terms of:
1 = worse 2 = slightly worse 3 = about the same 4 = slightly better 5= much better
_____
7. Quality of products, services, or solutions?
_____ 8. Development of new products, services, or solutions?
_____ 9. Satisfaction of customers or clients?
_____ 10. Marketing?
_____ 11. Growth in sales?
_____ 12. Profitability?
_____ 13. Market share?
PART 6: MANAGEMENT PHILOSOPHY OF OWNER AND TOP MANAGERS
From the THREE statements below, put a check next to the statement that most accurately describes the beliefs of the owner and the other top managers regarding retaining employees.
_____
The best way to retain employees is through creating a family-like environment.
_____ The best way to retain employees is to give them work that is challenging and interesting.
_____ The best way to retain employees is by paying them fairly for their level of skills and effort.
From the FOUR statements below, put a check next to the statement that most accurately describes the beliefs of the owner and the other top managers regarding managing the performance of individual employees.
_____
Individual employee performance is best managed through peer pressure from other employees or a work environment based on teams.
_____ Individual employee performance is best managed by hiring individuals who are committed to excellence based on their professional training.
_____ Individual employee performance is best managed through formal processes and procedures.
_____ Individual employee performance is best managed by close managerial supervision of all employee activities.
From the THREE statements below, put a check next to the statement that most accurately describes the beliefs of the owner and the other top managers regarding attracting new employees.
_____
The best way to staff a company is to attract and hire people that have the skills and experience to fill current needs or job openings.
_____ The best way to staff a company is to attract and hire really bright people who have high potential to impact long-term company success.
_____ The best way to staff a company is to attract and hire people who fit with the company’s culture.

106
GENERAL INSTRUCTIONS—EMPLOYEE SURVEY
Before you begin, If you would prefer to complete this survey online, please go to: www.sri.cornell.edu/topemployee/ and follow the instructions you find there. This survey is designed to find out about the perceptions of employees within your organization. Key themes covered in the survey concern your background and your perceptions of certain characteristics of your organization and work. We believe that employee beliefs about what is going on in the company are very important, therefore, we are trying to assess your beliefs about the company, not those of the owner or your manager. Please try to answer the questions as honestly and as candidly as possible. There are no trick questions: this is NOT a test, so there are no right or wrong answers. We suggest that you move through the survey quickly without thinking about it too much—your first response usually will be the most accurate. The survey appears somewhat lengthy, but should take approximately 15 minutes to complete. Also, you will probably find some redundancy in the questions. This is deliberate and is done for statistical reasons. Please answer the questions even if they seem similar to ones you’ve already answered; you need not go back to the previous questions. Some questions ask you to assess fairly specific management practices and/or to reflect back over three years. Please answer these questions to the best of your ability even if you have not been with the company for three years or if you are somewhat unsure of the answer. This is a strictly confidential survey. Under no circumstances will your individual responses be made available to anyone in your organization. Information from the survey will be compiled at the University into overall research reports consisting of aggregated results from many individuals across many companies. The results may be published at a later time in aggregate form only. Please remember, individual responses will not be a part of these reports and will not be available to anyone except the research team. In advance, we wish to thank you for your participation in this study. We are confident that results of this study will benefit your organization and will provide important insights into ways of increasing organizational effectiveness. Please complete the survey within the next five business days, place it in the attached pre-paid envelope and send your survey back to the researchers using the preaddressed, stamped envelope provided. If you have any questions, please contact one of the research directors at Cornell University:
Matt Allen Jeff Ericksen e-mail: [email protected] e-mail: [email protected]
Dr. Christopher Collins Phone: (607) 255-8859
e-mail: [email protected] fax: (607) 255-1836
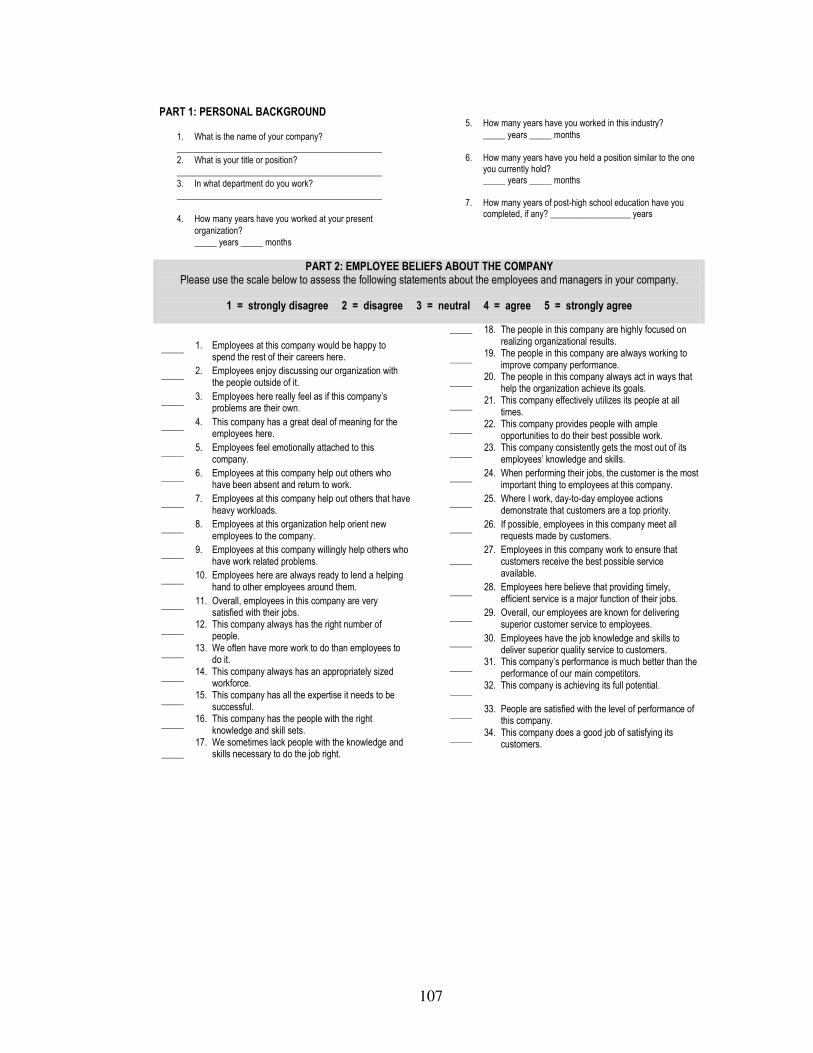
107
PART 1: PERSONAL BACKGROUND
1. What is the name of your company?
______________________________________________
2. What is your title or position?
______________________________________________
3. In what department do you work?
______________________________________________
4. How many years have you worked at your present
organization?
_____ years _____ months
5. How many years have you worked in this industry?
_____ years _____ months
6. How many years have you held a position similar to the one
you currently hold? _____ years _____ months
7. How many years of post-high school education have you completed, if any? __________________ years
PART 2: EMPLOYEE BELIEFS ABOUT THE COMPANY Please use the scale below to assess the following statements about the employees and managers in your company.
1 = strongly disagree 2 = disagree 3 = neutral 4 = agree 5 = strongly agree
_____
1. Employees at this company would be happy to spend the rest of their careers here.
_____ 2. Employees enjoy discussing our organization with
the people outside of it.
_____ 3. Employees here really feel as if this company’s
problems are their own.
_____ 4. This company has a great deal of meaning for the employees here.
_____ 5. Employees feel emotionally attached to this
company.
_____ 6. Employees at this company help out others who have been absent and return to work.
_____ 7. Employees at this company help out others that have
heavy workloads.
_____ 8. Employees at this organization help orient new
employees to the company.
_____ 9. Employees at this company willingly help others who
have work related problems.
_____ 10. Employees here are always ready to lend a helping
hand to other employees around them.
_____ 11. Overall, employees in this company are very satisfied with their jobs.
_____ 12. This company always has the right number of
people.
_____ 13. We often have more work to do than employees to
do it.
_____ 14. This company always has an appropriately sized
workforce.
_____ 15. This company has all the expertise it needs to be
successful.
_____ 16. This company has the people with the right
knowledge and skill sets.
_____
17. We sometimes lack people with the knowledge and skills necessary to do the job right.
_____ 18. The people in this company are highly focused on realizing organizational results.
_____ 19. The people in this company are always working to
improve company performance.
_____ 20. The people in this company always act in ways that
help the organization achieve its goals.
_____ 21. This company effectively utilizes its people at all
times.
_____ 22. This company provides people with ample
opportunities to do their best possible work.
_____ 23. This company consistently gets the most out of its
employees’ knowledge and skills.
_____ 24. When performing their jobs, the customer is the most
important thing to employees at this company.
_____ 25. Where I work, day-to-day employee actions
demonstrate that customers are a top priority.
_____ 26. If possible, employees in this company meet all requests made by customers.
_____ 27. Employees in this company work to ensure that
customers receive the best possible service available.
_____ 28. Employees here believe that providing timely,
efficient service is a major function of their jobs.
_____ 29. Overall, our employees are known for delivering
superior customer service to employees.
_____ 30. Employees have the job knowledge and skills to deliver superior quality service to customers.
_____ 31. This company’s performance is much better than the
performance of our main competitors.
_____ 32. This company is achieving its full potential.
_____ 33. People are satisfied with the level of performance of
this company.
_____ 34. This company does a good job of satisfying its
customers.

108
REFERENCES
Appelbaum, E., Bailey, T, Berg, P., & Kalleberg, A. (2000). Manufacturing
advantage. Ithaca, NY: ILR Press.
Arthur, J. B. (1994). Effects of human resource systems on manufacturing
performance and turnover. Academy of Management Journal, 37(3), 670-687.
Barney, J. (1991). Firm resources and sustained competitive advantage. Journal of
Management, 17(1), 99.
Baron, J. N., Hannan, M. T., & Burton, D. M. (2001). Labor Pains: Change in
Organizational Models and Employee Turnover in Young, High-Tech Firms.
American Journal of Sociology, 106. 960-1012.
Batt, R. (2002). Managing customer services: Human resource practices, quit rates,
and sales growth. Academy of Management Journal, 45(3), 587.
Baum, J. R., & Locke, E. A. (2004). The relationship of entrepreneurial traits, skill,
and motivation to subsequent venture growth. Journal of Applied Psychology, 89(4),
587-598.
Baum, J. R., Locke, E. A., & Smith, K. G. (2001). A multidimensional model of
venture growth. Academy of Management Journal, 44(2), 292.
Baum, J. R., & Wally, S. (2003). Strategic decision speed and firm performance.
Strategic Management Journal, 24(11), 1107.
Becker, B., & Gerhart, B. (1996). The impact of human resource management on
organizational performance: Progress and prospects. Academy of Management
Journal, 39(4), 779.
Blau, P.M., & R. A. Schoenherr. The Structure of Organizations. New York: Basic
Books.
Bourgeois III, L. J., & Eisenhardt, K. M. (1988). Strategic decision process in high
velocity environments: Four cases in the microcomputer industry. Management
Science, 34(7), 816.
Box, T. M., & White, M. A. (1993). A contingency model of new manufacturing firm
performance. Entrepreneurship: Theory & Practice, 18(2), 31.
Boxall, P. (1998). Achieving competitive advantage through human resource strategy:
Towards a theory of industry dynamics. Human Resource Management Review, 8(3),
265.

109
Boxall, P., & Purcell, J. (2000). Strategic human resource management: Where have
we come from and where should we be going? International Journal of Management
Reviews, 2(2), 183.
Brockhaus, R. H. (1980). Psychological and environmental factors which distinguish
the successful from the unsuccessful entrepreneur: A longitudinal study. Academy of
Management Proceedings, 368.
Cardon, M. S., & Stevens, C. E. (2004). Managing human resources in small
organizations: What do we know? Human Resource Management Review, 14(3), 295-
323.
Chaganti, R., Chaganti, R., & Mahajan, V. (1989). Profitable small business strategies
under different types of competition. Entrepreneurship: Theory & Practice, 13(3), 21.
Chrisman, J. J., Bauerschmidt, A., & Hofer, C. W. (1998). The determinants of new
venture performance: An extended model. Entrepreneurship: Theory & Practice,
23(1), 5.
Chrisman, J.J., Bauerschmidt, A., & Hofer, C.W. (1998) The determinants of new
venture performance: and extended model. Entrepreneurship Theory and Practice.
Fall, 5-29
Ciavarella, M.A. (2003). The adoption of high-involvement practices and processes in
emergent and developing firms: A descriptive and prescriptive approach. Human
Resource Management, 42:4 337-356
Collins, C. J., & Clark, K. D. (2003). Strategic human resource practices, top
management team social networks, and firm performance: The role of human resource
practices in creating organizational competitive advantage. Academy of Management
Journal, 46(6), 740-751.
Cooper, A. C., Willard, G. E., & Woo, C. Y. (1986). Strategies of high performing
new and small firms: A reexamination of the niche concept. Journal of Business
Venturing, 1(3), 247.
Cook D, & Campbell, D. (1979). Quasi-Experimentation. New York: Holt Rinehart.
Delaney, J. T., & Huselid, M. A. (1996). The impact of human resource management
practices on perceptions of organizational performance. Academy of Management
Journal, 39(4), 949.
Delery, J. E. (1998). Issues of fit in strategic human resource management:
Implications for research. Human Resource Management Review, 8(3), 289.

110
Delery, J. E., & Doty, D. H. (1996). Modes of theorizing in strategic human resource
management: Tests of universalistic, contingency.. Academy of Management Journal,
39(4), 802.
Deshpande, S. P., & Golhar, D. Y. (1994). HRM practices in large and small
manufacturing firms: A comparative study. Journal of Small Business Management,
32(2), 49.
Dess, G. G., & Beard, D. W. (1984). Dimensions of organizational task environments.
Administrative Science Quarterly, 29(1), 52.
Dess, G.G., & Robinson, R.B., (1984). Measuring organizational performance in the
absence of objective measures: the case of the privately-held firm and conglomerate
business unit. Strategic Management Journal. 5, 267-273.
Dyer, L. (1984). Studying human resource strategy. Industrial Relations, 23(2)
Dyer, L., & Reeves, T. (1995). Human resource strategies and firm performance:
What do we know and where do we need to go? International Journal of Human
Resource Management, 6(3), 656.
Eisenhardt, K. M., & Schoonhoven, C. B. (1990). Organizational growth: Linking
founding team, strategy, environment, and growth among U.S. semiconductor
ventures, 1978-1988. Administrative Science Quarterly, 35(3), 504-529.
Feeser, H. R., & Willard, G. E. (1990). Founding strategy and performance: A
comparison of high and low growth high tech firms. Strategic Management Journal,
11(2), 87-98.
Finkelstein, S., & Hambrick, D.C. (1996). Strategic Leadership, Top Executives and
Their Effects on Organizations. West Publishing Company, St. Paul, MN
Gartner, W. B. (2001). Is there an elephant in entrepreneurship? blind assumptions in
theory development. Entrepreneurship: Theory & Practice, 25(4), 27.
Gerhart, B., & Milkovich, G. T. (1990). Organizational differences in managerial
compensation and financial performance. Academy of Management Journal, 33(4),
663.
Ginn, C. W., & Sexton, D. L. (1990). A comparison of the personality type
dimensions of the 1987 inc. 500 company Founders/CEOs with those of slower-
growth firms. Journal of Business Venturing, 5(5), 313.

111
Guthrie, J. P., Spell, C. S., & Nyamori, R. O. (2002). Correlates and consequences of
high involvement work practices: The role of competitive strategy. International
Journal of Human Resource Management, 13(1), 183-197.
Hambrick, D. C., & Mason, P. A. (1984). Upper echelons: The organization as a
reflection of its top managers. Academy of Management Review, 9(2), 193.
Hattrup, G.P., & Kleiner, B.H. (1993). How to establish the proper span of control for
managers. Industrial Management. 35(6) 28-29.
Heneman, R. L., Tansky, J. W., & Camp, S. M. (2000). Human resource management
practices in small and medium-sized enterprises: Unanswered questions and future
research perspectives. Entrepreneurship: Theory & Practice, 25(1), 11.
Hess, D. W. (1987). Relevance of small business courses to management needs.
Journal of Small Business Management, 25(1), 26.
Hitt, M. A., Bierman, L., Shimizu, K., & Kochhar, R. (2001). Direct and moderating
effects of human capital on strategy and performance in professional service firms: A
resource-based perspective. Academy of Management Journal, 44(1), 13.
Hitt, M.A., Ireland, D.R., & Hoskisson, R.E. (2005). Strategic Management
Competitiveness and Globalization. Thompson South-Western, USA
Hornsby, J. S., & Kuratko, D. F. (2003). Human resource management in U.S. small
businesses: A replication and extension. Journal of Developmental Entrepreneurship,
8(1), 73.
Hornsby, J. S., & Kuratko, D. F. (1990). Human resource management in small
business: Critical issues for the 1990's. Journal of Small Business Management, 28(3),
9.
Huselid, M. A. (1995). The impact of human resource management practices on
turnover, productivity, and corporate.. Academy of Management Journal, 38(3), 635.
Jackson, S.E., Schuler, R.S., & Rivero, C.J. (1989). Organizational Characteristics as
Predictors of Personnel Practices. Personnel Psychology. 43(4) 727-786
Konrad, A. M., & Mangel, R. (2000). The impact of work-life programs on firm
productivity. Strategic Management Journal, 21(12), 1225.
Lado, A. A., & Wilson, M. C. (1994). Human resource systems and sustained
competitive advantage: A competency-based perspective. Academy of Management
Review, 19(4), 699-727.

112
Lee, D. Y., & Tsang, E. W. K. (2001). The effects of entrepreneurial personality,
background and network activities on venture growth*. Journal of Management
Studies, 38(4), 583.
Mansi, S. A., & Reeb, D. M. (2002). Corporate diversification: What gets discounted?
Journal of Finance, 57(5), 2167-2183.
Macduffie, J. P. (1995). Human resource bundles and manufacturing performance:
Organizational logic and flexible. Industrial & labor relations review, 48(2), 197.
McNamara, G. M., Luce, R. A., & Tompson, G. H. (2002). Examining the effect of
complexity in strategic group knowledge structures on firm performance. Strategic
Management Journal, 23(2), 153.
Melicher, R. W., Rush, D. F., & Winn, D. N. (1976). Degree of industry concentration
and market risk-return performance. Journal of Financial & Quantitative Analysis,
11(4), 627.
Miles, M. P., Covin, J. G., & Heeley, M. B. (2000). The relationship between
environmental dynamism and small firm structure, strategy, and performance. Journal
of Marketing Theory & Practice, 8(2), 63.
Miles, R. E., & Snow, C. C. (1984). Designing strategic human resources systems.
Organizational Dynamics, 13(1), 36.
Montago, R. V., Kuratko, D. F., & Scarcella, J. H. (1986). Perception of
entrepreneurial success characteristics. American Journal of Small Business, 10(3), 25.
Newbert, S. L. (2005). New firm formation: A dynamic capability perspective. Journal
of Small Business Management, 43(1), 55-77.
Osterman, P. (1995). Work/Family programs and the employment relationship.
Administrative Science Quarterly, 40(4), 681-700.
Perry-Smith, J. E., & Blum, T. C. (2000). Work-family human resource bundles and
perceived organizational performance. Academy of Management Journal, 43(6), 1107.
Pfeffer, J. (1994). In NA (Ed.), Competitive advantage through people: Un-leashing
the power of the workforce (NA ed.). Boston: Harvard Business School Press.
Porter, M., E. (1985). Competitive advantage. New York: New York Free Press.
Porter, M. E. (1980). Competitive strategy. New York: New York Free Press.
Rogers, E. W., & Wright, P. M. (1998). Measuring organizational performance in
strategic human resource management: Problems, prospects, and performance
information markets. Human Resource Management Review, 8(3), 311.
113
Russell, J.S., Terborg, J.R., & Powers, M.L. (1985) Organizational Performance and
Organizational Level Training and Support. Personnel Psychology, 38(4) 849
Sandberg, W. R., & Hofer, C. W. (1987). Improving new venture performance: The
role of strategy, industry structure, and the entrepreneur. Journal of Business
Venturing, 2(1), 5.
Schendel, D. E., & Hofer, C. W. (1979). Strategic management: A new view of
business policy and planning. Boston: Little, Brown.
Schuler, R.S., & Jackson, S.E. (1987). Linking Competitive Strategies with Human
Resource Management Practices. Academy of Management Executive, 1(3), 207-219
Shane, S., Locke, E. A., & Collins, C. J. (2003). Entrepreneurial motivation. Human
Resource Management Review, 13(2), 257.
Shane, S., & Venkataraman, S. (2000). The promise of entrepreneurship as a field of
research. Academy of Management Review, 25(1), 217-226.
Shaw, J. D., Gupta, N., & Delery, J. E. (2002). Pay dispersion and workforce
performance: Moderating effects of incentives and interdependence. Strategic
Management Journal, 23(6), 491.
Snell, S. A., & Youndt, M. A. (1995). Human resource management and firm
performance: Testing a contingency model of executive controls. Journal of
Management, 21(4), 711.
Tsui, A. S., Pearce, J. L., Porter, L. W., & Tripoli, A. M. (1997). Alternative
apporoaches to the employee-organization relationship: Does investment in emplyees..
Academy of Management Journal, 40(5), 1089.
United States Small Business Administration. See also www.sba.gov
Veliyath, R., & Shortell, S. M. (1993). Strategic orientation, strategic planning system
characteristics and performance. Journal of Management Studies, 30(3), 359.
Wai-Kwong, F. Y., Priem, R. L., & Cycyota, C. S. (2001). The performance effects of
human resource managers' and other middle managers' involvement in strategy
making under different business-level strategies: The case in hong kong. International
Journal of Human Resource Management, 12(8), 1325-1346.
Wall, T.D., Michie, J., Patterson, M., Wood, S.J., Sheehan, M., Clegg, C.W., & West,
M. (2004). On the validity of subjective measures of company performance.
Personnel Psychology. 57, 95-118.

114
Welbourne, T. M., & Andrews, A. O. (1996). Predicting the performance of initial
public offerings: Should human resource management be in.. Academy of
Management Journal, 39(4), 891.
Welbourne, T. M., & Cyr, L. A. (1999). The human resource executive effect in initial
public offering firms. Academy of Management Journal, 42(6), 616.
Wernerfelt, B. (1984). A resource-based view of the firm. Strategic Management
Journal, 5(2), 171-180.
Wiklund, J., & Shepherd, D. (2003). Aspiring for, and achieving growth: The
moderating role of resources and opportunities. Journal of Management Studies, 40(8),
1919-1941.
Wright, P. M., Dunford, B. B., & Snell, S. A. (2001). Human resources and the
resource based view of the firm. Journal of Management, 27(6), 701.
Wright, P. M., Gardner, T. M., Moynihan, L. M., & Allen, M. R. (2005). The
relationship between hr practices and firm performance: Examining causal order.
Personnel Psychology, 58(2), 409-446.
Wright, P. M., & McMahan, G. C. (1992). Theoretical perspectives for strategic
human resource management. Journal of Management, 18(2), 295.
Wright, P. M., McMahan, G. C., & McWilliams, A. (1994). Human resources and
sustained competitive advantage: A resource-based perspective. International Journal
of Human Resource Management, 5(2), 301.
Wright, P. M., & Smart, D. L. (1995). Matches between human resources and strategy
among NCAA basketball teams. Academy of Management Journal, 38(4), 1052.
Youndt, M. A., Snell, S. A., Dean, J. W., Jr, & Lepak, D. P. (1996). Human resource
management, manufacturing strategy, and firm performance. Academy of
Management Journal, 39(4), 836.