Strategic Fixed Income Strategy · Italy 2 2 SEK 2 HY Industrial 3 Spain 2 2 NOK 2 HY Utility 3 ......
34
For Institutional/Investment Professional Use Only. Not for distribution to the public. Daniel S. Janis III Senior Managing Director, Senior Portfolio Manager David Zielinski, CFA Managing Director, Fixed Income Portfolio Specialist Nancy C. Irving Managing Director, Institutional Sales Kevin Brady, CRPC Associate Director, John Hancock Asset Management , A Division of Manulife Asset Management November 10, 2017 Strategic Fixed Income Strategy For a discussion of the risks associated with this strategy, please see the Investment Considerations page at the end of the presentation. Prepared for Boston Public Library
Transcript of Strategic Fixed Income Strategy · Italy 2 2 SEK 2 HY Industrial 3 Spain 2 2 NOK 2 HY Utility 3 ......

For Institutional/Investment Professional Use Only.
Not for distribution to the public.
Daniel S. Janis IIISenior Managing Director, Senior Portfolio Manager
David Zielinski, CFAManaging Director, Fixed Income Portfolio Specialist
Nancy C. IrvingManaging Director, Institutional Sales
Kevin Brady, CRPCAssociate Director, John Hancock Asset Management , A Division of Manulife Asset Management
November 10, 2017
Strategic Fixed Income Strategy
For a discussion of the risks associated with this strategy, please see the Investment Considerations page at the end of the presentation.
Prepared for Boston Public Library

For Institutional/Investment Professional Use Only.
Not for distribution to the public.
Manulife Asset Management
2
AUM in USD as of June 30, 2017, rounded to the nearest billion. AUM for global investors includes funds managed for the General Account and third parties.Information shown represents advised and sub-advised, public and private assets managed by Manulife Asset Management (Manulife AM) and certain of its affiliates on behalf of Manulife AM, its clients and the general accounts of the insurance company affiliates of Manulife AM. Manulife AM assets under management include assets of Manulife TEDA Fund Management Company Ltd.'s 49% joint venture ownership structure. The methodologies used to compile the total assets under management are subject to change. Information related to assets under management may not be the same as regulatory assets under management reported on Form ADV of applicable US affiliates of Manulife AM.
We are the global asset management arm of Manulife
▪ USD$370 billion in assets under management for global investors
▪ Deep, local market knowledge in US, Canada, Europe and throughout Asia
▪ Investment management roots dating back over 100 years
MSTR.302762

For Institutional/Investment Professional Use Only.
Not for distribution to the public.
Our Global Footprint
3MSTR.302762
As of June 30, 20171 Total is comprised of investment professionals of Manulife Asset Management (Asia) and of Manulife TEDA and Sinochem. 2 Includes Public Markets investment professionals (IP) and Private Markets investment professionals from Hancock Natural Resource Group (HNRG) and Real Estate. Does not include IPs from Renewable Energy, Oil & Gas, Private Equity & Mezzanine, Commercial Mortgage Loans and Private Placement Debt.
CANADA
102 Investment
Professionals
EUROPE
18 Investment
Professionals
USA
159 Investment
Professionals
JAPAN
11 Investment
Professionals
ASIA EX-JAPAN
161 Investment
Professionals1
More than 4502 Investment Professionals; Offices in 16 countries and territories
U n i t e d S t a t e s C a n a d a B r a z i l U n i t e d K i n g d o m H o n g K o n g C h i n a T h a i l a n d V i e t n a mI n d o n e s i a M a l a y s i a P h i l i p p i n e s S i n g a p o r e T a i w a n A u s t r a l i a N e w Z e a l a n d J a p a n

For Institutional/Investment Professional Use Only.
Not for distribution to the public.
Global Multi-Sector Fixed IncomeA Response to Challenging Fixed Income Markets
4
Strategic Fixed Income Strategy
Manulife Asset
Management
Strategic Fixed Income
Strategy
1 Seek to increase the return profile in a low yield environment
2 Maintain volatility consistent with fixed income instruments
3 Seek to protect against a rising rate environment
4Diversify fixed income allocation away from benchmark-
centric, domestic exposure
5 Preserve liquidity
Typical Plan Sponsor
Fixed Income Investment Objectives
Global
Multi-Sector
Fixed
Income
MSTR.407238

For Institutional/Investment Professional Use Only.
Not for distribution to the public.
Strategic Fixed Income StrategyCombining Global and Multi-Sector Fixed Income
5
Source: Manulife Asset Management, Bloomberg Barclays, BofA Merrill Lynch, Citigroup, JPMorgan.*As of September 30, 2017. Performance shown is the Manulife Asset Management (US) Strategic Fixed income composite net of fees, and does not include advisory fees and other expenses an investor would incur. This information is supplemental to the GIPS-compliant presentation included as a part of this presentation.US Gov’t Bonds = Bloomberg Barclays US Government Bond Index, Pan-Euro Gov’t Bonds = Bloomberg Barclays Pan-Euro Government Bond Index, Asian Pacific Gov’t Bonds = Bloomberg Barclays Asian Pacific Government Bond Index, EM Sovereign (US$) = JPMorgan EMBI Global Diversified Index, EM Sovereign (Local) = JPMorgan GBI-EM Global Diversified Index, World Gov’t = Citigroup World Government Bond Index. Global IG Corporate = BoA Merrill Lynch Global Corporate Index, Global High Yield = BoA Merrill Lynch Global High Yield Index, EM Corporates (US$) = JPMorgan CEMBI Diversified Index, Convertibles = BoA Merrill Lynch US Convertibles, US CMBS= Bloomberg Barclays US CMBS Index, US ABS = Bloomberg Barclays US ABS Index.
Strategic Fixed Income Strategy
MSTR.407238
1Seek to increase the return profile in a low
yield environment
▪ Strategy invests across global developed and emerging markets sovereign, credit and securitized debt
▪ By expanding the investment universe to include multiple sectors and currencies, we believe we increase our potential to add value
2Maintain volatility consistent with fixed
income instruments
▪ Global multi-sector approach to fixed income has the potential to lower volatility
▪ Rolling 3 year standard deviation has ranged from 4-8%
Strategic Fixed Income Composite 10 Year Risk/Return Profile*
as of September 30, 2017 (net of fees)

For Institutional/Investment Professional Use Only.
Not for distribution to the public.
Strategic Fixed Income Strategy Combining Global and Multi-Sector Fixed Income
6
1 Performance shown is the Manulife Asset Management (US) Strategic Fixed income composite net of fees and does not include advisory fees and other expenses an investor would incur. Past performance is not indicative of future results. This information is supplemental to the GIPS-compliant presentation included as a part of this presentation.
2 Source: US Department of the Treasury, December 31, 2012–December 31, 2013, September 30, 2016-December 31, 20163 Source: Manulife Asset Management, Zephyr StyleAdvisor, as of September 30, 20174 AUM in USD as of September 30, 2017
Strategic Fixed Income Strategy
MSTR.407238
3 Seek to protect against a rising rate environment
The 10 Year US Treasury Yield Increased 126 bps in 2013 and 85 bps in Q4 20162
2013 Return 2013 Y/E Duration Q4 2016 Return 2016 Y/E Duration
Bloomberg Barclays US Aggregate Index: -2.03% 5.55 yrs -2.98% 5.89 yrs
Citigroup World Government Bond Index: -4.00% 6.74 yrs -8.53% 7.80 yrs
Strategic Fixed Income Composite (net)1: +2.10% 1.99 yrs -1.29% 2.57 yrs
4 Diversify fixed income allocation away from benchmark-centric, domestic exposure
10 Year Correlation vs Bloomberg Barclays US Aggregate3
Citigroup World Government Bond Index: 0.71
Strategic Fixed Income Strategy1: 0.33
Combining global and multi-sector fixed income with active currency management has the potential to increase diversification
5 Preserve liquidity
▪ Sophisticated global bond strategy delivered in a transparent fashion
▪ $27.0 billion in assets4; strategy is implemented using physical bonds
▪ Limited derivatives usage

For Institutional/Investment Professional Use Only.
Not for distribution to the public.
Global Multi-Sector Fixed Income TeamRoles and Experience
7
As of September 30, 2017
MSTR.390518
Additional Resources
Global Multi-Sector Fixed Income Team
Credit & Securitized Asset Research TradersAsia Team
55 Investment Professionals in 10 Markets
China Philippines
Hong Kong Taiwan
Indonesia Thailand
Japan Vietnam
Malaysia Singapore
Global Multi-Sector Portfolio Implementation
Richard Baker
Dylan Ngai, CFA
Christopher Smith, CFA, CAIA
Global Portfolio
Specialists
Tech/Media/Telecom &
Financial Services
Industrials/Utilities/
Energy
Securitized Asset
Research
Donald Tucker, CFA
Team Leader
Bradley Lutz, CFA
Team Leader
David A. Bees, CFA
Co-Team Leader
Consumer/Healthcare Emerging MarketsWilliam Paolino
Co-Team LeaderCaryn Rothman, CFA
Team Leader
Richard Segal
Team Leader
Additional Credit Research
13 Analysts
Investment Risk &
Quantitative Analytics
Megan E. Greene
Chief Economist
3 Economists
Economists
Peter Mennie, ASIP
Global Head
12 Quantitative Analysts
10 Traders
Christopher Camell
Senior Portfolio Analyst
Boston
Kelly Lim, CFA
Senior Portfolio Analyst
Hong Kong
Jeff Momplaisir
Portfolio Analyst
Boston
Daniel S. Janis, III
Head of Global Multi-Sector Fixed Income
Senior Portfolio Manager
33 Years’ Experience
Boston
Christopher Chapman, CFA
Portfolio Manager
18 Years’ Experience
London
Peter Azzinaro
Global Macro Strategist
25 Years’ Experience
Boston
Chuck Tomes
Investment Analyst
9 Years’ Experience
Boston
Joseph Rothwell
Investment Analyst
9 Years’ Experience
Boston
David Zielinski, CFA
Portfolio Specialist
20 Years’ Experience
Boston
Thomas C. Goggins
Senior Portfolio Manager
30 Years’ Experience
Boston
Kisoo Park
Portfolio Manager
31 Years’ Experience
Hong Kong

For Institutional/Investment Professional Use Only.
Not for distribution to the public.
Strategic Fixed Income StrategyInvestment Philosophy & Process
Philosophy
We believe strong, consistent returns can be generated by investing primarily in a portfolio of global government and
corporate bonds, including emerging markets and high yield securities. Currency management is employed to further
diversify the portfolio, mitigate risk and add value. By expanding the investment universe to include multiple sectors and
currencies, we believe we increase our potential to add value while reducing risk.
Process
▪ Consistent adherence to disciplined investment style and process which utilizes diverse sources of alpha
▪ Using a comprehensive investment process, we seek to:
▪ Invest in attractive sectors based on our top-down view of macro economic conditions
▪ Engage in an intensive bottom-up research process to identify relative value opportunities within those sectors
▪ Make opportunistic currency investments to add value and further diversify our portfolio position
8
For illustrative purposes only.
Strategic Fixed Income Strategy
Currency
Management
Macroeconomic
Analysis
Identify
Attractive
Sectors
Conduct Relative
Value Analysis
Portfolio
Construction &
Risk Management
MSTR.407238

For Institutional/Investment Professional Use Only.
Not for distribution to the public.
Strategic Fixed Income StrategyTop-Down Macroeconomic Analysis
Macro Themes Drive Portfolio Exposures
▪ Daily US-based morning meeting consisting of US
portfolio managers, credit analysts and traders
▪ Review prior day’s and overnight market events,
recent earnings updates, new issuance calendar
and market liquidity
▪ Weekly global meetings consisting of local portfolio
managers and credit analysts
▪ Macroeconomic discussion on factors impacting
local sovereign and credit markets
▪ Quarterly Global Multi-Sector Team Macroeconomic
Scorecard Review
▪ Review and rank economic, interest rate and spread
data across developed and emerging countries
▪ Analyze current indicators versus their historical
levels and the direction and magnitude of change
▪ Macroeconomic scorecard summarizes the
attractiveness of the global landscape from an
interest rate, credit, currency and liquidity
perspective
9
For illustrative purposes only.
Strategic Fixed Income Strategy
Economic and Business Cycle Outlook
Fiscal &
Monetary
Policy
Interest Rate
Forecasts
Currency
TrendsPolitical
Environment
Risk
Seeking
or
Risk Aversion
Asset
Allocation
&
Target Sectors
Interest
Rate
Strategies
Country
&
Currency
Strategies
Macroeconomic Themes
Global Multi-Sector Team — Macro Economic Scorecard
Macr
o
Volatil
ity
Spreads
Rat
es
Cur
rency
Currency Risk Credit RiskInterest Rate Risk Liquidity Risk
Macr
o
Volatil
ity
Spreads
Rat
es
Cur
rency
USA* 4 2 USD 4 Foreign Gov't 3
Canada 3 3 GBP 3 US Inv Grade 3
UK 3 1 EUR 3 Europe Inv Grade 3
France 2 1 JPN 3 Asia-Pac Inv Grade 3
Germany 4 1 CHF 1 US High Yield 3
Italy 2 2 SEK 2 HY Industrial 3
Spain 2 2 NOK 2 HY Utility 3
Ireland 3 3 CAD 3 HY Finance 2
Sweden 4 2 AUD 3 Pan-European HY 2
Norway 4 3 NZD 4 Supranational 2
Japan 3 1 BRL 4 US MBS — Agency 3
Australia 3 3 MXN 4 CMBS 3
New Zealand 4 3 ARS 2 ABS 2
Brazil 4 3 VEF 2
Mexico 4 4 CLP 3 EM — Sovereign
Argentina 3 - TRY 2 Americas — Gov't 3
Venezuela 3 3 CNY 3 EMEA — Gov't 3
Chile 4 2 INR 2 Asia Pacific — Gov't 3
Poland 3 3 IDR 2 EM — US$ Credit
Turkey 3 1 MYR 4 Americas 4
China 3 4 SGD 4 EMEA 3
India 2 3 KRW 4 US$ Asia Pac — Credit 2
Indonesia 3 2 PHP 4 EM Local Currency
Malaysia 4 4 THB 3 Americas 4
Singapore 3 3 EMEA 4
South Korea 4 3 Asia Pacific 3
Philippines 4 3
Thailand 3 3
Macr
o
Com
modity
LatA
m
Em
erg
ing
Develo
ped
Asia
ex J
apan
Unite
d S
tate
s
Volatil
ity
Spreads
Rat
es
Cur
rency
5
3
Develo
ped
Develo
ped
Em
erg
ing M
ark
ets
Euro
pe
MSTR.407238

For Institutional/Investment Professional Use Only.
Not for distribution to the public.
Strategic Fixed Income StrategyDynamic Sector Allocation
10
As of September 2017
Strategic Fixed Income Strategy
MSTR.407238
0
10
20
30
40
50
60
70
80
90
100
Jan
-03
Se
p-0
3
Ma
y-0
4
Jan
-05
Se
p-0
5
Ma
y-0
6
Jan
-07
Se
p-0
7
Ma
y-0
8
Jan
-09
Se
p-0
9
Ma
y-1
0
Jan
-11
Se
p-1
1
Ma
y-1
2
Jan
-13
Se
p-1
3
Ma
y-1
4
Jan
-15
Se
p-1
5
Ma
y-1
6
Jan
-17
Se
p-1
7
Cash/Other
Emerging Markets
CMBS
ABS
Non-Agency MBS
Agency MBS
Convertible
Bank Loan
HY Corporates
IG Corporates
Foreign Govt & Supra
Municipals/Local Authorities
US Government/Agencies
Emerging
Markets Debt
High Yield
Corporates
Foreign
Government/
Supranational

For Institutional/Investment Professional Use Only.
Not for distribution to the public.
Idea generation comes from
multiple sources
▪ Daily meetings between
credit analysts, portfolio
managers and traders
▪ Joint collaboration with
equity analysts
▪ Quantitative index screening
▪ New issuance
Idea Generation
Business Risk
▪ Country risk
▪ Economic risk
▪ Industry factors
▪ Competitive position
▪ Management evaluation
▪ Profitability/Peer group
comparison
Financial Risk
▪ Governance
▪ Accounting and reporting
▪ Cash flow adequacy
▪ Capital structure
▪ Financial leverage
▪ Balance sheet and
asset protection
▪ Financial policies
Liquidity Risk
▪ Maturity profile
▪ Liquidity
▪ Financial flexibility
Credit Analysis
Infrastructure facilitates
exchange of ideas
▪ Buy/hold/sell decisions
▪ News and earnings updates
▪ Secondary issue updates
Fixed Income Portal
Proactively identify risks to
existing holdings
▪ Daily monitoring of relative
value across sectors, qualities
and issuers
▪ Identify risk factors that could
impact an investment thesis
▪ Daily price change report for
each analyst’s holdings
▪ Timely review of
earnings statements
▪ Formal sector reviews
Credit Surveillance
Strategic Fixed Income StrategyRelative Value Analysis — Corporate Credit Research
11
For illustrative purposes only.
Strategic Fixed Income Strategy
The Credit Research Team takes a disciplined, fundamental bottom-up approach to credit analysis
MSTR.407238

For Institutional/Investment Professional Use Only.
Not for distribution to the public.
Strategic Fixed Income StrategyCurrency & Duration Management
Currency:
▪ Strategic positioning
▪ Intended to capture medium to long term currency trends
▪ Fundamentally driven
▪ Generally implemented through local currency denominated securities
▪ Tactical positioning
▪ Intended to take advantage of short-term volatility and dislocations
▪ Fundamentally and technically driven
▪ Currency risk is hedged back to base currency or cross-hedged to a different currency which has the potential for appreciation
▪ Tail risk/proxy hedging
▪ Intended to act as a proxy hedge for underlying portfolio risk exposures in volatile and distressed markets
▪ Liquid currency forwards and options provide an effective and efficient way to mitigate risk
Duration:
▪ Interest rates are hard to time
▪ Intermediate duration targeting 4 years with a band of +/- 2 years (i.e., 2–6 years)
12
Strategic Fixed Income Strategy
Role of Currency Management
Risk
MitigatorAlpha
Source
Diversifier
MSTR.407238

For Institutional/Investment Professional Use Only.
Not for distribution to the public.
Strategic Fixed Income StrategyPortfolio Construction
Portfolio construction is a collaborative effort between experienced portfolio managers, research analysts
and traders
▪ Diversification guidelines and a multi-dimension risk management
process govern the portfolio’s construction
▪ Benchmark unconstrained; position sizes are
determined by fundamental analysis,
diversification benefits and impact on the
overall portfolio volatility
▪ Physical bond implementation is an integral
part of managing liquidity risk
▪ Derivatives usage limited to
exchange-traded interest rate
futures/options and
currency forwards/options
▪ Strong sell discipline
▪ Business cycle shifts in favor of
other sector
▪ Credit fundamentals deteriorate
▪ Better relative value opportunity
is identified
13
For illustrative purposes only.*Sources of alpha values are targets and not a guarantee of performance.
Strategic Fixed Income Strategy
MSTR.407238
Diverse Sources
of Alpha*
Sector
Rotation
Strategic
Fixed
Income
Portfolio
Security
Selection
Currency
Trading
Duration/
Yield Curve
Top-Down
Macroeconomic
Themes
Identification of
Attractive Sectors
Risk
Management
Focused,
Bottom-Up Relative
Value Credit
Analysis
Currency &
Duration
Management
40%
20%
20%
15%
5%
For Institutional/Investment Professional Use Only.
Not for distribution to the public.
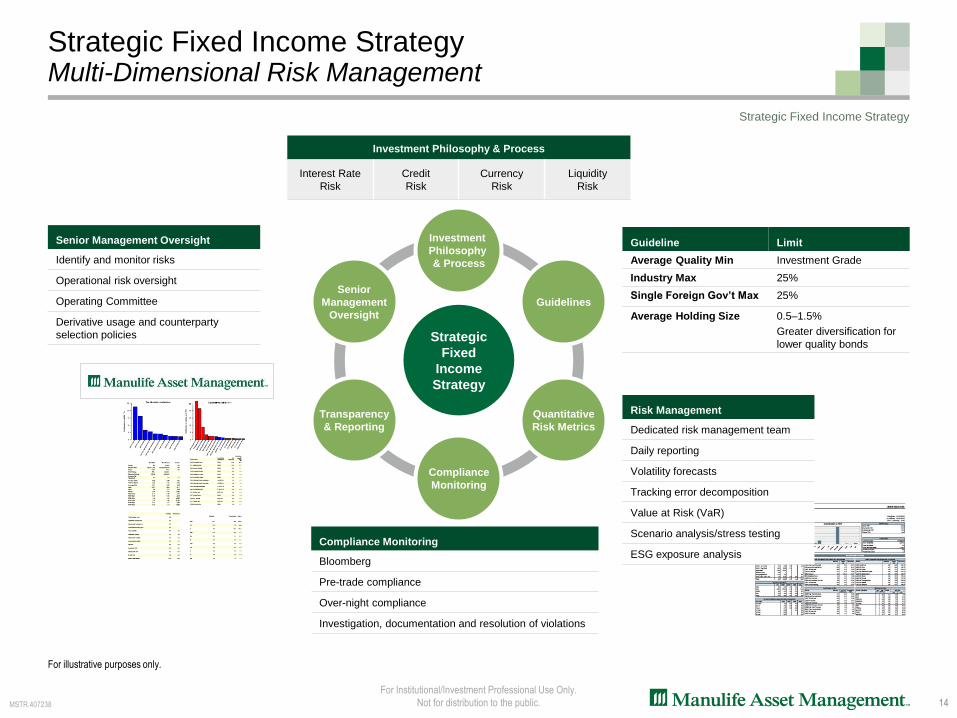
Strategic Fixed Income StrategyMulti-Dimensional Risk Management
14
For illustrative purposes only.
Strategic Fixed Income Strategy
Guideline Limit
Average Quality Min Investment Grade
Industry Max 25%
Single Foreign Gov’t Max 25%
Average Holding Size 0.5–1.5%
Greater diversification for
lower quality bonds
Compliance Monitoring
Bloomberg
Pre-trade compliance
Over-night compliance
Investigation, documentation and resolution of violations
Strategic
Fixed
Income
Strategy
Investment
Philosophy
& Process
Senior
Management
Oversight
Guidelines
Quantitative
Risk Metrics
Transparency
& Reporting
Compliance
Monitoring
Investment Philosophy & Process
Interest Rate
Risk
Credit
Risk
Currency
Risk
Liquidity
Risk
Count
Market Value
Price
S&P Rating
Moo dy's Rating
Coupon Par
Weighted
Current Yield
Yield to Worst
Av erage Life
OAS
OAD
OASD
KRD 0.5yr
KRD 02yr
KRD 05yr
KRD 10yr
KRD 20yr
KRD 30yr
Portfolio
366
120,811,523
102.8
A2/A3
4.3
4.60
2.66
6.91
147.7
3.8
4.59
0.12
0.48
1.44
1.45
0.15
0.22
Benchmark
16,963
43,220,909,556
107.8
AA2/AA3
3.0
2.80
1.70
8.39
50.6
6.5
6.54
0.09
0.65
1.46
1.68
1.37
1.14
Activ e
NA
NA
NA
1.3
1.81
0.96
97.1
0.03
Aaa
Aa
A
Baa
Ba
B
Caa
Ca
C
D
NR
Portfolio
24.7
14.4
9.6
22.3
15.5
9.7
0.0
0.0
0.0
0.0
3.8
Benchmark
40.2
17.3
25.3
15.8
0.1
0.0
0.0
0.0
0.0
0.0
1.3
Active
6.5
15.4
9.7
0.0
0.0
0.0
0.0
2.5
Risk Management
Dedicated risk management team
Daily reporting
Volatility forecasts
Tracking error decomposition
Value at Risk (VaR)
Scenario analysis/stress testing
ESG exposure analysis
Senior Management Oversight
Identify and monitor risks
Operational risk oversight
Operating Committee
Derivative usage and counterparty
selection policies
MSTR.407238

For Institutional/Investment Professional Use Only.
Not for distribution to the public. 15
Strategic Fixed IncomePortfolio Structure & Performance
MSTR.324786

For Institutional/Investment Professional Use Only.
Not for distribution to the public.
Strategic Fixed Income Strategy Characteristics as of September 30, 2017
16
In USD
Strategic Fixed Income Strategy
Characteristic
Strategic Fixed Income
Strategy
Bloomberg Barclays US Aggregate Bond Index
Bloomberg Barclays
Multiverse Index
Average Rating BAA1 AA2 A1
Average Coupon (%) 4.38 3.14 3.01
Average Life (Years) 5.27 8.19 8.55
Yield to Maturity (%) 3.10 2.55 1.87
Yield to Worst (%) 2.90 2.55 1.85
Effective Duration (Years) 2.56 5.97 6.79
Sector Allocation (%)
Strategic Fixed Income
Strategy
Bloomberg Barclays US Aggregate Bond Index
Bloomberg Barclays
Multiverse Index
US Government 0.00 39.48 15.01
US Treasuries 0.00 36.98 14.05
US Agency 0.00 1.84 0.70
Local Authorities & Municipals 0.00 0.67 0.26
Credit 54.91 25.23 20.41
IG Corporates 26.84 25.23 17.08
HY Corporates 16.30 0.00 3.33
Bank Loans 7.74 0.00 0.00
Convertibles 4.03 0.00 0.00
Equities 0.00 0.00 0.00
Securitized 12.08 30.51 14.22
Agency MBS 0.85 28.13 10.69
Non-Agency MBS 2.25 0.00 0.00
ABS 4.03 0.57 2.82
CMBS 4.95 1.81 0.71
Foreign Developed 19.70 3.00 42.12
Govt & Agency 15.61 1.41 39.98
Supranationals 4.10 1.59 2.14
Emerging Markets 11.67 1.78 8.25
Emerging Markets — USD 3.36 1.78 3.75
Emerging Markets — Non-USD 8.30 0.00 4.50
Top Ten Issuers Portfolio Weight (%)
United Mexican States 3.45
New Zealand 2.91
Republic of Indonesia 2.83
Canada 2.71
United Nations Organization 2.63
Republic of Singapore 2.37
State of Queensland Australia 1.89
Republic of the Philippines 1.86
Wells Fargo 1.67
JPMorgan Chase 1.57
Total 23.89
MSTR.407238

For Institutional/Investment Professional Use Only.
Not for distribution to the public.
Strategic Fixed Income Composite Investment Results as of September 30, 2017
17
In USDComposite inception date: October 1986
Strategic Fixed Income Strategy
Annualized Returns (%)
MSTR.407238
1.13
4.18
2.843.09
3.45
4.71
6.19
0.85
3.14
0.07
2.71
2.06
2.95
4.27
1.88
6.55
-0.56
1.56
0.76
1.87
3.50
-1
0
1
2
3
4
5
6
7
3 Months YTD 1 Year 3 Years 5 Years 7 Years 10 Years
Strategic Fixed Income Composite — Net Bloomberg Barclays US Aggregate Index Bloomberg Barclays Multiverse Index
Calendar Year Returns (%)
2016 2015 2014 2013 2012 2011 2010 2009 2008 2007
Strategic Fixed Income Composite (Net) 3.74 0.87 3.86 2.10 12.07 2.40 15.51 29.57 -9.27 6.14
Bloomberg Barclays US Aggregate Index 2.65 0.55 5.97 -2.03 4.22 7.84 6.54 5.93 5.24 6.97
Excess Return 1.09 0.32 -2.11 4.13 7.85 -5.44 8.97 23.64 -14.51 -0.83
Bloomberg Barclays Multiverse Index 2.84 -3.29 0.48 -2.19 4.83 5.55 5.85 8.04 3.76 9.22
Excess Return 0.9 4.16 3.38 4.29 7.24 -3.15 9.66 21.53 -13.03 -3.08

For Institutional/Investment Professional Use Only.
Not for distribution to the public.
Strategic Fixed Income StrategyRisk Analysis
18
Source: Manulife Asset Management, Barclays, Zephyr StyleAdvisor as of September 30, 2017Inception Date: October, 1986
Strategic Fixed Income Strategy
Rolling 3 Year Volatility
(36 Month Annualized Standard Deviation)
Strategic Fixed Income Strategy 3 Year 5 Year 10 Year
Net Return 3.09 3.45 6.19
Standard Deviation 1.93 2.65 5.45
Sharpe Ratio 1.46 1.23 1.06
Risk/Return Analysis
As of September 30, 2017
0
1
2
3
4
5
6
7
8
9
Dec-01 Dec-04 Dec-07 Dec-10 Dec-13 Dec-16
An
nu
ali
ze
d S
tan
da
rd D
evia
tio
n
Strategic Fixed Income Strategy
MSTR.407238
vs.
Bloomberg Barclays US Aggregate Index3 Year 5 Year 10 Year
Correlation 0.78 0.69 0.33

For Institutional/Investment Professional Use Only.
Not for distribution to the public.
Strategic Fixed Income StrategyA Response to a Challenging Fixed Income Environment
19
Why Global Multi-Sector Today?
▪ Global yield curve diversification
Potential for rising interest rates in the US due
to Fed interest rate hikes and balance sheet
unwind
▪ Sector diversification
Multi-sector allocation has the ability to lower
portfolio volatility
▪ Additional alpha source from foreign bonds
Potential for a weaker US dollar as global
central bank policies converge
▪ Global sources of liquidity
Why Manulife AM’s
Strategic Fixed Income Strategy?
DEMONSTRATED ABILITY
TO ADJUST TO MARKETS
EXPERIENCED PORTFOLIO
MANAGERS
TRANSPARENCY & LIQUIDITY
ACTIVE CURRENCY MANAGEMENT
“RISK MANAGERS FIRST”
COMPETITIVE, CONSISTENT RISK-ADJUSTED
RETURNS
For illustrative purposes only.
PRS.403093

For Institutional/Investment Professional Use Only.
Not for distribution to the public. 20
Appendix
MSTR.247442

For Institutional/Investment Professional Use Only.
Not for distribution to the public.
Strategic Fixed Income Strategy Characteristics as of September 30, 2017
21
In USD
Strategic Fixed Income Strategy
Currency Allocation
As of September 30, 2017
MSTR.407238
3.60
0.26
3.53
0.25
0.49
0.88
2.37
0.24
2.17
-2.42
1.57
1.86
-2.96
0.05
-1.51
0.01
89.62
-20 0 20 40 60 80 100
Australia Dollar
Brazilian Real
Canada Dollar
Colombian Peso
Euro
India Rupee
Indonesia Rupiah
Malaysian Ringgit
Mexico Peso
New Zealand Dollar
Norway Krone
Philippines Peso
Singapore Dollar
South Korean Won
Swedish Krona
United Kingdom Pound
United States Dollar
Geographic Allocation
As of September 30, 2017
88.36
63.84
6.09
0.41
2.16
2.07
0.00
0.00
2.44
7.00
4.35
11.64
6.33
0.00
0.00
0.00
5.31
0 20 40 60 80 100
Developed Markets
United States
Canada
United Kingdom
Europe ex-UK
Scandinavia
Middle East (Developed)
Japan
Asia ex-Japan
Australasia
Other Developed
Emerging Markets
Latin America
Europe
Middle East (EM)
Africa
Asia

For Institutional/Investment Professional Use Only.
Not for distribution to the public.
Global Outlook
22
As of September 30, 2017
Strategic Fixed Income Strategy
QMSR.385441
Global Outlook
Macroeconomic environment:
▪ We have become more constructive on
a number of global macroeconomic
factors and believe there is more
upside risk to the global economy than
downside
▪ With valuations through fair value in
many fixed income sectors, we will look
to increase risk within the portfolio on a
selective basis
▪ As global central bank policies
potentially become more in sync, the
strong US dollar trend has likely
peaked
Opportunities:
▪ Bank loans, Eurozone and select
emerging markets
▪ Tactical duration positioning
▪ Strategic/tactical currency positioning
Selectively Adding Credit & Currency Risk while Mitigating Interest Rate Risk
Canada
US
Mexico
Brazil
Colombia
Europe
France
Germany
Ireland
Italy
Portugal
Spain
UK
Asia
India
Indonesia
Malaysia
Philippines
S. Korea
Singapore
Japan
Australia
New ZealandFavorable Currencies
Favorable Rates
Favorable Credit Spreads
Scandinavia
Denmark
Norway
Sweden

For Institutional/Investment Professional Use Only.
Not for distribution to the public.
Strategic Fixed Income CompositeBenchmark Comparison as of September 30, 2017
23
Source: Manulife Asset Management, Bloomberg Barclays, CitigroupComposite inception date: October 1986
Strategic Fixed Income Strategy
Benchmark Characteristics
Annualized Returns (%)
MSTR.407238
Index
Bloomberg Barclays
Multiverse Index
Bloomberg Barclays
Global Aggregate Index
Citigroup World Government
Bond Index (WGBI)
Bloomberg Barclays
US Universal Index
Bloomberg Barclays
US Aggregate Index
Description
▪ The Bloomberg Barclays
Multiverse Index provides a
broad-based measure of the
global fixed-income bond
market. The index
represents the union of the
Global Aggregate Index and
the Global High Yield Index.
▪ The Global Aggregate Index
provides a broad-based
measure of the global
investment-grade fixed
income markets.
▪ The three major
components of this index
are the US Aggregate, the
Pan-European Aggregate,
and the Asian-Pacific
Aggregate Indices.
▪ The World Government
Bond Index consists of the
government bond markets
of multiple countries.
Country eligibility is
determined based upon
market capitalization and
investability criteria.
▪ The US Universal Index
represents the union of the US
Aggregate Index, the US High-
Yield Corporate Index, the 144A
Index, the Eurodollar Index, the
Emerging Markets Index,
and the non-ERISA portion
of the CMBS Index.
▪ Municipal debt, private
placements, and non-dollar-
denominated issues are
excluded from the
Universal Index.
▪ The US Aggregate Index
represents securities that
are SEC-registered, taxable,
and dollar denominated.
▪ The index covers the US
investment grade fixed rate
bond market, with index
components for government
and corporate securities,
mortgage pass-through
securities, and asset-
backed securities.
Key
Differences
▪ US 38%, Pan-Euro 30%,
Asia-Pac 22%
▪ 5% high yield
▪ 45% US Dollar, 55%
foreign currency
▪ US 40%, Pan-Euro 31%,
Asia-Pac 22%
▪ No high yield
▪ 44% US Dollar, 56%
foreign currency
▪ US 33%, Non-US 67%
▪ No securitized or corporate
bonds (including HY)
▪ US Aggregate Index 84%
▪ High yield 6%, EM 3%
▪ No foreign currency
exposure (100% US Dollar)
▪ No high yield
▪ No foreign currency
exposure (100% US Dollar)
3 Month 1 Year 3 Year 5 Year 10 Year
Strategic Fixed Income Composite 1.13 3.25 3.51 3.87 6.62
Bloomberg Barclays Multiverse Index 1.88 -0.56 1.56 0.76 3.50
Excess Return -0.75 3.81 1.95 3.11 3.13
Bloomberg Barclays Global Aggregate Bond Index 1.76 -1.26 1.30 0.48 3.31
Excess Return -0.63 4.51 2.21 3.39 3.31
Citi World Gov Bond Index (WGBI) 1.81 -2.69 0.88 -0.43 2.95
Excess Return -0.68 5.94 2.63 4.30 3.67
Bloomberg Barclays US Universal Index 1.01 0.96 3.11 2.53 4.56
Excess Return 0.12 2.29 0.39 1.34 2.06
Bloomberg Barclays US Aggregate Bond Index 0.85 0.07 2.71 2.06 4.27
Excess Return 0.28 3.18 0.79 1.80 2.35

For Institutional/Investment Professional Use Only.
Not for distribution to the public.
Strategic Fixed Income StrategyAttractive Risk/Return Profile
24
As of September 30, 2017Source: Zephyr StyleAdvisorPerformance shown is the Manulife Asset Management (US) Strategic Fixed income composite net of fees, and does not include advisory fees and other expenses an investor would incur. This information is supplemental to the GIPS-compliant presentation included as a part of this presentation.US Bonds = Bloomberg Barclays US Aggregate Bond Index; US High Yield = BoA ML US High Yield Master II Index; EM Bonds = JPMorgan EMBI Global Diversified Index; Global Bonds = Bloomberg Barclays Multiverse Index; Int’l Bonds = Citigroup WGBI ex US; US TIPS = Bloomberg Barclays US TIPS Index; US Equities = Russell 3000 Index; EM Equities = MSCI EM Index; Int’l Equities = MSCI EAFE Index; Commodities = Dow UBS Commodity Index; REITs = FTSE NAREIT Equity-REITs Index; Hedge Funds = HFRX Global Hedge Fund Index; Cash = Citigroup 3-Month Treasury Bill Index.
Strategic Fixed Income Strategy
MSTR.407238
Over the last 10 years, the Strategic Fixed Income Strategy has deliveredequity-like returns with fixed income volatility
5 Year Risk/Return Profile (September 2017) 10 Year Risk/Return Profile (September 2017)

For Institutional/Investment Professional Use Only.
Not for distribution to the public.
Strategic Fixed Income StrategyRepresentative Guidelines
25
For Separate Accounts, additional guidelines may apply as directed by clients.
Characteristics, guidelines and constraints are for illustrative purposes only. They may change at any time and may differ for a specific account.
Strategic Fixed Income Strategy
MSTR.407238
Strategic Fixed Income Strategy
Primary Investments
The Strategies focus their investments in government, corporate and securitized debt securities and other instruments
issued in developed and emerging markets countries, which may be denominated in US dollars or other foreign
currencies
Duration Targets a 4 year duration with a band of +/- 2 years
(i.e., 2–6 years)
Min Average Quality Investment Grade
Max HY Corporate 50%
Max Emerging Markets 40%; Individual country exposure limited to 10%
Max MBS/CMBS/ABS 40%
Max Private Placements 10% (excludes Rule 144A with & without registration rights)
Max Industry Weighting 25%
Max Single Foreign Gov’t 25%
Max Preferred Stocks 10%
Max Common Stocks Prohibited
Max Issuer Exposure 5%
Average Corporate Issuer 0.5–1.5%; Broadly diversified portfolio with greater diversification for lower quality bonds
Use of Cash Under normal market conditions, the Strategy seeks to be fully invested; cash will be limited to 10% or less
Derivatives
Financial derivatives may be used to manage risk, provide diversification and enhance returns
LeverageWhen engaging in derivative transactions, the Strategy does not “borrow” or take on debt for the purpose of creating
leverage

For Institutional/Investment Professional Use Only.
Not for distribution to the public.
Biographies
26
Daniel S. Janis, III is head of Global Multi-Sector Fixed Income at Manulife Asset Management. He is a senior managing director, senior portfolio
manager and the lead portfolio manager for the company’s global multi-sector fixed income strategies, responsible for asset allocation, global bond
research and currency management. His areas of expertise include global economics, foreign exchange, derivatives and risk management. Prior to
joining the company, Dan was a vice president and proprietary risk manager for BankBoston. Earlier in his career, he worked as a vice president
for Morgan Stanley in the foreign exchange department and managed their forward desk from 1991 to 1997. He holds certification from the
Association of International Bond Dealers.
Education: Harvard University, AB in Economics, 1983
Joined Company: 1999
Began Career: 1984
Thomas C. Goggins is a senior managing director and senior portfolio manager on the Global Multi-Sector Fixed Income Team at Manulife Asset
Management. He is responsible for portfolio management, global bond research, security selection and risk management for the company’s global
multi-sector fixed income strategies. Prior to joining the company, Tom held positions at Putnam Investments, Transamerica Investments, SAC
Capital and Fontana Capital.
Education: University of Wisconsin, BBA, 1981; JL Kellogg Graduate School of Management at Northwestern University, MA in Finance and
Accounting, 1987
Joined Company: 1995; rejoined 2009
Began Career: 1987
Kisoo Park is a managing director and portfolio manager on the Global Multi-Sector Fixed Income Team at Manulife Asset Management. He is
responsible for portfolio management, global bond research and currency management for the company’s global multi-sector fixed income
strategies. Kisoo joined Manulife Asset Management from a hedge fund firm based in Hong Kong, where he was a founding member and COO.
Prior to that, he was the CIO responsible for tactical asset allocation investing in global equities, fixed income, commodities, FX and interest rate
asset classes at Prince Asset Management, Hong Kong. Earlier in his career, Kisoo held positions at Bank of Montreal, Fleet National Bank,
Morgan Stanley and Bank of New England, where he began his career specializing in treasury products, FX and interest rate trading.
Education: Tufts University, Bachelor of Arts in Economics, 1986; University of Chicago, Graduate School of Business, 2007
Joined Company: 2011
Began Career: 1986

For Institutional/Investment Professional Use Only.
Not for distribution to the public.
Biographies
27
Christopher Chapman, CFA, is a managing director and portfolio manager on the Global Multi-Sector Fixed Income Team at Manulife Asset
Management. Chris is responsible for portfolio management, global sovereign debt and currency research, portfolio construction, and risk
management for the company’s global multi-sector fixed income strategies. Prior to this position, Chris was a senior investment analyst with the
Global Multi-Sector Fixed Income Team. Before that, he worked in several other areas of the firm, including as an investment risk analyst on the
Quantitative Research Team. Chris began his career at State Street Bank. He is a CFA charterholder and a member of CFA Society Boston, Inc.
Education: Stonehill College, BSBA in Management, 1999; Boston College, MSF, 2003
Joined Company: 2005
Began Career: 1999
David W. Zielinski, CFA, is a managing director and portfolio specialist on the Global Multi-Sector Fixed Income Team at Manulife Asset
Management. He is responsible for supporting our client facing teams in the effective communication and positioning of our global multi-sector fixed
income strategies with clients, prospects and consultants. Prior to joining the company, David was a vice president and senior product engineer for
Global Fixed Income at State Street Global Advisors (SSgA). Prior to that, he was a portfolio manager in currency management with SSgA. He
began his career with MassMutual Financial Group as an investment analyst, and later worked at Babson Capital Management as an investment
analyst in quantitative management. David is a CFA charterholder.
Education: Bryant College, BS in Finance, 1997; Babson College, MBA, 2004
Joined Company: 2010
Began Career: 1997
Nancy C. Irving is a managing director at Manulife Asset Management, responsible for institutional sales and business development. Nancy joined
the company from Congress Asset Management, where she orchestrated their introduction to the institutional marketplace. Prior to that, Nancy was
a senior sales executive with The Boston Company Asset Management/Mellon Financial, responsible for international and domestic equity sales.
Earlier, she was a vice president at Mellon Private Asset Management responsible for the development and growth of the company’s jumbo
mortgage product sales. Nancy was a private banking officer at Fleet Bank of Massachusetts responsible for private loan portfolios for the high net
worth market. She began her career at Bank of New England as an assistant credit officer.
Joined Company: 2010
Began Career: 1988

For Institutional/Investment Professional Use Only.
Not for distribution to the public.
Institutional Investment Management Fee ScheduleStrategic Fixed Income Strategy
28
1 The Commingled Investment Trust (“the Fund”) incurs a maximum annual Administrative Fee of three (3) basis points. This fee is accrued daily to cover the Fund’s ordinary operating expenses such as audit, custody, fund accounting, and transfer agency fees and is accrued daily from the Fund prior to striking the daily net asset value. US Commingled trust funds are available only to qualified US investors through Manulife Asset Management Trust Company. Minimum account sizes may apply.
Strategic Fixed Income Strategy
Manulife Asset Management Strategic Fixed Income Strategy – Separate Account
Basis Points AUM
40 bps on the first $25 million
35 bps on the next $75 million
30 bps on the next $75 million
25 bps thereafter
MSTR.407238

For Institutional/Investment Professional Use Only.
Not for distribution to the public.
Manulife Asset Management (US) Strategic Fixed Income Composite
29
Creation Date: 01/01/2006 Inception Date: 10/01/1986 Reporting Currency: USD
Schedule of Calendar Year Returns and Assets
Year End
Gross of Fees
Return (%)
Net of Fees
Return (%)
Benchmark
Return (%)
Composite 3-Yr
Std. Dev. (%)
Benchmark 3-Yr
Std. Dev. (%)
Number of
Portfolios End
of Period
Composite
Dispersion (%)
Total Assets End
of Period
(Thousands)
Percent of
Firm Assets (%)
End of Period
2016 4.16 3.74 2.84 2.26 4.95 <=5 N/A 5,798,861 2.98
2015 1.28 0.87 -3.29 2.99 3.91 6 0.15 5,351,227 2.59
2014 4.28 3.86 0.48 3.64 3.96 7 0.75 4,420,605 2.15
2013 2.51 2.10 -2.19 5.58 4.37 6 0.66 4,592,201 2.38
2012 12.52 12.07 4.83 6.18 4.93 <=5 N/A 3,836,306 2.72
2011 2.81 2.40 5.55 6.84 6.53 <=5 N/A 3,535,645 2.78
2010 15.97 15.51 5.85 N/A N/A <=5 N/A 2,524,603 2.00
2009 30.09 29.57 8.04 N/A N/A <=5 N/A 2,701,926 2.53
2008 -8.90 -9.27 3.76 N/A N/A <=5 N/A 1,861,532 2.44
2007 6.56 6.14 9.22 N/A N/A <=5 N/A 2,124,766 2.21
Firm Definition
Manulife Asset Management (US) ("the Firm”) comprises Manulife Asset Management (US) LLC (“MAM US”), Manulife Asset Management (North America) Limited (“MAM NA”) and Manulife Asset Management Trust Company-(“MAM TC”). Effective January 1, 2011 the Firm was redefined to include MAM NA to reflect the alignment of the underlying businesses of the two firms. Effective June 22, 2011 the Firm was redefined to include the MAM TC, the then newly formed institutional investment management company, and now an affiliate of MAM US. Effective October 1, 2016 the firm was redefined to include assets from the dissolution of Declaration Management & Research LLC, a prior affiliate of MAM US. Total Firm Assets reported prior to 1/1/2011 are the combination of assets from both MAM US and MAM NA.
Compliance Statement
Manulife Asset Management (US) claims compliance with the Global Investment Performance Standards (GIPS®) and has prepared and presented this report in compliance with the GIPS standards. Manulife Asset Management (US) or predecessor firms have been independently verified for periods 1/1/1993 to 12/31/2015. The verification reports are available upon request. Verification assesses whether (1) the firm has complied with all the composite construction requirements of the GIPS standards on a firm-wide basis and (2) the firm’s policies and procedures are designed to calculate and present performance in compliance with the GIPS standards. Verification does not ensure the accuracy of any specific composite presentation.
General Disclosure
A complete list of the Firm’s composite descriptions and policies regarding valuing portfolios, calculating performance, and preparing GIPS compliant presentations are available upon request. All returns reflect the reinvestment of dividends and other earnings. Gross performance results do not reflect the deduction of investment management fees, and are net of commissions and foreign withholding tax. Net performance results reflect the application of the highest incremental rate of the standard investment advisory fee schedule to gross performance results. Actual fees may vary depending on, among other things, the applicable fee schedule and portfolio size. Advisory fees are available upon request. Dispersion of annual returns is measured by an asset-weighted standard deviation calculation of gross of fee returns. Past performance is not a guarantee of future results.
Composite Description
The Strategic Fixed Income strategy seeks to generate high current income and competitive total returns by investing primari ly in foreign government and corporate debt from developed and emerging markets, U.S. government and agency securities and U.S. high yield bonds. The strategy consists of accounts managed at a prior firm until 12/31/05. Performance results from the prior firm are linked to results achieved at Manulife Asset Management (US). There is a $25 million asset requirement to be eligible for inclusion in the strategy. In August 2016, the strategy returns for 2009 were restated due to a material error.
Fee Schedule
This presentation is intended for institutional investors and the standard investment advisory fee schedule is 0.40% on the first 25 million; 0.35% on the next 75 million; 0.30% on the next 75 million; 0.25% thereafter.
Benchmark Description
The Bloomberg Barclays Multiverse Index provides a broad-based measure of the global fixed income bond market. The index represents the union of the Global Aggregate Index and the Global High Yield Index and captures investment grade and high yield securities in all eligible currencies.
Benchmark Change
On 5/1/2013 the benchmark was changed retroactively from the Bloomberg Barclays US Aggregate Index to the Bloomberg Barclays Multiverse Index. The Bloomberg Barclays Multiverse Index better reflects the investment process and the composite's holdings.
Derivatives Disclosure
As part of the investment process, financial derivatives may be used to manage risk, provide diversification and enhance returns. The strategy may engage in foreign currency transactions, such as forwards, futures and options for investment or hedging purposes. The strategy may employ a variety of hedging strategies with respect to specific portfolio holdings, or to the entire portfolio, or to both. Such strategies include “cross-hedging” and “proxy hedging.” The strategy may also engage in exchange-traded interest rate futures and options for investment or hedging purposes. Derivative instruments are only used when and as guidelines and/or regulations permit.
20170418.1507
GIPS Presentation

For Institutional/Investment Professional Use Only.
Not for distribution to the public.
Benchmark Definitions
30
Strategic Fixed Income Strategy
Index Definition
Bloomberg Barclays Multiverse Index The Bloomberg Barclays Multiverse Index provides a broad-based measure of the global fixed income bond market. The index represents the union of the Global Aggregate
Index and the Global High Yield Index and captures investment grade and high yield securities in all eligible currencies.
Bloomberg Barclays US Aggregate Index The Bloomberg Barclays US Aggregate Bond Index represents securities that are US domestic, taxable, dollar-denominated. The index covers the US investment-grade
fixed-rate bond market, with index components for government and corporate securities, mortgage pass-through securities, and asset-backed securities.
Bloomberg Barclays US TIPS Index The Bloomberg Barclays Capital US TIPS Index consists of fixed-rate Inflation-Protection securities issued by the US Treasury with at least one year to maturity.
Citigroup Non-USD World Government
Bond Index
The Citigroup World Government Bond Index is a market capitalization weighted bond index consisting of the government bond markets of multiple countries. The index
includes government bonds that meet certain investability criteria, including, but not limited to, a fixed-rate coupon, an investment grade quality rating, a remaining maturity
of one year or longer and a minimum issuance size. The Non-USD Index excludes US dollar securities.
BofA Merrill Lynch US High YieldThe BofA Merrill Lynch U.S. High Yield Master II Index is composed of bonds in the form of publicly placed nonconvertible, coupon-bearing U.S. domestic debt and must
carry a maturity of at least one year. Issues must be rated by Standard & Poor’s or Moody’s Investors Service as less than investment grade (i.e., BBB or Baa) but not in
default (i.e., DD1 or less). This index excludes floating rate debt, equipment trust certificates and Title 11 securities.
JP Morgan EMBI Global
Diversified IndexJP Morgan EMBI Global Diversified Index is a uniquely weighted index that tracks total returns for U.S. dollar-denominated debt instruments issued by emerging market
sovereign and quasi-sovereign entities, including Brady bonds, loans and Eurobonds.
Citigroup 3-month T-bill Index The 3-month T-bill index measures monthly return equivalents of yield averages that are not marked to market. The 3-Month Treasury Bill Indices consist of the last three
three-month Treasury bill issues.
Russell 3000 Index The Russell 3000 Index measures the broad US equity universe representing approximately 98% of the US market. The Russell 3000 is completely reconstituted annually
to ensure new and growing equities are reflected.
MSCI EM IndexThe MSCI Emerging Markets NR Index is a free float-adjusted market capitalization index that is designed to measure equity market performance in the global emerging
markets. The universe includes large, mid, and small cap securities, and can be segmented across styles and sectors. Net total return indices reinvest dividends after the
deduction of withholding taxes, using a tax rate applicable to non-resident institutional investors who do not benefit from double taxation treaties.
MSCI EAFE Index The MSCI EAFE Index is an equity index which captures large and mid cap representation across Developed Markets countries around the world, excluding the US and
Canada. With 904 constituents, the index covers approximately 85% of the free float-adjusted market capitalization in each country.
Dow UBS Commodity IndexThe Dow Jones-UBS Commodity Index aims to provide broadly diversified representation of commodity markets as an asset class. The index is made up of exchange-
traded futures on physical commodities. Commodity weightings are based on production and liquidity, subject to weighting restrictions applied annually such that no related
group of commodities constitutes more than 33% of the index and no single commodity constitutes more than 15%.
FTSE NAREIT Equity REITs IndexThe FTSE NAREIT US Real Estate Index covers all US REITs and publicly-traded real estate companies. Stocks are free-float weighted to ensure that only the investable
opportunity set is included within the indices. The FTSE NAREIT Equity REITs index contains all Equity REITs not designated as Timber REITs or Infrastructure REITs.
Stocks are screened to ensure that the indices are tradable.
HFRX Global Hedge Fund IndexHFRX Global Hedge Fund Index is designed to be representative of the overall composition of the hedge fund universe. It is composed of all eligible hedge fund strategies,
including but not limited to convertible arbitrage, distressed securities, equity hedge, equity market neutral, event drive, macro, merger arbitrage, and relative value
arbitrage. The strategies are asset weighted based on the distribution of assets in the hedge fund industry.

For Institutional/Investment Professional Use Only.
Not for distribution to the public.
Benchmark Definitions
31
Strategic Fixed Income Strategy
Index Definition
Bloomberg Barclays US CMBS IndexThe Bloomberg Barclays CMBS ERISA-Eligible Index is the ERISA-eligible component of the Bloomberg Barclays CMBS Index. This index, which includes investment grade securities that are ERISA eligible under the underwriters exemption, is the only CMBS sector that is included in the U.S. Aggregate Index.
Bloomberg Barclays US High Yield Loan Index
The Bloomberg Barclays US High Yield Loans Index also known as the Bank Loan Index, provides broad and comprehensive total return metrics of the universe of syndicated term loans. To be included in the index, a bank loan must be dollar denominated, have at least $150 million funded loan, a minimum term of one year, and a minimum initial spread of LIBOR+125.
Bloomberg Barclays US
Government Index Comprised of the US Treasury and US Agency Indices, the US Government Index contains securities issued by the US Government.
JPMorgan GBI-EM Index The JPMorgan GBI-EM is a comprehensive emerging markets debt benchmark that track local currency bonds issued by Emerging Market governments.
Bloomberg Barclays US ABS IndexThe Asset-Backed Securities (ABS) Index has three subsectors (credit cards, autos and utilities). The index includes pass-through, bullet, and controlled amortization structures. The ABS Index includes only the senior class of each ABS issue and the ERISA-eligible B and C tranche.
BofA Merrill Lynch Global
High Yield
The BofA Merrill Lynch Global High Yield Index tracks the performance of USD, CAD, GBP and EUR denominated below investment grade corporate debt publicly issued in the major domestic or eurobond markets. Qualifying securities must have a below investment grade rating (based on an average of Moody’s, S&P and Fitch), at least 18 months to final maturity at the time of issuance, at least one year remaining term to final maturity as of the rebalancing date.
BofA Merrill Lynch US ConvertiblesThe index consists of convertible bonds traded in the U.S. dollar denominated investment grade and non investment grade convertible securities sold into the U.S. market and publicly traded in the United States. The Index constituents are market value weighted based on the convertible securities prices and outstanding shares.
JP Morgan CEMBI Broad DiversifiedThe JP Morgan Corporate Emerging Markets Bond Index (CEMBI) is a market capitalization weighted index consisting of liquid USD-denominated emerging market corporate bonds
Bloomberg Barclays Pan-Euro
Government Bond Index
The Pan-European Government Bond Index is a component of the Pan-European Aggregate Index. The index covers eligible government securities that are investment grade rated from the entire European continent. The Pan-European Index include eligible securities denominated in Euros (EUR), British pounds (GBP), Swedish krona (SEK), Danish krone (DKK), Norwegian krone (NOK), Czech koruna (CZK), Hungarian forint (HUF), Polish zloty (PLN), Slovenian tolar (SIT), Slovakian koruna (SKK), and Swiss franc (CHF). Securities in the index must have a remaining maturity of at least one year.
Bloomberg Barclays Asian Pacific
Government Bond Index
The Bloomberg Barclays Asian-Pacific Government Bond Index is a component of the Bloomberg Barclays Asia-Pacific Aggregate Index. The index includes investment-grade, fixed-rate securities that are issued in any of the following currencies: Australian Dollar, Hong Kong Dollar, Japanese Yen, New Zealand Dollar, Singapore Dollar, South Korean Won, and Thailand Baht. Securities in the index must have a remaining maturity of at least one year.
BofA Merrill Lynch Global
Corporate Index
The BofA Merrill Lynch Global Corporate Index tracks the performance of investment grade corporate debt publicly issued in the major domestic and eurobond markets. Qualifying securities must have an investment grade rating (based on an average of Moody’s, S&P and Fitch), at least 18 months to final maturity at the time of issuance, at least one year remaining term to final maturity as of the rebalancing date and a fixed coupon schedule.

For Institutional/Investment Professional Use Only.
Not for distribution to the public.
Investment Considerations
Any performance information shown is the strategy composite gross of fees, including advisory and investment management fees and other expenses an investor would incur, but net of transaction costs, unless otherwise
noted. Past performance is not indicative of future results. Net performance results reflect the application of the highest incremental rate of the standard investment advisory or management fee schedule to gross
performance results, unless otherwise indicated. Actual fees may vary depending on, among other things, the applicable fee schedule, portfolio size and/or investment management agreement. For example, if $100,000 were
invested and experienced a 10% annual return compounded monthly for 10 years, its ending value, without giving effect to the deduction of advisory or investment management fees, would be $270,704 with annualized
compounded return of 10.47%. If an advisory or investment management fee of 0.95% of the average market value of the account were deducted monthly for the 10-year period, the annualized compounded return would be
9.43% and the ending dollar value would be $246,355. Unless otherwise noted, returns greater than one year are annualized; calendar year returns for each one year period end in December. Discrepancies may occur due
to rounding.
Any performance information shown for discretionary strategies or solutions, and managed by an entity which is GIPS compliant and falls under the definition of a corresponding GIPS firm, is supplemental to the GIPS-
compliant presentation included in this material.
Any characteristics, guidelines, constraints or other information provided for this material is representative of the investment strategy and is provided for illustrative purpose only. They may change at any time and may differ
for a specific account. The account presented was selected by the firm as a representative account that is deemed to best represent this management style. Each client account is individually managed; actual holdings will
vary for each client and there is no guarantee that a particular client’s account will have the same characteristics as described herein. Any information about the holdings, asset allocation, or sector diversification is historical
and is not an indication of future performance or any future portfolio composition, which will vary. Portfolio holdings are representative of the strategy, are subject to change at any time and are not a recommendation to buy
or sell a security. The securities identified and described do not represent all of the securities purchased, sold or recommended for the portfolio. It should not be assumed that an investment in these securities or sectors was
or will be profitable.
No investment strategy or risk management technique can guarantee returns or eliminate risk in any market environment.
Diversification or asset allocation does not guarantee a profit nor protect against loss in any market. The indices referenced herein are broad-based securities market indices and used for illustrative purposes only. The
indices cited are widely accepted benchmarks for investment performance within their relevant regions, sectors or asset classes, and represent non-managed investment portfolios. Although these indices are similar to the
strategy’s objectives, there may be material differences including permitted holdings or investment strategies, which may impact returns. Broad-based securities indices are not subject to fees and expenses typically
associated with managed accounts or investment funds. Investments cannot be made directly into an index. The performance of the indices represents unmanaged, passive buy-and-hold strategies, investment
characteristics and risk/return profiles that differ materially from managed accounts or investment funds, and an investment in a managed account or investment fund is not comparable to an investment in such indices or in
the securities that comprise the indices. Investments of the managed account or investment fund may be illiquid, making, at times, fair market valuation impossible or impracticable. As a result, valuation of the managed
account or investment fund may be volatile, reducing the utility of comparison to any index whose underlying securities are priced according to market value, such as the indices. Investors should be aware that the managed
account or investment fund may incur losses both when major indices are rising and when they are falling.
If derivatives are employed, note that investing in derivative instruments involves risks different from, or possibly greater than, the risks associated with investing directly in securities and other traditional investments and, in a
down market, could become harder to value or sell at a fair price.
Source for information shown is Manulife Asset Management, unless otherwise noted.
32MSTR.385826

For Institutional/Investment Professional Use Only.
Not for distribution to the public.
Important Information
© 2017 Manulife Asset Management. All rights reserved. Manulife Asset Management, Manulife and the block design are trademarks of The Manufacturers Life Insurance Company and are used by it, and by its affiliates
under license.
This confidential document is for the exclusive use of the intended institutional investor or their agents and may not be transmitted, reproduced or used in whole or in part for any other purpose, nor may it be disclosed or
made available, directly or indirectly, in whole or in part, to any other person without our prior written consent.
Manulife Asset Management is the asset management arm of Manulife, a global organization that operates in many different jurisdictions worldwide. Manulife Asset Management’s diversified group of companies and
affiliates provide comprehensive asset management solutions for institutional investors, investment funds and individuals in key markets around the world. Manulife Asset Management has investment offices in the United
States, Canada, the United Kingdom, Japan, Hong Kong, and throughout Asia. Any private asset management activities described herein are conducted by various entities within the Manulife group of companies, including
regulated insurance companies, investment advisors and other entities in the US, Canada and other jurisdictions. Capabilities may be aggregated across entities for illustrative purposes.
These materials have not been reviewed by, are not registered with any securities or other regulatory authority, and may, where appropriate, be distributed by the following Manulife entities in their respective jurisdictions.
Additional information about Manulife Asset Management may be found at www.manulifeam.com.
Canada: Manulife Asset Management Limited, Manulife Asset Management Investments Inc., Manulife Asset Management (North America) Limited and Manulife Asset Management Private Markets (Canada) Corp.
Australia, South Korea and Hong Kong: Manulife Asset Management (Hong Kong) Limited. Indonesia: PT Manulife Aset Manajmen Indonesia. Japan: Manulife Asset Management (Japan) Limited. Malaysia: Manulife
Asset Management Services Berhad. Thailand: Manulife Asset Management (Thailand) Company Limited. Singapore: Manulife Asset Management (Singapore) Pte. Ltd. Taiwan: Manulife Asset Management (Taiwan) Co.
Ltd. United Kingdom and European Economic Area: Manulife Asset Management (Europe) Limited which is authorised and regulated by the Financial Conduct Authority. United States: Manulife Asset Management (US)
LLC, Hancock Capital Investment Management, LLC and Hancock Natural Resource Group, Inc. Vietnam: Manulife Asset Management (Vietnam) Company Ltd.
No Manulife entity makes any representation that the contents of this presentation are appropriate for use in all locations, or that the transactions, securities, products, instruments or services discussed in this presentation
are available or appropriate for sale or use in all jurisdictions or countries, or by all investors or counterparties. All recipients of this presentation are responsible for compliance with applicable laws and regulations.
Any general discussions or opinions contained within this document regarding securities or market conditions represent the view of either the source cited or Manulife Asset Management as of the day of writing and are
subject to change. There can be no assurance that actual outcomes will match the assumptions or that actual returns will match any expected returns. The information and/or analysis contained in this material have been
compiled or arrived at from sources believed to be reliable but Manulife Asset Management does not make any representation as to their accuracy, correctness, usefulness or completeness and does not accept liability for
any loss arising from the use hereof or the information and/or analysis contained herein. Information about the portfolio’s holdings, asset allocation, or country diversification is historical and will be subject to future change.
Neither Manulife Asset Management or its affiliates, nor any of their directors, officers or employees shall assume any liability or responsibility for any direct or indirect loss or damage or any other consequence of any person
acting or not acting in reliance on the information contained herein.
The information in this material may contain projections or other forward-looking statements regarding future events, targets, management discipline or other expectations, and is only as current as of the date indicated. The
information in this material including statements concerning financial market trends, are based on current market conditions, which will fluctuate and may be superseded by subsequent market events or for other reasons.
This material was prepared solely for informational purposes and does not constitute, and is not intended to constitute, a recommendation, professional advice, an offer, solicitation or an invitation by or on behalf of Manulife
Asset Management to any person to buy or sell any security or to adopt any investment strategy, and shall not form the basis of, nor may it accompany nor form part of, any right or contract to buy or sell any security or to
adopt any investment strategy. Nothing in this material constitutes investment, legal, accounting, tax or other advice, or a representation that any investment or strategy is suitable or appropriate to your individual
circumstances, or otherwise constitutes a personal recommendation to you. Prospective investors should take appropriate professional advice before making any investment decision. In all cases where historical
performance is presented, note that past performance is not indicative of future results and you should not rely upon it as the basis for making an investment decision.
33MSTR.385826

For Institutional/Investment Professional Use Only.
Not for distribution to the public.
Important Information (continued)
The distribution of the information contained in this presentation may be restricted by law and persons who access it are required to comply with any such restrictions. The contents of this presentation are not intended for
distribution to, or use by, any person or entity in any jurisdiction or country where such distribution or use would be contrary to any applicable laws or regulations. By accepting this material you confirm that you are aware of
the laws in your own jurisdiction relating to the provision and sale of the funds, portfolios or other investments discussed in this presentation and you warrant and represent that you will not pass on or utilize the information
contained in the presentation in a manner that could constitute a breach of such laws by any Manulife entity or any other person.
Australia: Manulife Asset Management (HK) Limited ("Manulife AM (HK)") is exempt from the requirement to hold an Australian financial services license under the Corporations Act in respect of the financial services being
offered in this material. Manulife AM (HK) is regulated by the Securities and Futures Commission of Hong Kong ("SFC") under Hong Kong laws, which differ from Australian laws. This presentation is directed at wholesale
investors only.
China: No invitation to offer, or offer for, or sale of any security will be made to the public in China (which, for such purposes, does not include the Hong Kong or Macau Special Administrative Regions or Taiwan) or by any
means that would be deemed public under the laws of China. The offering document of the subject fund(s) has not been submitted to or approved by the China Securities Regulatory Commission or other relevant
governmental authorities in China. Securities may only be offered or sold to Chinese investors that are authorized to buy and sell securities denominated in foreign exchange. Prospective investors resident in China are
responsible for obtaining all relevant approvals from the Chinese government authorities, including but not limited to the State Administration of Foreign Exchange, before purchasing an interest in the subject fund(s).
Hong Kong: This material is provided to Professional Investors [as defined in the Hong Kong Securities and Futures Ordinance and the Securities and Futures (Professional Investor) Rules] in Hong Kong only. It is not
intended for and should not be distributed to, or relied upon, by members of the public or retail investors. Neither Manulife AM Hong Kong nor any of its employees are licensed to deal as an estate agent with any property
situated in Hong Kong.
Malaysia: This material was prepared solely for information purposes and is not an offer or solicitation by anyone in any jurisdictions or to any person to whom it is unlawful to make such an offer or solicitation.
Singapore: This material is intended for Accredited Investors and Institutional Investors as defined in the Securities and Futures Act.
South Korea: This material is intended for Qualified Professional Investors under the Financial Investment Services and Capital Market Act ("FSCMA"). Manulife Asset Management does not make any representation with
respect to the eligibility of any recipient of these materials to acquire any interest in any security under the laws of Korea, including, without limitation, the Foreign Exchange Transaction Act and Regulations thereunder. An
interest may not be offered, sold or delivered directly or indirectly, or offered, sold or delivered to any person for re-offering or resale, directly or indirectly, in Korea or to any resident of Korea, except in compliance with the
FSCMA and any other applicable laws and regulations. The term “resident of Korea” means any natural person having his place of domicile or residence in Korea, or any corporation or other entity organized under the laws
of Korea or having its main office in Korea.
Switzerland: This presentation may be made available only to Qualified Investors as defined in the Swiss Collective Investment Schemes Act of 23 June 2006 (as amended).
United Kingdom and European Economic Area: The data and information presented is directed solely at persons who are Professional Investors in accordance with the Markets in Financial Instruments Directive
(2004/39/EC) as transposed into the relevant jurisdiction. Further, the information and data presented does not constitute, and is not intended to constitute, "marketing" as defined in the Alternative Investment Fund
Managers Directive.
United States: Manulife Asset Management (US) LLC (“MAM US”) and Manulife Asset Management (North America) Limited (“MAM NA”) are indirect wholly owned subsidiaries of Manulife. They may provide advisory
services, and may market such services, under the brand name “John Hancock Asset Management,” and MAM US may also use “Sovereign Asset Management.” These brand names may, as applicable, be described as “a
division of” MAM US or MAM NA, but are not separate legal entities. This material is not intended to be, nor shall it be interpreted or construed as, a recommendation or providing advice, impartial or otherwise. MAM US,
MAM NA, Hancock Capital Investment Management, LLC, and Hancock Natural Resource Group, Inc. and their representatives and/or affiliates may receive compensation derived from the sale of and/or from any
investment made in its products and services.
34MSTR.385826