Strategic Directions in Port State Control Benefits of Assessing Ship Risk Chris Barnes Maritime...
36
Strategic Directions in Port State Control Benefits of Assessing Ship Risk Chris Barnes Maritime Operations www.amsa.gov.au
-
Upload
ann-strickland -
Category
Documents
-
view
220 -
download
2
Transcript of Strategic Directions in Port State Control Benefits of Assessing Ship Risk Chris Barnes Maritime...

Strategic Directions in Port State Control
Benefits of
Assessing Ship Risk
Chris BarnesMaritime Operations www.amsa.gov.au

Annual Shipping Activity in Australia

Very LargeGeographical Coverage

The Challenge:• 21,000 arrivals by 3,700 foreign-flag ships each
year at 70 ports (some locations difficult to access, others experiencing rapid growth)
• Finite resources– 40 Marine Surveyors at 14 Major Ports
• Wide range of responsibilities– PSC/FSC, cargo inspections, marine qualifications, ISM
audits
Need to apply resources effectively
Maritime Industry is second most incident-prone industry on earth

Risk Management Concerns• AMSA had comprehensive records of more than
20,000 PSC inspections– Knew a lot about ships inspected, but– Did not have data to provide a national overview of
industry operating patterns and of ships not inspected– Profile and nature of Risk represented by shipping
industry was largely unknown
Did not have a clear view as to whether the inspection effort was correctly focussed on higher risk ships

Strategies• Redevelop Information Systems to record port
arrivals• Allocate objective risk indicators to arriving ships• Use ship risk as a guide in selection for inspection• Adopt performance measures that reflect risk
Seek to focus safety surveillance effort on higher risk
ships and, if appropriate, undertake inspections at
most convenient port

Review of Best Practice• Considered strategies in use by Paris MoU
and USCG– Degree of statistical analysis applied by Paris
MOU was not clear• Factors other than Flag appeared likely to be highly
relevant as indicators or lack of seaworthiness• European experience with certain Flags was not
repeated in Australia
– USCG Qualships 21 program appeared to have some limitations
• AMSA had detained several “Qualships”

Ship Risk Assessments• Undertook preliminary statistical analysis
in-house– Results and subsequent trial were very promising
• Commissioned full statistical analysis of data to identify and rank ship characteristics with predictive value in relation to likelihood of being unseaworthy

Statistical Analysis• Must be objective and thorough
• Aim to test many ship characteristics to determine which ones are valid indicators of seaworthiness
• Having found those factors that prove to be useful indicators of probability of detention
– rank them in order of importance and
– estimate their relative importance

Methodology• Consultants used Logistic Regression
techniques, to see which of many possible ship characteristics were statistically significant indicators of the probability of a ship being found to be unseaworthy at a PSC inspection.– ranked these factors by importance and
indicated relative importance
Logit(p) = Logep
1-p

Ship Risk Models• As bulk carriers represented 62% of ships
and 40% of port visits, these ships were analysed separately from other ship types
• These 2 models were used in AMSA’s database to allocate a “Risk Factor” to all ship arrivals
• Testing with “rolling timeframes” showed variations and trends from year to year– model based on most recent 5 years data
proved best

Specific Findings in 2002 Analysison Indicators of Seaworthiness
Bulk CarriersShip AgePrevious Insp No. DefsFlagGross TonnageInspection time gap
Whether 1st Insp
Other Ship TypesShip Age
Ship type
Whether 1st InspectionPrevious Insp No. DefsTime since Special SurvGross TonnageFlag, Recognised Org
Importance:11223344
Could be ignored
Some of the least important factors could be ignored in the final model, as they made little contribution.

How Risk Indicators were Used• Arriving ships were allocated a “Risk Factor”
to assist in selection for PSC• The “Risk Profiles” of ship arrivals were
identified, nationally and for each port– These risk profiles were used to consider level of
Surveyor resources needed at each AMSA Office
• Adopted Key Performance Indicators based on Ship Risk– Focus of inspections on higher risk ships– Priority for inspection based on risk

Port ArrivalsScreen

Ship Risk Profile - 2004-05 to 2006-07
0
1000
2000
3000
4000
5000
6000
0 1 2 3 4 5 6 7 8 9 10 11 12 13 14 15 >15
Risk Factor on Arrival
Nu
mb
er o
f S
hip
s
2004-05 2005-06 2006-07
Risk Profile Trends over Time

How Useful?Higher Risk Factor >>> deficiencies are more likely
Share of Inspections with Deficiencies vs Risk Factor Before Inspection3 years to 30 June 2007
0%
10%
20%
30%
40%
50%
60%
70%
80%
90%
100%
0 1 2 3 4 5 6 7 8 9 10 11 12 13 14 15 >15Risk Factor on Arrival
Sh
are
of
PS
C I
nsp
s w
ith
Def
icie
nci
es
Risk Factor of 10 indicates a 10% Probability that the Ship will be Detained at PSC Inspection

Average Deficiencies vs Risk Factor3 years ended 30 June 2007
0
1
2
3
4
5
6
7
8
0 1 2 3 4 5 6 7 8 9 10 11 12 13 14 15 >15Risk Factor Before Inspection
Ave
rag
e D
efic
ien
cies
Fo
un
d a
t P
SC
Risk Factor of 10 indicates a 10% Probability that the Ship will be Detained at PSC Inspection
How Useful?Higher Risk Factor >>> more deficiencies found

How Accurate?
AMSA - Actual vs Predicted PSC Detention Rate
for the 3 years to September 2006
0%
2%
4%
6%
8%
10%
12%
14%
16%
18%
0 1 2 3 4 5 6 7 8 9 10 11 12 13 14 15 >15Risk Factor on Arrival
Act
ual
Det
enti
on
Rat
e
Predicted Detention Rate
Actual Outcome
A Risk Factor of 10 means that there is a 10% probability that the ship will be detained at PSC inspection

How Successful?
Trends in PSC Deficiencies and Detention Rates
0%
1%
2%
3%
4%
5%
6%
7%
8%
9%
1996 1997 1998 1999 2000 2001 2002 2003 2004 2005 2006
Year
Det
enti
on
Rat
e
0.0
0.5
1.0
1.5
2.0
2.5
3.0
3.5
4.0
4.5
5.0
Ave
rag
e D
efic
ien
cies
Introduction of Statistical Targeting
STCW 95
Average Deficiencies

Cairns Office - Daily Ship Risk Profile
0 1 2 3 4 5 6 7
1/07/2006
3/07/2006
5/07/2006
7/07/2006
9/07/2006
11/07/2006
13/07/2006
15/07/2006
17/07/2006
19/07/2006
21/07/2006
Dat
e
Number of Arrivals
High Risk Med High Med Low Low Risk
Arrivals at 4 Portson same day
Risk Profile by AMSA Office

Benefits• Recording all port arrivals and identifying ship risk
greatly improved AMSA’s ability to regulate the Maritime Industry in an effective manner– Provided an overall view of the foreign-flag fleet (ships
inspected and those not inspected)– Ship risk profiles and trends, overall and by port– Growth rates and risk profiles by port (to assist planning)– Much better understanding of industry
• One third of foreign flag ships visiting in a year did not visit in the previous year
• Over one quarter of ships make only a single visit in a year (little opportunity to inspect)
• More than half of world fleet of Capesize bulk carriers visit Australia each year.

Performance Measures:Inspection Rates
by risk group - 2006
Risk Group Visits Eligible Insps Port Visit Eligible Ships Ship Insp
Visits Insp Rate Ships Inspected Rate
A high 6526 1329 1080 81.3% 852 817 96%
B medium high 3767 1220 722 59.2% 737 605 82%
C medium 5318 1899 750 39.5% 891 637 71%
D low 5182 2381 525 22.0% 944 479 51%
Totals 20793 6829 3077 45% 3424 2538 74%
Port visit basis Unique ship basis

Inspection Priority Based on RiskEligible Visit No. A high B medium high C medium low D low All
risk risk risk risk ships 0 1.9% 0.6% 1.1% 0.8% 1.2%
1 86.1% 70.9% 56.2% 49.5% 69.0%
2 9.8% 21.5% 24.3% 21.0% 18.0%
3 1.6% 6.0% 11.5% 14.7% 7.2%
4 0.6% 1.0% 3.7% 5.7% 2.3%
5 0.0% 0.0% 2.1% 4.4% 1.3%
6 0.0% 0.0% 0.8% 1.0% 0.4%
7 0.0% 0.1% 0.0% 1.7% 0.3%
8 0.0% 0.0% 0.1% 0.4% 0.1%
9 0.0% 0.0% 0.0% 0.8% 0.1%
10 0.0% 0.0% 0.0% 0.2% 0.0%
Totals 100% 100% 100% 100% 100%

Recent Developments• Clear and significant benefits of
Statistical Risk Management in several ways prompted AMSA to adopt further strategies– Update and extend PSC statistical analysis– Adopt inspection rate targets based
entirely on risk assessments– Revise related performance measures

Aims of Further Analysis• Analyse more recent data
– See if risk indicators are still valid or whether one or more new indicators should be adopted and/or some dropped
– See if there are objective links between ship operator and seaworthiness
– Undertake detailed analysis of deficiencies to see what relationships or trends can be identified
• Identify links between deficiency types and ship types over time– Possibility of PSC inspection checklists tailored to ship
type and risk profiles
• Consider deficiencies by nature (eg: Operational, Structural/Equipment, ISM or Human Factor

Findings of Updated Analysis• Some change with indicators of risk
– evolutionary rather than major changes
• A few ship operators are clearly high or low risk– Limitation is that there are many operators,
but relatively few have had sufficient inspections to allow a statistically-valid risk assessment
• Less than 5% of operators can be graded as being high or low risk – most are average risk

Ship Operator Risk• Analysis allowed AMSA to determine the risk
profile of a given Operator’s fleet of ships• This produced an expected detention rate for that
operator’s fleet which could then be compared to the actual detention rate for that operator
• Where actual detention rates were clearly much more or much less than the expected rate the operator could be categorised as high or low risk respectively.

New Inspection Rate Targets• Success of objective statistically-based risk
assessments justified change to a full risk basis for setting inspection rate targets
• 5 Priority Groups have been specified– SH: for single hull tankers - 100% inspection rate– P1: where Risk Factor is >5 80% rate– P2: where Risk Factor = 4 or 5 60% rate– P3: where Risk Factor = 2 or 3 40% rate; and– P1: where Risk Factor = 0 or 1 20% rate
Ships below 5 years of age eligible every 12 months
if they have no deficiencies

Distribution of Foreign-Flag Ships by Inspection Priority
Priority 447%
Priority 326%
Priority 211%
Priority 116%

2007 Risk IndicatorsBulk CarriersShip AgePrevious Insp No. DefsInspection time gapRecognised Org.Flag
Whether 1st Insp
Gross Tonnage
Other Ship TypesShip AgeShip Type Gross TonnageFlagPrevious Insp No. DefsInspection time gapWhether 1st InspRecognised Org
Time since Special Survey
Importance:12233344
No longer useful:
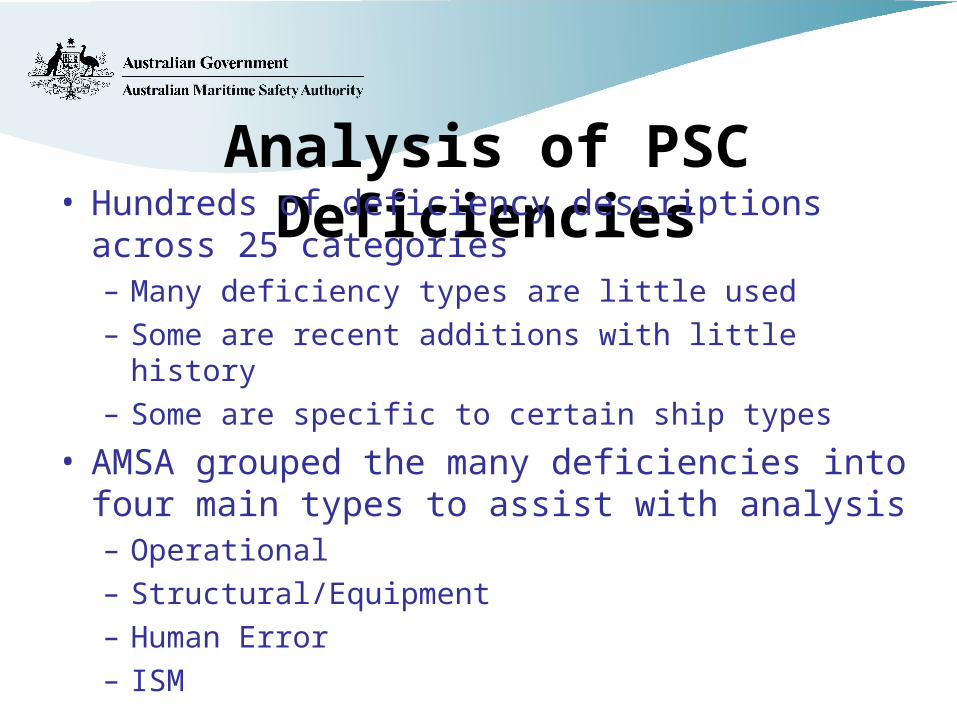
Analysis of PSC Deficiencies• Hundreds of deficiency descriptions across 25
categories– Many deficiency types are little used– Some are recent additions with little history– Some are specific to certain ship types
• AMSA grouped the many deficiencies into four main types to assist with analysis– Operational– Structural/Equipment– Human Error– ISM

Deficiency Types vs Ship Age1999 to 2005
0.0
0.5
1.0
1.5
2.0
2.5
3.0
3.5
4.0
4.5
5.0
0 1 2 3 4 5 6 7 8 9 10 11 12 13 14 15 16 17 18 19 20 21 22 23 24 25 >25
Ship Age at Inspection
Av
era
ge
De
fic
ien
cie
s p
er
Ins
pe
cti
on
Operational Human Factor Structural ISM
Incidence of Main Deficiency Categories

Deficiency Analysis• Aim is to be able to identify probability
of particular deficiency types occurring– according to the age & type of a given ship– other characteristics could also be relevant
• Need to be careful that Surveyors do not become too narrowly focussed and still look for other deficiency types, however.

Summary• Recording Port Arrivals and Assessing
Ship Risk of detention has resulted in major positive outcomes:– Much better understanding of Maritime
industry operating patterns– Improved focus on higher risk ships– Demonstrated rapid PSC response for higher
risk ships– Better geographical positioning of resources– Able to produce wide variety of useful reports– In short: many strategic benefits

Questions?