Strategic Delays in the Prosecution of Standard Essential ...
30
Strategic Delays SEPs Strategic Delays in the Prosecution of Standard Essential Patents BU TPRI IP Day 2018 Cesare Righi 1 Timothy Simcoe 2 1 Boston University, School of Law, Technology & Policy Research Initiative 2 Boston University, Questrom School of Business & NBER July 27, 2018 Cesare Righi (Boston University) Strategic Delays SEPs July 27, 2018 1 / 30
Transcript of Strategic Delays in the Prosecution of Standard Essential ...
Strategic Delays SEPs
Strategic Delays in the Prosecution of Standard EssentialPatents
BU TPRI IP Day 2018
Cesare Righi 1 Timothy Simcoe 2
1Boston University, School of Law, Technology & Policy Research Initiative
2Boston University, Questrom School of Business & NBER
July 27, 2018
Cesare Righi (Boston University) Strategic Delays SEPs July 27, 2018 1 / 30
Strategic Delays SEPs
Introduction
Introduction
Cesare Righi (Boston University) Strategic Delays SEPs July 27, 2018 2 / 30
Strategic Delays SEPs
Introduction
Standard Essential Patents
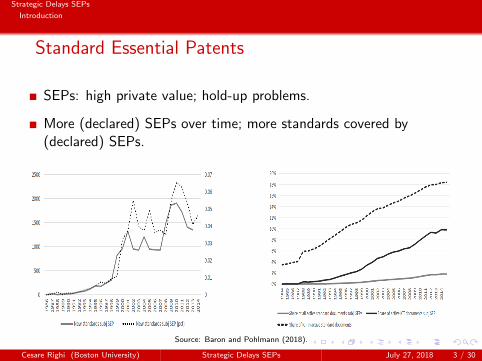
SEPs: high private value; hold-up problems.
More (declared) SEPs over time; more standards covered by(declared) SEPs.
Source: Baron and Pohlmann (2018).
Cesare Righi (Boston University) Strategic Delays SEPs July 27, 2018 3 / 30

Strategic Delays SEPs
Introduction
This paper
Strategic behavior of applicants for SEPs during prosecution
U.S. patent system provides unique tools to delay claim drafting andclaim changes (e.g. provisional applications, continuationapplications).
Key idea: delay application disposal until content of standard isknown to increase fit between patents and standards throughamendments to claims and filing of continuation applications
Analyze the delays of SEPs and similar patents
Relationship between standardization timing andI patent application disposalI filing of continuation applications (CONs)
Cesare Righi (Boston University) Strategic Delays SEPs July 27, 2018 4 / 30

Strategic Delays SEPs
Introduction
Results Preview
Compared with similar patents, SEPs have longer prosecution andaccumulate more delays.
Most SEPs are filed immediately before or after standard publication(many SEPs are CONs of applications filed previously).
Hazard of application disposal increases immediately after standardpublication.
Large increase in filing of continuation applications of SEPsimmediately after standard publication.
Downstream players drive these results.
Cesare Righi (Boston University) Strategic Delays SEPs July 27, 2018 5 / 30
Strategic Delays SEPs
Introduction
Contribution
Relationship between standards and patents (Bekkers et al., 2002,2017; Berger et al., 2012; Farrell et al., 2007; Kang and Bekkers,2015; Lemley and Shapiro, 2007; Lerner and Tirole, 2015; Shapiro,2001): companies exploit delays to obtain SEPs.
Strategic patenting Hall and Ziedonis (2001); Hegde et al. (2009);Ziedonis (2004): in the context of standard setting, the use ofcontinuation applications to build a “patent thicket” is related tostandardization timing.
Cesare Righi (Boston University) Strategic Delays SEPs July 27, 2018 6 / 30
Strategic Delays SEPs
Introduction
Roadmap
Prosecution of SEPs
Data
Comparison of SEPs and similar patents
Effect of standardization on CON filings: empirical strategy
Effect of standardization on CON filings: results
Implication of delays for post-grant outcomes
Conclusion
Cesare Righi (Boston University) Strategic Delays SEPs July 27, 2018 7 / 30
Strategic Delays SEPs
Prosecution of SEPs
Prosecution of SEPs
Cesare Righi (Boston University) Strategic Delays SEPs July 27, 2018 8 / 30
Strategic Delays SEPs
Prosecution of SEPs
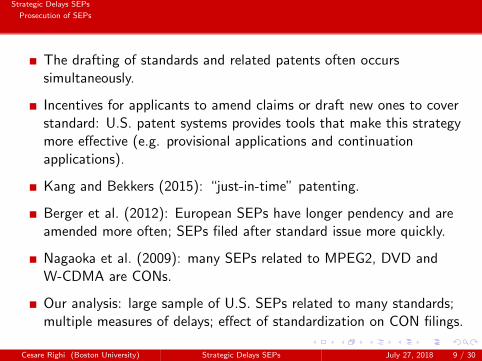
The drafting of standards and related patents often occurssimultaneously.
Incentives for applicants to amend claims or draft new ones to coverstandard: U.S. patent systems provides tools that make this strategymore effective (e.g. provisional applications and continuationapplications).
Kang and Bekkers (2015): “just-in-time” patenting.
Berger et al. (2012): European SEPs have longer pendency and areamended more often; SEPs filed after standard issue more quickly.
Nagaoka et al. (2009): many SEPs related to MPEG2, DVD andW-CDMA are CONs.
Our analysis: large sample of U.S. SEPs related to many standards;multiple measures of delays; effect of standardization on CON filings.
Cesare Righi (Boston University) Strategic Delays SEPs July 27, 2018 9 / 30

Strategic Delays SEPs
Data
Data
Cesare Righi (Boston University) Strategic Delays SEPs July 27, 2018 10 / 30
Strategic Delays SEPs
Data
Data sources
SEPs: Searle Center Database on technology standards and standardsetting organizations (SCDB) (Baron and Gupta, 2018; Baron andPohlmann, 2018; Baron and Spulber, 2018); dSEP database (Bekkerset al., 2017).
I Caveat: declared SEPs.
Patents/ApplicationsI Patent Examination Research Dataset (Graham et al., 2015);I PatentsView;I Patent Claims Research Dataset (Marco et al., 2016);I Thomson Innovation;I Patent Citation Similarity Dataset (Younge and Kuhn, 2016).
Cesare Righi (Boston University) Strategic Delays SEPs July 27, 2018 11 / 30
Strategic Delays SEPs
Data
Sample
22,644 “regular” utility SEPs (patents and applications); 19,539granted before June 2017.
86% of the SEPs are filed after the enactment of the AIPA(November 29, 2000).
Standardization: for each SEP, we take the earliest standardpublication date (month-year): information for 17,417 SEPs.
97% of the first standard publications between 2000-2014.
Cesare Righi (Boston University) Strategic Delays SEPs July 27, 2018 12 / 30
Strategic Delays SEPs
Data
Standard publication and SEP filing date
050
010
0015
0020
00#
SE
Ps
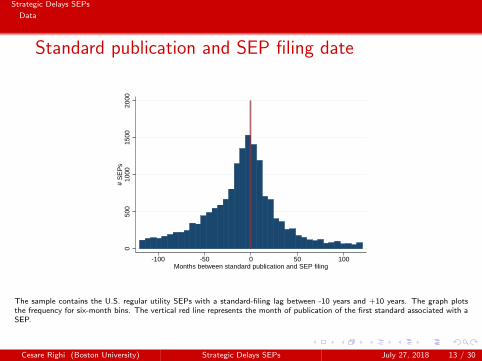
-100 -50 0 50 100Months between standard publication and SEP filing
The sample contains the U.S. regular utility SEPs with a standard-filing lag between -10 years and +10 years. The graph plotsthe frequency for six-month bins. The vertical red line represents the month of publication of the first standard associated with aSEP.
Cesare Righi (Boston University) Strategic Delays SEPs July 27, 2018 13 / 30
Strategic Delays SEPs
Data
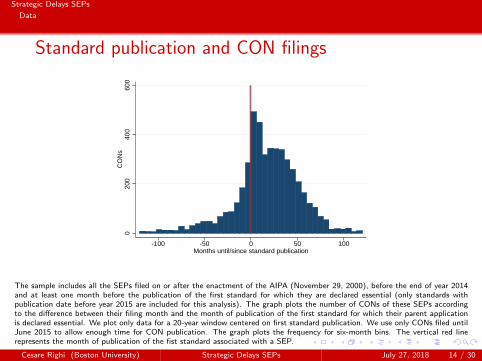
Standard publication and CON filings
020
040
060
0C
ON
s
-100 -50 0 50 100Months until/since standard publication
The sample includes all the SEPs filed on or after the enactment of the AIPA (November 29, 2000), before the end of year 2014and at least one month before the publication of the first standard for which they are declared essential (only standards withpublication date before year 2015 are included for this analysis). The graph plots the number of CONs of these SEPs accordingto the difference between their filing month and the month of publication of the first standard for which their parent applicationis declared essential. We plot only data for a 20-year window centered on first standard publication. We use only CONs filed untilJune 2015 to allow enough time for CON publication. The graph plots the frequency for six-month bins. The vertical red linerepresents the month of publication of the fist standard associated with a SEP.
Cesare Righi (Boston University) Strategic Delays SEPs July 27, 2018 14 / 30
Strategic Delays SEPs
Comparison of SEPs with similar patents
Comparison of SEPs with similarpatents
Cesare Righi (Boston University) Strategic Delays SEPs July 27, 2018 15 / 30
Strategic Delays SEPs
Comparison of SEPs with similar patents
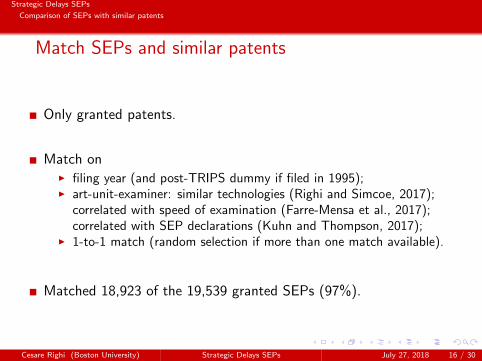
Match SEPs and similar patents
Only granted patents.
Match onI filing year (and post-TRIPS dummy if filed in 1995);I art-unit-examiner: similar technologies (Righi and Simcoe, 2017);
correlated with speed of examination (Farre-Mensa et al., 2017);correlated with SEP declarations (Kuhn and Thompson, 2017);
I 1-to-1 match (random selection if more than one match available).
Matched 18,923 of the 19,539 granted SEPs (97%).
Cesare Righi (Boston University) Strategic Delays SEPs July 27, 2018 16 / 30

Strategic Delays SEPs
Comparison of SEPs with similar patents
Comparison of SEPs and similar patents
(1) (2) (3) (4)Matched Controls Matched SEPs T-stat Norm. Diff.
Children: CONs 0.20 0.60 22.80 0.23CON 0.15 0.25 23.31 0.24Children: DIVs 0.06 0.18 7.48 0.08DIV 0.04 0.08 15.63 0.16Children: CIPs 0.07 0.06 0.75 -0.01CIP 0.04 0.04 1.44 0.01Provisional 0.21 0.28 16.74 0.17PCT 0.18 0.31 31.69 0.33Foreign priority 0.35 0.48 26.63 0.27Days earliest-priority-issuance 1,914.94 2,327.30 39.55 0.41Days filing-issuance 1,244.01 1,248.25 0.64 0.01Requests for extension of time 0.55 0.69 13.25 0.14
Applicant delay† 52.71 79.38 20.09 0.22Obs. 18,923 18,923
†We exclude strata with missing values for applicant delay for at least one patent.
Cesare Righi (Boston University) Strategic Delays SEPs July 27, 2018 17 / 30
Strategic Delays SEPs
Effect of standardization on CON filings: empirical strategy
Effect of standardization on CONfilings: empirical strategy
Cesare Righi (Boston University) Strategic Delays SEPs July 27, 2018 18 / 30

Strategic Delays SEPs
Effect of standardization on CON filings: empirical strategy
Empirical strategy (1/2)
Experiment: sample of patent applications; randomly assignstandard-essentiality; compare CON filings between standard-essentialand controls.
Endogeneity threat in observational study: more valuable patentapplications are more likely to be standard-essential and more likely tohave children applications (upward bias).
Our solution: matching & timing of standardization.I match on art-unit-examiner-filing-month & trend in CON filings before
standardization (we use both issued and abandoned applications).I Application fixed-effects.
Sample: SEPs filed after AIPA, before standard publication andbefore year 2015; matched controls; observed until June 2015;monthly observations.
Cesare Righi (Boston University) Strategic Delays SEPs July 27, 2018 19 / 30
Strategic Delays SEPs
Effect of standardization on CON filings: empirical strategy
Empirical strategy (2/2)
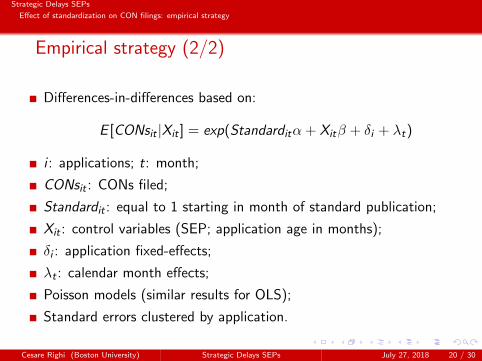
Differences-in-differences based on:
E [CONsit |Xit ] = exp(Standarditα + Xitβ + δi + λt)
i : applications; t: month;
CONsit : CONs filed;
Standardit : equal to 1 starting in month of standard publication;
Xit : control variables (SEP; application age in months);
δi : application fixed-effects;
λt : calendar month effects;
Poisson models (similar results for OLS);
Standard errors clustered by application.
Cesare Righi (Boston University) Strategic Delays SEPs July 27, 2018 20 / 30
Strategic Delays SEPs
Effect of standardization on CON filings: results
Effect of standardization on CONfilings: results
Cesare Righi (Boston University) Strategic Delays SEPs July 27, 2018 21 / 30
Strategic Delays SEPs
Effect of standardization on CON filings: results
Sample balance
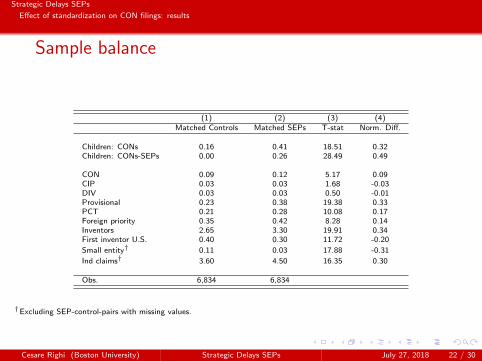
(1) (2) (3) (4)Matched Controls Matched SEPs T-stat Norm. Diff.
Children: CONs 0.16 0.41 18.51 0.32Children: CONs-SEPs 0.00 0.26 28.49 0.49
CON 0.09 0.12 5.17 0.09CIP 0.03 0.03 1.68 -0.03DIV 0.03 0.03 0.50 -0.01Provisional 0.23 0.38 19.38 0.33PCT 0.21 0.28 10.08 0.17Foreign priority 0.35 0.42 8.28 0.14Inventors 2.65 3.30 19.91 0.34First inventor U.S. 0.40 0.30 11.72 -0.20
Small entity† 0.11 0.03 17.88 -0.31
Ind claims† 3.60 4.50 16.35 0.30
Obs. 6,834 6,834
†Excluding SEP-control-pairs with missing values.
Cesare Righi (Boston University) Strategic Delays SEPs July 27, 2018 22 / 30
Strategic Delays SEPs
Effect of standardization on CON filings: results
Effect of standard publication on CON filings
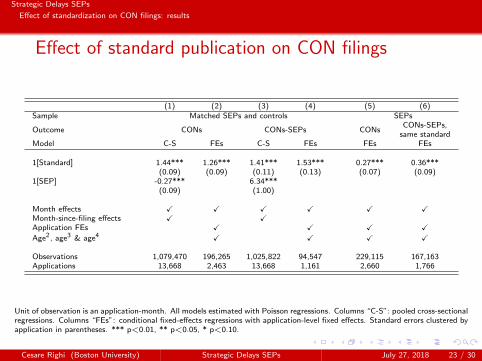
(1) (2) (3) (4) (5) (6)Sample Matched SEPs and controls SEPs
Outcome CONs CONs-SEPs CONsCONs-SEPs,
same standardModel C-S FEs C-S FEs FEs FEs
1[Standard] 1.44*** 1.26*** 1.41*** 1.53*** 0.27*** 0.36***(0.09) (0.09) (0.11) (0.13) (0.07) (0.09)
1[SEP] -0.27*** 6.34***(0.09) (1.00)
Month effects X X X X X XMonth-since-filing effects X XApplication FEs X X X XAge2, age3 & age4 X X X X
Observations 1,079,470 196,265 1,025,822 94,547 229,115 167,163Applications 13,668 2,463 13,668 1,161 2,660 1,766
Unit of observation is an application-month. All models estimated with Poisson regressions. Columns “C-S”: pooled cross-sectionalregressions. Columns “FEs”: conditional fixed-effects regressions with application-level fixed effects. Standard errors clustered byapplication in parentheses. *** p<0.01, ** p<0.05, * p<0.10.
Cesare Righi (Boston University) Strategic Delays SEPs July 27, 2018 23 / 30
Strategic Delays SEPs
Effect of standardization on CON filings: results
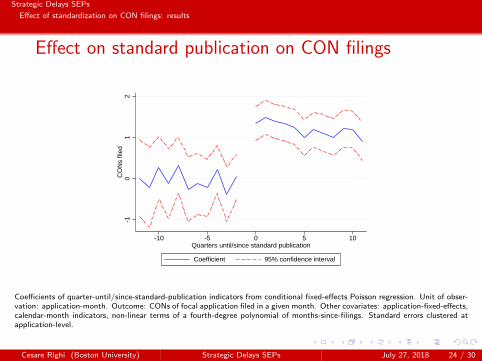
Effect on standard publication on CON filings
-10
12
CO
Ns
filed
-10 -5 0 5 10Quarters until/since standard publication
Coefficient 95% confidence interval
Coefficients of quarter-until/since-standard-publication indicators from conditional fixed-effects Poisson regression. Unit of obser-vation: application-month. Outcome: CONs of focal application filed in a given month. Other covariates: application-fixed-effects,calendar-month indicators, non-linear terms of a fourth-degree polynomial of months-since-filings. Standard errors clustered atapplication-level.
Cesare Righi (Boston University) Strategic Delays SEPs July 27, 2018 24 / 30
Strategic Delays SEPs
Effect of standardization on CON filings: results
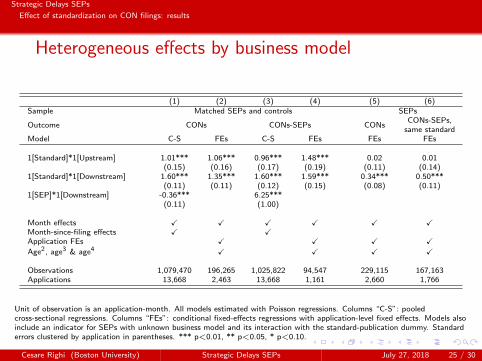
Heterogeneous effects by business model
(1) (2) (3) (4) (5) (6)Sample Matched SEPs and controls SEPs
Outcome CONs CONs-SEPs CONsCONs-SEPs,
same standardModel C-S FEs C-S FEs FEs FEs
1[Standard]*1[Upstream] 1.01*** 1.06*** 0.96*** 1.48*** 0.02 0.01(0.15) (0.16) (0.17) (0.19) (0.11) (0.14)
1[Standard]*1[Downstream] 1.60*** 1.35*** 1.60*** 1.59*** 0.34*** 0.50***(0.11) (0.11) (0.12) (0.15) (0.08) (0.11)
1[SEP]*1[Downstream] -0.36*** 6.25***(0.11) (1.00)
Month effects X X X X X XMonth-since-filing effects X XApplication FEs X X X XAge2, age3 & age4 X X X X
Observations 1,079,470 196,265 1,025,822 94,547 229,115 167,163Applications 13,668 2,463 13,668 1,161 2,660 1,766
Unit of observation is an application-month. All models estimated with Poisson regressions. Columns “C-S”: pooledcross-sectional regressions. Columns “FEs”: conditional fixed-effects regressions with application-level fixed effects. Models alsoinclude an indicator for SEPs with unknown business model and its interaction with the standard-publication dummy. Standarderrors clustered by application in parentheses. *** p<0.01, ** p<0.05, * p<0.10.
Cesare Righi (Boston University) Strategic Delays SEPs July 27, 2018 25 / 30
Strategic Delays SEPs
Implications of delays
Implications of delays
Cesare Righi (Boston University) Strategic Delays SEPs July 27, 2018 26 / 30
Strategic Delays SEPs
Implications of delays
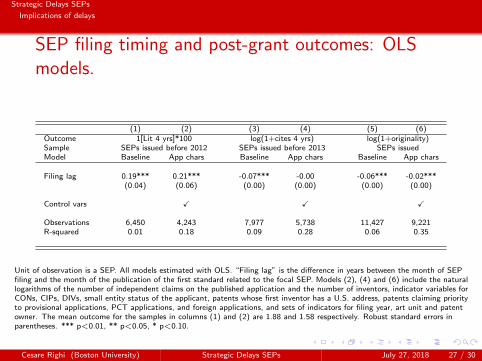
SEP filing timing and post-grant outcomes: OLSmodels.
(1) (2) (3) (4) (5) (6)Outcome 1[Lit 4 yrs]*100 log(1+cites 4 yrs) log(1+originality)Sample SEPs issued before 2012 SEPs issued before 2013 SEPs issuedModel Baseline App chars Baseline App chars Baseline App chars
Filing lag 0.19*** 0.21*** -0.07*** -0.00 -0.06*** -0.02***(0.04) (0.06) (0.00) (0.00) (0.00) (0.00)
Control vars X X X
Observations 6,450 4,243 7,977 5,738 11,427 9,221R-squared 0.01 0.18 0.09 0.28 0.06 0.35
Unit of observation is a SEP. All models estimated with OLS. “Filing lag” is the difference in years between the month of SEPfiling and the month of the publication of the first standard related to the focal SEP. Models (2), (4) and (6) include the naturallogarithms of the number of independent claims on the published application and the number of inventors, indicator variables forCONs, CIPs, DIVs, small entity status of the applicant, patents whose first inventor has a U.S. address, patents claiming priorityto provisional applications, PCT applications, and foreign applications, and sets of indicators for filing year, art unit and patentowner. The mean outcome for the samples in columns (1) and (2) are 1.88 and 1.58 respectively. Robust standard errors inparentheses. *** p<0.01, ** p<0.05, * p<0.10.
Cesare Righi (Boston University) Strategic Delays SEPs July 27, 2018 27 / 30
Strategic Delays SEPs
Conclusion
Conclusion
Cesare Righi (Boston University) Strategic Delays SEPs July 27, 2018 28 / 30
Strategic Delays SEPs
Conclusion
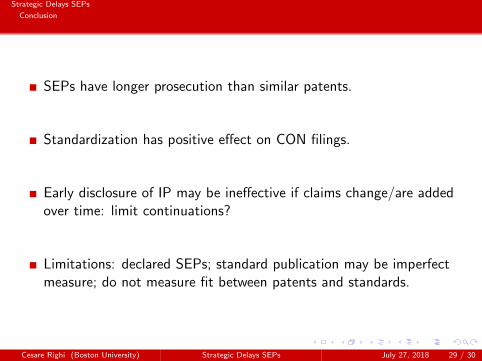
SEPs have longer prosecution than similar patents.
Standardization has positive effect on CON filings.
Early disclosure of IP may be ineffective if claims change/are addedover time: limit continuations?
Limitations: declared SEPs; standard publication may be imperfectmeasure; do not measure fit between patents and standards.
Cesare Righi (Boston University) Strategic Delays SEPs July 27, 2018 29 / 30
Strategic Delays SEPs
Thank You!
Thank [email protected]
Cesare Righi (Boston University) Strategic Delays SEPs July 27, 2018 30 / 30