Strategic decisions and shareholder value: an analysis … · Strategic decisions and shareholder...
21
University of Arkansas, Fayeeville ScholarWorks@UARK Accounting Undergraduate Honors eses Accounting 5-2012 Strategic decisions and shareholder value: an analysis of ConocoPhillips Michael Miller University of Arkansas, Fayeeville Follow this and additional works at: hp://scholarworks.uark.edu/acctuht Part of the Finance and Financial Management Commons is esis is brought to you for free and open access by the Accounting at ScholarWorks@UARK. It has been accepted for inclusion in Accounting Undergraduate Honors eses by an authorized administrator of ScholarWorks@UARK. For more information, please contact [email protected]. Recommended Citation Miller, Michael, "Strategic decisions and shareholder value: an analysis of ConocoPhillips" (2012). Accounting Undergraduate Honors eses. 3. hp://scholarworks.uark.edu/acctuht/3
Transcript of Strategic decisions and shareholder value: an analysis … · Strategic decisions and shareholder...
University of Arkansas, FayettevilleScholarWorks@UARK
Accounting Undergraduate Honors Theses Accounting
5-2012
Strategic decisions and shareholder value: ananalysis of ConocoPhillipsMichael MillerUniversity of Arkansas, Fayetteville
Follow this and additional works at: http://scholarworks.uark.edu/acctuht
Part of the Finance and Financial Management Commons
This Thesis is brought to you for free and open access by the Accounting at ScholarWorks@UARK. It has been accepted for inclusion in AccountingUndergraduate Honors Theses by an authorized administrator of ScholarWorks@UARK. For more information, please contact [email protected].
Recommended CitationMiller, Michael, "Strategic decisions and shareholder value: an analysis of ConocoPhillips" (2012). Accounting Undergraduate HonorsTheses. 3.http://scholarworks.uark.edu/acctuht/3
Strategic Decisions and Shareholder Value: An Analysis of ConocoPhillips
By
Michael Cameron Miller
Advisor: Ms. Susan Bristow
An Honors Thesis in partial fulfillment of the requirements for the degree Bachelor of
Science in Business Administration in
Accounting
Sam M. Walton College of Business
University of Arkansas
Fayetteville, Arkansas
May 11, 2012
1
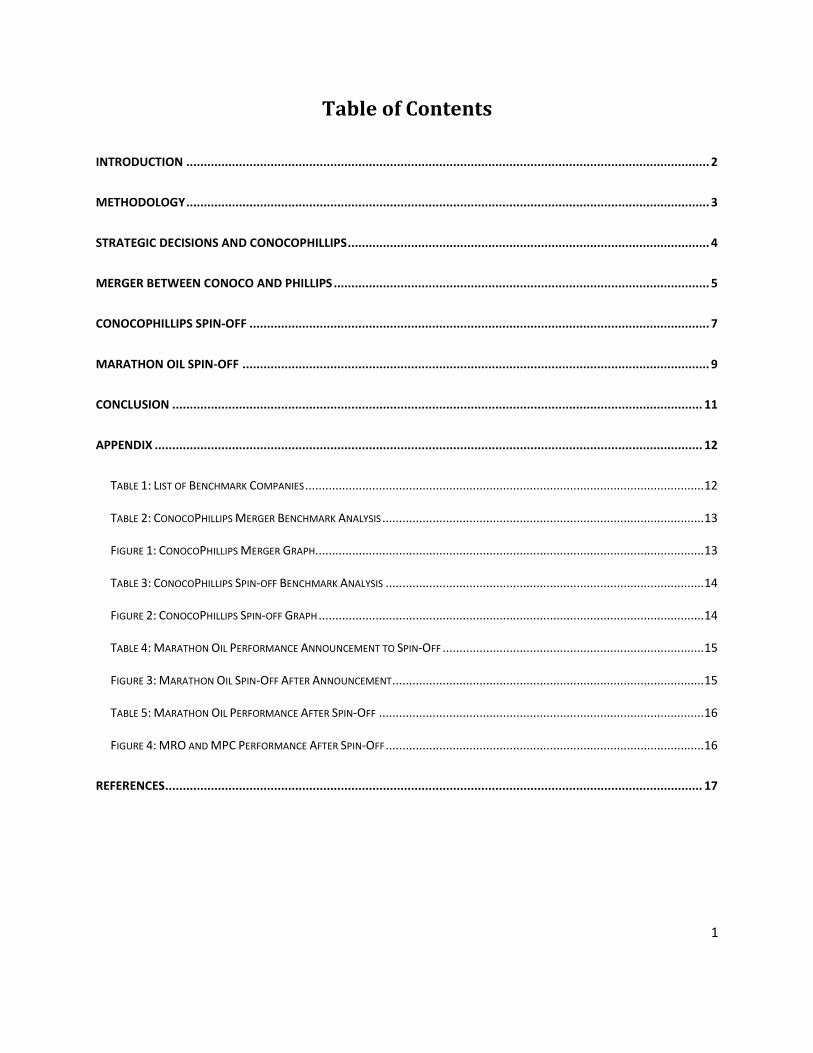
Table of Contents
INTRODUCTION ..................................................................................................................................................... 2
METHODOLOGY ..................................................................................................................................................... 3
STRATEGIC DECISIONS AND CONOCOPHILLIPS ....................................................................................................... 4
MERGER BETWEEN CONOCO AND PHILLIPS ........................................................................................................... 5
CONOCOPHILLIPS SPIN-OFF ................................................................................................................................... 7
MARATHON OIL SPIN-OFF ..................................................................................................................................... 9
CONCLUSION ....................................................................................................................................................... 11
APPENDIX ............................................................................................................................................................ 12
TABLE 1: LIST OF BENCHMARK COMPANIES ....................................................................................................................... 12
TABLE 2: CONOCOPHILLIPS MERGER BENCHMARK ANALYSIS ................................................................................................ 13
FIGURE 1: CONOCOPHILLIPS MERGER GRAPH.................................................................................................................... 13
TABLE 3: CONOCOPHILLIPS SPIN-OFF BENCHMARK ANALYSIS ............................................................................................... 14
FIGURE 2: CONOCOPHILLIPS SPIN-OFF GRAPH ................................................................................................................... 14
TABLE 4: MARATHON OIL PERFORMANCE ANNOUNCEMENT TO SPIN-OFF .............................................................................. 15
FIGURE 3: MARATHON OIL SPIN-OFF AFTER ANNOUNCEMENT ............................................................................................. 15
TABLE 5: MARATHON OIL PERFORMANCE AFTER SPIN-OFF ................................................................................................. 16
FIGURE 4: MRO AND MPC PERFORMANCE AFTER SPIN-OFF ............................................................................................... 16
REFERENCES ......................................................................................................................................................... 17
2
INTRODUCTION
Through the difficult market volatility for investors in the past few years, corporations
never settled for allowing the market to completely dictate the share price of their company.
During this time period companies strove to create value for their shareholders through making
strategic decisions. Many companies utilized strategic decisions to give more value to
shareholders of their stock. Extensive research has been done in the field of market returns,
especially with spin-offs and the returns they create for investors. The research from Cusatis,
Miles, and Woolridge (1993) shows that investors could outperform the market by investing in
spin-offs, in some cases the return was 700% the initial investment. If a common investor knew
these kinds of opportunities, they could continue to find new ways to invest their money.
One company that has consistently striven to create shareholder value for its investors is
ConocoPhillips. This Fortune 500 Company was created through a merger in 2002, and began
aggressively competing against its peers (ExxonMobil, Shell, BP, and Chevron). In 2009 they
outlined a detailed asset sale program, and eventually implemented a plan to increase shareholder
value in 2010. Their plan included selling $15-20 billion in assets, repurchasing $10 billion in
stock, and increased dividends. The final step they took towards creating value was beginning
the steps toward a spin-off of their refining business that will be completed in the second quarter
of 2012. This commitment to increasing shareholder value is the reason that this study will
highlight and analyze a few of the strategic decisions that ConocoPhillips made throughout their
existence and provide market comparison for how their shareholder value plan compares against
the returns of the market and benchmarked companies. The strategic decisions that will be
3
highlighted will be the merger that created ConocoPhillips, and the upcoming spin-off to create
Phillips 66.
In the summer of 2011, I interned for ConocoPhillips in their Lower 48 division in Plans
and Budgets, specifically the investment and portfolio group. My main project for the summer
was to create a database that compared ConocoPhillips’s operations in specific geographic
regions to competitors. I analyzed ConocoPhillips and 30 other competitors. This gave me a
comprehensive view of the oil and gas industry, ConocoPhillips, and their main competitors.
Mid-way through my summer internship, ConocoPhillips announced that it planned to split into
two leading energy companies.
I remember reading analyst reports that were forwarded to me by my supervisors on the
upcoming spin-off. Analysts worked diligently to show the value that this transaction held for
shareholders. One of the common things completed was comparing ConocoPhillips spin-off to
Marathon Oil’s spin-off of Marathon Petroleum. Marathon Oil was once an integrated oil and
gas company, but smaller in size than ConocoPhillips, and spun-off its downstream and
midstream parts of the business. Through this thesis, Marathon’s spin-off will be used as a
comparison for ConocoPhillips and to demonstrate what investors could expect from the spin-
off.
METHODOLOGY
The main objective of this study pivots on the idea of being able to create a comparison
for strategic decisions and how it might benefit an investor. Utilizing a simple view of finance
and investing, a comparison a companies’ stock performances on four time dates: day of the
decision/implementation, one week afterward, one month afterward, and six months afterward
4
was completed. A timeframe of longer than six months the stock performance could attribute to
normal operations and less of the market reaction to the strategic decision. For the Marathon Oil
spin-off, the returns that investors had is shown, by demonstrating the return based on if an
investor were to purchase two shares on the announcement, and follow his or her returns through
different dates. The comparison was exceedingly important for this research, and the three major
market indexes that were chosen are: NASDAQ, S&P 500, and the Dow Jones Industrial
Average. These three market indices were chosen because they are the most common market
indices, and are referenced most when determining how the market moved on a specific day.
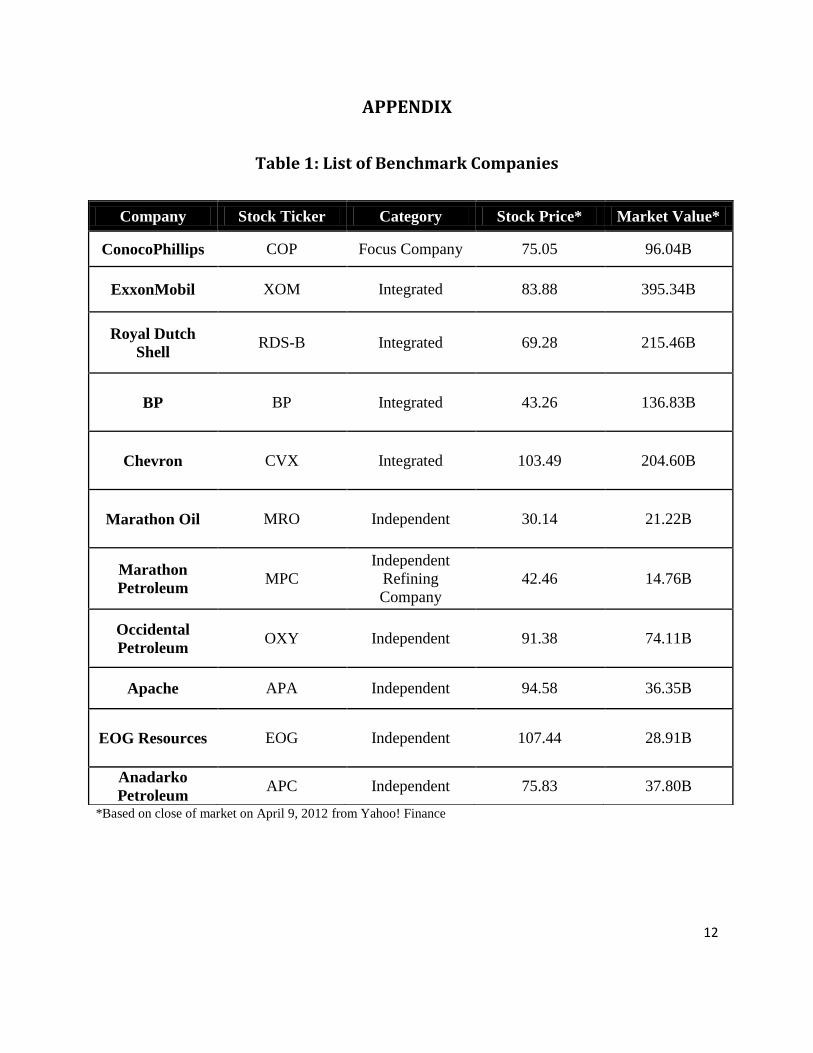
The list of benchmark companies are in Table 1: Benchmark Companies located in the Appendix
along with a brief description of the business, stock price at the close of market on April 9, 2012,
and the market value of the company. The benchmark group was selected based on
ConocoPhillips current peer group (major integrated) and their new peer group after their spin-
off (major independent); as well as Marathon Petroleum to provide insight into what could be
expected for ConocoPhillips upcoming spin-off. Information was gathered on the stock’s
performance for key dates for ConocoPhillips’ strategic plan to create shareholder value. The
gain of the stock is compared then to individual companies in the benchmark, and also a simple
mean of the return for each group: market indices, integrated oil and gas, and independent oil and
gas. The information gathered should provide insight to whether value was actually created for
shareholders through the comparison of ConocoPhillips stock performance to the benchmark.
STRATEGIC DECISIONS AND CONOCOPHILLIPS
The history of ConocoPhillips has been one of strategic decisions that create value for
shareholders and the company. They implemented a plan in 2010 to sell $15-20 billion in assets,
5
while simultaneously repurchasing $10 billion in common stock. They also utilized the extra
cash to improve their operations to better serve stockholders. Their continual success on
maintaining an edge by providing value for shareholders has served the company well through
stock performance. However, there are other large strategic decisions that play a significant role
on the value that is created for shareholders. In the following sections, two such strategic
decisions will be discussed and their impact on shareholders analyzed; those two strategic
decisions are the merger that created ConocoPhillips and the upcoming spin-off to create Phillips
66.
MERGER BETWEEN CONOCO AND PHILLIPS
There are many motives that a firm could have to complete a merger, and in a paper
issued by the Federal Trade Commission titled Evidence on Mergers and Acquisitions by Pautler
(2001), the author lists some motives that a company could have in making this strategic
decision. Of them, the most common one is for the competing companies to come together to
position themselves for a long term goal. This is the case of ConocoPhillips, whose merger,
announced on November 19, 2001, was created to position them to better compete against other
leading companies in their peer group consisting of ExxonMobil, Shell, Chevron, and BP.
Another large factor in the decision to merge companies is efficiencies, which could involve
cost-saving, utilizing less employees to accomplish the same thing, increase output, and combine
research efforts of the companies. These efficiencies are difficult to create for a firm, and
sometimes a merger is the only way to achieve them. An example of how the efficiencies could
be passed onto consumers is found in the press release that announced the merger claimed that
6
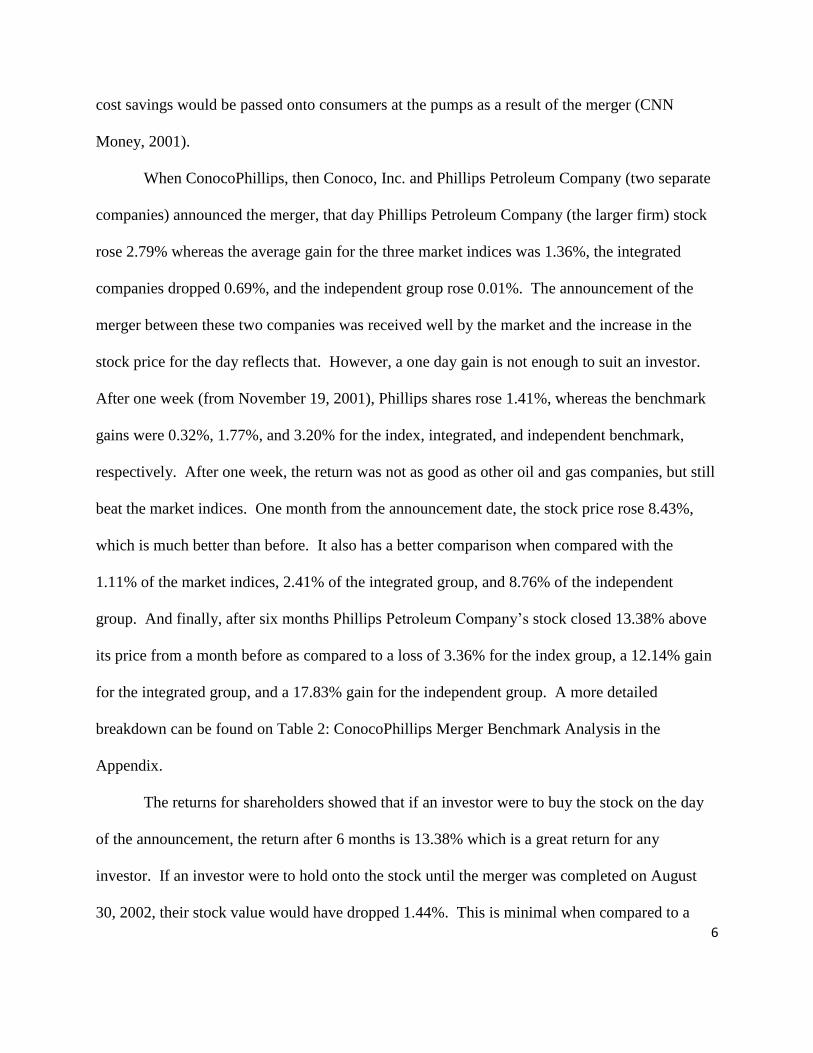
cost savings would be passed onto consumers at the pumps as a result of the merger (CNN
Money, 2001).
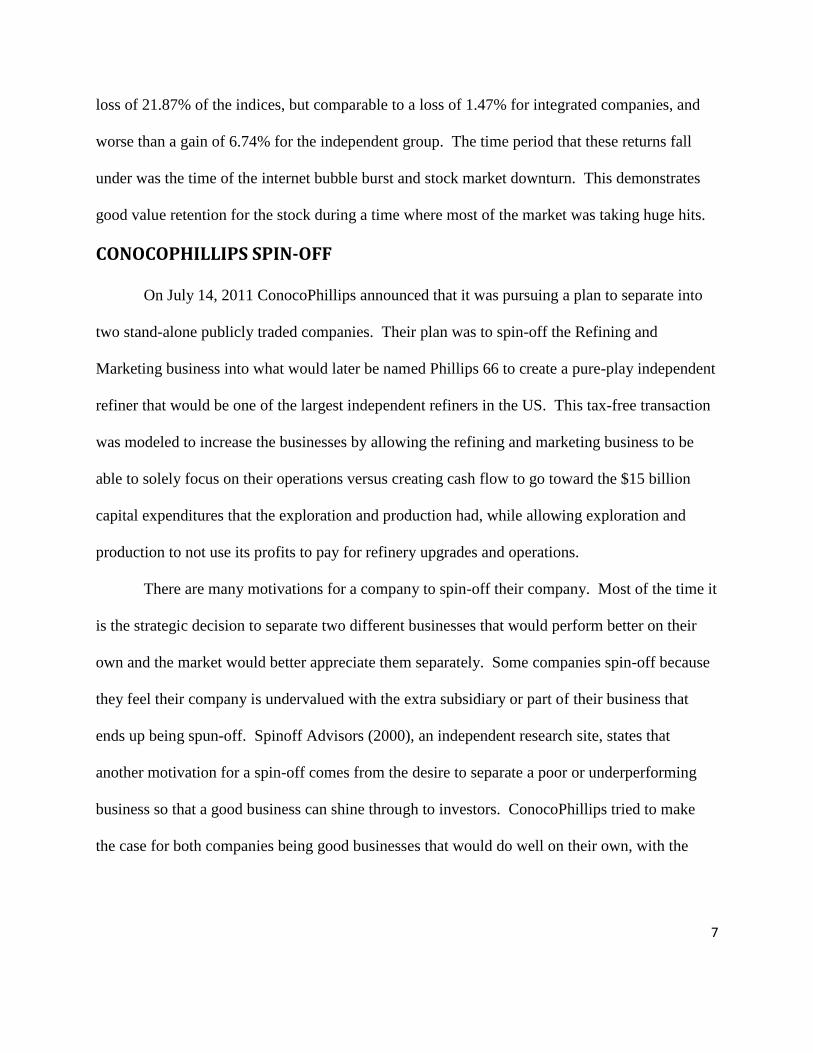
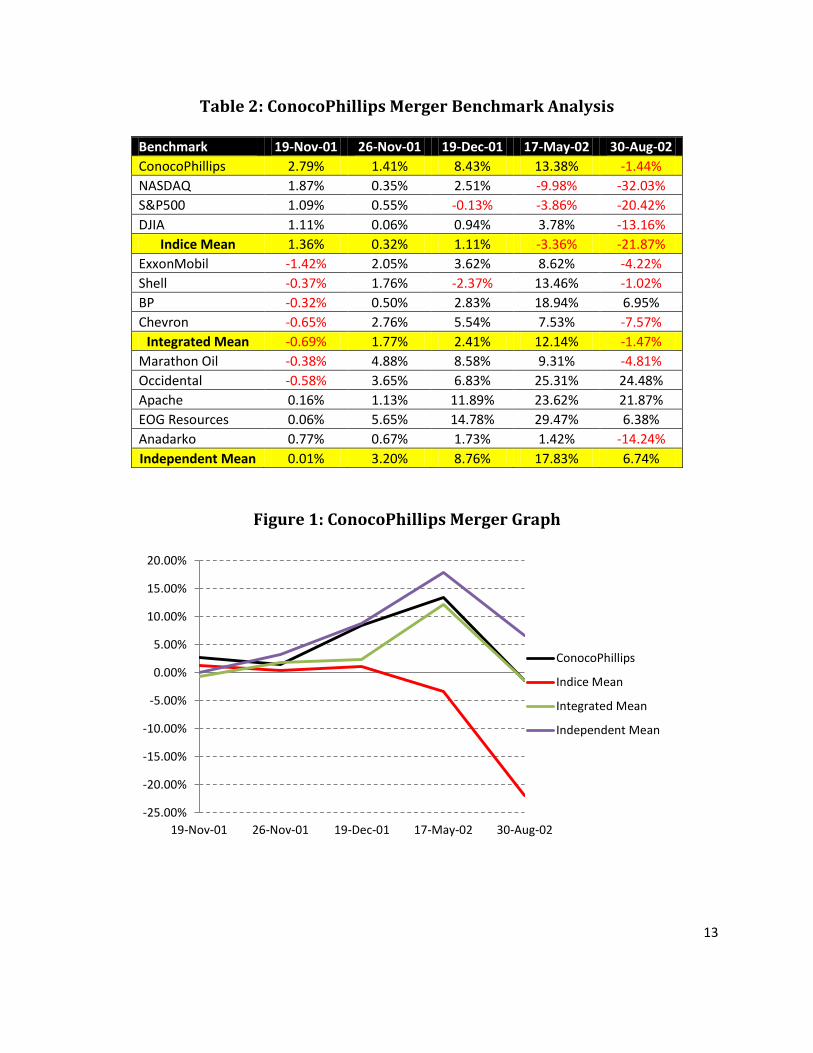
When ConocoPhillips, then Conoco, Inc. and Phillips Petroleum Company (two separate
companies) announced the merger, that day Phillips Petroleum Company (the larger firm) stock
rose 2.79% whereas the average gain for the three market indices was 1.36%, the integrated
companies dropped 0.69%, and the independent group rose 0.01%. The announcement of the
merger between these two companies was received well by the market and the increase in the
stock price for the day reflects that. However, a one day gain is not enough to suit an investor.
After one week (from November 19, 2001), Phillips shares rose 1.41%, whereas the benchmark
gains were 0.32%, 1.77%, and 3.20% for the index, integrated, and independent benchmark,
respectively. After one week, the return was not as good as other oil and gas companies, but still
beat the market indices. One month from the announcement date, the stock price rose 8.43%,
which is much better than before. It also has a better comparison when compared with the
1.11% of the market indices, 2.41% of the integrated group, and 8.76% of the independent
group. And finally, after six months Phillips Petroleum Company’s stock closed 13.38% above
its price from a month before as compared to a loss of 3.36% for the index group, a 12.14% gain
for the integrated group, and a 17.83% gain for the independent group. A more detailed
breakdown can be found on Table 2: ConocoPhillips Merger Benchmark Analysis in the
Appendix.
The returns for shareholders showed that if an investor were to buy the stock on the day
of the announcement, the return after 6 months is 13.38% which is a great return for any
investor. If an investor were to hold onto the stock until the merger was completed on August
30, 2002, their stock value would have dropped 1.44%. This is minimal when compared to a
7
loss of 21.87% of the indices, but comparable to a loss of 1.47% for integrated companies, and
worse than a gain of 6.74% for the independent group. The time period that these returns fall
under was the time of the internet bubble burst and stock market downturn. This demonstrates
good value retention for the stock during a time where most of the market was taking huge hits.
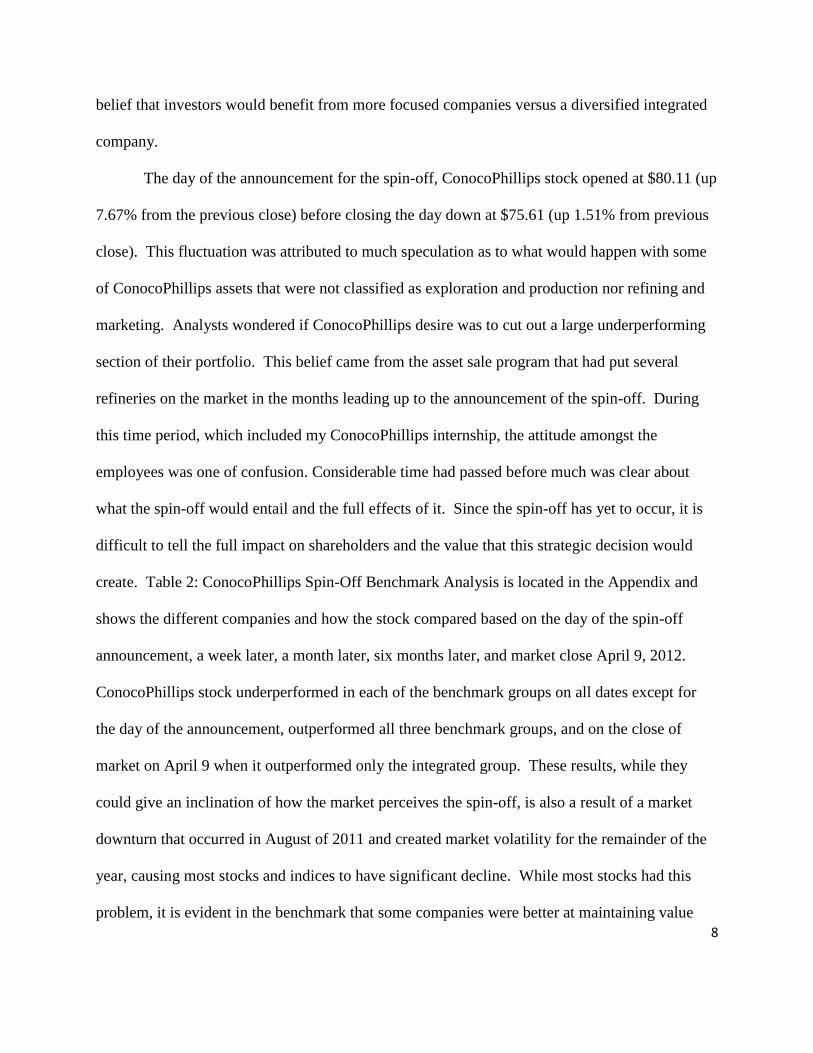
CONOCOPHILLIPS SPIN-OFF
On July 14, 2011 ConocoPhillips announced that it was pursuing a plan to separate into
two stand-alone publicly traded companies. Their plan was to spin-off the Refining and
Marketing business into what would later be named Phillips 66 to create a pure-play independent
refiner that would be one of the largest independent refiners in the US. This tax-free transaction
was modeled to increase the businesses by allowing the refining and marketing business to be
able to solely focus on their operations versus creating cash flow to go toward the $15 billion
capital expenditures that the exploration and production had, while allowing exploration and
production to not use its profits to pay for refinery upgrades and operations.
There are many motivations for a company to spin-off their company. Most of the time it
is the strategic decision to separate two different businesses that would perform better on their
own and the market would better appreciate them separately. Some companies spin-off because
they feel their company is undervalued with the extra subsidiary or part of their business that
ends up being spun-off. Spinoff Advisors (2000), an independent research site, states that
another motivation for a spin-off comes from the desire to separate a poor or underperforming
business so that a good business can shine through to investors. ConocoPhillips tried to make
the case for both companies being good businesses that would do well on their own, with the
8
belief that investors would benefit from more focused companies versus a diversified integrated
company.
The day of the announcement for the spin-off, ConocoPhillips stock opened at $80.11 (up
7.67% from the previous close) before closing the day down at $75.61 (up 1.51% from previous
close). This fluctuation was attributed to much speculation as to what would happen with some
of ConocoPhillips assets that were not classified as exploration and production nor refining and
marketing. Analysts wondered if ConocoPhillips desire was to cut out a large underperforming
section of their portfolio. This belief came from the asset sale program that had put several
refineries on the market in the months leading up to the announcement of the spin-off. During
this time period, which included my ConocoPhillips internship, the attitude amongst the
employees was one of confusion. Considerable time had passed before much was clear about
what the spin-off would entail and the full effects of it. Since the spin-off has yet to occur, it is
difficult to tell the full impact on shareholders and the value that this strategic decision would
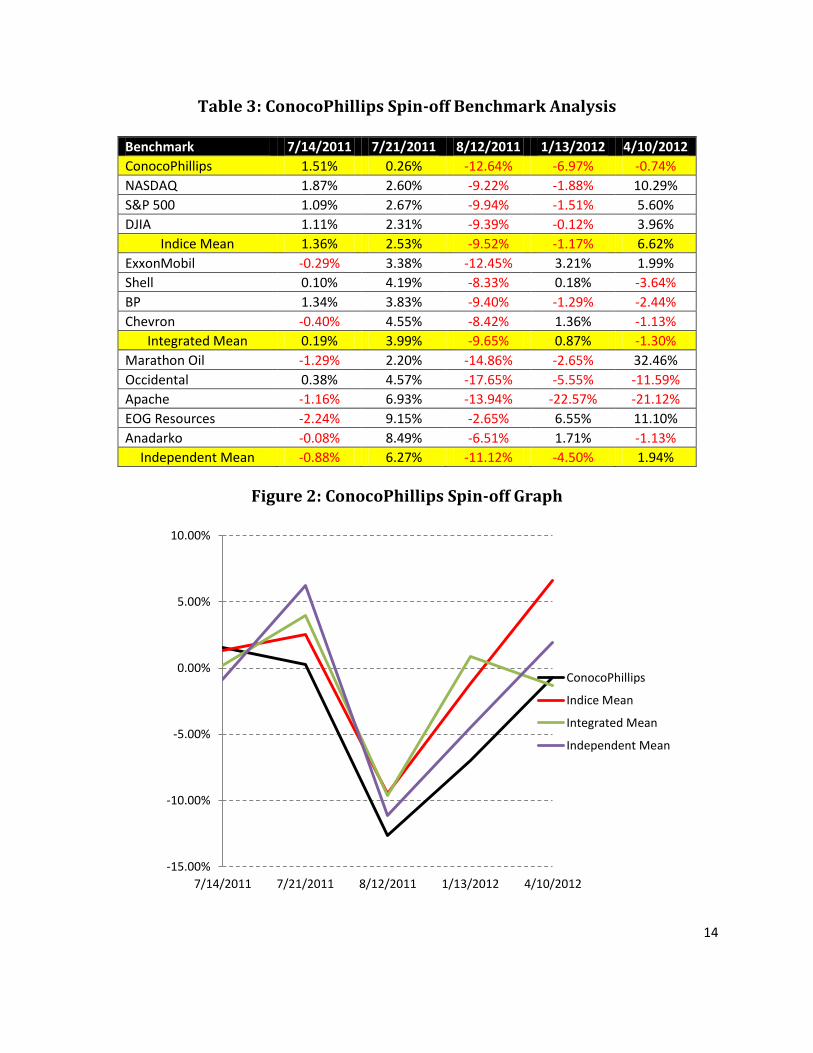
create. Table 2: ConocoPhillips Spin-Off Benchmark Analysis is located in the Appendix and
shows the different companies and how the stock compared based on the day of the spin-off
announcement, a week later, a month later, six months later, and market close April 9, 2012.
ConocoPhillips stock underperformed in each of the benchmark groups on all dates except for
the day of the announcement, outperformed all three benchmark groups, and on the close of
market on April 9 when it outperformed only the integrated group. These results, while they
could give an inclination of how the market perceives the spin-off, is also a result of a market
downturn that occurred in August of 2011 and created market volatility for the remainder of the
year, causing most stocks and indices to have significant decline. While most stocks had this
problem, it is evident in the benchmark that some companies were better at maintaining value
9
during that time than others such as EOG Resources, one of the mid-size integrated exploration
and production companies. EOG Resources experienced an 11.10% gain over the six month
period that ConocoPhillips lost 0.74% on their stock price.
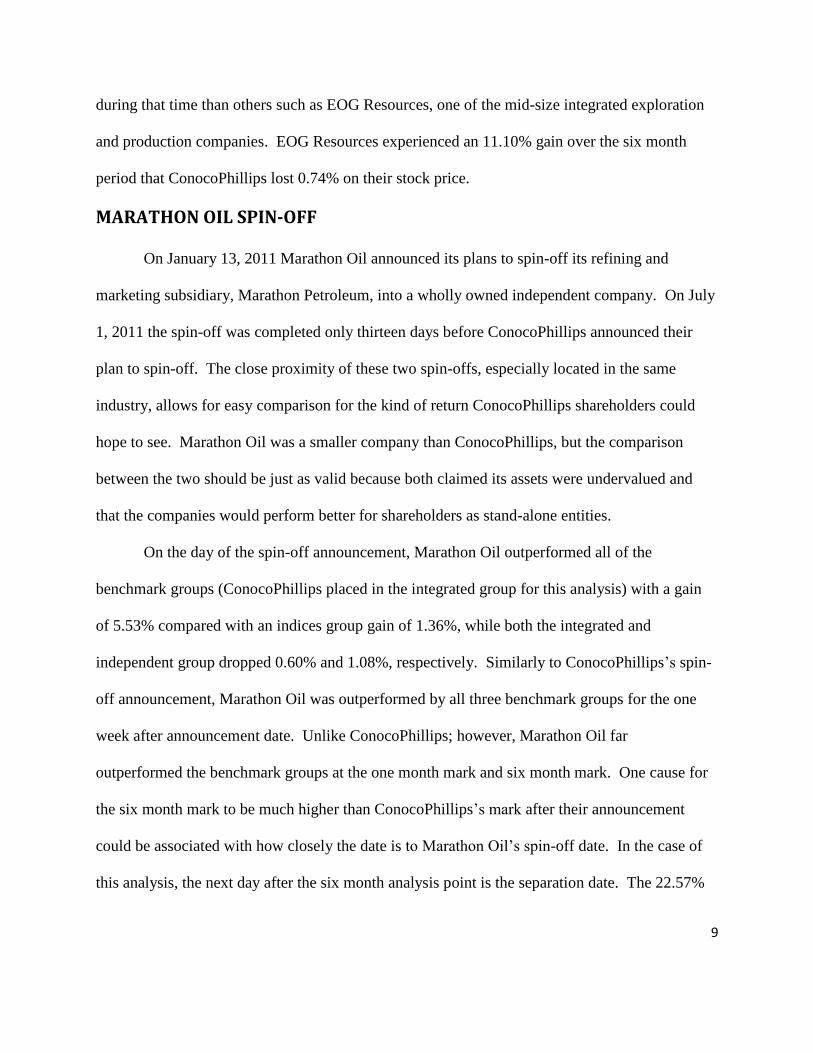
MARATHON OIL SPIN-OFF
On January 13, 2011 Marathon Oil announced its plans to spin-off its refining and
marketing subsidiary, Marathon Petroleum, into a wholly owned independent company. On July
1, 2011 the spin-off was completed only thirteen days before ConocoPhillips announced their
plan to spin-off. The close proximity of these two spin-offs, especially located in the same
industry, allows for easy comparison for the kind of return ConocoPhillips shareholders could
hope to see. Marathon Oil was a smaller company than ConocoPhillips, but the comparison
between the two should be just as valid because both claimed its assets were undervalued and
that the companies would perform better for shareholders as stand-alone entities.
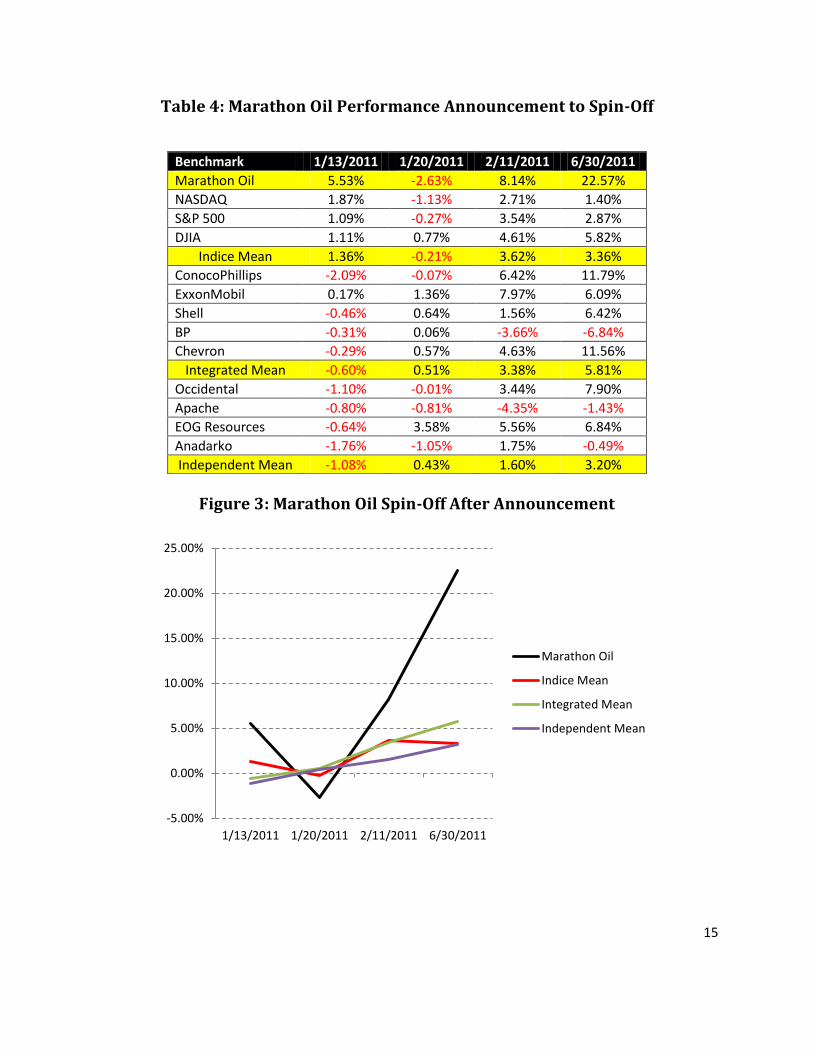
On the day of the spin-off announcement, Marathon Oil outperformed all of the
benchmark groups (ConocoPhillips placed in the integrated group for this analysis) with a gain
of 5.53% compared with an indices group gain of 1.36%, while both the integrated and
independent group dropped 0.60% and 1.08%, respectively. Similarly to ConocoPhillips’s spin-
off announcement, Marathon Oil was outperformed by all three benchmark groups for the one
week after announcement date. Unlike ConocoPhillips; however, Marathon Oil far
outperformed the benchmark groups at the one month mark and six month mark. One cause for
the six month mark to be much higher than ConocoPhillips’s mark after their announcement
could be associated with how closely the date is to Marathon Oil’s spin-off date. In the case of
this analysis, the next day after the six month analysis point is the separation date. The 22.57%
10
gain over the January 13, 2011 close price could be attributed to shareholders getting prepared
for the spin-off that occurs the next day of trading. More information on the benchmark analysis
is located in the appendix under Table 4: Marathon Oil Performance Announcement to Spin-Off.
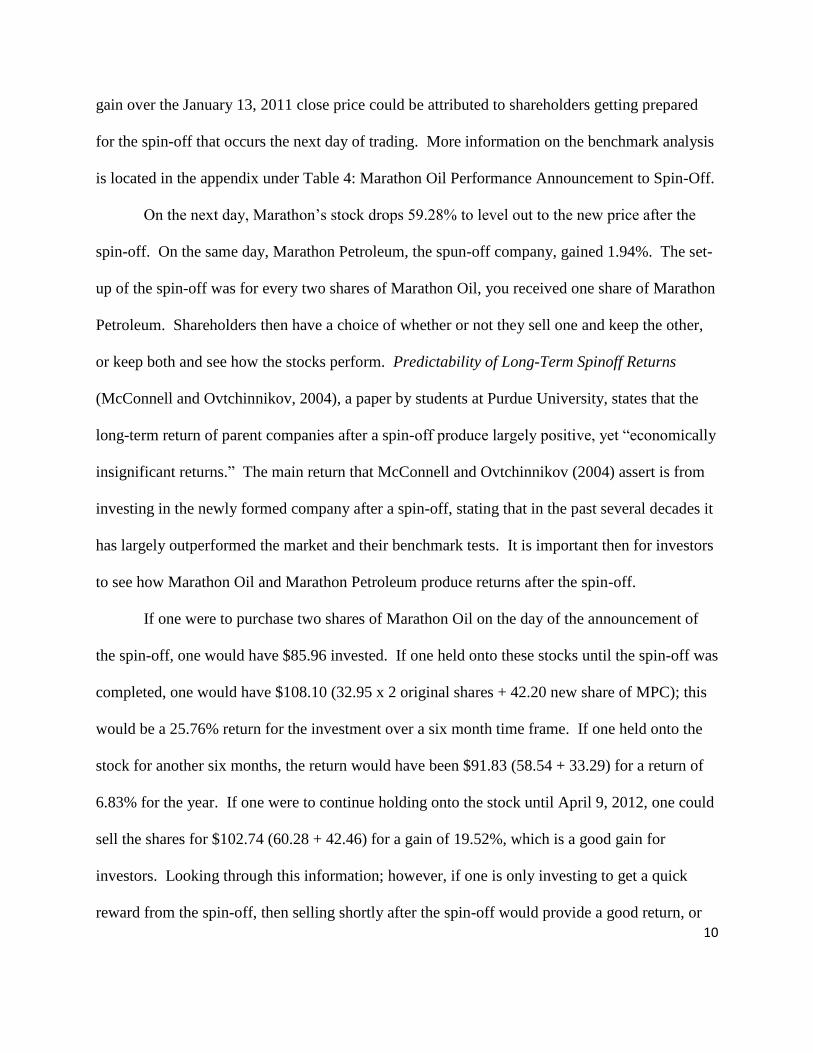
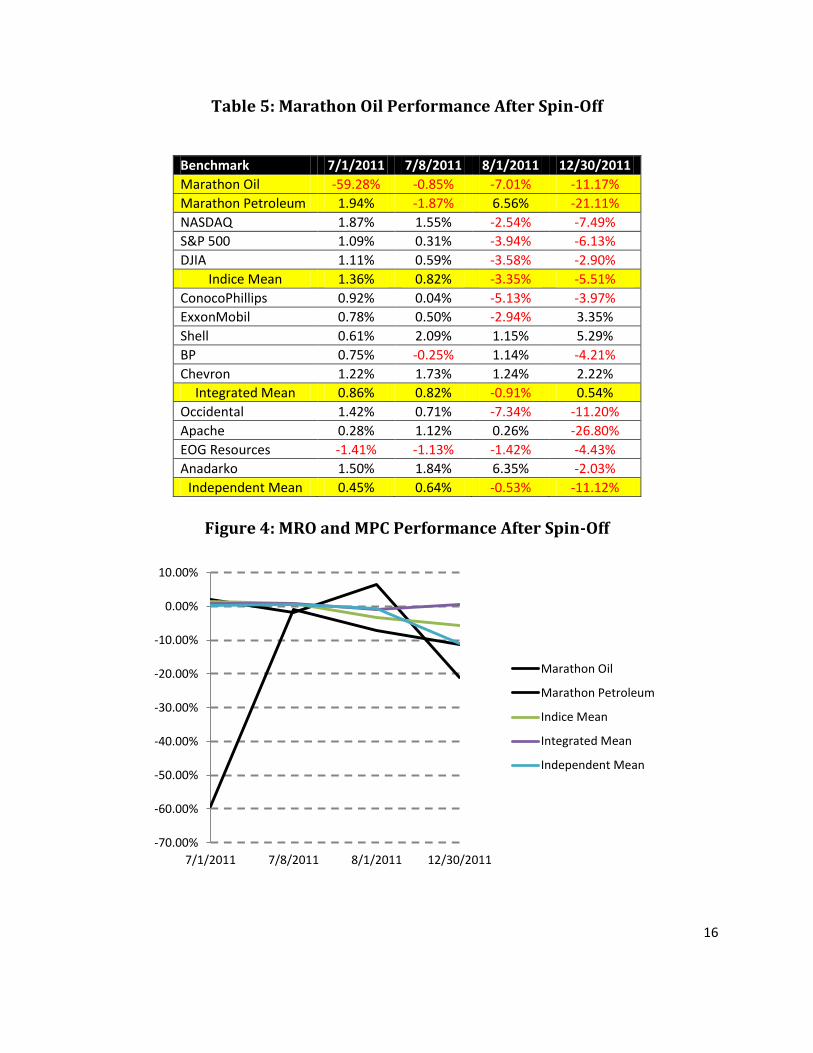
On the next day, Marathon’s stock drops 59.28% to level out to the new price after the
spin-off. On the same day, Marathon Petroleum, the spun-off company, gained 1.94%. The set-
up of the spin-off was for every two shares of Marathon Oil, you received one share of Marathon
Petroleum. Shareholders then have a choice of whether or not they sell one and keep the other,
or keep both and see how the stocks perform. Predictability of Long-Term Spinoff Returns
(McConnell and Ovtchinnikov, 2004), a paper by students at Purdue University, states that the
long-term return of parent companies after a spin-off produce largely positive, yet “economically
insignificant returns.” The main return that McConnell and Ovtchinnikov (2004) assert is from
investing in the newly formed company after a spin-off, stating that in the past several decades it
has largely outperformed the market and their benchmark tests. It is important then for investors
to see how Marathon Oil and Marathon Petroleum produce returns after the spin-off.
If one were to purchase two shares of Marathon Oil on the day of the announcement of
the spin-off, one would have $85.96 invested. If one held onto these stocks until the spin-off was
completed, one would have $108.10 (32.95 x 2 original shares + 42.20 new share of MPC); this
would be a 25.76% return for the investment over a six month time frame. If one held onto the
stock for another six months, the return would have been $91.83 (58.54 + 33.29) for a return of
6.83% for the year. If one were to continue holding onto the stock until April 9, 2012, one could
sell the shares for $102.74 (60.28 + 42.46) for a gain of 19.52%, which is a good gain for
investors. Looking through this information; however, if one is only investing to get a quick
reward from the spin-off, then selling shortly after the spin-off would provide a good return, or
11
holding onto the stocks for the long term and enjoying the returns over the course of several
years. The full results of how Marathon Oil and Marathon Petroleum performed against the
benchmark groups can be found in Table 5: Marathon Oil Performance After Spinoff in the
Appendix.
ConocoPhillips shareholders are hoping for a 20% return from their upcoming spin-off,
and if theirs is to perform anything near Marathon Oil’s spin-off, they are justly expecting such a
payoff. Marathon Oil started a trend among oil companies that allowed ConocoPhillips to follow
suit in their plans to create shareholder value and maintain their long-term strategic course.
Since ConocoPhillips’s spin-off announcement, BP discussed the possibility of spinning off, and
analysts enjoyed the opportunity to see how much value could be unlocked for BP through their
spin-off. If ConocoPhillips’s spin-off proves to be as successful as Marathon’s, then we could
see more large integrated companies choose this option as a way to unlock value for their
shareholders, and maximize the capabilities of their business through being more specialized.
CONCLUSION
ConocoPhillips’s strategic decisions continue to create value for shareholders, some of
their strategic decisions in the past few years include stock repurchase, acquisitions, asset
disposition, re-financing debt, and ultimately their spin-off into two leading energy companies.
ConocoPhillips dedication to creating value for their shareholders should pay off for those who
hold ConocoPhillips stock when the spin-off is expected to occur in the second quarter of 2012,
sometime around May 1. Until that time, investors can analyze the returns that Marathon Oil had
for their spin-off and hope that theirs will be able to compare when the spin-off occurs.
12
APPENDIX
Table 1: List of Benchmark Companies
*Based on close of market on April 9, 2012 from Yahoo! Finance
Company Stock Ticker Category Stock Price* Market Value*
ConocoPhillips COP Focus Company 75.05 96.04B
ExxonMobil XOM Integrated 83.88 395.34B
Royal Dutch
Shell RDS-B Integrated 69.28 215.46B
BP BP Integrated 43.26 136.83B
Chevron CVX Integrated 103.49 204.60B
Marathon Oil MRO Independent 30.14 21.22B
Marathon
Petroleum MPC
Independent
Refining
Company
42.46 14.76B
Occidental
Petroleum OXY Independent 91.38 74.11B
Apache APA Independent 94.58 36.35B
EOG Resources EOG Independent 107.44 28.91B
Anadarko
Petroleum APC Independent 75.83 37.80B
13
Table 2: ConocoPhillips Merger Benchmark Analysis
Benchmark 19-Nov-01 26-Nov-01 19-Dec-01 17-May-02 30-Aug-02
ConocoPhillips 2.79% 1.41% 8.43% 13.38% -1.44%
NASDAQ 1.87% 0.35% 2.51% -9.98% -32.03%
S&P500 1.09% 0.55% -0.13% -3.86% -20.42%
DJIA 1.11% 0.06% 0.94% 3.78% -13.16%
Indice Mean 1.36% 0.32% 1.11% -3.36% -21.87%
ExxonMobil -1.42% 2.05% 3.62% 8.62% -4.22%
Shell -0.37% 1.76% -2.37% 13.46% -1.02%
BP -0.32% 0.50% 2.83% 18.94% 6.95%
Chevron -0.65% 2.76% 5.54% 7.53% -7.57%
Integrated Mean -0.69% 1.77% 2.41% 12.14% -1.47%
Marathon Oil -0.38% 4.88% 8.58% 9.31% -4.81%
Occidental -0.58% 3.65% 6.83% 25.31% 24.48%
Apache 0.16% 1.13% 11.89% 23.62% 21.87%
EOG Resources 0.06% 5.65% 14.78% 29.47% 6.38%
Anadarko 0.77% 0.67% 1.73% 1.42% -14.24%
Independent Mean 0.01% 3.20% 8.76% 17.83% 6.74%
Figure 1: ConocoPhillips Merger Graph
-25.00%
-20.00%
-15.00%
-10.00%
-5.00%
0.00%
5.00%
10.00%
15.00%
20.00%
19-Nov-01 26-Nov-01 19-Dec-01 17-May-02 30-Aug-02
ConocoPhillips
Indice Mean
Integrated Mean
Independent Mean
14
-15.00%
-10.00%
-5.00%
0.00%
5.00%
10.00%
7/14/2011 7/21/2011 8/12/2011 1/13/2012 4/10/2012
ConocoPhillips
Indice Mean
Integrated Mean
Independent Mean
Table 3: ConocoPhillips Spin-off Benchmark Analysis
Benchmark 7/14/2011 7/21/2011 8/12/2011 1/13/2012 4/10/2012
ConocoPhillips 1.51% 0.26% -12.64% -6.97% -0.74%
NASDAQ 1.87% 2.60% -9.22% -1.88% 10.29%
S&P 500 1.09% 2.67% -9.94% -1.51% 5.60%
DJIA 1.11% 2.31% -9.39% -0.12% 3.96%
Indice Mean 1.36% 2.53% -9.52% -1.17% 6.62%
ExxonMobil -0.29% 3.38% -12.45% 3.21% 1.99%
Shell 0.10% 4.19% -8.33% 0.18% -3.64%
BP 1.34% 3.83% -9.40% -1.29% -2.44%
Chevron -0.40% 4.55% -8.42% 1.36% -1.13%
Integrated Mean 0.19% 3.99% -9.65% 0.87% -1.30%
Marathon Oil -1.29% 2.20% -14.86% -2.65% 32.46%
Occidental 0.38% 4.57% -17.65% -5.55% -11.59%
Apache -1.16% 6.93% -13.94% -22.57% -21.12%
EOG Resources -2.24% 9.15% -2.65% 6.55% 11.10%
Anadarko -0.08% 8.49% -6.51% 1.71% -1.13%
Independent Mean -0.88% 6.27% -11.12% -4.50% 1.94%
Figure 2: ConocoPhillips Spin-off Graph
15
Table 4: Marathon Oil Performance Announcement to Spin-Off
Figure 3: Marathon Oil Spin-Off After Announcement
-5.00%
0.00%
5.00%
10.00%
15.00%
20.00%
25.00%
1/13/2011 1/20/2011 2/11/2011 6/30/2011
Marathon Oil
Indice Mean
Integrated Mean
Independent Mean
Benchmark 1/13/2011 1/20/2011 2/11/2011 6/30/2011
Marathon Oil 5.53% -2.63% 8.14% 22.57%
NASDAQ 1.87% -1.13% 2.71% 1.40%
S&P 500 1.09% -0.27% 3.54% 2.87%
DJIA 1.11% 0.77% 4.61% 5.82%
Indice Mean 1.36% -0.21% 3.62% 3.36%
ConocoPhillips -2.09% -0.07% 6.42% 11.79%
ExxonMobil 0.17% 1.36% 7.97% 6.09%
Shell -0.46% 0.64% 1.56% 6.42%
BP -0.31% 0.06% -3.66% -6.84%
Chevron -0.29% 0.57% 4.63% 11.56%
Integrated Mean -0.60% 0.51% 3.38% 5.81%
Occidental -1.10% -0.01% 3.44% 7.90%
Apache -0.80% -0.81% -4.35% -1.43%
EOG Resources -0.64% 3.58% 5.56% 6.84%
Anadarko -1.76% -1.05% 1.75% -0.49%
Independent Mean -1.08% 0.43% 1.60% 3.20%
16
Table 5: Marathon Oil Performance After Spin-Off
Figure 4: MRO and MPC Performance After Spin-Off
-70.00%
-60.00%
-50.00%
-40.00%
-30.00%
-20.00%
-10.00%
0.00%
10.00%
7/1/2011 7/8/2011 8/1/2011 12/30/2011
Marathon Oil
Marathon Petroleum
Indice Mean
Integrated Mean
Independent Mean
Benchmark 7/1/2011 7/8/2011 8/1/2011 12/30/2011
Marathon Oil -59.28% -0.85% -7.01% -11.17%
Marathon Petroleum 1.94% -1.87% 6.56% -21.11%
NASDAQ 1.87% 1.55% -2.54% -7.49%
S&P 500 1.09% 0.31% -3.94% -6.13%
DJIA 1.11% 0.59% -3.58% -2.90%
Indice Mean 1.36% 0.82% -3.35% -5.51%
ConocoPhillips 0.92% 0.04% -5.13% -3.97%
ExxonMobil 0.78% 0.50% -2.94% 3.35%
Shell 0.61% 2.09% 1.15% 5.29%
BP 0.75% -0.25% 1.14% -4.21%
Chevron 1.22% 1.73% 1.24% 2.22%
Integrated Mean 0.86% 0.82% -0.91% 0.54%
Occidental 1.42% 0.71% -7.34% -11.20%
Apache 0.28% 1.12% 0.26% -26.80%
EOG Resources -1.41% -1.13% -1.42% -4.43%
Anadarko 1.50% 1.84% 6.35% -2.03%
Independent Mean 0.45% 0.64% -0.53% -11.12%
17
REFERENCES
^DJI: Historical Prices. (n.d.). Retrieved April 9, 2012, from
http://finance.yahoo.com/q/hp?s=%5EDJI+Historical+Prices
^GSPC: Historical Prices. (n.d.). Retrieved April 9, 2012, from
http://finance.yahoo.com/q?s=%5EGSPC&ql=0
^IXIC: Historical Prices. (n.d.). Retrieved April 9, 2012, from
http://finance.yahoo.com/q/hp?s=%5EIXIC+Historical+Prices
APA: Historical Prices. (n.d.). Retrieved April 9, 2012, from
http://finance.yahoo.com/q/hp?s=APA+Historical+Prices
APC: Historical Prices. (n.d.). Retrieved April 9, 2012, from
http://finance.yahoo.com/q/hp?s=APC+Historical+Prices
Balasubramaniam, K. (2008, January 02). How do I calculate the adjusted closing price for a
stock?. Retrieved from
http://www.investopedia.com/ask/answers/06/adjustedclsoingprice.asp#axzz1qWNpiKaP
BP: Historical Prices. (n.d.). Retrieved April 9, 2012, from
http://finance.yahoo.com/q/hp?s=BP+Historical+Prices
COP: Historical Prices. (n.d.). Retrieved April 9, 2012, from
http://finance.yahoo.com/q/hp?s=COP+Historical+Prices
Cusatis, P. J., Miles, J. A., & Woolridge, J. R. (1993). Restructuring through spinoffs: The stock
market evidence. Journal of Financial Economics, 33(3), 293-311. Elsevier. Retrieved
from http://www.sciencedirect.com/science/article/B6VBX-458X2FS-
1D/2/639111a626ee78084ca9efe63085091f
18
CVX: Historical Prices. (n.d.). Retrieved April 9, 2012, from
http://finance.yahoo.com/q/hp?s=CVX+Historical+Prices
Davis, M. and Antosh, N. (2001, November 19). Merger news boosts Conoco, Phillips stock.
Houston Chronicle. Retrieved from http://www.chron.com/business/article/Merger-news-
boosts-Conoco-Phillips-stock-2062120.php
EOG: Historical Prices. (n.d.). Retrieved April 9, 2012, from
http://finance.yahoo.com/q/hp?s=EOG+Historical+Prices
Marchini, D. (2001, November 19). Phillips, Conoco set merger. CNN Money. Retrieved from
http://money.cnn.com/2001/11/19/deals/phillips_conoco/index.htm
McConnell, J. J. and Ovtchinnikov, A. V. (2004). Predictability of long-term spinnoff returns.
Retrieved from
http://www2.owen.vanderbilt.edu/alexeiovtchinnikov/Predictability%20of%20long-
term%20spinoff%20returns.pdf
MPC: Historical Prices. (n.d.). Retrieved April 9, 2012, from
http://finance.yahoo.com/q/hp?s=MPC+Historical+Prices
MRO: Historical Prices. (n.d.). Retrieved April 9, 2012, from
http://finance.yahoo.com/q/hp?s=MRO+Historical+Prices
OXY: Historical Prices. (n.d.). Retrieved April 9, 2012, from
http://finance.yahoo.com/q/hp?s=OXY+Historical+Prices
Pautler, P. A. (2001). Evidence on mergers and acquisitions. Retrieved from
http://www.ftc.gov/be/workpapers/wp243.pdf
RDS-B: Historical Prices. (n.d.). Retrieved April 9, 2012, from
http://finance.yahoo.com/q/hp?s=RDS-B+Historical+Prices
19
Spin-Off’s 101. Spin-Off Advisors. Retrieved from
http://www.spinoffadvisors.com/articles/spinoffs101.htm
Staff. (2002, March 12). ConocoPhillips tie OK’d. CNN Money. Retrieved from
http://money.cnn.com/2002/03/12/news/deals/phillips/index.htm
XOM: Historical Prices. (n.d.). Retrieved April 9, 2012, from
http://finance.yahoo.com/q/hp?s=XOM+Historical+Prices