STRATEGIC & BUSINESS PLAN - laohamutuk.org · As the national oil company of Timor-Leste, TIMOR GAP...
96
STRATEGIC & BUSINESS PLAN 2016-2035
Transcript of STRATEGIC & BUSINESS PLAN - laohamutuk.org · As the national oil company of Timor-Leste, TIMOR GAP...
STRATEGIC& BUSINESSPLAN 2 0 1 6 - 2 0 3 5

TIMOR GAP Strategic & Business Plan 2016-2035 | 2
TIMOR GAP Strategic & Business Plan 2016-2035 | 2

TIMOR GAP Strategic & Business Plan 2016-2035 | 3
TIMOR GAP Strategic & Business Plan 2016-2035 | 3
MESSAGE FROM THE PRESIDENT & CEO
EXECUTIVE SUMMARY
WHERE WE ARE
WHERE WE WANT TO BE
VISION, MISSION & VALUES
OUR CORE BUSINESS
STRATEGIC GOALS
HOW TO GET THERE
UPSTREAM STRATEGY & BUSINESS PLAN
DOWNSTREAM STRATEGY & BUSINESS PLAN
LNG PLANT
REFINERY & PETROCHEMICAL
SERVICES STRATEGY & BUSINESS PLAN
NATIONAL DEVELOPMENT
FINANCIAL PLAN
OTHER REQUIREMENTS
03.
04.
07.
15.
17.
18.
20.
21.
23.
34.
35.
43.
51.
54.
81.
89.
CONTENTS

TIMOR GAP Strategic & Business Plan 2016-2035 | 4
TIMOR GAP Strategic & Business Plan 2016-2035 | 4

TIMOR GAP Strategic & Business Plan 2016-2035 | 5
TIMOR GAP Strategic & Business Plan 2016-2035 | 5
MESSAGE FROM THE PRESIDENT & CEO
After months of reflections, discussions and planning, we are excited to present TIMOR
GAP’s Strategic & Business Plan. This is the product of hard work following an inclusive
process where all TIMOR GAP staff had the opportunity to contribute and influence the
direction for our company, through surveys, workshops and consultations.
We reflected on three key questions that guided our plan to effectively fulfill our mandate to
contribute to Timor-Leste’s social and economic development:
• Where we are: what is our current situation and the context in which we operate
• Where we want to be: what’s our vision for the future
• How to get there: what will we do to make our vision a reality in the next 5, 10, 20 years
This Strategic & Business Plan is a live document: it will be updated as appropriate as we
move forward and, most importantly, will be translated into concrete day to day actions, for
each unit, team and individual to implement our strategy and fulfill our mission.
As a committed team, TIMOR GAP, together with our partners and other stakeholders,
including the Timor-Leste Government and National Parliament, will drive petroleum sector
industrialization in Timor-Leste and contribute to strong national development.
Francisco Monteiro
President & CEO

TIMOR GAP Strategic & Business Plan 2016-2035 | 6
TIMOR GAP Strategic & Business Plan 2016-2035 | 6
EXECUTIVE SUMMARY
As the national oil company of Timor-Leste, TIMOR GAP received the mandate to optimize
the country’s economic benefits from petroleum resources and associated activities.
Our vision is to be a regional leader in oil & gas for sustainable national development. Our
mission is to contribute to national development (social and economic), creating business
opportunities and jobs, respecting quality, health, safety and environmental standards,
guaranteeing partners’ satisfaction, and promoting innovation and creativity. Our work is
founded on key values of integrity, competence, business focus, safety and teamwork.
Our core business, where we believe the best opportunities match our best capabilities, is
Exploration & Production. And we envision that pursuing our mission will involve engaging
directly in downstream activities and other services over time.
We’ve defined key strategic goals and ambitions for the next 5, 10 and 20 years:
• Short term (2-5 years): build our exploration portfolio and start operating a refinery
• Medium term (5-10 years): become a producing operator and start operating an LNG*
plant
• Long term (10+ years): grow into upstream abroad, and expand the LNG plant and the
refinery
Delivering our plan contributes to Timor-Leste development in several ways: promoting
good governance in the sector, ensuring national energy security, developing human capital
and local capabilities in petroleum, and building the sector and infrastructure for sound
economic growth.
Making all this a reality entails meeting challenging requirements, particularly in terms of
financing (USD 8.3 billion by 2024) and human resources (700 new staff by 2020) for the
company to accumulate USD 23 billion of positive cash flows by 2035, and USD 60 billion
by 2050.
*LNG = Liquified Natural Gas
TIMOR GAP Strategic & Business Plan 2016-2035 | 7
TIMOR GAP Strategic & Business Plan 2016-2035 | 7
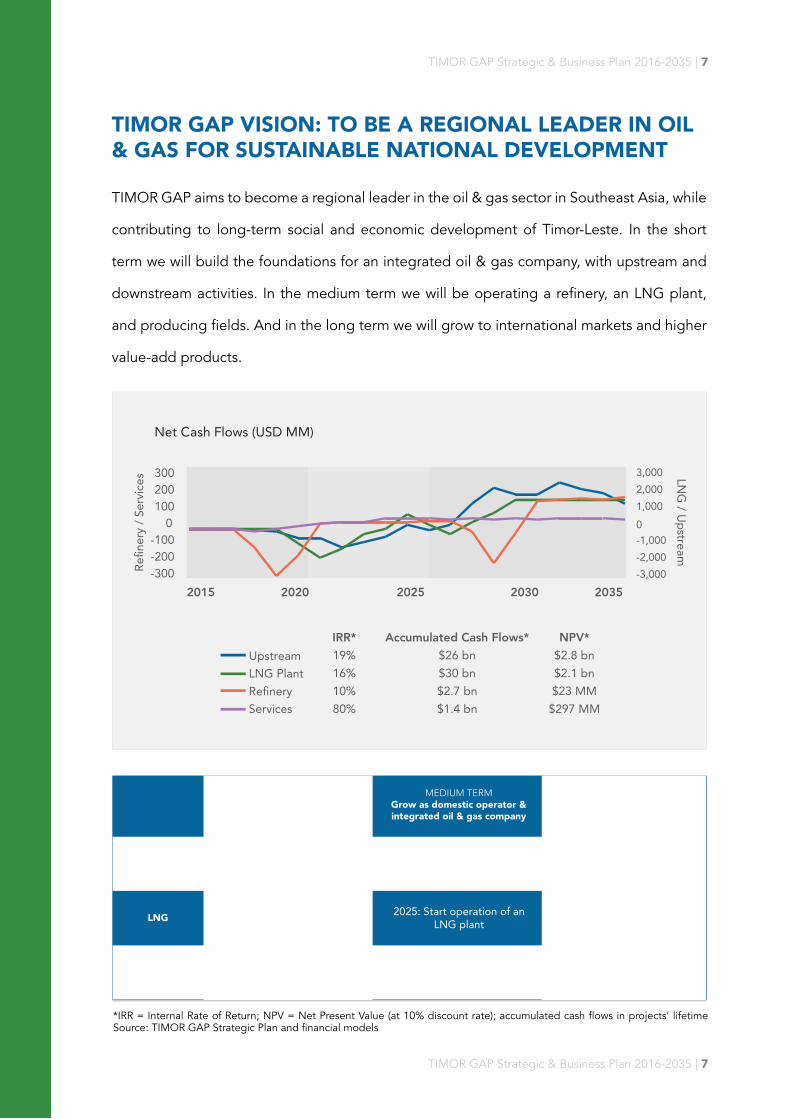
TIMOR GAP VISION: TO BE A REGIONAL LEADER IN OIL & GAS FOR SUSTAINABLE NATIONAL DEVELOPMENT
TIMOR GAP aims to become a regional leader in the oil & gas sector in Southeast Asia, while
contributing to long-term social and economic development of Timor-Leste. In the short
term we will build the foundations for an integrated oil & gas company, with upstream and
downstream activities. In the medium term we will be operating a refinery, an LNG plant,
and producing fields. And in the long term we will grow to international markets and higher
value-add products.
UPSTREAM
SHORT TERMFoundations: Build
the institution & the team
MEDIUM TERMGrow as domestic operator &integrated oil & gas company
LONG TERMExpand internationally
with successful businesses
Build the exploration portfolio
2023: Become an operator with production
Venture to international upstream opportunities
LNGStudy, negotiate and form partnerships for LNG plant
2025: Start operation of an LNG plant
Explore adding anotherLNG train
REFINERY2020: Start operation of
a re�neryExpand the re�nery Expand into complex
petrochemicals
*IRR = Internal Rate of Return; NPV = Net Present Value (at 10% discount rate); accumulated cash flows in projects’ lifetime Source: TIMOR GAP Strategic Plan and financial models


WHERE WE AREContext
SWOT Analysis

TIMOR GAP Strategic & Business Plan 2016-2035 | 10
TIMOR GAP Strategic & Business Plan 2016-2035 | 10

TIMOR GAP Strategic & Business Plan 2016-2035 | 11
TIMOR GAP Strategic & Business Plan 2016-2035 | 11
at enviable 10% annually, non-renewable
petroleum resources have contributed the
most (80% of GDP on average since 2006).
country’s petroleum resources and activities
for the best economic benefits, according
to Decree Law no. 31/2011.
Timor-Leste’s economy has been growing
fast, from a very low GDP per capita of
$500 in 2000. While non-oil GDP has grown
Petroleum is a key sector for Timor-Leste
development, according to the Strategic
Development Plan 2011-2030, and TIMOR
GAP has a clear mandate to manage the
TIMOR-LESTE’S GROWTH DRIVEN BY OIL & GAS
TIMOR-LESTE STRATEGIC DEVELOPMENT PLAN & TIMOR GAP’S MANDATE
0
1000
2000
3000
4000
5000
6000
2000 2001 2002 2003 2004 2005 2006 2007 2008 2009 2010 2011 2012 2013
Non-oil
Oil
36.2%
10.3%
Oil GDP2000-2013
Non-oil GDP2000-2013
GDP (USD million) and GDP per capita (USD), nominal* GDP per capita
*GDP = Gross Domestic Product; nominal = not adjusted for inflation || Source: Ministry of Finance of Timor-Leste, Timor-Leste National Accounts 2000-2013

TIMOR GAP Strategic & Business Plan 2016-2035 | 12
TIMOR GAP Strategic & Business Plan 2016-2035 | 12
“The petroleum sector in Timor-Leste is designated by the Strategic Development Plan as a
key pillar of our future development. (…) While developing the sector, we must ensure that
Timor-Leste’s natural resource wealth is used to build our nation and support our people. ”
Strategic Development Plan 2011-2030
“It is envisaged that TIMOR GAP, EP may, when fully operational, optimize the economic
benefits derived from the petroleum resources and from the associated activities available
to Timor-Leste, attracting technologies, developing qualified human resources and also
ensuring the country’s energy security, taking on the role of one of the main drivers of
economic and social development. ”
Government Decree Law no. 31/2011 on 27 July 2011

TIMOR GAP Strategic & Business Plan 2016-2035 | 13
TIMOR GAP Strategic & Business Plan 2016-2035 | 13
TASI MANE – SOUTH COAST PROJECTS
TIMOR GAP has been mandated to, on behalf of the Timor-Leste Government, implement
the “Tasi Mane” projects – three clusters of development along Timor-Leste’s southern coast:
the Suai Supply Base, the Betano Refinery and Petrochemical complex and the Beaço LNG
Plant and Marine Facilities.
Timor-Leste is a small country surrounded by bigger nations like Indonesia and Australia,
which have much more developed petroleum sectors. Logistical distances to potential
suppliers and customers need to be taken into account for planning in each area of business.
REGIONAL SETTING: ASIA PACIFIC
1000 km
2000 km
3000 km
4000 km

TIMOR GAP Strategic & Business Plan 2016-2035 | 14
TIMOR GAP Strategic & Business Plan 2016-2035 | 14
gas prices can make some projects
uneconomic, especially when they require
significant investments with some risk.
Oil and gas prices have been historically
high in the last five years. Even after the
fall since June 2014, prices are higher
than historical averages. Lower oil and
OIL & GAS PRICES
*Nominal prices (i.e., not adjusted for inflation); mmbtu = million British Thermal Units || Source: World Bank
Crude oil, Brent (USD/barrel)* LNG, Japan import price (USD/mmbtu)*
0
2
4
6
8
10
12
14
16
18
20
0
20
40
60
80
100
120
140
160
1979 1981 1983 1985 1987 1989 1991 1993 1995 1997 1999 2001 2003 2005 2007 2009 2011 2013 2015
$3.8 (Jan’86-Jan’04)
$19.8 (Jan’86-Jan’04)
$15.6 (Jan’11-May’15)
$110 (Jan’11-Sep’14)
Japan LNG import prices tend to trail
oil price by ~4 months

TIMOR GAP Strategic & Business Plan 2016-2035 | 15
TIMOR GAP Strategic & Business Plan 2016-2035 | 15
TIMOR GAP needs to take into account multiple stakeholders with diverse interests on
the company’s activities and impact, in the public and private sectors.
KEY STAKEHOLDERS
PUBLIC SECTOR PRIVATE SECTOR
GOVERNMENT
PM Of�ceMNE
MPRM
MFMJ/DNTP
MOP
INTERNATIONAL INSTITUTIONSWorld Bank
IFCIMFUN
ADB
EITICPLP
ASEANG7+
OPEC
PUBLIC INSTITUTIONS
ANPIPG
NPC...
NGOsLao Hamutuk Luta Hamutuk
THE PUBLICTimorese people
Tax payersAffected communities
PARLIAMENT
OTHER GOVERNMENTS
AustraliaCPLP
Indonesia...
INVESTORS
Oil CompaniesBanksECAs
CUSTOMERSDomestic
InternationalCrudeLNG
Re�ned ProductsServices
BUSINESS PARTNERS
National Oil Companies
International Oil Companies
WoodsideConocoPhillips
JV Partners
SUPPLIERSPetroleum Services
ConsultantsLawyers
Insurance Companies
COMPETITORSDomestic
International
FINANCIAL SERVICES
Banks
Board of DirectorsManagementSubsidiariesShareholdersEmployees
Source: TIMOR GAP Strategic Planning Workshop
TIMOR GAP Strategic & Business Plan 2016-2035 | 16
TIMOR GAP Strategic & Business Plan 2016-2035 | 16
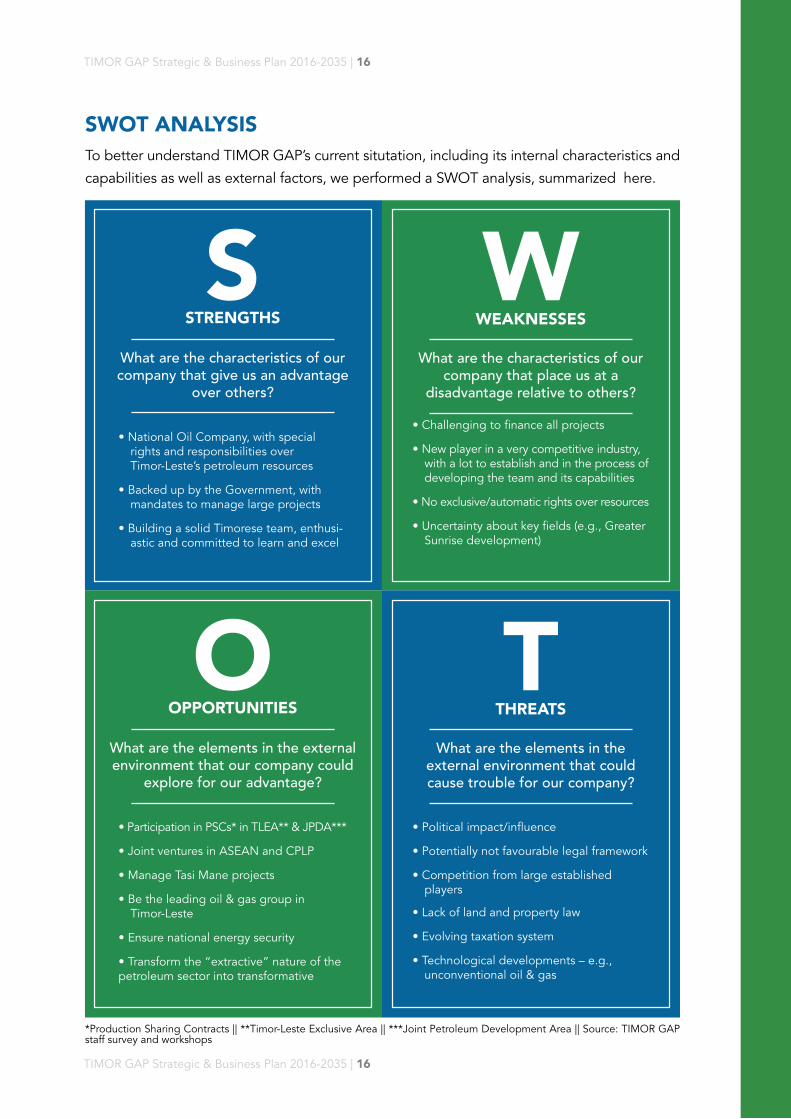
SWOT ANALYSIS
SSTRENGTHS
What are the characteristics of our company that give us an advantage
over others?
• National Oil Company, with special rights and responsibilities over Timor-Leste’s petroleum resources
• Backed up by the Government, with mandates to manage large projects
• Building a solid Timorese team, enthusi-astic and committed to learn and excel
WWEAKNESSES
What are the characteristics of our company that place us at a
disadvantage relative to others?
• Challenging to finance all projects
• New player in a very competitive industry, with a lot to establish and in the process of developing the team and its capabilities
• No exclusive/automatic rights over resources
• Uncertainty about key fields (e.g., Greater Sunrise development)
OOPPORTUNITIES
What are the elements in the external environment that our company could
explore for our advantage?
• Participation in PSCs* in TLEA** & JPDA***
• Joint ventures in ASEAN and CPLP
• Manage Tasi Mane projects
• Be the leading oil & gas group in Timor-Leste
• Ensure national energy security
• Transform the “extractive” nature of thepetroleum sector into transformative
TTHREATS
What are the elements in the external environment that could cause trouble for our company?
• Political impact/influence
• Potentially not favourable legal framework
• Competition from large established players
• Lack of land and property law
• Evolving taxation system
• Technological developments – e.g., unconventional oil & gas
*Production Sharing Contracts || **Timor-Leste Exclusive Area || ***Joint Petroleum Development Area || Source: TIMOR GAP staff survey and workshops
To better understand TIMOR GAP’s current situtation, including its internal characteristics and
capabilities as well as external factors, we performed a SWOT analysis, summarized here.

WHERE WE WANT TO BEVision, Mission & Values
Our Core BusinessStrategic Goals

TIMOR GAP Strategic & Business Plan 2016-2035 | 18
TIMOR GAP Strategic & Business Plan 2016-2035 | 18

TIMOR GAP Strategic & Business Plan 2016-2035 | 19
TIMOR GAP Strategic & Business Plan 2016-2035 | 19
CORPORATE VALUES
INTEGRITY – We are committed to the
highest standards of integrity, behaving
ethically and professionally at all times
COMPETENCE – We are capable, confident
and committed, delivering high-quality,
accurate and innovative products and
services
BUSINESS FOCUS – We are business
oriented, always seeking new opportunities
and adding value to resources and
stakeholders
SAFETY – We care for the health and
safety of employees, communities and the
environment, aligned with international best
practices
TEAMWORK – We work together with an
open mind and respect for diversity, and
connected by a family spirit
VISION
To be a regional leader in oil & gas for
sustainable national development
MISSION
• To contribute to national development by
securing and adding value to energy resources
• To create business opportunities and jobs,
improving skills and technological transfer
• To support social and economic development
by maximizing local capacity and participation
• To operate according to quality, health,
safety and environmental best standards
• To guarantee customer and partner
satisfaction through our products, services
and projects
• To promote innovation and creativity
through research and development
TIMOR GAP’s strategic planning process created the opportunity to obtain alignment on what we
aim to be (vision), why we exist (mission) and how we work (values, summarized in our corporate
spirit: “CAN DO”).
VISION, MISSION & VALUES
TIMOR GAP Strategic & Business Plan 2016-2035 | 20
TIMOR GAP Strategic & Business Plan 2016-2035 | 20
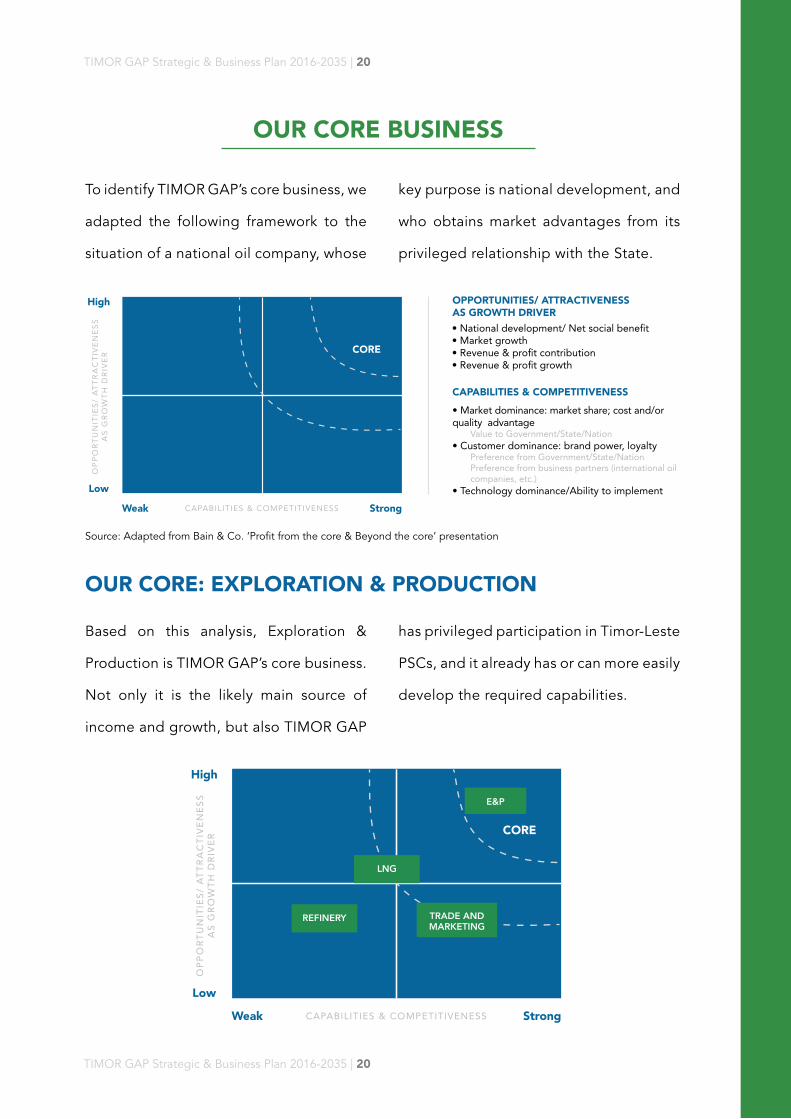
key purpose is national development, and
who obtains market advantages from its
privileged relationship with the State.
has privileged participation in Timor-Leste
PSCs, and it already has or can more easily
develop the required capabilities.
To identify TIMOR GAP’s core business, we
adapted the following framework to the
situation of a national oil company, whose
Based on this analysis, Exploration &
Production is TIMOR GAP’s core business.
Not only it is the likely main source of
income and growth, but also TIMOR GAP
OUR CORE: EXPLORATION & PRODUCTION
Source: Adapted from Bain & Co. ‘Profit from the core & Beyond the core’ presentation
OUR CORE BUSINESS
High OPPORTUNITIES/ ATTRACTIVENESSAS GROWTH DRIVER
Low
Weak Strong
CORE
• National development/ Net social benefit• Market growth• Revenue & profit contribution• Revenue & profit growth
CAPABILITIES & COMPETITIVENESS
• Market dominance: market share; cost and/or quality advantage
Value to Government/State/Nation• Customer dominance: brand power, loyalty
Preference from Government/State/NationPreference from business partners (international oil companies, etc.)
• Technology dominance/Ability to implement
OP
PO
RT
UN
ITIE
S/
AT
TR
AC
TIV
EN
ES
SA
S G
RO
WT
H D
RIV
ER
CAPABILITIES & COMPETITIVENESS
CORE
High
Low
Weak Strong
OP
PO
RT
UN
ITIE
S/
AT
TR
AC
TIV
EN
ES
SA
S G
RO
WT
H D
RIV
ER
CAPABILITIES & COMPETITIVENESS
REFINERY TRADE ANDMARKETING
LNG
E&P

TIMOR GAP Strategic & Business Plan 2016-2035 | 21
TIMOR GAP Strategic & Business Plan 2016-2035 | 21
Each of the key business areas was analyzed according to each axis, in order to assess
how “core” they are to TIMOR GAP’s business:
CORE BUSINESS IDENTIFICATION
E&P
Opportunities/ Attractivenessas growth driver
Capabilities &competitiveness
LNG
TRADE &MARKETING
REFINERY
HighExpected to be the key source of
pro�table income for the companyand for the State
StrongExisting capabilities or more
straightforward to build in-house
Competitive advantage since the national oil company has priority for
Timor-Leste PSC participation
MediumAttractive project economics, assuming
access to feedstock (from Greater Sunrise and/or other �elds)
MediumSome existing capabilities, complemented
by potential KOGAS partnership
Feedstock needs to be secured
Medium/LowThin margins (commodity trading)
Medium/StrongSome internal capabilities, which should
be straightforward to improve
Medium/LowLess attractive project economics, given
the small project scale at thisstage (microeconomics)
Medium/WeakUncertain access to required feedstock
at this stage
Limited internal capabilities
Source: TIMOR GAP analysis

TIMOR GAP Strategic & Business Plan 2016-2035 | 22
TIMOR GAP Strategic & Business Plan 2016-2035 | 22
TIMOR GAP 2035 STRATEGIC GOALS
LONG TERM( 1 0 + y e a r s )
Expansion
• Run successful operations in all steps of the value chain
• Venture to international upstream opportunities
• Add one LNG train
• Strengthen downstream sector into higher-value, complex petrochemicals
MEDIUM TERM( 5 - 1 0 y e a r s )
Timor-Leste Operator & Integrated Oil Company
• Become an upstream operator with production
• Continue E&P to build a solid portfolio of production fields
• Start operation of an LNG plant by 2025 (if so decided)
SHORT TERM( 2 - 5 y e a r s )
Foundations
• Build a solid team & institution
• Join upstream exploration & development
• Start operation of a refinery by 2020
• Start operation of Suai Supply Base by 2019
an integrated company, with upstream
operation and an LNG plant. In the long
term we will grow to international markets
and higher value-add products.
TIMOR GAP will build its foundations
in the short term: a solid organization,
participating in E&P, and starting to
operate a supply base and a refinery.
In the medium term we will become
STRATEGIC GOALS

HOW TO GET THEREUpstream Strategy & Business Plan
Downstream Strategy & Business PlanServices Strategy & Business Plan
Key Requirements

TIMOR GAP Strategic & Business Plan 2016-2035 | 24
TIMOR GAP Strategic & Business Plan 2016-2035 | 24

TIMOR GAP Strategic & Business Plan 2016-2035 | 25
TIMOR GAP Strategic & Business Plan 2016-2035 | 25
an operator in the medium term, and lay the
foundations to expand internationally in the
long term to grow reserves and revenues.
In the upstream, TIMOR GAP will focus on
building the capabilities and exploration
portfolio in the short term, in order to become
UPSTREAM STRATEGIC GOALS
LONG TERM( 1 0 + y e a r s )
International Operator & Partner of Choice-
INCREASE PRODUCTION OUTPUTS & EXPAND
• Expand globally
• Expand international portfolio
• Expand reserves, resources value and revenues
MEDIUM TERM( 5 - 1 0 y e a r s )
Onshore Operator & Partner of Choice-
PRODUCE & STRENGTHEN PORTFOLIOS
• Grow the business
• Grow as national operator
• Grow acreage, reserves and resource value
• Grow global aspirations
SHORT TERM( 2 - 5 y e a r s )
Partner of Choice-
PLAN & BUILD PORTFOLIOS
• Build the business
• Build technical competence
• Build exploration portfolio B U I L D
P E R F O R M
G R O W
E X PA N D
UPSTREAM STRATEGY & BUSINESS PLAN
TIMOR GAP Strategic & Business Plan 2016-2035 | 26
TIMOR GAP Strategic & Business Plan 2016-2035 | 26
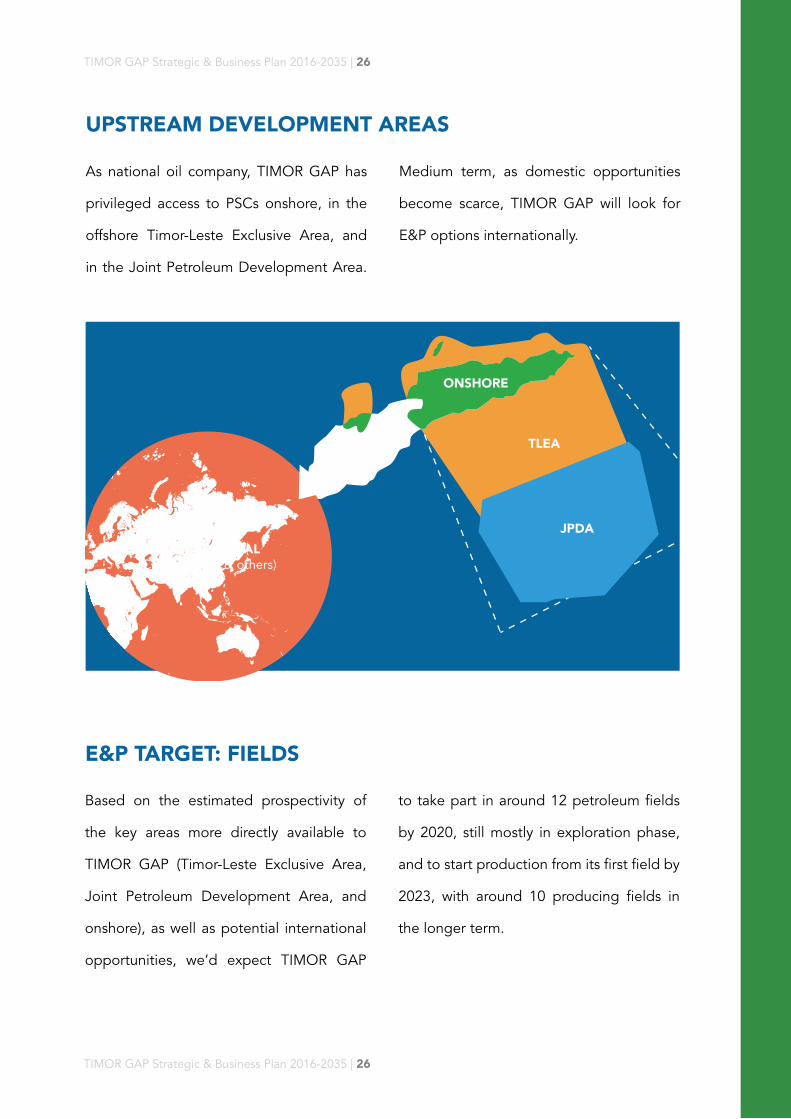
E&P TARGET: FIELDS
to take part in around 12 petroleum fields
by 2020, still mostly in exploration phase,
and to start production from its first field by
2023, with around 10 producing fields in
the longer term.
Based on the estimated prospectivity of
the key areas more directly available to
TIMOR GAP (Timor-Leste Exclusive Area,
Joint Petroleum Development Area, and
onshore), as well as potential international
opportunities, we’d expect TIMOR GAP
Medium term, as domestic opportunities
become scarce, TIMOR GAP will look for
E&P options internationally.
As national oil company, TIMOR GAP has
privileged access to PSCs onshore, in the
offshore Timor-Leste Exclusive Area, and
in the Joint Petroleum Development Area.
UPSTREAM DEVELOPMENT AREAS
TLEA
INTERNATIONAL(CPLP, ASEAN & others)
ONSHORE
JPDA

TIMOR GAP Strategic & Business Plan 2016-2035 | 27
TIMOR GAP Strategic & Business Plan 2016-2035 | 27
Number of petroleum �elds with TIMOR GAP participation New �elds per year+x
0
3
6
9
12
15
18
21
2015 2016 2017 2018 2019 2020 2021 2022 2023 2024 2025 2026 2027 2028 2029 2030 2031 2032 2033 2034 2035
JPDA TLEA Onshore International
Exploration Development Production
Start of Production
+2
+2
+1+1
+3
+1+3
Total reserves (BOE*, MM)
0
100
200
300
400
500
600
700
800
900
1000
2015 2016 2017 2018 2019 2020 2021 2022 2023 2024 2025 2026 2027 2028 2029 2030 2031 2032 2033 2034 2035
11-106 GS Other JPDA TLEA Onshore International
Source: TIMOR GAP analysis
Note: Total Recoverable Reserves (P2) associated with TIMOR GAP’s share of each field; Onshore reserves not visible due to the small relative size || *Barrels of Oil Equivalent (1 million cubic feet = 185.7 barrels of oil equivalent) || Source: TIMOR GAP analysis
E&P TARGET: RESERVESabout 500 million BOE by 2021 (mostly from
Greater Sunrise) and 1 billion BOE by 2025. In
a scenario delaying Greater Sunrise, reserves
would be reduced by 450 million BOE.
Based on assumed reserves in each kind of
field, the year of exploration conclusion, and
production rates, total TIMOR GAP reserves in
barrels of oil equivalent (BOE – i.e., including
both oil and gas together) could grow to

TIMOR GAP Strategic & Business Plan 2016-2035 | 28
TIMOR GAP Strategic & Business Plan 2016-2035 | 28
E&P TARGET: PRODUCTION
OIL & GAS PRICE FORECASTS
Note: Showing TIMOR GAP’s share of Production (based on its share of each field) || Source: TIMOR GAP analysis
reaching 26 million BOE by 2025, and 90
million BOE by 2030 (about 250 thousand
barrels per day).
Case, unless otherwise indicated.
Since petroleum prices tend to affect opex
and capex, in financial models we assume
that for each USD 20-per-barrel variation
in oil price costs move 15% in the same
direction.
Based on assumptions about development
time per type of field, TIMOR GAP’s share
of oil & gas production in fields where it
participates is projected to start in 2023,
Revenue and cash flow projections are
based on oil & gas price forecasts according
to the following Optimistic (high price),
Conservative (average price) and Worst
(low price) case scenarios. Calculations
in this document use the Conservative
Total reserves (BOE*, MM)
0
10
20
30
40
50
60
70
80
90
100
110
2015 2016 2017 2018 2019 2020 2021 2022 2023 2024 2025 2026 2027 2028 2029 2030 2031 2032 2033 2034 2035
Total production (BOE, MM)

TIMOR GAP Strategic & Business Plan 2016-2035 | 29
TIMOR GAP Strategic & Business Plan 2016-2035 | 29
Crude (USD/bbl)
Natural gas (USD/mmbtu)
LNG (USD/mmbtu)
0
50
100
150
Optimistic Conservative Worst case
0
5
10
2015
2016
2017
2018
2019
2020
2021
2022
2023
2024
2025
2026
2027
2028
2029
2030
2031
2032
2033
2034
2035
Optimistic Conservative Worst case
0
5
10
15
20
2015
2016
2017
2018
2019
2020
2021
2022
2023
2024
2025
2026
2027
2028
2029
2030
2031
2032
2033
2034
2035
Optimistic Conservative Worst case
Note: Conservative case is the expected case used in most projections in this Strategic Plan; it is the average of World Bank and RPS forecasts || Source: World Bank, RPS, TIMOR GAP analysis

TIMOR GAP Strategic & Business Plan 2016-2035 | 30
TIMOR GAP Strategic & Business Plan 2016-2035 | 30
E&P TARGET: REVENUE
2030. Accumulated revenues (i.e., adding
all years’ revenues) could reach USD 55
billion by 2035.
TIMOR GAP’s share of production at the
projected oil & gas prices could generate
petroleum revenue of almost USD 1.5
billion by 2025 and over USD 6 billion by
*For each year, the line represents the accumulated revenues until that year || Note: Showing TIMOR GAP’s share of Reve-nues = Production volume x Price x TIMOR GAP share || Source: TIMOR GAP analysis
Total revenues (USD MM)
0
10
20
30
40
50
60
0
1000
2000
3000
4000
5000
6000
7000
8000
2015 2016 2017 2018 2019 2020 2021 2022 2023 2024 2025 2026 2027 2028 2029 2030 2031 2032 2033 2034 2035
Accumulated* revenues (USD billiion)

TIMOR GAP Strategic & Business Plan 2016-2035 | 31
TIMOR GAP Strategic & Business Plan 2016-2035 | 31
E&P TARGET: INVESTMENTS
*Assumptions: TIMOR GAP invests according to its share; free carry in Greater Sunrise Expex || Source: TIMOR GAP analysis
over USD 6 billion by 2027. A large
share corresponds to Greater Sunrise’s
development expenditure of USD 2.5
billion in the period from 2020 to 2024.
TIMOR GAP will need to make significant
investments in the coming years in the
form of exploration and development
expenditure to take fields to production:
Investment requirements (USD MM)*
0
200
400
600
800
1000
1200
2015 2016 2017 2018 2019 2020 2021 2022 2023 2024 2025 2026 2027 2028 2029 2030 2031 2032 2033 2034 2035

TIMOR GAP Strategic & Business Plan 2016-2035 | 32
TIMOR GAP Strategic & Business Plan 2016-2035 | 32
*TIMOR GAP’s take is simplified as (Revenues – Opex) x 40%, except for GS (follows expected PSC rules) || **Over projects’ lifetime: NPV = Net Present Value (at 10% discount rate); IRR = Internal Rate of Return || Source: TIMOR GAP analysis
Net Cash Flows (USD MM)*
Accumulated** cash �ows (USD billiion)
-4
-2
0
2
4
6
8
10
12
14
-1500
-1000
-500
0
500
1000
1500
2000
2500
3000
2015 2016 2017 2018 2019 2020 2021 2022 2023 2024 2025 2026 2027 2028 2029 2030 2031 2032 2033 2034 2035
Capital requirements until 2024:USD 3.8 billion
IRR* = 19%NPV** = USD 2.8 billion
E&P TARGET: CASH FLOWS
in 2025 TIMOR GAP should be able to fund
its operations and new investments through
positive cash flows from producing fields,
estimated to be around USD 2 billion per
year from 2029 onwards.
We projected net cash flows by estimating
TIMOR GAP’s take for each field and
deducting the required investments. Until
2024, accumulated cash flows total minus
USD 3.8 billion, mostly due to Greater
Sunrise development expenditure. Starting
** =** =

TIMOR GAP Strategic & Business Plan 2016-2035 | 33
TIMOR GAP Strategic & Business Plan 2016-2035 | 33
SCENARIO ANALYSIS
Source: TIMOR GAP analysis
the Optimistic). Delaying Greater Sunrise
production to 2035 increases IRR due to its
larger size and lower IRR (15%) compared
to other projects (22% on average).
Price scenarios have a strong impact on
accumulated cash flows (from USD 16
billion in the Worst Case to USD 26 billion
in the Conservative and USD 37 billion in
0%
5%
10%
15%
20%
25%
Accumulated Cash Flows (USD billion)
Internal Rate of Return (%)
0
10
20
30
40
WORST CASE
$16 bn
$1.4 bn $2.8 bn $4.4 bn
$26 bn
16%18%
19%22%
25%
22%
$37 bn
CONSERVATIVE CASE OPTIMISTIC CASE
WORST CASE CONSERVATIVE CASE OPTIMISTIC CASE
NPV @ 10%(GS starting in 2025)
2025 2035 Greater Sunrise starts production in:
TIMOR GAP Strategic & Business Plan 2016-2035 | 34
TIMOR GAP Strategic & Business Plan 2016-2035 | 34
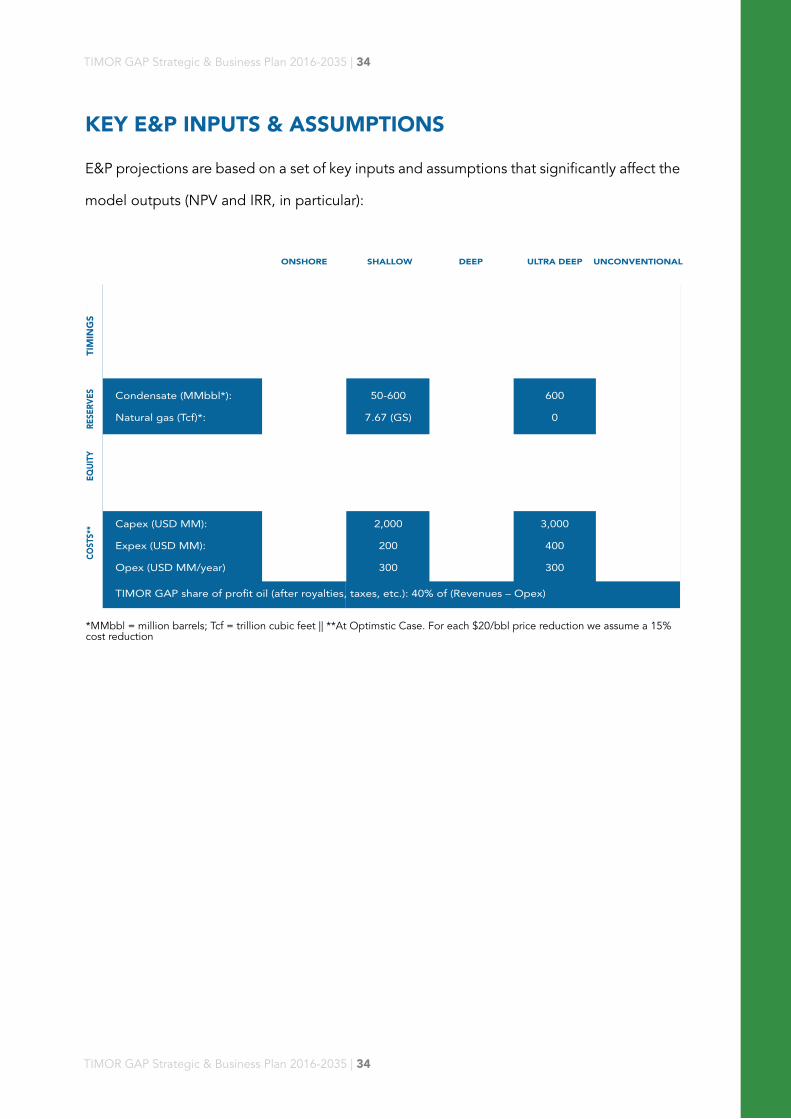
KEY E&P INPUTS & ASSUMPTIONS
*MMbbl = million barrels; Tcf = trillion cubic feet || **At Optimstic Case. For each $20/bbl price reduction we assume a 15% cost reduction
E&P projections are based on a set of key inputs and assumptions that significantly affect the
model outputs (NPV and IRR, in particular):
TIM
MIN
GS
RESE
RVES
EQU
ITY
COST
S**
ULTRA DEEP UNCONVENTIONALDEEPSHALLOWONSHORE
Exploration start year:
Exploration (years):
Development (years):
Production (years):
2017-32
2
1
6
4-20
0
50-600
7.67 (GS)
0
0
600
0
0
3
30-50%
10%
20-30%
(GS:30%)
20% 40% 30%
150
20
10
2,000
200
300
2,000
200
300
3,000
400
300
3,000
200
300
2016-34
3
4
10 (GS:25)
2021
4
6
20
2017-18
5
6
20
2032-35
3
3
10
Condensate (MMbbl*):
Natural gas (Tcf)*:
TIMOR GAP share of �eld:
Cost of capital:
Capex (USD MM):
Expex (USD MM):
Opex (USD MM/year)
TIMOR GAP share of pro�t oil (after royalties, taxes, etc.): 40% of (Revenues – Opex)
TIM
ING
S

TIMOR GAP Strategic & Business Plan 2016-2035 | 35
TIMOR GAP Strategic & Business Plan 2016-2035 | 35
• E&P team with appropriate skills and
knowledge, through on-the-job and formal
training, etc.
• New ventures team skilled at scouting
and negotiating new deals to feed
TIMOR GAP’s upstream portfolio
• Legal & commercial support to properly
address contractual and other issues
• International QHSE standards to
minimize risks
Turning the Upstream strategy and business plan into reality entails a series of requirements,
especially in terms of human resources and capabilities, as well as capital and key partnerships.
• Financing solutions for initial investments
before production: approx. USD 3.8
billion
• National regulations favoring TIMOR GAP
as joint venture partner in TLEA and JPDA
blocks
KEY UPSTREAM REQUIREMENTS
Human Resources
Capital & Partnerships

TIMOR GAP Strategic & Business Plan 2016-2035 | 36
TIMOR GAP Strategic & Business Plan 2016-2035 | 36
OVERALL DOWNSTREAM STRATEGIC GOALS
LONG TERM( 1 0 + y e a r s )
Expansion
• Expand one LNG train
• Study, build and commission a petrochemical plant
MEDIUM TERM( 5 - 1 0 y e a r s )
LNG Plant
• Start operation of one-train LNG plant by 2025
• Build a pipeline hub for smaller Timor Sea fields
• Expand the refinery
• Study petrochemical expansion
SHORT TERM( 2 - 5 y e a r s )
Startup & Re�nery
• Develop human resources
• Study, negotiate and form partnerships for LNG plant in Timor-Leste
• Build and start a refinery, producing naphtha, diesel, gasoline, LPG** by 2020
the refinery will expand to produce higher-
value products and the LNG plant will grow
with one additional train.
In the downstream, TIMOR GAP will focus
on building a 30,000-barrels-per-day
refinery in the short term, and a 5-mtpa*
LNG plant in the medium term. Over time,
*mtpa = million tonnes per annum || **LPG = Liquified Petroleum Gas
DOWNSTREAM STRATEGY & BUSINESS PLAN

TIMOR GAP Strategic & Business Plan 2016-2035 | 37
TIMOR GAP Strategic & Business Plan 2016-2035 | 37
term, together with one LNG tanker. Long
term, the business will grow with a new
5-mtpa train and international expansion.
The LNG team is focusing on completing
the necessary studies so that the LNG
plant, pipeline and marine facilities start
operation of a 5-mtpa train in the medium
LNG PLANT GOALS
LONG TERM( 1 0 + y e a r s )
Expansion
• 1 Train expansion in construction and operation
• Go regional and international (ASEAN & CPLP)
• Increase domestic gas consumption (commercial industries and residential)
MEDIUM TERM( 5 - 1 0 y e a r s )
Operation
• Commissioning, start-up and operation of First train (5 mtpa)
• One LNG tanker in operation
• Providing gas to local market (e.g., EDTL subject to demand)
• Train expansion studies (1 Train/5 mtpa)Pipeline hubSecuring feedstock from other upstream fields (Bayu Undan, others)
SHORT TERM( 2 - 5 y e a r s )
Studies & Construction
• Studies, negotiation and confirmation on development of one-train LNG sourcing from Greater Sunrise via pipeline
• EPCI* for First LNG train (5 mtpa**)
• Human resources development
• Studies and construction of LNG tanker (145,000 m3)
*EPCI = Engineering Procurement Construction Installation || **mtpa = million tonnes per annum
3

TIMOR GAP Strategic & Business Plan 2016-2035 | 38
TIMOR GAP Strategic & Business Plan 2016-2035 | 38
LNG CASH FLOWS
*NPV = Net Present Value (at 10% discount rate); IRR = Internal Rate of Return || Note: NPV and IRR calculated over the project’s lifetime; assumes 70% TIMOR GAP ownership || Source: TIMOR GAP analysis
starts operation, it should generate almost
USD 1 billion per year in positive net cash
flows, which would be sufficient to fund the
second train expansion.
Until 2024, the LNG project is expected
to produce negative cash flows due to the
significant investments (USD 4.2 billion)
required to build the plant, pipeline, marine
facilities and tanker. When the first train
Net cash �ows (USD MM) Accumulated cash �ows (USD MM)
-5,000
-2,500
0
2,500
5,000
7,500
10,000
-2,000
-1,500
-1,000
-500
0
500
1,000
1,500
2,000
2015 2016 2017 2018 2019 2020 2021 2022 2023 2024 2025 2026 2027 2028 2029 2030 2031 2032 2033 2034 2035
IRR* = 15.8%NPV* = USD 2.1 billion
Accum. cash �ow: USD 30 billion
Train 1
Train 2
Start Train 1 Production
Start Train 2 Production
Capital requirements unitl 2024:USD 4.2 billion

TIMOR GAP Strategic & Business Plan 2016-2035 | 39
TIMOR GAP Strategic & Business Plan 2016-2035 | 39
SCENARIO ANALYSIS
Source: TIMOR GAP analysis
in the Worst Case to USD 43 billion in the
Optimistic Case. IRR varies across scenarios
from 14.6% to 17.9%.
The year when Greater Sunrise starts
production has a strong impact on
accumulated cash flows: from USD 22 billion
Accumulated Cash Flows (USD billion)
Internal Rate of Return (%)
$22 bn
$1.4 bn $2.1 bn $3.6 bn
$30 bn
$43 bn
0
10
20
30
40
50
WORST CASE CONSERVATIVE CASE OPTIMISTIC CASE
Train 1 Train 2 LNG Tankers
12%
14%
16%
18%
WORST CASE CONSERVATIVE CASE OPTIMISTIC CASE
14.6% 14.7%
15.8% 15.9%
17.9% 17.9%
2025 2035 Greater Sunrise starts production in:
NPV @ 10%(GS starting in 2025)

TIMOR GAP Strategic & Business Plan 2016-2035 | 40
TIMOR GAP Strategic & Business Plan 2016-2035 | 40
KEY LNG PROJECT INPUTS & ASSUMPTIONS
FEEDSTOCK SOURCES IN THE TIMOR SEA
$702 MM
$1,053 MM
3% of capex
3% of capex
$ 3,706 MM
$ 2,675 MM
$25 MM/year
$15 MM/year
$1,201 MM
-
TIM
MIN
GS
VO
LUM
ESPR
ICES
COST
S**
(BA
SE C
ASE
)EQ
UIT
Y
TRAIN 2TRAIN 1
PIPELINE CAPEX PIPELINE OPEX PLANT CAPEX PLANT OPEX MARINE FACILITIES
Construction start year:
Production start year:
Production life (years):
Operating: 340 days
2020
2025
25
6.63 6.0
2026
2030
20
Reserves (Tcf):
Plant capacity (each train): 5 mtpa* of LNG; 0.665 mtpa of LPG
Feed gas �ow rate into plant: 900 MMscfd*; LNG plant output rate: 716.7 MMscfd*
According to TIMOR GAP price forecasts
Train 1:
Train 2:
Corporate Income Tax for Government of Timor-Leste: 10%
TIMOR GAP share of LNG business: 70% for both Trains
TIMOR GAP share of LNG tankers: 100%
Cost of capital: 10%
*mtpa = million tonnes per annum; MMscfd = million standard cubic feet per day || **At Conservative Case. For each $20/bbl price reduction we assume a 15% cost reduction
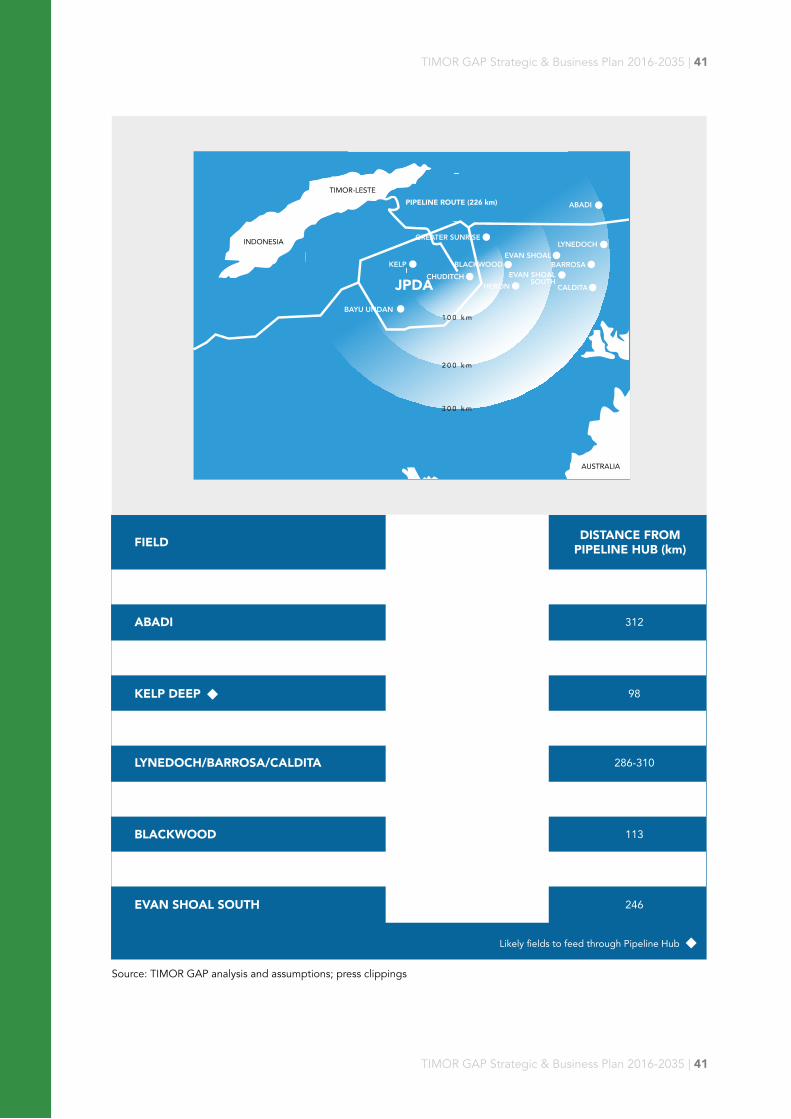
through a second pipeline coming from a
pipeline hub in JPDA, which by aggregating
feedstock from several fields would make
smaller fields commercially feasible.
The LNG plant economic model is based on a set of key inputs and assumptions that
significantly affect the model outputs (NPV and IRR, in particular):
Natural gas feedstock to the LNG plant
may come from several fields in the Timor
Sea. The first train is planned to source gas
from Greater Sunrise, through a dedicated
pipeline. The second train would be fed
TIM
ING
S
TIMOR GAP Strategic & Business Plan 2016-2035 | 41
TIMOR GAP Strategic & Business Plan 2016-2035 | 41
Source: TIMOR GAP analysis and assumptions; press clippings
GREATER SUNRISE 6.63
10
8
8
6.6
6.5
4.96
1.4
94 (231 GS-Beaço)
312
144
98
236
286-310
119
113
Likely �elds to feed through Pipeline Hub
ABADI
BAYU UNDAN
KELP DEEP
EVAN SHOAL
LYNEDOCH/BARROSA/CALDITA
HERON
BLACKWOOD
0.7 40CHUDITCH
N/A 246EVAN SHOAL SOUTH
FIELD RESERVES (Tcf) DISTANCE FROMPIPELINE HUB (km)
TIMOR-LESTE
AUSTRALIA
JPDA
PIPELINE ROUTE (226 km)
INDONESIA
KELP
BAYU UNDAN
CHUDITCH
GREATER SUNRISE
BLACKWOOD
HERON
EVAN SHOAL
ABADI
LYNEDOCH
BARROSA
CALDITA
EVAN SHOALSOUTH
1 0 0 k m
2 0 0 k m
3 0 0 k m

TIMOR GAP Strategic & Business Plan 2016-2035 | 42
TIMOR GAP Strategic & Business Plan 2016-2035 | 42
LNG DEMAND: IMPORTING COUNTRIES
GAP BETWEEN LNG SUPPLY & DEMAND
Source: Petroleum Economist
*mtpa = million tonnes per annum || Source: Santos – 2014 Investor Seminar (from Wood Mackenzie LNG Tool 2014 Q3 data)
tankers. TIMOR GAP is likely to focus on
customers in Asian countries like Japan and
South Korea.
available data, by 2030 there could be a gap
between supply and demand equivalent to
about current global production.
Globally, there are many countries in Asia,
Europe and the Americas importing LNG
with appropriate terminals to receive LNG
Global LNG demand is projected to more
than double in the coming 15 years to over
500 mtpa. When compared to expected
LNG supply from different regions based on
Global LNG demand vs. LNG supply by region (mtpa*)
Global LNG Demand

TIMOR GAP Strategic & Business Plan 2016-2035 | 43
TIMOR GAP Strategic & Business Plan 2016-2035 | 43
Source: Poten & Partners (2010) - 2015-2035 LNG Market Assessment Outlook for the Kitimat LNG Terminal
Asia countries will have growing demand
for new contracts, up to 150 mtpa by 2030.
In particular, based on existing supply
contracts and forecasted demand, North
Contracted supply
Demand
150mtpa
LNG demand vs. LNG supply (existing contracts) in Japan, South Korea, Taiwan and China (mtpa)

TIMOR GAP Strategic & Business Plan 2016-2035 | 44
TIMOR GAP Strategic & Business Plan 2016-2035 | 44
Boost Human Resources development:
• Chemical Engineers / Process Engineers
• Mechanical Engineers
• Electrical Engineers
• Process Control / Instrument Engineers
• Civil Engineers
• Operators
• Technical Supports
• Capex (TIMOR GAP share): USD 6.7 billion
• First Train: USD 5.6 billion (TIMOR
GAP share at 70% = USD 3.9 billion)
• LNG Tanker: USD 0.25 billion (100%
TIMOR GAP owned)
• Second Train: USD 3.7 billion (TIMOR
GAP share at 70% = USD 2.6 billion)
• Engage appropriate project partners
(Technical and Financial)
• Improve strategic cooperation
(Government to Government)
KEY LNG REQUIREMENTS
Implementing the LNG plant, pipeline and marine facilities generates important requirements
in terms of human resources, capital and key partnerships to form.
Human Resources
Capital & Partnerships

TIMOR GAP Strategic & Business Plan 2016-2035 | 45
TIMOR GAP Strategic & Business Plan 2016-2035 | 45
REFINERY & PETROCHEMICAL GOALS
LONG TERM( 1 0 + y e a r s )
Petrochemical
• According to feedstock available, expand into 100k barrels/day and aromatics production, and create a petrochemical complex
MEDIUM TERM( 5 - 1 0 y e a r s )
Expansion
• Expand the refinery to 60k barrels/day through TIMOR GAP share of oil production (JPDA, TLEA or
other) or through imports
SHORT TERM( 2 - 5 y e a r s )
Re�nery & Pipeline
• Start operating the refinery in 2020, with a condensate splitter to produce naphtha, diesel, gasoline, and LPG
• Commission pipeline Suai-Betano for condensate & refinery products by 2019
produce reformer in the medium term, and
expanding further into a petrochemical
complex producing aromatics in the long
term.
The refinery & petrochemical complex
is divided into three phases: a refinery
producing naphtha, diesel, gasoline and
LPG in the short term, expanding to

TIMOR GAP Strategic & Business Plan 2016-2035 | 46
TIMOR GAP Strategic & Business Plan 2016-2035 | 46
The refinery project requires significant investments in the coming 5 years and is expected
to have a payback with positive accumulated cash flows in the long term.
REFINERY CASH FLOWS
*NPV = Net Present Value (at 10% discount rate) ; IRR = Internal Rate of Return || Source: TIMOR GAP analysis
Net cash �ows (USD MM) Accumulated cash �ows (USD MM)
-600
-500
-400
-300
-200
-100
0
100
200
300
400
-300
-250
-200
-150
-100
-50
0
50
100
150
200
2015 2016 2017 2018 2019 2020 2021 2022 2023 2024 2025 2026 2027 2028 2029 2030 2031 2032 2033 2034 2035
Start of operationExpansion into60k barrels/day
IRR* = 10.4%NPV* = USD 23 MM
Accum. cash �ow: USD 2.7 billion

TIMOR GAP Strategic & Business Plan 2016-2035 | 47
TIMOR GAP Strategic & Business Plan 2016-2035 | 47
The Refinery economic model is based on a set of key inputs and assumptions that
significantly affect the model outputs (NPV and IRR, in particular):
KEY REFINERY INPUTS & ASSUMPTIONS
*mtpa = million tonnes per annum; MMscfd = million standard cubic feet per day ||**At Conservative Case. For each $20/bbl price reduction we assume a 15% cost reduction
Construction start year: 2018
Production start year: 2020
Operating: 333 days, with 30-day turnaround every 5 years
Plant capacity (barrels/day):
BTX (Benzene, Toluene, Xylenes) starting in 2040
According to TIMOR GAP price forecasts
Opex: 3% of capex
Corporate Income Tax for Government of Timor-Leste: 10%
TIMOR GAP share: 100%
Cost of capital: 10%
TIMINGS
VOLUME
PRODUCTS
PRICES
COSTS**
EQUITY
202030,000 60,000 100,000
2030 2040
Capex:
2020$552 MM $501 MM $952 MM
2030 2040
TIMOR GAP Strategic & Business Plan 2016-2035 | 48
TIMOR GAP Strategic & Business Plan 2016-2035 | 48
INITIAL SOCIO-ECONOMIC IMPACT ANALYSIS
POSSIBLE FEEDSTOCK SOURCES
operation: USD 68.1 million/year
• Indirect GVA coming from supporting
facilities: USD 1.8 million/year
• Contribute approx. 1.4% to Timor-Leste
GDP estimated for 2022 of USD 3.67
billion
Employment opportunity
• Construction phase (3 years): approx.
2,000 people at the peak
• Operation phase
• Direct employment: 223 jobs
• Indirect & induced employment: 379
jobs
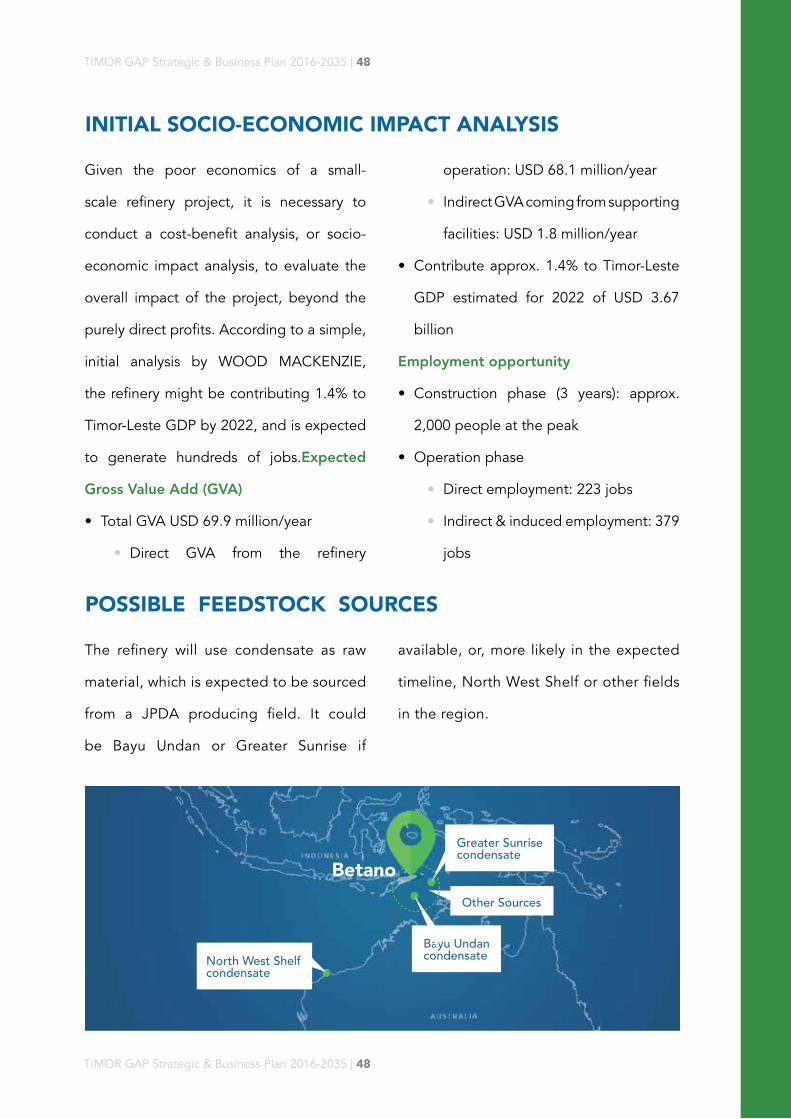
available, or, more likely in the expected
timeline, North West Shelf or other fields
in the region.
Given the poor economics of a small-
scale refinery project, it is necessary to
conduct a cost-benefit analysis, or socio-
economic impact analysis, to evaluate the
overall impact of the project, beyond the
purely direct profits. According to a simple,
initial analysis by WOOD MACKENZIE,
the refinery might be contributing 1.4% to
Timor-Leste GDP by 2022, and is expected
to generate hundreds of jobs.Expected
Gross Value Add (GVA)
• Total GVA USD 69.9 million/year
• Direct GVA from the refinery
The refinery will use condensate as raw
material, which is expected to be sourced
from a JPDA producing field. It could
be Bayu Undan or Greater Sunrise if
Betano
Greater Sunrisecondensate
Bayu Undancondensate
Other Sources
North West Shelfcondensate

TIMOR GAP Strategic & Business Plan 2016-2035 | 49
TIMOR GAP Strategic & Business Plan 2016-2035 | 49
THE REFINERY WILL SUPPLY MOSTLY EXPORT MARKETS
Leste, over half of the diesel produced
is planned for exports. This means that
in the first 10 years about 80% of total
volume produced will be exported.
The initial refinery design will produce
mostly light and heavy naphtha in the
first 10 years, which will be exported
as feedstock for petrochemical plants.
Also, given forecasted demand in Timor-
*ktpa = thousand tonnes per annum || Source: TIMOR GAP & PTTGC
Re�nery production per product (ktpa*)
0
500
1,000
1,500
2,000
2,500
2020 2021 2022 2023 2024 2025 2026 2027 2028 2029 2030 2031 2032 2033 2034 2035
LPG Light Naphtha Heavy Naphtha Gasoline (92 RON) Diesel

TIMOR GAP Strategic & Business Plan 2016-2035 | 50
TIMOR GAP Strategic & Business Plan 2016-2035 | 50
REFINERY TARGET MARKETS
Source: TIMOR GAP analysis
plants. About half the diesel will be sold
in markets close to Timor-Leste, and the
rest is for the domestic market.
The refinery will be targeting mostly
international markets. Over 50% of volume
is naphtha, which is expected to be sold
to Singapore or Thailand petrochemical
Naphtha markets most likely Singapore and Thailand
Likely market for diesel exports
Market for gasoline, LPG and ~45% diesel
PRODUCT DEMAND FORECASTS
The domestic market for gasoline and
diesel is expected to grow at 6% per
annum.
Demand for refinery products is forecasted
to grow slowly in Asian markets (key
targets for exports), especially for naphtha,
which represents the bulk of production.
+1.5% p.a. +3.2% p.a.
Asia
+X% p.a. Average annual growth rate
Naphtha (million tonnes) Diesel/Gasoil (million tonnes)

TIMOR GAP Strategic & Business Plan 2016-2035 | 51
TIMOR GAP Strategic & Business Plan 2016-2035 | 51
Timor-Leste
+6% p.a. +6% p.a.
*kbpd = thousand barrels per day || Source: Wood Mackenzie Report “Betano Refinery Financial Assessment” (Aug 2014)
+X% p.a. Average annual growth rate
Operating this refinery will require different
technologies, including:
• UOP Technology License Standard
• Axens Technology Mercury Removal Unit
• Reverse Osmosis Technology
KEY REFINERY & PETROCHEMICAL REQUIREMENTS
Technology
Implementing the refinery & petrochemical complex generates important human
resources, technology, and capital requirements.
Total capex for the Betano Refinery
Development Phases (Conservative Case):
• Initial (by 2020): ~USD 552 million
• Expansion to 60k bpd (by 2030): ~USD
501 million
• Expansion to 100k bpd and Aromatics
(by 2040): ~USD 952 million.
Capital
Gasoline (kbpd*) Diesel (kbpd*)

TIMOR GAP Strategic & Business Plan 2016-2035 | 52
TIMOR GAP Strategic & Business Plan 2016-2035 | 52
TIMOR GAP needs to build appropriate skills
and knowledge through capacity building for
a variety of roles:
• Refinery Construction: Civil Engineer,
Electrical Engineer, Design Engineer,
Architect, Piping Engineer
• Refinery Operation: Process Engineer,
Mechanical Engineer, Electrical Engineer,
Instrument Engineer, Rotating Engineer,
Corrosion Engineer, Petroleum Engineer,
Environmental Engineer, ICT Human
Resource, Accounting, Quality & Safety
Engineer.
Human Resources

TIMOR GAP Strategic & Business Plan 2016-2035 | 53
TIMOR GAP Strategic & Business Plan 2016-2035 | 53
SERVICES STRATEGY & BUSINESS PLAN
SERVICES KEY STRATEGIC GOALS
LONG TERM( 1 0 + y e a r s )
Global Expansion
• Grow market share in domestic products to 50-70%
• Own crude oil/LPG tankers
• Own and operate several offshore support vessels
• Enter international markets with products and services
• Establish oil & gas fabrication yards
MEDIUM TERM( 5 - 1 0 y e a r s )
Domestic Expansion & Services Diversi�cation
• Expand retail business to all municipalities to achieve 30% market share
• Establish fuel receiving terminal and storage in the South and North coasts
• Expand marine services (e.g., maintenance dredging and port operation)
• Become market leader in oil & gas aviation services
• Establish a drilling service joint venture
SHORT TERM( 2 - 5 y e a r s )
Trading & Marketing Presence
• Start operation of Suai Supply Base by 2019
• Establish wholesale and retail petroleum services in the South coast
• Establish trading business to market crude, condensate & fuel
• Develop marine and bunkering services
• Develop aviation services
• Launch oil & gas engineering firm
will be on establishing a trading and retail
presence, expanding around the country
and into new services in the medium term,
and internationally in the long term.
Leveraging the impact of the upstream
and downstream projects, over time
TIMOR GAP intends to develop a series of
services to become a truly integrated oil &
gas company. In the short term the focus

TIMOR GAP Strategic & Business Plan 2016-2035 | 54
TIMOR GAP Strategic & Business Plan 2016-2035 | 54
SUAI SUPPLY BASE CASH FLOWS
estimated at around USD 60 million per
year, in the form of a variety of services
(port, mini-shore bases, fuel tanks,
warehouses, etc.) to oil & gas operators
and other Suai Supply Base users.
The Timor-Leste Government has decided
to make the initial investment in building
the Suai Supply Base and associated
infrastructure. This allows TIMOR GAP
to make a small initial investment that is
expected to generate significant returns,
Note: Assumes 100% TIMOR GAP ownership || Source: TIMOR GAP & PTTGC
Net cash �ows (USD MM) Accumulated cash �ows (USD MM)
-100
0
100
200
300
400
500
600
700
800
900
-20
0
20
40
60
80
2015 2016 2017 2018 2019 2020 2021 2022 2023 2024 2025 2026 2027 2028 2029 2030 2031 2032 2033 2034 2035
Capital investment = USD 20 millionRevenues = USD 1.9 billion
Accumulated cash �ow = USD 1.4 billionIRR = 80%
NPV at 10% = USD 264 million

TIMOR GAP Strategic & Business Plan 2016-2035 | 55
TIMOR GAP Strategic & Business Plan 2016-2035 | 55
• Receiving/export port terminal
• Fuel storage facilities
• Filling stations
• Road tanker
• Land access for fabrication and other
facilities
• Develop the trading team through
secondment to other companies, on-the-
job and formal training, etc.
• Implement a Quality Management System
with ISO certificates
• Establish trading policy manual
• Funding for investments and working
capital: ~USD 500 million
• Fuel receiving terminal & storage
(South & North): ~USD 400 million
• One Panamax tanker: ~USD 50 million
• Offshore support vessel: ~USD 20
million
KEY SERVICES REQUIREMENTS
Human Resources & Processes
Infrastructure
Besides detailing the strategy and business plan for each type of service, pursuing oil &
gas services goals involves significant requirements in terms of human resources and key
processes, infrastructure, and capital.
Capital

TIMOR GAP Strategic & Business Plan 2016-2035 | 56
TIMOR GAP Strategic & Business Plan 2016-2035 | 56
NATIONAL DEVELOPMENT
COMMITTED TO GOOD GOVERNANCE
energy security, developing local human
capital and petroleum capabilities, and
building the infrastructure to enable
sound economic growth.
Transparency Model to ensure good
governance, inclusivity, transparency and
civic responsibility, and contributing to
the Extractive Industries Transparency
Initiative.
By pursuing our mission and delivering on
this Strategic Plan, TIMOR GAP contributes
to Timor-Leste development in several
critical ways: promoting good governance
in the petroleum sector, ensuring national
TIMOR GAP is committed to being a
role model for state-owned and private
enterprises in Timor-Leste, ensuring it
complies with all applicable laws and
regulations, following the Timor-Leste
Compliant with the Petroleum Fund Law,
Petroleum Taxation Law and all other relevant
legal frameworks
Compliant with the Timor-Leste Transparency
Model
Part of EITI’s* Multi-Stakeholder Group
*Extractive Industries Transparency Initiative

TIMOR GAP Strategic & Business Plan 2016-2035 | 57
TIMOR GAP Strategic & Business Plan 2016-2035 | 57
ENSURING ENERGY SECURITY
DEVELOPING HUMAN CAPITAL & LOCAL CAPABILITIES
develop appropriate supply channels and
storage to minimize eventual periods of
fuel scarcity, and will build distribution
networks to ensure fuel reaches everyone.
with appropriate skills and capabilities
can be found locally.
TIMOR GAP’s downstream activities will
ensure that Timor-Leste, its population,
State and private sector have access
to energy sources adequate to their
needs. In particular, TIMOR GAP will
TIMOR GAP is a driver of petroleum
sector development in Timor-Leste, in
particular by ensuring that human capital
Developing reliable fuel supply and reserves for Timor-Leste’s energy needs, enabling
sustained economic growth
Job creation
• Growing from current ~100 employees
(the large majority Timorese), and ~40
employees in subsidiary GAP-MHS
• Hundreds of direct jobs created by
the LNG business, Refinery and Suai
Supply Base
• Thousands of indirect jobs and
business opportunities
Local content requirements
• Local content – resources, products,
services, labor – is a key requirement
in negotiations with JV partners
• Projects prioritizing local staff
whenever appropriate
High-quality and reliable fuel distribution in all the municipalities of Timor-Leste, for personal use, as well as for the public and
private sectors
TIMOR GAP Strategic & Business Plan 2016-2035 | 58
TIMOR GAP Strategic & Business Plan 2016-2035 | 58
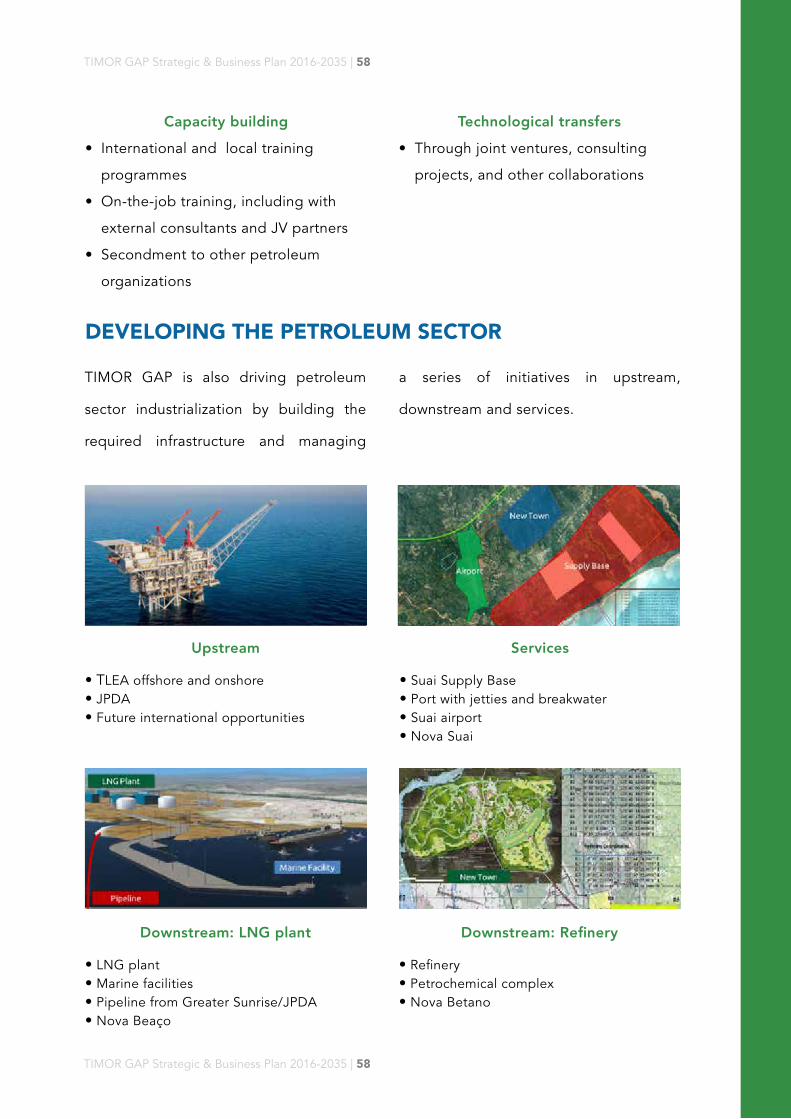
DEVELOPING THE PETROLEUM SECTOR
a series of initiatives in upstream,
downstream and services.
TIMOR GAP is also driving petroleum
sector industrialization by building the
required infrastructure and managing
Upstream
• TLEA offshore and onshore• JPDA• Future international opportunities
Downstream: LNG plant
• LNG plant• Marine facilities• Pipeline from Greater Sunrise/JPDA• Nova Beaço
Services
• Suai Supply Base• Port with jetties and breakwater• Suai airport• Nova Suai
Downstream: Refinery
• Refinery• Petrochemical complex• Nova Betano
Capacity building
• International and local training
programmes
• On-the-job training, including with
external consultants and JV partners
• Secondment to other petroleum
organizations
Technological transfers
• Through joint ventures, consulting
projects, and other collaborations

TIMOR GAP Strategic & Business Plan 2016-2035 | 59
TIMOR GAP Strategic & Business Plan 2016-2035 | 59
This section outlines the potential for financial an non-financial benefits that
Timor-Leste can capture through solid development of the petroleum sector.
In summary:
• This will ensure around 20% of the
$100 billion is captured in Timor-Leste’s
economy with additional multiplier
effects of thousands of jobs, trade,
commerce, SME development, and
general GDP growth
• Government take from downstream
and services will be around $6 billion,
plus about $34 billion in TIMOR GAP
• There is potential $350 billion dollars
worth of resources yet to be monetized
in TLEA and JPDA
• This requires exploration, development
and maintenance worth $100 billion in
the coming 20 years
• When fully explored, there will be
approximately $45 billion worth of
Government take through taxes and
profit oil (upstream take), plus TIMOR
GAP dividends of around $25 billion
• However, to capture the full value,
Timor-Leste should move from an
upstream, extractive-oriented industry
to a more transformational industry by
way of developing services, fabrications
and goods – e.g., establishing Suai
Supply Base, refineries/petrochemicals,
and LNG plant

TIMOR GAP Strategic & Business Plan 2016-2035 | 60
TIMOR GAP Strategic & Business Plan 2016-2035 | 60
JPD
AJP
DA
11-
106
TLE
AO
NSH
OR
E
REVENUES COSTS (60%)PROFIT
TO SPLITTOTAL BOEOIL /
CONDENSATEGAS
INPLACE
Tcf
RECO-VERABLE
Tcf
INPLACEMMBbl
RECO-VERABLEMMBbl
INPLACEMMBbl
RECO-VERABLEMMBbl
USD bn USD bn USD bn
Greater Sunrise
Bayu Undan*
Kelp Deep
TOTAL
11.2
8.4
50.0
69.6
6.63
2.7
13.0
22.3
273
276
70 22 2,306 938 13,906 8,934 357 214 143
0
28
12
206
92
20
34
130
222
744
939
593
1,532
30
30
0
14
6
103
46
10
17
65
111
372
282
278
560
6
6
1,867
1,400
8,333
11,600
28
12
206
92
20
34
130
222
744
939
593
1,532
30
30
1,393
1,186
5,417
7,996
14
6
103
46
10
17
65
111
372
282
278
560
6
6
55.7
47.4
216.7
319.8
0.6
0.2
4.1
1.8
0.4
0.7
2.6
4.4
14.9
11.3
11.1
22.4
0.2
0.2
33.4
28.5
130.0
191.9
0.3
0.1
2.5
1.1
0.2
0.4
1.6
2.7
8.9
6.8
6.7
13.4
0.1
0.1
22.3
19.0
86.7
127.9
0.2
0.1
1.6
0.7
0.2
0.3
1.0
1.8
6.0
4.5
4.4
9.0
0.1
0.1
Kuda Tasi
Jahal
Karungo
Lanjara
Krill
Squilla
Kurisi
Kanase
TOTAL
Citrana
Ainaro
TOTAL
6 Fields
TOTAL
GRAND TOTAL
*Remaining reserves || Note: Simple estimates assuming oil price at $39 per barrel || Source: TIMOR GAP analysis
This table summarizes the Timor-Leste petroleum value potential to be explored and
developed in the next 50 years.

TIMOR GAP Strategic & Business Plan 2016-2035 | 61
TIMOR GAP Strategic & Business Plan 2016-2035 | 61
TIMOR-LESTEONSHORE AREA
AREAExploration & Development:
Estimated expenditure in the next two decades
O&M during Production:Estimated expenditure in the
next two decades
TIMOR-LESTEOFFSHORE AREA
JPDA(excluding GS & BU)
Greater Sunrise
Bayu Undan
TIMOR SEA
TOTAL
Each block to operate @ $10 million/year for 10 years
5 explorations blocks:G & G studies; 2 drilling wells per block @ $10 million per well
2 blocks proceed to development @ $150 million each
$0.2billion
$0.4 billion
Each block to operate @ $300 million/year for 10 years
5 explorations blocks:G & G studies; 4 drilling wells per block @ $100 million per well
3 blocks proceed to development @ $3 billion each
$9 billion
$11 billion
2 big �elds operate @ $500 million/year for 25 years, & 3 �elds for $200 million/year for 10 years
More than 10 explora-tions blocks:G & G studies; 4 drilling wells per block @ $50 million per well
5 blocks proceed to development (2 big size gas @ $6 billion each, and 3 moderate size @ $1 billion each)
$31 billion
$17 billion
$39.5billion
$64.7 billion
Each block to operate @ $300 million/year for 10 years
5 explorations blocks:G & G studies; 4 drilling wells per block @ $50 million per well
2 blocks proceed to development @ $2 billion each
$6 billion
$5 billion
Analogue with BU operation @ $600 million/year for 25 years
Exploration; 7 wells, $500 million to date (past)
Upstream develop-ment can be around $6 billion
$15 billion
$6 billion
(excl.past costs)
Operate till 2022 @ $500 million/year .
Past Past $3.5 billion
Note: Wells & Development costs compared with regional trends, e.g. PNG onshore, Timor Sea shallow & deepwater wells; Operations & Maintenance based on regional trends, Kitan & Bayu Undan costs with some discounts || Source: TIMOR GAP analysis
The potential in exploration, development and production expenditure in the next
20 years can be estimated through the following assumptions, which lead to a total
USD100 billion.

TIMOR GAP Strategic & Business Plan 2016-2035 | 62
TIMOR GAP Strategic & Business Plan 2016-2035 | 62
GOVERNMENT CASH FLOWS
UPSTREAM
petroleum fields estimates, accumulated
cash flows could reach close to
USD 50 billion, of which about 30% in tax
revenues, and the remaining in royalties
and profit oil.
Starting in 2023, the Government is
expected to benefit from positive cash
flows from upstream operations in the
Timor-Leste Exclusive Area (onshore
and offshore) and the Joint Petroleum
Development Area. Based on future
Capital investment = 0Tax Revenues = USD 13 billion
Royalties/Pro�t Oil = USD 33 billionAccumulated cash �ow = USD 46 billion
NPV at 10% = USD 9.3 billion
Net cash �ows (USD MM) Accumulated cash �ows (USD MM)
0
5,000
10,000
15,000
20,000
25,000
30,000
35,000
40,000
45,000
0
500
1,000
1,500
2,000
2,500
3,000
3,500
4,000
4,500
2015
2016
2017
2018
2019
2020
2021
2022
2023
2024
2025
2026
2027
2028
2029
2030
2031
2032
2033
2034
2035
2036
2037
2038
2039
2040
2041
2042
2043
2044
2045
Note: Does not include existing producing fields (Bayu Undan, Kitan) nor TLEA or JPDA producing fields with no TIMOR GAP participation; Conservative Price Case || Source: TIMOR GAP upstream model and analysis

TIMOR GAP Strategic & Business Plan 2016-2035 | 63
TIMOR GAP Strategic & Business Plan 2016-2035 | 63
TOTAL TIMOR-LESTE CASH FLOWS
add up to over USD 70 billion, and a Net
Present Value of USD 12 billion.
Adding TIMOR GAP cash flows and
Government cash flows we obtain the
total Timor-Leste cash flows, which could
Net cash �ows (USD MM) Accumulated cash �ows (USD MM)
-5,000
0
5,000
10,000
15,000
20,000
25,000
-1,500
-1,000
-500
0
500
1,000
1,500
2,000
2,500
3,000
2015
2016
2017
2018
2019
2020
2021
2022
2023
2024
2025
2026
2027
2028
2029
2030
2031
2032
2033
2034
2035
2036
2037
2038
2039
2040
2041
2042
2043
2044
2045
Accumulated cash �ow = USD 71 billionIRR = 39%
NPV at 10% = USD 12 billion
Note: Does not include existing producing fields (Bayu Undan, Kitan) nor TLEA or JPDA producing fields with no TIMOR GAP participation || Source: TIMOR GAP upstream model and analysis

TIMOR GAP Strategic & Business Plan 2016-2035 | 64
TIMOR GAP Strategic & Business Plan 2016-2035 | 64
Capital investment = 0Corporate Income Tax = USD 5.0 billion
Other taxes = USD 0.4 billionNPV at 10% = USD 762 million
Net cash �ows (USD MM) Accumulated cash �ows (USD MM)
0
1,000
2,000
3,000
4,000
5,000
0
50
100
150
200
250
300
Start Train1Production
Start Train 2Production
2015
2016
2017
2018
2019
2020
2021
2022
2023
2024
2025
2026
2027
2028
2029
2030
2031
2032
2033
2034
2035
2036
2037
2038
2039
2040
2041
2042
2043
2044
2045
Note: Assumes 70% TIMOR GAP ownership || Source: TIMOR GAP LNG Plant model and analysis
TOTAL TIMOR-LESTE CASH FLOWS
Total Timor-Leste cash flows could add up USD 36 billion, with a Net Present Value of
USD 2.9 billion.
GOVERNMENT CASH FLOWS
DOWNSTREAM: LNG PLANT
after the addition of a second train, the
Government would start receiving over
USD 250 million per year in taxes, leading
to accumulated cash flows of more than
USD 5 billion over the project lifetime.
The LNG project should start generating
positive cash flows to the Government
in 2020, through construction and other
related taxes. From 2030 onwards, as
the project becomes more profitable

TIMOR GAP Strategic & Business Plan 2016-2035 | 65
TIMOR GAP Strategic & Business Plan 2016-2035 | 65
Net cash �ows (USD MM) Accumulated cash �ows (USD MM)
-5,000
0
5,000
10,000
15,000
20,000
25,000
30,000
-2,000
-1,500
-1,000
-500
0
500
1,000
1,500
2,000
2,500
Accumulated cash �ow = USD 36 billionIRR = 17.6%
NPV at 10% = USD 2.9 billion
2015
2016
2017
2018
2019
2020
2021
2022
2023
2024
2025
2026
2027
2028
2029
2030
2031
2032
2033
2034
2035
2036
2037
2038
2039
2040
2041
2042
2043
2044
2045
Note: Assumes 70% TIMOR GAP ownership || Source: TIMOR GAP LNG Plant model and analysis
OTHER BENEFITS/MULTIPLIER EFFECTS
• New businesses such as maintenance,
engineering, small fabrications, repairing,
specialised weldings, specialised
equipment cleaning, transport, gardening,
cleaning, security guard services, chemical
supplies, LNG tanker business, tug boats,
electricity usage, offices and accomodation,
hotels and entertainment, food, fruit and
vegetable supplies, etc. – all of which
will generate thousands of indirect jobs,
and stimulate economic activities around
Beaço and Timor-Leste at large, paying
taxes and contributing to GDP growth
• Trade and commerce – Timor-Leste can be
• Jobs: 5,000+ during construction and 300
direct jobs during operation; over 1,500
indirect jobs (industry ratio: 1 direct job
generates up to 5 indirect jobs)
• Timor-Leste businesses and locals can
compete to supply fabrications, services
and work worth about $6.5 billion in capex
(before production of train 1 & 2) – not
generated without the project
• Timor-Leste businesses and locals can
compete to supply services and goods for
LNG, pipeline and tanker operations worth
over $2.5 billion (25 years) – not generated
without the project
Besides direct financial benefits, the LNG project will lead to a series of other positive
effects:

TIMOR GAP Strategic & Business Plan 2016-2035 | 66
TIMOR GAP Strategic & Business Plan 2016-2035 | 66
DOWNSTREAM: REFINERY
GOVERNMENT CASH FLOWS
income taxes. Overall, Government
accumulated cash flows are expected to
be below USD 0.5 billion over the project
lifetime.
Initially, the Refinery and Petrochemical
project will generate tax income to the
Government in the form of construction
and related taxes. As the project generates
more profits it will start paying corporate
Net cash �ows (USD MM) Accumulated cash �ows (USD MM)
0
100
200
300
400
500
0
10
20
30
40
50
60
2015
2016
2017
2018
2019
2020
2021
2022
2023
2024
2025
2026
2027
2028
2029
2030
2031
2032
2033
2034
2035
2036
2037
2038
2039
2040
2041
2042
2043
2044
2045
Capital investment = 0Accumulated cash �ow = USD 449 million
NPV at 10% = USD 69 million
30k bpd in 2020, expanding to 60k in2030, 100k with Aromatics in 2040
Source: TIMOR GAP Refinery model and analysis
more active in world trade and known as
LNG supplier
• Build geopolitical energy influence
• Reduce trade inbalance by increasing
exports
• Increase hard currency into Timor-Leste
economy
• Infrastructure: set the basis for future
expansions
• Education: science & technology exposure,
experience and transfer

TIMOR GAP Strategic & Business Plan 2016-2035 | 67
TIMOR GAP Strategic & Business Plan 2016-2035 | 67
TOTAL TIMOR-LESTE CASH FLOWS
Total Timor-Leste cash flows could add up USD 3.2 billion, with an overall Internal Rate
of Return of 11.6%.
Net cash �ows (USD MM) Accumulated cash �ows (USD MM)
-1,000
-500
0
500
1,000
1,500
2,000
2,500
3,000
3,500
-400
-300
-200
-100
0
100
200
300
400
500
2015
2016
2017
2018
2019
2020
2021
2022
2023
2024
2025
2026
2027
2028
2029
2030
2031
2032
2033
2034
2035
2036
2037
2038
2039
2040
2041
2042
2043
2044
2045
Note: Assumes 100% TIMOR GAP ownership || Source: TIMOR GAP Refinery model and analysis
Accumulated cash �ow = USD 3.2 billionIRR = 11.6%
NPV at 10% = USD 91 million
30k bpd in 2020, expanding to 60k in2030, 100k with Aromatics in 2040

TIMOR GAP Strategic & Business Plan 2016-2035 | 68
TIMOR GAP Strategic & Business Plan 2016-2035 | 68
OTHER BENEFITS/MULTIPLIER EFFECTS
crude tanker business, product tanker
business, tug boats, electricity usage,
offices and accomodation, hotels
and entertainment, food, fruit and
vegetable supplies, etc. – all of which
will generate thousands of indirect
jobs, and stimulate economic activities
around Betano and Timor-Leste at
large, paying taxes and contributing to
GDP growth
• Trade and commerce – Timor-Leste can
be more active in world trade
• Reduce trade inbalance by increasing
exports
• Eliminate fuel import worth $3+ billion
(20 years)
• Reduce hard currency exports
• Infrastructure: set the basis for future
expansions
• Education: science & technology
exposure, experience and transfer
• Jobs: 2,000+ during construction and
250 direct jobs during operation; up
to 1,000 direct jobs if fabrications and
services are set up (possibly 2-5 years
from the start of operation). Therefore
over 6,000 indirect jobs (industry ratio:
1 direct job generates up to 5 indirect
jobs)
• Timor-Leste businesses and locals can
compete to supply fabrications, services
and work worth around $2 billion
in capex (25 years) – not generated
without the project
• Timor-Leste businesses and locals can
compete to supply services and goods
for refinery operations worth almost
$1 billion (25 years) – not generated
without the project
• New businesses such as maintenance,
engineering, small fabrications,
repairing, specialised weldings,
specialised equipment cleaning,
transport, gardening, cleaning, security
guard services, chemical supplies,
Besides direct financial benefits, the Refinery & Petrochemical project will lead to a
series of other positive effects:

TIMOR GAP Strategic & Business Plan 2016-2035 | 69
TIMOR GAP Strategic & Business Plan 2016-2035 | 69
SERVICES
appropriate infrastructure. The next few
pages illustrate a variety of services to be
explored.
International examples provide
references of multiple services that
TIMOR GAP could get into as it becomes
a fully integrated oil & gas company, with
SUPPLY BASE MANAGEMENT
ManpowerSupporting facilitiesWaste managementRepair and maintenance
PORT SERVICES
Berthing space bookingVessel clearanceCustoms & immigrationCrew change
CARGO HANDLING AT QUAY
StevedoringHeavy equipmentTruckingLiquid mud transfer
CARGO HANDLING AT BASE
LaborHeavy equipmentTrucking
VESSEL SUPPLY
FuelWaterFood (meat, fruits & vegetables)Other provisions
MARINE SERVICES
Rig Agency
Rig/Vessel Lay-up
Tug Boats
Vessel Chartering
AHTS & PSVs
Rig Tow

TIMOR GAP Strategic & Business Plan 2016-2035 | 70
TIMOR GAP Strategic & Business Plan 2016-2035 | 70
OILFIELD SUPPORT SERVICES
EngineeringFabrications (small to big)CCU & Basket RentalEquipment RentalManpower SupplyInspection ServicesProcurement ServicesOil Spill ResponseMaintenance ServicesPipe Repair & ThreadingSeismic SurveysDrilling Rigs StationsDrilling MudsBunkering
FACILITY RENT & MANAGEMENT
Warehouse /Yard Management
Bulk Plant Area
Port-a-camp
Of�ce Space
Equipment Rental
Cargo Handling
Security Services
Waste Management
Fuel/Water Supply
SUPPLY CHAIN SERVICES
International TransportationCustoms ClearanceHeavy Lift TransportationMaterial ManagementDangerous Goods HandlingHand-Carry & HotshotAir/Sea CharteringHelicopter Operations
NOTE
Activities above will naturally trigger development of agriculture, fishery, small to
medium enterprises (crops, fruits, vegetables, meat and fish required for employees
and workers in the Base and oilfields)
Source: Courtesy of Altus – Modified by TIMOR GAP
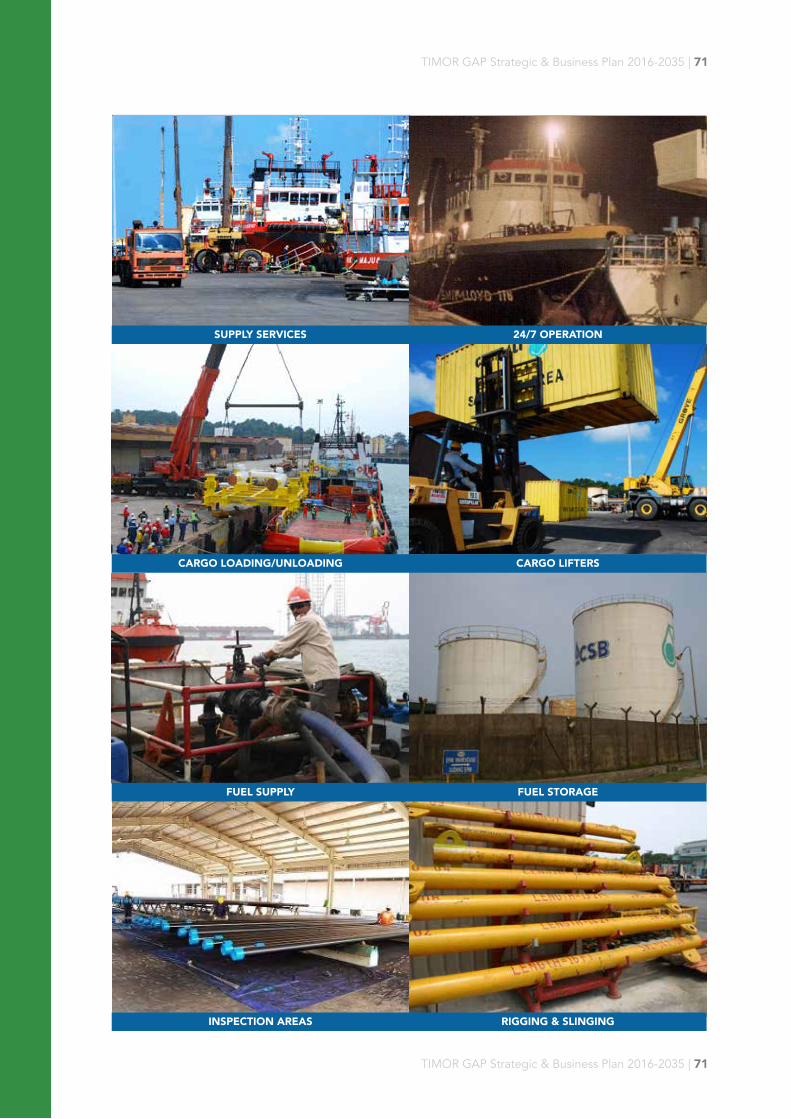
TIMOR GAP Strategic & Business Plan 2016-2035 | 71
TIMOR GAP Strategic & Business Plan 2016-2035 | 71
SUPPLY SERVICES
CARGO LOADING/UNLOADING
FUEL SUPPLY
INSPECTION AREAS
24/7 OPERATION
CARGO LIFTERS
FUEL STORAGE
RIGGING & SLINGING

TIMOR GAP Strategic & Business Plan 2016-2035 | 72
TIMOR GAP Strategic & Business Plan 2016-2035 | 72
CUSTOMS
CREW CHANGE FACILITIES
PIPE RACKING, FUEL TANKS AND WAREHOUSES
WELDING
OPEN YARD
OFFICES
OIL RIGS PARKING FOR SUPPLY/MAINTENANCE
FABRICATION

TIMOR GAP Strategic & Business Plan 2016-2035 | 73
TIMOR GAP Strategic & Business Plan 2016-2035 | 73
PIPE REELS
WAREHOUSES
WASTE MANAGEMENT
CHEMICAL WAREHOUSE
PIPES
SPARE PARTS STORAGE
DRILLING MUDS & SILOS
REPAIRS & MAINTENANCE

TIMOR GAP Strategic & Business Plan 2016-2035 | 74
TIMOR GAP Strategic & Business Plan 2016-2035 | 74
SUAI SUPPLY BASE SETTING
The Suai Supply Base is strategically located to provide services to a significant number
of petroleum fields in the Timor Sea and surrounding areas.
The Suai Supply Base will compete in
particular with the Darwin Marine Supply
Base, which has been supplying the
majority of goods and services to JPDA
producing fields (Bayu Undan and Kitan).
Kelp Deep
300 km
600 km
Darwin Marine Supply Base || Source: Darwin Marine Supply Base presentation to potential bidders

TIMOR GAP Strategic & Business Plan 2016-2035 | 75
TIMOR GAP Strategic & Business Plan 2016-2035 | 75
Darwin has grown into a very dynamic & bustling city since 1999 – partly due to the Bayu
Undan Pipeline & LNG plant.
SUAI
Darwin/Australia is currently supplying goods, services and some fabrication for Bayu Undan and Kitan:
• Bayu Undan: ~96% of $500 MM per year – to date ~$7 bn
• Kitan: ~70% of $200 MM per year – to date ~$1 bn
95Source: Darwin Marine Supply Base presentation to potential bidders

TIMOR GAP Strategic & Business Plan 2016-2035 | 76
TIMOR GAP Strategic & Business Plan 2016-2035 | 76
SUAI SUPPLY BASE BUSINESS POTENTIAL
be larger than the share of other Timor
Sea fields. Given the types of goods
and services involved, we expect SSB
to be able to capture larger shares in
Operations & Maintenance (up to almost
70% of TLEA offshore) than in Exploration
& Development (up to almost 30% of
TLEA offshore).
To analyze the possible business
generated by the Suai Supply Base, we
projected the potential share of goods
and services to oil & gas projects in the
Timor Sea that it could capture over time.
We’d expect SSB’s market share of TLEA
fields’ expenditure to be larger than the
share of JPDA fields, which in turn would
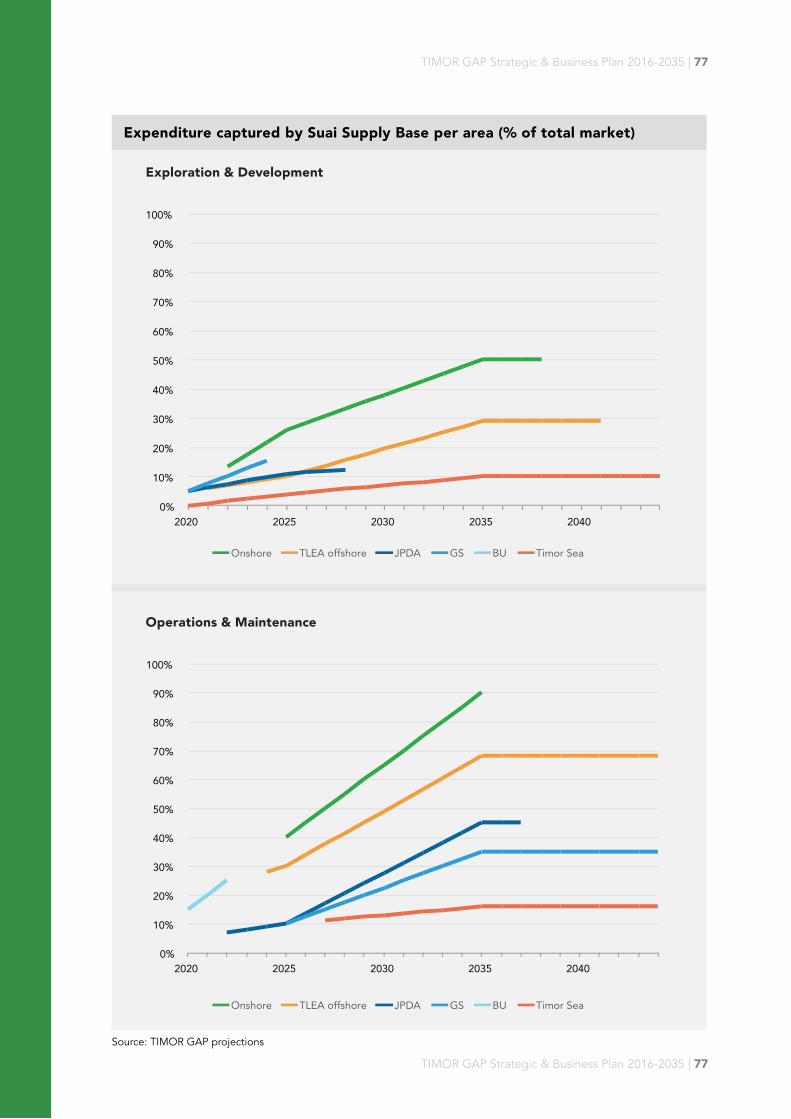
TIMOR GAP Strategic & Business Plan 2016-2035 | 77
TIMOR GAP Strategic & Business Plan 2016-2035 | 77
Expenditure captured by Suai Supply Base per area (% of total market)
Source: TIMOR GAP projections

TIMOR GAP Strategic & Business Plan 2016-2035 | 78
TIMOR GAP Strategic & Business Plan 2016-2035 | 78
goods and services captured by SSB over
time: around USD 150 million in 2020,
almost USD 500 million in 2025, and over
USD 800 million in 2030 and 2040. This
means not direct SSB revenue for TIMOR
GAP, but revenue that users of SSB would
generate (companies operating from SSB
to provide fabrication and other oil & gas
goods and services).
To quantify the potential market in
dollars, we used industry benchmarks to
estimate the Exploration & Development
(E&D) and Operations & Maintenance
(O&M) expenditures of expected fields
in the different areas in the next 30
years. These amounts, multiplied by
the projected market shares over time,
provide us a projection of the value of

TIMOR GAP Strategic & Business Plan 2016-2035 | 79
TIMOR GAP Strategic & Business Plan 2016-2035 | 79
Expenditure per area (USD million)
Total Market Value
0
500
1,000
1,500
2,000
2,500
3,000
3,500
E&D O&M E&D O&M E&D O&M E&D O&M
Onshore TLEA offshore JPDA GS BU Timor Sea
Onshore TLEA offshore JPDA GS BU Timor Sea
Captured by Suai Supply Base
0
500
1,000
1,500
2,000
2,500
3,000
3,500
E&D O&M
2020 2025 2030 2040
2020 2025 2030 2040
E&D O&M E&D O&M E&D O&M
3% 15%7% 14% 10%
23%
23%
27%
Source: TIMOR GAP projections

TIMOR GAP Strategic & Business Plan 2016-2035 | 80
TIMOR GAP Strategic & Business Plan 2016-2035 | 80
GOVERNMENT CASH FLOWS
share estimates, as well as on simplified
assumptions about the businesses
operating in SSB: we considered that
imported goods represent 65% of
revenue, that wages represent 15%, and
profits 20%. Over the project lifetime,
we’d expect accumulated cash flows of
almost USD 700 million.
To calculate Government cash flows
associated with the Suai Supply Base
we considered the initial investment
of USD 734 million and estimated state
income from associated import duties,
sales tax on imported goods, corporate
income tax and wage withholding tax. We
based these calculations on SSB market
Net cash �ows (USD MM) Accumulated cash �ows (USD MM)
-800
-600
-400
-200
0
200
400
600
-200
-150
-100
-50
0
50
100
2015
2016
2017
2018
2019
2020
2021
2022
2023
2024
2025
2026
2027
2028
2029
2030
2031
2032
2033
2034
2035
2036
2037
2038
2039
2040
2041
2042
2043
2044
2045
Capital investment = USD 734 millionRevenues = USD 1.4 billion
Accumulated cash �ow = USD 685 millionIRR = 2.8%
NPV at 10% = - USD 376 million
Source: TIMOR GAP Suai Supply Base model and analysis

TIMOR GAP Strategic & Business Plan 2016-2035 | 81
TIMOR GAP Strategic & Business Plan 2016-2035 | 81
TOTAL TIMOR-LESTE CASH FLOWS
Base: accumulated cash flows of USD 2.1
billion, with an Internal Rate of Return of
8.3%.
Adding TIMOR GAP and Government
cash flows, we obtain total Timor-Leste
cash flows associated with the Suai Supply
Net cash �ows (USD MM) Accumulated cash �ows (USD MM)
-1,000
-500
0
500
1,000
1,500
2,000
-250
-200
-150
-50
0
50
100
150
200
2015
2016
2017
2018
2019
2020
2021
2022
2023
2024
2025
2026
2027
2028
2029
2030
2031
2032
2033
2034
2035
2036
2037
2038
2039
2040
2041
2042
2043
2044
2045
Accumulated cash �ow = USD 2.1 billionIRR = 8.3%
NPV at 10% = - USD 112 million
Note: Assumes 100% TIMOR GAP ownership || Source: TIMOR GAP Suai Supply Base model and analysis

TIMOR GAP Strategic & Business Plan 2016-2035 | 82
TIMOR GAP Strategic & Business Plan 2016-2035 | 82
OTHER BENEFITS/MULTIPLIER EFFECTS
business, tug boats, electricity usage,
offices and accomodation, hotels
and entertainment, food, fruit and
vegetable supplies, etc. – all of which
will generate thousands of indirect
jobs, and stimulate economic activities
around Suai and Timor-Leste at large,
paying taxes and contributing to GDP
growth
• Trade and commerce – Timor-Leste can
be active in world trade and known as
SSB
• Build geopolitical influence in supply
chain
• Reduce trade inbalance by increasing
exports
• Increase hard currency into Timor-Leste
economy
• Infrastructure: set the basis for future
expansions
• Education: science & technology
exposure, experience and transfer
• Jobs: 2,000+ during construction and
250 direct jobs during operation; up
to 5,000 direct jobs if fabrications and
services are set up. Therefore over
25,000 indirect jobs (industry ratio: 1
direct job generates up to 5 indirect
jobs)
• Timor-Leste businesses and locals
can compete to supply goods and
services for upstream exploration &
development of over $4 billion (25
years) – not generated without SSB
• Timor-Leste businesses and locals can
compete to supply goods and services
for upstream operations & maintenance
of over $15 billion (25 years) – not
generated without SSB
• New businesses such as maintenance,
engineering, small fabrications,
repairing, specialised weldings,
specialised equipment cleaning,
transport, gardening, cleaning, security
guard services, chemical supplies,
crude tanker business, product tanker
Besides direct financial benefits, the Suai Supply Base project will lead to a series of
other positive effects:
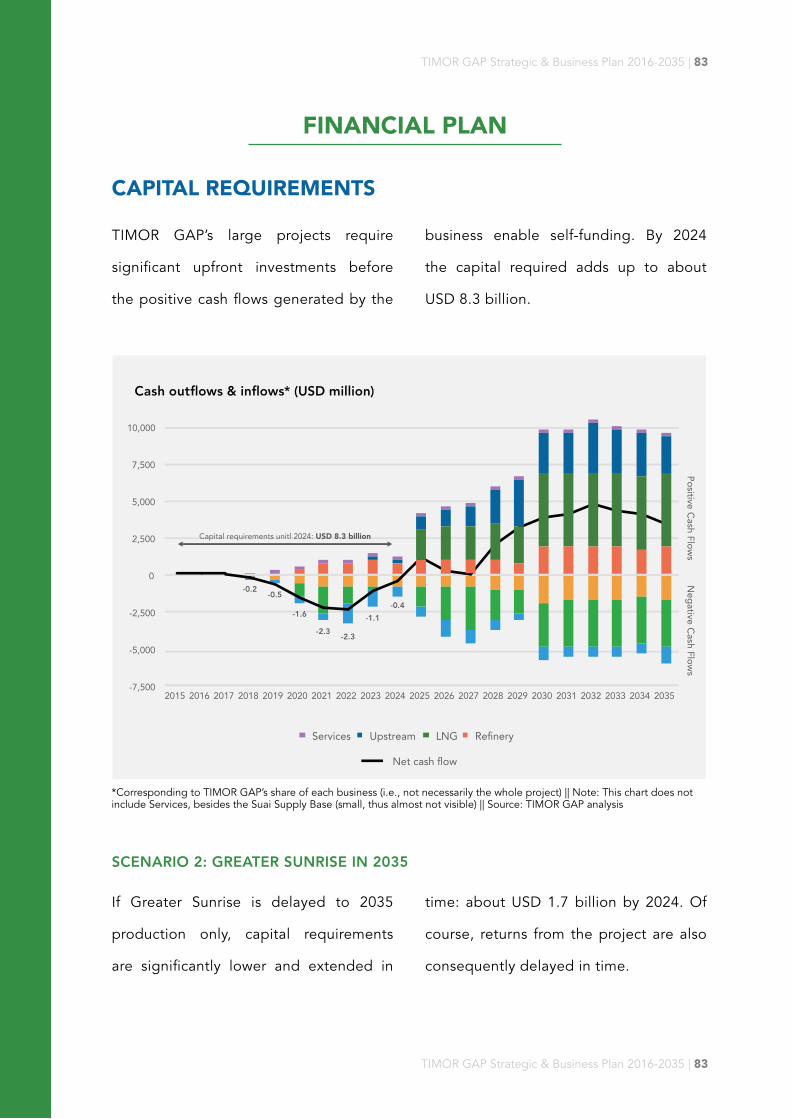
TIMOR GAP Strategic & Business Plan 2016-2035 | 83
TIMOR GAP Strategic & Business Plan 2016-2035 | 83
CAPITAL REQUIREMENTS
SCENARIO 2: GREATER SUNRISE IN 2035
business enable self-funding. By 2024
the capital required adds up to about
USD 8.3 billion.
time: about USD 1.7 billion by 2024. Of
course, returns from the project are also
consequently delayed in time.
TIMOR GAP’s large projects require
significant upfront investments before
the positive cash flows generated by the
If Greater Sunrise is delayed to 2035
production only, capital requirements
are significantly lower and extended in
FINANCIAL PLAN
*Corresponding to TIMOR GAP’s share of each business (i.e., not necessarily the whole project) || Note: This chart does not include Services, besides the Suai Supply Base (small, thus almost not visible) || Source: TIMOR GAP analysis

TIMOR GAP Strategic & Business Plan 2016-2035 | 84
TIMOR GAP Strategic & Business Plan 2016-2035 | 84
*Corresponding to TIMOR GAP’s share of each business (i.e., not necessarily the whole project) || Note: Does not include Services besides the Suai Supply Base (small, thus almost not visible) || Source: TIMOR GAP analysis
Cash out�ows & in�ows* (USD million)
Services Upstream LNG Re�nery
Net cash �ow
-7,500
-5,000
-2,500
0
2,500
5,000
7,500
10,000
2015 2016 2017 2018 2019 2020 2021 2022 2023 2024 2025 2026 2027 2028 2029 2030 2031 2032 2033 2034 2035
Capital requirements unitl 2024: USD 1.7 billion
TIMOR GAP Strategic & Business Plan 2016-2035 | 85
TIMOR GAP Strategic & Business Plan 2016-2035 | 85
FINANCING PLAN
injection or annual subsidies), banks and
other lenders, and business partners in
oil & gas joint ventures through free-carry
or carried-interest arrangements (where
TIMOR GAP does not have to make the
initial investments that would normally
correspond to its share of an oil & gas
field, in exchange for future cash flows).
The following diagrams describe in more
detail several loan financing options that
include security arrangements to reduce
lender’s credit risk.
Funding the coming years of heavy
investment requires a solid financing
strategy, targeting a mix of capital
sources according to TIMOR GAP’s
stage of development. Implementing
the financing strategy will involve
high-stakes negotiations with a variety
of stakeholders in order to secure
appropriate funds with affordable terms
in the necessary timeframe. In the short
term, the most likely sources of funding
are the Government (through a capital
For the upstream, the most likely financing options are:
Short term
• Annual State Budget allocation• Public capital injection• Bank loans (Government guarantees)• Export Credit Agencies (trade finance)• Carried interest/free carry on upstream• Share sales
• Leverage TIMOR GAP’s rights as
national oil company
• Negotiate with JV partners carried-
interest/free-carry arrangements, paid
back during production
Medium/Long term
• Self-funding from operations• Bank loans (with company asset
guarantees)• Loans from financial institutions (e.g.,
IFC, ADB, state-owned banks)• Government credit line (e.g., from
Petroleum Fund)
UPSTREAM FINANCING PLAN
• Commercial loans (potentially with
guarantees)
• Government capital injection

TIMOR GAP Strategic & Business Plan 2016-2035 | 86
TIMOR GAP Strategic & Business Plan 2016-2035 | 86
covered by positive cash flows from
producing fields (from 2028 onwards). By
delaying negative cash flows but reducing
future positive cash flows, loans have a
positive impact on IRR but negative on
accumulated cash flows and NPV.
• TIMOR GAP and its partners to
invest $20 million for operation and
management
To explore financing possibilities, we
simulated the impact of a commercial loan
on overall TIMOR GAP upstream cash
flows. By borrowing almost USD 6 billion
in the next 10 years, TIMOR GAP could
cover most of its funding requirements,
as loan repayments would be mostly
• Timor-Leste Government to invest
$734 million for construction (including
supervision consultant)
SUAI SUPPLY BASE FINANCING PLAN
Capex/operational cash �ows (USD MM) Accumulated cash �ows (USD MM)
Accumulated cash �ow = USD 19 billionIRR = 40%
NPV at 10% = USD 2.5 billion
LOAN TERMS:Loan amount: USD 5.8 bn over 10 years (2018-2027) || Interest: 10% p.a.
Maturity: 15 years || Grace period: 5 years
-2,000
0
2,000
4,000
6,000
8,000
10,000
-1,500
-1,000
-500
0
500
1,000
1,500
2,000
2,500
3,000
2016 2017 2018 2019 2020 2021 2022 2023 2024 2025 2026 2027 2028 2029 2030 2031 2032 2033 2034 2035
Total cash �ows Loan cash �ows
Source: TIMOR GAP upstream model and analysis
For Suai Supply Base the financing plan is more clear:
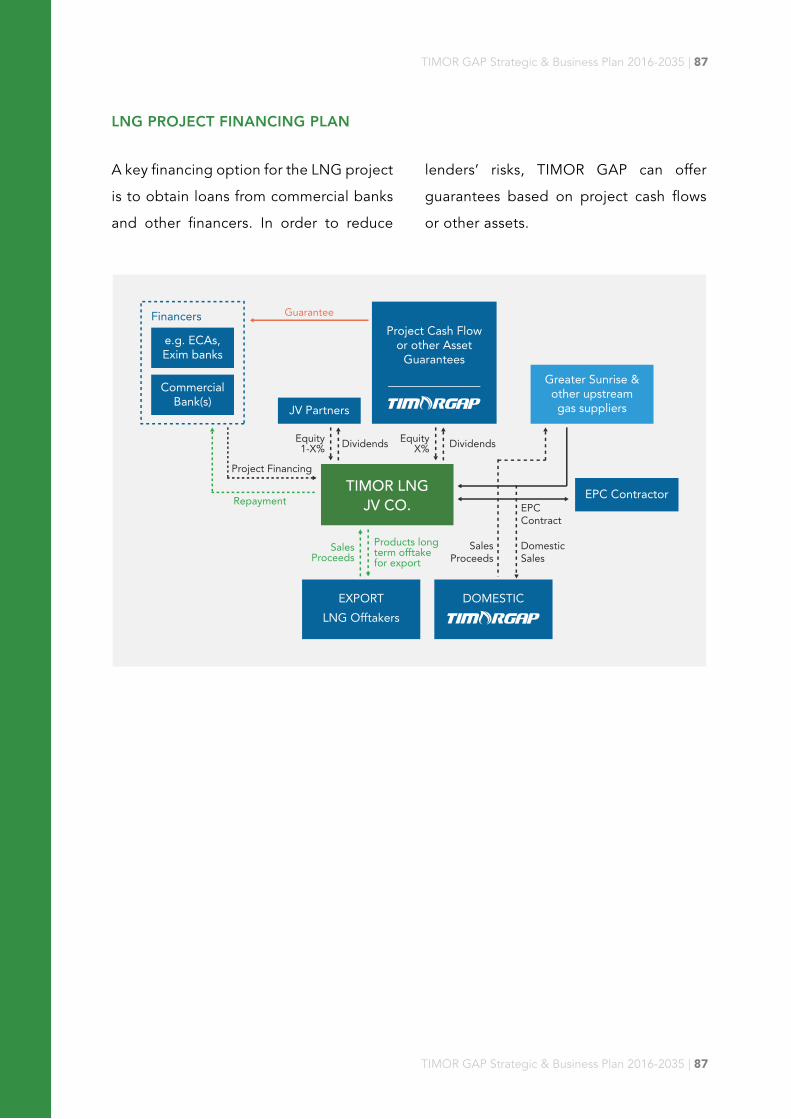
TIMOR GAP Strategic & Business Plan 2016-2035 | 87
TIMOR GAP Strategic & Business Plan 2016-2035 | 87
lenders’ risks, TIMOR GAP can offer
guarantees based on project cash flows
or other assets.
A key financing option for the LNG project
is to obtain loans from commercial banks
and other financers. In order to reduce
LNG PROJECT FINANCING PLAN
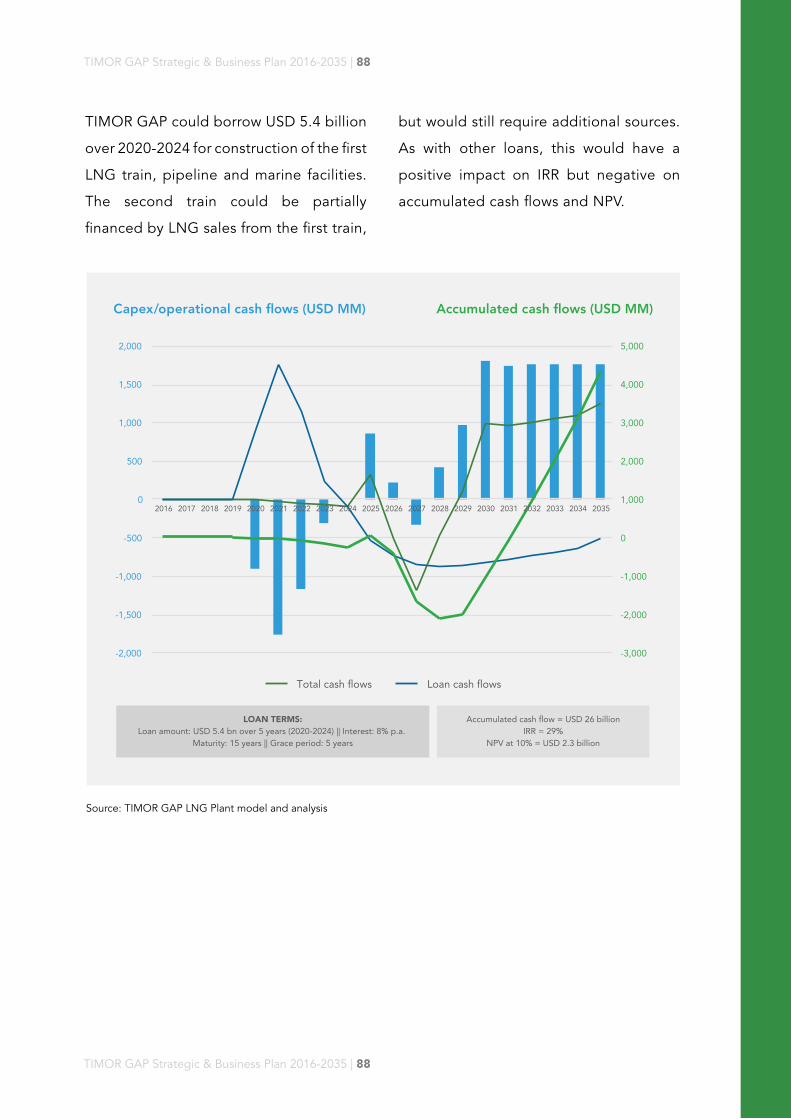
TIMOR GAP Strategic & Business Plan 2016-2035 | 88
TIMOR GAP Strategic & Business Plan 2016-2035 | 88
Capex/operational cash �ows (USD MM) Accumulated cash �ows (USD MM)
Accumulated cash �ow = USD 26 billionIRR = 29%
NPV at 10% = USD 2.3 billion
LOAN TERMS:Loan amount: USD 5.4 bn over 5 years (2020-2024) || Interest: 8% p.a.
Maturity: 15 years || Grace period: 5 years
Total cash �ows Loan cash �ows
-3,000
-2,000
-1,000
0
1,000
2,000
3,000
4,000
5,000
-2,000
-1,500
-1,000
-500
0
500
1,000
1,500
2,000
2016 2017 2018 2019 2020 2021 2022 2023 2024 2025 2026 2027 2028 2029 2030 2031 2032 2033 2034 2035
Source: TIMOR GAP LNG Plant model and analysis
but would still require additional sources.
As with other loans, this would have a
positive impact on IRR but negative on
accumulated cash flows and NPV.
TIMOR GAP could borrow USD 5.4 billion
over 2020-2024 for construction of the first
LNG train, pipeline and marine facilities.
The second train could be partially
financed by LNG sales from the first train,

TIMOR GAP Strategic & Business Plan 2016-2035 | 89
TIMOR GAP Strategic & Business Plan 2016-2035 | 89
asset guarantees, including through
an escrow account to guarantee that
sales proceeds are first used for loan
repayments.
Similarly to the LNG project, the Refinery
& Petrochemical can be financed through
loans from commercial banks and other
financers. To reduce lenders’ risk TIMOR
GAP can offer project cash flow or other
REFINERY & PETROCHEMICAL FINANCING PLAN

TIMOR GAP Strategic & Business Plan 2016-2035 | 90
TIMOR GAP Strategic & Business Plan 2016-2035 | 90
need additional funding for the following
10 years before total cash flows become
positive with the expansion of the refinery.
TIMOR GAP can finance the initial
construction of the refinery with a loan
of USD 0.7 billion over 2018-2020, but
given the low refinery profitability would
Capex/operational cash �ows (USD MM) Accumulated cash �ows (USD MM)
Accumulated cash �ow = USD 2.2 billionIRR = 11.4%
NPV at 10% = USD 39 million
LOAN TERMS:Loan amount: USD 0.7 bn over 3 years (2018-2020) || Interest: 8% p.a.
Maturity: 15 years || Grace period: 5 years
Total cash �ows Loan cash �ows
-900
-800
-700
-600
-500
-400
-300
-200
-100
0
-400
-300
-200
-100
0
100
200
300
400
2016 2017 2018 2019 2020 2021 2022 2023 2024 2025 2026 2027 2028 2029 2030 2031 2032 2033 2034 2035
Source: TIMOR GAP Refinery model and analysis

TIMOR GAP Strategic & Business Plan 2016-2035 | 91
TIMOR GAP Strategic & Business Plan 2016-2035 | 91
HUMAN RESOURCES: SUBSTANTIAL GROWTH
the Refinery and Petrochemicals, and the
Suai Supply Base. This represents a huge
human resources effort to recruit the right
talent, and then manage, train, develop,
pay, motivate and retain them.
The TIMOR GAP team will need to grow
significantly in the next 10 years (average
of 160 new employees per year) in order
to properly staff operations, particularly
in large projects such as the LNG plant,
OTHER REQUIREMENTS
*Dependent on Greater Sunrise negotiations || Note: Excludes temporary workers (e.g., for construction) and indirect jobs created || Source: TIMOR GAP analysis (initial estimates by each team)
Estimated number of employees per business/area
0
250
500
750
1000
1250
1500
1750
2000
2015 2016 2017 2018 2019 2020 2021 2022 2023 2024 2025
Approximate number of employees to recruit per year
+x
+30
+60
+150
+240
+240
+140
+150
+150
+175
+300
+700
+900
Start of SSB operation
Start of Re�nery operation
Start of LNG operation*
TIMOR GAP Strategic & Business Plan 2016-2035 | 92
TIMOR GAP Strategic & Business Plan 2016-2035 | 92
INFORMATION & COMMUNICATION TECHNOLOGY
Adequate Information & Communication Technology (hardware and software) will be
installed to support the needs of all business areas, including support functions.
SHORT TERM
UPSTREAMMID/
DOWNSTREAM SERVICES UPSTREAMMID/
DOWNSTREAM SERVICES
LONG TERM
GnG and New Ventures system
hardware and software setup
Independent and adequate GnG
and New Ventures data center studio
Innovation - New applicable
technologies to business
Re�nery and Gas Business Unit
system software setup (AutoCAD
and others)
TBD – Based on business
relevance and needs
SAP ERP system for Finance,
HCM, Procure-ment, Logistics, Sales & Distribu-
tion
Information and data manage-ment (backup, disaster and
recovery)
Hardware and software upgrades
Policy and guidelines setup of information management
SAP upgrade on modules if required by
business demand
Data Center and other services
Virtual Private Network
Change of domain name from timor-gap.com to timorgap.tl
New system and upgrades

TIMOR GAP Strategic & Business Plan 2016-2035 | 93
TIMOR GAP Strategic & Business Plan 2016-2035 | 93
GOVERNMENT SUPPORT
SCENARIO 1 – ONE-OFF CAPITAL INJECTION
SCENARIO 2 – GRADUAL CAPITAL INJECTION
SCENARIO 3 – ANNUAL SUBSIDY THROUGH MPRM
capitalization for its operations and small
investments in the next 10 years. This can
be achieved through capital injections or
annual subsidies.
acquisition of some oil and gas blocks,
and management of the Tasi Mane project
for the next 10 years
and management of the Tasi Mane project
in the next 2 years, and a major capital
injection up to $150 million thereafter
E&P studies and acquisition of some oil
and gas blocks, and management of the
Tasi Mane project for the next 10 years
As a state-owned company, TIMOR GAP
will require Timor-Leste Government
support in several ways. In particular,
TIMOR GAP needs appropriate
Capital Injection of $200 million to
finance TIMOR GAP operations and
business development, E&P studies and
Capital Injection of $50 million to
finance TIMOR GAP operations and
business development, E&P studies and
acquisition of some oil and gas blocks,
Allocate annually, through the Ministry of
Petroleum and Mineral Resources (MPRM),
$20 million to finance TIMOR GAP
operations and business development,
Note: Financing for TIMOR GAP’s Large projects (Refinery, Pipeline &LNG Plant and oil and gas Development costs) are excluded from the above. They are to be financed following Project Finance Models presented

TIMOR GAP Strategic & Business Plan 2016-2035 | 94
TIMOR GAP Strategic & Business Plan 2016-2035 | 94
ACRONYMS
Autoridade Nacional do Petróleo (National Petroleum Authority)
Barrels of Oil Equivalent
Chief Executive Officer
Comunidade dos Países de Língua Portuguesa (Community of Portuguese Speaking Countries)
Electricidade de Timor-Leste (Electricity of Timor-Leste)
Extractive Industries Transparency Initiative
Exploration and Production
Engineering Procurement Construction Installation
Front End Engineering Design
Gross Domestic Product
Information and Communications Technology
Internal Rate of Return
Joint Petroleum Development Area
Joint venture
Thousand barrels per day
Thousand tonnes per annum
Liquefied Natural Gas
Liquefied Petroleum Gas
Million barrels
Million British Termal Units
Million standard cubic feet per day
Million tons per annum
Non-Governmental Organization
National Oil Company
Net Present Value
Production Sharing Contract
Quality, Health, Safety and Environment
Suai Supply Base
Timor-Leste Exclusive Area
ANP
BOE
CEO
CPLP
EDTL
EITI
E&P
EPCI
FEED
GDP
ICT
IRR
JPDA
JV
kbpd
ktpa
LNG
LPG
MMbbl
mmbtu
MMscfd
mtpa
NGO
NOC
NPV
PSC
QHSE
SSB
TLEA

TIMOR GAP Strategic & Business Plan 2016-2035 | 95
TIMOR GAP Strategic & Business Plan 2016-2035 | 95

TIMOR GAP Strategic & Business Plan 2016-2035 | 96
TIMOR GAP Strategic & Business Plan 2016-2035 | 96