Strategic Asset Management Plan - dcgrant.sa.gov.au
40
Buildings Community Wastewater Management Systems Fleet Information and Communications Technology Open Space Stormwater Drainage Transport Mount Gambier Regional Airport Mount Gambier & District Saleyards Strategic Asset Management Plan 2019 to 2023
Transcript of Strategic Asset Management Plan - dcgrant.sa.gov.au

Buildings Community Wastewater Management Systems Fleet Information and Communications Technology
Open Space Stormwater Drainage Transport Mount Gambier Regional Airport Mount Gambier & District Saleyards
Strategic Asset Management Plan
2019 to 2023
Strategic Asset Management Plan
Document Control AM Plan
Document ID: 161020 nams.plus3 strategic amp template v3.15
Plan Adopted Revision Details
2019-2023 18/03/2019 Draft prepared and presented to Council for adoption.
© Copyright 2016 – All rights reserved.
The Institute of Public Works Engineering Australia.
www.ipwea.org/namsplus

Strategic Asset Management Plan
TABLE OF CONTENTS
1. EXECUTIVE SUMMARY ...................................................................................................................................................................1 2. ASSET MANAGEMENT STRATEGY ...................................................................................................................................................2
2.1 Asset Management System ..................................................................................................................................................2 2.2 Our Assets and their management.......................................................................................................................................4 2.3 Where do we want to be? ....................................................................................................................................................8 2.4 Asset Management Vision ..................................................................................................................................................10 2.5 How will we get there? ......................................................................................................................................................10 2.6 Asset Management Improvement Plan ..............................................................................................................................11 2.7 Consequences if actions are not completed ......................................................................................................................12
3. LEVELS OF SERVICE .......................................................................................................................................................................13 3.1 Customer Research and Expectations ................................................................................................................................13 3.2 Organisational Objectives ..................................................................................................................................................13 3.3 Service Level Objectives .....................................................................................................................................................13 3.4 Asset Hierarchy ..................................................................................................................................................................14 3.5 Legislative Requirements ...................................................................................................................................................14
4. FUTURE DEMAND .........................................................................................................................................................................17 4.1 Demand Drivers and Impact on Services ............................................................................................................................17 4.2 Demand Management Plan................................................................................................................................................18 4.3 Asset Programs to meet Demand ......................................................................................................................................18
5. LIFECYCLE MANAGEMENT PLAN ..................................................................................................................................................19 5.1 Background Data ................................................................................................................................................................19 5.2 Operations and Maintenance Plan .....................................................................................................................................19 5.3 Renewal Plan ......................................................................................................................................................................21 5.4 New/Upgrade Plan .............................................................................................................................................................22 5.5 Disposal Plan ......................................................................................................................................................................23
6. FINANCIAL SUMMARY ..................................................................................................................................................................24 6.1 Asset Renewal Funding Ratio .............................................................................................................................................24 6.2 Funding Strategy ................................................................................................................................................................24 6.3 Valuation Forecasts ............................................................................................................................................................24 6.4 Key Assumptions made in Financial Forecasts ...................................................................................................................25 6.5 Forecast Reliability and Confidence ...................................................................................................................................25
7. RISK MANAGEMENT .....................................................................................................................................................................27 7.1 Risk Management Framework ...........................................................................................................................................27 7.2 Evaluation of Risk ...............................................................................................................................................................27 7.3 Critical Risks and Treatment Plan .......................................................................................................................................28
8. PLAN IMPROVEMENT AND MONITORING ...................................................................................................................................29 8.1 Status of Asset Management Practices ..............................................................................................................................29 8.2 Improvement Plan ..............................................................................................................................................................29 8.3 Monitoring and Review Procedures ...................................................................................................................................29 8.4 Performance Measures ......................................................................................................................................................29
9. REFERENCES .................................................................................................................................................................................30 10. APPENDICES .................................................................................................................................................................................31
Appendix A Projected Operations and Maintenance Expenditure .................................................................................................32 Appendix B Projected Capital Renewal/Replacement Program......................................................................................................33 Appendix C Projected Upgrade/Expansion/New Capital Works Program ......................................................................................36

Strategic Asset Management Plan
This page is intentionally blank.

Strategic Asset Management Plan
Page 1
1. EXECUTIVE SUMMARY
Context
The District Council of Grant (Council) is the most southern local government area in South Australia. Situated on the south east coast it is bounded to the south and southwest by the Southern Ocean, the Victorian Border to the east, the Wattle Range Council to the north and northwest and encircles the City of Mount Gambier. The Council provides a range of support and development services as well as administrative and regulatory functions to improve the quality of life for all people who live, work, do business, enjoy leisure and visit the community and its environs. Such services include Road construction and maintenance, Health (Waste Management), Community Services (Libraries, sport and recreation, aged accommodation services, cultural services), Airport and Saleyards for the sale/exchange of livestock.
Council is responsible for the acquisition, operation, maintenance, renewal and disposal of an extensive range of physical assets with a replacement value of $172,322,923 as at 30th June 2018.
These assets include bridges, buildings, wastewater management, roads, kerbs, footpaths, land, marine and river, open space and recreation areas, plant and equipment and drainage systems and associated operating assets and provide service essential to our community’s quality of life.
This Strategic Asset Management Plan (Strategic AM Plan) takes the organisational objectives in our Strategic Plan, develops the asset management objectives, principles, framework and strategies required to achieve our organisational objectives. The plan summarises activities and expenditure projections from individual asset management plans to achieve the asset management objectives.
What does it Cost?
Operating Outlays (excluding depreciation) The projected operating outlays necessary to provide the services covered by this Strategic AM Plan includes operations and maintenance of existing assets over the 10 year planning period is $5,350,368 on average per year.
Capital Outlays The projected required capital outlays including renewal/replacement and upgrade of existing assets and acquisition of new assets over the 10 year planning period is $6,042,813 on average per year.
We have balanced the projected expenditures in the Strategic AM Plan with financial outlays in the Long-Term Financial Plan (LTFP) involving:
consultation on desirable and affordable levels of service
balancing service performance, risk and cost in a trade-off of projects and initiatives
considering the impact of trade-offs and accepting the service and risk consequences
What we will do
Our aim is to provide the services needed by the community in a financial sustainable manner. Achieving financial sustainability requires balancing service levels and performance with cost and risk.
It may not be possible to meet all expectations for services within current financial resources. We will continue to engage with our community to ensure that needed services are provided at appropriate levels of service at an affordable cost while managing risks.
The Next Steps
The actions resulting from this Strategic AM Plan are:
implement the improvement plan in Section 8.2
improve consultation methods to increase awareness of service performance, risk and cost pressures we are facing
investigate actions to extend the life of assets without affecting performance and risk
review asset renewal and replacement options to reduce service delivery lifecycle costs

Strategic Asset Management Plan
Page 2
2. ASSET MANAGEMENT STRATEGY
2.1 Asset Management System
Asset management enables an organisation to realise value from assets in the achievement of organisational objectives, while balancing financial, environmental and social costs, risk, quality of service and performance related to assets.1
An asset management system is a set of interrelated and interacting elements of an organisation to establish the asset management policy and asset management objectives, and the processes, needed to achieve those objectives. An asset management system is more than ‘management information system’ software. The asset management system provides a means for:
coordinating contributions from and interactions between functional units within an organisation,2 and
consistent application of the asset management processes to achieve uniform outcomes and objectives.
The asset management system includes:
The asset management policy
The asset management objectives
The Strategic AM Plan
The asset management plans, which are implemented in operational planning and control, supporting activities, control activities and other relevant processes.3
The asset management plans fit within the organisation’s strategic planning and delivery process as shown in Figure 1.
Figure 1: Strategic AM Plan fit in Planning Process
1 ISO, 2014, ISO 55000, Sec 2.2, p 2 2 ISO, 2014, ISO 55000, Sec 2.5.1, p 5 3 ISO, 2014, ISO 55002, Sec 4.1.1, p 2.

Strategic Asset Management Plan
Page 3
2.1.1 Asset Management Policy
The asset management policy sets out the principles by which the organisation intends applying asset management to achieve its organisational objectives.4 Organisational objectives are the results the organisation plans to achieve, as documented in its Strategic Plan. Our adopted asset management policy is available from our website (www.dcgrant.sa.gov.au).
2.1.2 Asset Management Objectives
The asset management objectives, developed in Section 2.4.3 provide the essential link between the organisational objectives and the asset management plan(s) that describe how those objectives are going to be achieved. The asset management objectives transform the required outcomes (product or service) to be provided by the assets, into activities typically described in the asset management plans. Asset management objectives should be specific, measureable, achievable, realistic and time bound (i.e. SMART objectives).5
2.1.3 Strategic AM Plan
This Strategic AM Plan is to document the relationship between the organisational objectives set out in Council’s Strategic Plan and the asset management (or service) objectives and define the strategic framework required to achieve the asset management objectives.6
The asset management objectives must be aligned with the organisation’s strategic objectives set out in its strategic plan.
The strategic asset management framework incorporates strategies to achieve the asset management objectives. The strategies are developed in 4 steps:
What assets do we have?
Our assets and their management
Where do we want to be?
How will we get there?7
Note: All values throughout this Strategic AM Plan are shown in current (real) dollars.
2.1.4 Asset Management Plans
The Strategic AM Plan summarises the key issues from the following asset management plans and master plans:
Buildings Asset Management Plan
CWMS Asset Management Plan
Fleet Asset Management Plan
ICT Asset Management Plan
Open Space Asset Management Plan
Stormwater Drainage Asset Management Plan
Transport Asset Management Plan
Mount Gambier Airport Master Plan
Mount Gambier & District Saleyards Master Plan
The Strategic AM Plan is part of the organisation’s strategic and annual planning and reporting cycle as shown in Table 2.1.
4 ISO, 2014, ISO 55002, Sec 5.2, p 7. 5 ISO, 2014, ISO 55002, Sec 6.2.1, p 9. 6 ISO, 2014, ISO 55002, Sec 4.1.1, p 2. 7 LGPMC, 2009, Framework 2, Sec 4.2, p 4.

Strategic Asset Management Plan
Page 4
Table 2.1: Strategic AM Plan within the Planning and Reporting Cycle
Plan Planning Cycle Performance Reporting Reporting Method
Co
mm
un
ity
Pla
nn
ing
Community Plans
4 – 10 years Community Objectives Indicators
Annual Report
Stra
tegi
c
Pla
nn
ing
4 year Strategic Plan 4 years
Organisational Objectives Annual Report
4 Year Strategic AM Plan
10 year Long-Term Financial Plan Annual Financial Indicators
Master Plans 2 years Asset Management Objectives
An
nu
al P
lan
nin
g
& B
ud
get
Annual Plan & Budget Annual Annual Objectives Budget Objectives
Annual Report Monthly Reports to Council
Departmental Work Plans Work Plan Objectives Monthly Reports to Council
Individual Work Plans Work Plan Objectives Performance Reviews
Individual AM Plans Annual Objectives & Improvement Plans
Annual Review to Council
2.2 Our Assets and their management
2.2.1 Asset Values
The infrastructure assets covered by this Strategic AM Plan are shown in Table 2.2.1. These assets are used to provide services to the community.
Table 2.2.1: Assets covered by this Plan as at 30th June 2018
Asset Plan Gross Replacement Cost Depreciated Replacement Cost Annual Depreciation
Buildings $13,530,213 $5,617,169 $394,526
CWMS $12,685,616 $7,830,238 $263,265
Fleet $6,249,359 $4,418,488 $411,306
ICT $762,966 $178,446 $48,665
Land $9,008,453 $9,008,454 $0
Minor Plant, Equipment & Other Assets $866,818 $272,667 $30,975
Open Space $5,274,984 $3,792,259 $126,018
Stormwater Drainage $1,154,532 $748,419 $11,787
Transport $92,268,900 $62,774,932 $2,249,343
Mount Gambier Airport $16,182,911 $11,875,500 $375,713
Mount Gambier Saleyards $14,338,171 $7,462,936 $327,963
TOTAL $172,322,923 $113,979,506 $4,239,561
It should be noted that “Land” and “Minor Plant, Equipment & Other Assets” are included in this section of the Strategic AM Plan only for informational purposes and to demonstrate reconciliation to Council’s asset register. “Minor Plant, Equipment & Other Assets” generally includes Council owned equipment and other structures which are over the recognition threshold, but are not considered in the context of Council’s asset management strategy. Further sections of this Strategic AM Plan will not include these assets.
It should also be noted that leased assets not maintained by Council are also excluded.

Strategic Asset Management Plan
Page 5
Figure 2 shows the gross replacement value of our assets.
Figure 2: Asset Gross Replacement Values
Section 2.3 demonstrates the significance of Council‘s investment in infrastructure. An objective for this Strategic AM Plan is to demonstrate how value is to be obtained from the $172 million investment in providing services to the community. The investment in infrastructure is being consumed at $4.3 million per annum (annual depreciation).
2.2.2 Lifecycle Costs
Lifecycle costs (or whole of life costs) are the average annual costs that are required to sustain the service levels over the longest asset life. Lifecycle costs include operations and maintenance expenditures plus asset consumption (depreciation). Life cycle costs can be compared to lifecycle expenditure to give a comparison of current expenditures to lifecycle costs of services.
Lifecycle expenditures include operations and maintenance expenditures (excluding depreciation) plus capital renewal expenditure. The capital renewal component of lifecycle expenditure can vary depending on the timing of asset renewals.
The lifecycle costs and expenditures averaged over the 10 year planning period are shown in Table 2.2.2.
Table 2.2.2: Asset Lifecycle Costs
Asset Category/Service Lifecycle Cost ($M/yr) Lifecycle Expenditure ($M/yr)
Buildings $903,916 $575,170
CWMS $711,094 $448,576
Fleet $1,700,174 $1,278,193
ICT $384,193 $335,584
Open Space $530,161 $399,268
Stormwater Drainage $48,237 $36,857
Transport $6,994,341 $4,540,899
Mount Gambier Airport $660,048 $302,946
Mount Gambier Saleyards $887,190 $585,234
TOTAL $12,819,354 $8,502,727
Total lifecycle expenditure may reasonably be higher/lower than lifecycle costs in periods of above/below average asset renewal/replacement activity. The lifecycle indicator is a measure of estimated need over the long-term. It is dependent on the age profile of the assets, with older assets expected to have a higher LC indicator and newer assets a lower LC indicator. Section 5.4 gives a more accurate indicator of renewal/replacement funding needs over the period of the Strategic AM Plan.

Strategic Asset Management Plan
Page 6
2.2.3 Asset Management Indicators
An asset management objective is to provide the services that the community needs at the optimum lifecycle cost in a financially sustainable manner. Figure 3 shows the projected operations, maintenance, capital renewal, capital upgrade/new expenditure balanced with financial outlays in the 10 year long-term financial plan. Some activities and/or projects have been deferred to subsequent years to allow further consideration of service level needs and financing options.
Figure 3: Projected Operating and Capital Expenditure
The purpose of this Strategic AM Plan is to develop the strategies to achieve the asset management objectives through balancing of asset service performance, cost and risk.
2.2.4 Asset and Financial Management Maturity
We have taken steps to improve our asset and financial management performance including assessing our asset management maturity against the 3 Frameworks of the Local Government Financial Sustainability Nationally Consistent Frameworks. Our target is to achieve ‘core’ maturity with the Frameworks. Figure 4 shows the current and target ‘core’ and ‘advanced’ maturity scores for the eleven elements of the National Frameworks for asset and financial management.
Figure 4: Maturity Assessment
Improvement in ‘core’ maturity is indicated by movement of the blue (current maturity) line to the red (‘core’ maturity) and green line (desired or aspirational target maturity).

Strategic Asset Management Plan
Page 7
Elements with low maturity scores are:
Evaluation (2)
Skills and Processes (3.5)
Levels of Service (3.8)
Asset Management Plans (3.8) The risk to the organisation from the current maturity is shown in Figure 5.
Figure 5: Maturity Risk Assessment
Reduction in risk from current NAF maturity is indicated by movement of the red (current risk) line to the green line (desired or aspirational target risk).
Elements with high maturity risk to the organisation are:
Skills and Process
Strategic Longer Term Plan
Annual Budget
Asset Management Policy
Tasks to improve asset and financial management maturity are prioritised and included within the Improvement Plan shown in Section 8.2.
2.2.5 Strategy Outlook
1. We are able to maintain current levels of service for the next ten years based on current knowledge and projections in AM Plans and Long-Term Financial Plan.
2. Funding of current infrastructure lifecycle costs is considered adequate for the next 10 years but below long term needs. Review of services, service levels and costs will need to be carried out over the next 10 years to identify and monitor changes in demand for services and affordability over the longer-term.
3. Our current asset and financial management maturity is below ‘core’ level and investment is needed to improve information management, lifecycle management, service management and accountability and strategic direction.
Governance & Management
Levels of Service
Strategic Asset Management Plan
Page 8
2.3 Where do we want to be?
2.3.1 Strategic Goals
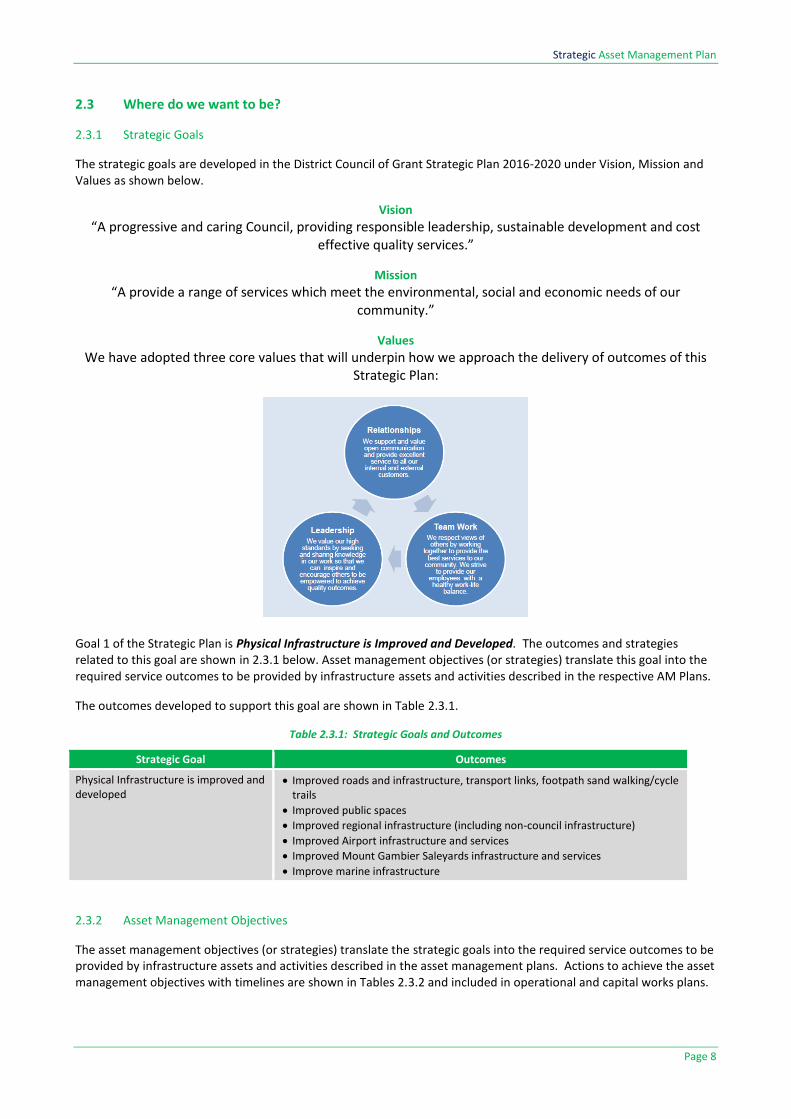
The strategic goals are developed in the District Council of Grant Strategic Plan 2016-2020 under Vision, Mission and Values as shown below.
Vision
“A progressive and caring Council, providing responsible leadership, sustainable development and cost effective quality services.”
Mission
“A provide a range of services which meet the environmental, social and economic needs of our community.”
Values
We have adopted three core values that will underpin how we approach the delivery of outcomes of this Strategic Plan:
Goal 1 of the Strategic Plan is Physical Infrastructure is Improved and Developed. The outcomes and strategies related to this goal are shown in 2.3.1 below. Asset management objectives (or strategies) translate this goal into the required service outcomes to be provided by infrastructure assets and activities described in the respective AM Plans.
The outcomes developed to support this goal are shown in Table 2.3.1.
Table 2.3.1: Strategic Goals and Outcomes
Strategic Goal Outcomes
Physical Infrastructure is improved and developed
Improved roads and infrastructure, transport links, footpath sand walking/cycle trails
Improved public spaces
Improved regional infrastructure (including non-council infrastructure)
Improved Airport infrastructure and services
Improved Mount Gambier Saleyards infrastructure and services
Improve marine infrastructure
2.3.2 Asset Management Objectives
The asset management objectives (or strategies) translate the strategic goals into the required service outcomes to be provided by infrastructure assets and activities described in the asset management plans. Actions to achieve the asset management objectives with timelines are shown in Tables 2.3.2 and included in operational and capital works plans.

Strategic Asset Management Plan
Page 9
Table 2.3.2: Asset Management Objectives
Objective Strategies Status
Improved roads and infrastructure, transport links, footpath sand walking/cycle trails
Develop, review and implement the Transport Asset Management Plan
Plan has been developed and will be reviewed annually.
Develop, review, and implement the Building Asset Management Plan
Plan has been developed and will be reviewed annually.
Develop, review, and implement the Fleet Asset Management Plan
Plan has been developed and will be reviewed annually.
Develop, review and implement the Stormwater Asset Management Plan
Plan has been developed and will be reviewed annually.
Assessment and maintenance of Council infrastructure, including land, and disposal of surplus infrastructure
Assets are condition assessed and maintained on an ongoing basis. Surplus assets, such as land and road reserves, are disposed when the opportunity arises.
Develop a signage strategy (including style guide for future signage), particularly in relation to tourism
Signage strategies for Port MacDonnell and Tourism have been developed.
Pursue funding partnerships for infrastructure improvements and opportunities
Funding opportunities are pursued to improve infrastructure through programs such as Special Local Roads, Blackspot Program and State Bicycle Fund.
Improved public spaces
Implement the Port MacDonnell Master Plan Projects identified in plan have been scheduled in the 20 year capital works program. Projects completed to date include redevelopment of the foreshore (The Waterfront).
Implement the River & Coast Master Plan Projects identified in plan have been scheduled in the 20 year capital works program. Projects completed to date include Donovans landing and township signage (continuing in 2019).
Implement the Tarpeena Community Plan A number of actions from the 2013 plan have been addressed and closed and the plan is currently under review.
Develop, review, and implement an Open Space Asset Management Plan.
Plan has been developed and will be reviewed annually.
Improved regional infrastructure (including non-council infrastructure)
Assist in the development of a Regional Infrastructure Plan (including non-council infrastructure) in collaboration with regional and State Government partners
Regional Infrastructure Audit has been completed by SED Advisory on behalf of RDA (Limestone Coast). A list of top 10 regional projects was developed following a prioritisation process.
Assist in the development, review and implementation of the Green Triangle Freight Action Plan
An update to the action plan is being undertaken by the Green Triangle Region Freight Action Plan Implementation Monitoring Group.
Improved Airport infrastructure and services
Develop, review, and implement the Mount Gambier Airport Master Plan & Asset Management Plan
Plan has been developed and the first review will be undertaken once the major redevelopment has been completed.
Assess, plan and advocate for growth and expansion of passenger services
A community fare agreement has been negotiated and signed with Rex. Opportunities for growth will be identified and assessed on an ongoing basis.
Assess, plan, and advocate for aviation related business or industry development at and from the Airport
Gambi Air Flying School has been established in a newly renovated hangar purchased by Council. Opportunities for development will be identified and assessed on an ongoing basis.
Pursue funding partnerships for Airport infrastructure improvements and opportunities
A number of funding partnerships have been recently established including Regional Airport Initiative Fund (taxiway repairs) and Building Better Regions Fund (Federal), DPTI (State) and City of Mount Gambier (major redevelopment including extension of runway, construction of apron and upgrade of terminal).

Strategic Asset Management Plan
Page 10
Objective Strategies Status
Improved Mount Gambier Saleyards infrastructure and services
Develop, review, and implement the Mount Gambier Saleyards Master Plan & Asset Management Plan
Plan has been developed and the first review is due to be undertaken in 2020.
Develop, review, and implement a marketing plan for retention and attraction of business to the Saleyards
Website has been redeveloped and increased utilisation of Facebook to connect with the public. Marketing plan still to be developed.
Pursue funding partnerships for saleyards infrastructure improvements and opportunities
Funding opportunities are pursued on an ongoing basis.
Improve marine infrastructure
Maintain and improve Port MacDonnell Marine Infrastructure
Major upgrade undertaken in 2014 and is maintained as required.
Maintain and improve Blackfellows Caves Marine Infrastructure
Major upgrade undertaken in 2014 and is maintained as required.
Develop, review and implement plans for marine infrastructure at Carpenter Rocks
Council continues to work with local stakeholders to identify solutions for launching of boats.
Develop, review, and implement plans for boating facilities on the Glenelg River within our Council area
Donovans landing was upgraded in 2017. Council has recently applied for funding to upgrade boat ramps at Donovans and Dry Creek (outcome unknown at time of writing this plan).
2.4 Asset Management Vision
To ensure the long-term financial sustainability of the organisation, it is essential to balance the community’s expectations for services with their ability to pay for the infrastructure assets used to provide the services. Maintenance of service levels for infrastructure services requires appropriate investment over the whole of the asset life cycle. To assist in achieving this balance, we aspire to:
Develop and maintain asset management governance, skills, process, systems and data in order to provide the level of service the community need at present and in the future, in the most cost-effective and fit for purpose manner.
In line with the vision, the objectives of the Strategic AM Plan are to:
ensure that our infrastructure services are provided in an economically optimal way, with the appropriate level of service to residents, visitors and the environment determined by reference to our financial sustainability
safeguard our assets including physical assets and employees by implementing appropriate asset management strategies and appropriate financial resources for those assets
adopt the long term financial plan as the basis for all service and budget funding decisions
meet legislative requirements for all our operations
ensure resources and operational capabilities are identified and responsibility for asset management is allocated
ensure operational and service delivery risks are adequately managed
continually improve our asset, risk and financial management and service delivery performance
provide high level oversight of financial and asset management responsibilities through Audit Committee/CEO reporting to Council on development and implementation of the Strategic AM Plan, Asset Management Plan(s) and Long Term Financial Plan.
Strategies to achieve this position are outlined in Section 2.5.
2.5 How will we get there?
The Strategic AM Plan proposes strategies to enable the organisational objectives and asset management policies to be achieved.

Strategic Asset Management Plan
Page 11
Table 2.5: Asset Management Strategies
No Strategy Desired Outcome Status
1 Incorporate Year 1 of long term financial plan revenue and expenditure projections into annual budgets.
Long term financial planning drives budget deliberations and the long term implications of all services are considered in annual budget deliberations.
Implemented
2 Report our financial position at Fair Value in accordance with Australian Accounting Standards, financial sustainability and performance against organisational objectives in Annual Reports.
Financial sustainability information is available for Council and the community.
Implemented
3 Develop and maintain a long term financial plan covering 10 years incorporating asset management plan expenditure projections with a sustainable funding position outcome.
Sustainable funding model to provide our services. Implemented
4 Develop and periodically review asset management plans and Strategic AM Plan covering at least 10 years for all major asset classes (80% of asset value).
Identification of services needed by the community and required funding to optimise ‘whole of life’ costs.
Implemented
5 Review and update asset management plans, Strategic AM Plan and long term financial plans after adoption of annual budgets. Communicate any consequence of funding decisions on service levels and service risks.
We and the community are aware of changes to service levels and costs arising from budget decisions.
Implemented
6 Develop and maintain a risk register of operational and service delivery risks showing current risk levels, risk management treatments and report regularly to Council on current high level risks.
Risk management of operational and service delivery risks is an integral part of governance.
Implemented
7 Ensure Council decisions are made from accurate and current information in asset registers, on service level performance and costs and ’whole of life’ costs.
Improved decision making and greater value for money.
Implemented
8 Report on our resources and operational capability to deliver the services needed by the community in the annual report.
Services delivery is matched to available resources and operational capabilities.
Implemented
9 Ensure responsibilities for asset management are identified and incorporated into staff position descriptions.
Responsibility for asset management is defined. Implemented
10 Implement an improvement plan to realise ‘core’ maturity for the financial and asset management competencies within 2 years.
Improved financial and asset management capacity within the organisation.
Commenced
11 Report six monthly to Council by Audit Committee/CEO on development and implementation of Strategic AM Plan, AM Plans and long term financial plans.
Oversight of resource allocation and performance. To Be Implemented
2.6 Asset Management Improvement Plan
The tasks required achieving a ‘core’ financial and asset management maturity are shown in priority order in the asset management improvement plan in Section 7.2

Strategic Asset Management Plan
Page 12
2.7 Consequences if actions are not completed
There are consequences for the Council if the improvement actions are not completed. These include:
Inability to achieve strategic and organisational objectives
Inability to achieve financial sustainability for the organisation’s operations
Current risks to infrastructure service delivery are likely to eventuate and response actions may not be appropriately managed
We may not be able to accommodate and/or manage changes in demand for infrastructure services.

Strategic Asset Management Plan
Page 13
3. LEVELS OF SERVICE
3.1 Customer Research and Expectations
Council currently has no research on customer expectations. This will be investigated for future updates of this Strategic AM Plan.
3.2 Organisational Objectives
Sections 2.3.1 and 2.3.2 of this Strategic AM Plan reported the organisational objectives from the Strategic Plan and asset management objectives developed from the organisational objectives.
The organisational and asset management objectives provide focus for the levels of service defined in Section 3.3.
3.3 Service Level Objectives
Service levels are defined in two terms, community levels of service and technical levels of service. These are supplemented by organisational measures.
It is important to monitor the service levels provided regularly as these will change. The current performance is influences by work efficiencies and technology, and customer priorities will change over time. Review and establishment of the agreed position which achieves the best balance between service, risk and cost is essential.
3.3.1 Community Levels of Service
Community levels of service measure how the community receives the service and whether the organisation is providing community value.
Community levels of service measures used in the asset management plan are:
Quality/Condition How good is the service….what is the condition or quality of the service?
Function/Safety Does it meet users’ needs…..is it suitable for its intended purpose?
Capacity/Utilisation Is the service usage appropriate to capacity…..is it over or under used?
Our current and projected community levels of service for the services covered by this Strategic AM Plan are shown in the respective AM Plans.
3.3.2 Technical Levels of Service
Supporting the community service levels are operational or technical measures of performance. These technical measures relate to the allocation of resources to service activities that the organisation undertakes to best achieve the desired community outcomes and demonstrate effective organisational performance.
Technical service measures are linked to annual budgets covering:
Operation The regular activities to provide services such as availability, cleansing, mowing, etc.
Maintenance The activities necessary to retain an asset as near as practicable to an appropriate service condition (e.g. road patching, unsealed road grading, building and structure repairs),
Renewal The activities that return the service capability of an asset similar to that which it had originally (e.g. road resurfacing and pavement reconstruction, pipeline replacement and building component replacement) or to a lower service level,
Upgrade/New The activities to provide a higher level of service (e.g. widening a road, sealing an unsealed road, replacing a pipeline with a larger size) or a new service that did not exist previously (e.g. a new library).

Strategic Asset Management Plan
Page 14
Service managers plan, implement and control technical service levels to influence the customer service levels.8
Our current and projected technical levels of service for the services covered by this Strategic AM Plan are shown in the respective AM Plans.
3.3.3 Maintenance Response Levels of Service
Council has developed maintenance response levels of service for each asset category which set out the intervention levels and response times which will be observed for each maintenance activity, based on the hierarchy of the asset.
Our current maintenance response levels of service for the services covered by this Strategic AM Plan are shown in the respective AM Plans.
3.4 Asset Hierarchy
No Authority can deliver everything, all the time. In fact, in line with good practice and affordable service delivery, it may not be practical or cost-effective to deliver the same level of service across the entire asset portfolio. Therefore Council has documented an asset hierarchy for certain asset classes that classifies the asset network into appropriate groups based on the appropriate levels of service.
In accordance with the International Infrastructure Management Manual, Council acknowledges that the primary purpose of an asset hierarchy is to ensure that appropriate management, engineering standards and planning practices are applied to the asset based on its function. It also enables more efficient use of limited resources by allocating funding to those assets that are in greater need and the costs are better justified.
Without an adequate asset hierarchy, there may be inefficient allocation of resources, user expectations may vary and the scheduling of works and priorities made more difficult.
Our current asset hierarchy classifications for the services covered by this Strategic AM Plan are shown in the respective AM Plans (where considered necessary).
3.5 Legislative Requirements
We have to meet many legislative requirements including Australian and State legislation and State regulations. These are detailed in the various asset management plans summarised in this Strategic AM Plan.
Table 3.5: Legislative Requirements
Legislation Requirement
Asset Category/Service
Bu
ildin
gs
CW
MS
Fle
et
ICT
Op
en
Sp
ace
Sto
rmw
ater
Tran
spo
rt
Air
po
rt
Sale
yard
s
Local Government Act 1999
Local Government (General) Regulations 2013
Local Government (Financial Management) Regulations 2011
Sets out role, purpose, responsibilities and powers of local governments including the preparation of a long term financial plan supported by asset management plans for sustainable service delivery.
✓ ✓ ✓ ✓ ✓ ✓ ✓ ✓ ✓
Local Government (Financial Management and Rating) Amendment Act 2005
Impetus for the development of a Strategic Management Plan, comprising an (Infrastructure) Asset Management Plan and Long-term Financial Plan.
✓ ✓ ✓ ✓ ✓ ✓ ✓ ✓ ✓
National Asset Management Framework Legislation 2010
Focuses on long term financial sustainability and provides a mandate to have long term strategy, financial statements and annual reporting mechanisms.
✓ ✓ ✓ ✓ ✓ ✓ ✓ ✓ ✓
8 IPWEA, 2011, IIMM, p 2.22

Strategic Asset Management Plan
Page 15
Legislation Requirement
Asset Category/Service
Bu
ildin
gs
CW
MS
Fle
et
ICT
Op
en
Sp
ace
Sto
rmw
ater
Tran
spo
rt
Air
po
rt
Sale
yard
s
Work Health and Safety Act 2012
Work Health and Safety Regulations 2012
An Act to provide for the health, safety and welfare of persons at work.
✓ ✓ ✓ ✓ ✓ ✓ ✓ ✓ ✓
Planning, Development and Infrastructure Act 2016
Provides for planning and regulate development in the State; to regulate the use and management of land and buildings, and the design and construction of buildings; to make provision for the maintenance and conservation of land and buildings where appropriate.
✓ ✓ ✓ ✓ ✓ ✓ ✓ ✓ ✓
Australian Accounting Standards Set out the financial reporting standards relating to the (re)valuation and depreciation of Assets. ✓ ✓ ✓ ✓ ✓ ✓ ✓ ✓ ✓
Agricultural and Veterinary Products (Control
of Use) Act 2002
An Act relating to agricultural chemical products, fertilisers and
veterinary products and for other purposes. In particular, Use or
possession of unregistered agricultural chemical product,
Treatment of trade species animal by injection and Treatment of
trade species animals in unauthorised manner.
✓
Animal Welfare Act 1985
Animal Welfare Regulations 2012
An Act for the promotion of animal welfare; and for other
purposes.
✓
Aviation Transport Security Act 2004
Aviation Transport Security Regulations 2005
Establishes a regulatory framework to safeguard against unlawful
interference with aviation. ✓
Civil Aviation Act 1988
Civil Aviation Regulations 1988
Establishes a regulatory framework for maintaining, enhancing
and promoting the safety of civil aviation, with particular
emphasis on preventing aviation accidents and incidents.
✓
Civil Liability Act 1936 Liability of road authorities – Section 42, May 2004 inclusion in the Act to provide a replacement for the nonfeasance defence consequent to May 2001 High Court judgement.
✓
Controlled Substances Act 1984 Defines who is allowed to administer drugs and regulates or
prohibits the manufacture, production, sale, supply, possession,
handling or use of certain poisons, drugs, therapeutic and other
substances, and of certain therapeutic devices.
✓
Disability Discrimination Act 1992 The objectives of this act are to eliminate, as afar as possible, discrimination against persons on the grounds of disability. It sets out the standard for accessibility.
✓ ✓ ✓ ✓ ✓
Food Act 2001 The objectives of this Act are to ensure food for sale is both safe and suitable for human consumption; to prevent misleading conduct in connection with the sale of food and to provide for the application in this State of the Food Standards Code.
✓
✓
Highways Act 1926 Provides for the appointment of a Commissioner of Highways, and to make further and better provision for the construction and maintenance of roads and works.
✓
Livestock Act 1997
Livestock Regulations 2013
Regulates matters relating to livestock.
✓
Motor Vehicle Standards Act 1989 (Australian Design Rules)
The Australian Design Rules (ADRs) are national standards for vehicle safety, anti-theft and emissions.
✓
Roads (Opening and Closing) Act 1991 An Act to provide for the opening and closing of roads. ✓
Road Traffic Act 1961 Provides for vehicle standards, mass and loading requirements and other safety measures in relation to light vehicles.
✓
✓
South Australian Public Health Act 2011
An Act to promote and to provide for the protection of the health of the public of South Australia and to reduce the incidence of preventable illness, injury and disability.
✓ ✓
Valuation of Land Regulations 2005 Provides for the regulations of valuing land under roads. ✓

Strategic Asset Management Plan
Page 16
Legislation Requirement
Asset Category/Service
Bu
ildin
gs
CW
MS
Fle
et
ICT
Op
en
Sp
ace
Sto
rmw
ater
Tran
spo
rt
Air
po
rt
Sale
yard
s
Veterinary Practices Act 2003
Veterinary Practice Regulations 2017
Defines who can perform various husbandry practices and
procedures.
✓
Water Industry Act 2012 An Act to facilitate planning in connection with water demand and supply; to regulate the water industry, including by providing for the establishment of a licensing regime and providing for the regulation of prices, customer service standards, technical standards for water and sewerage infrastructure and installations and plumbing, and by providing performance monitoring of the water industry; to provide for other measures relevant to the use and management of water; and for other purposes.
✓
Water Retail Code – Minor and Intermediate Retailers
Issued by Essential Services Commission of South Australia (ESCOSA), the Water Retail Code for Minor and Intermediate Retailers is the principal consumer protection document setting out the behavioural standards and minimum requirements to be complied with by minor and intermediate retailers when dealing with their customers.
✓
It should be noted that the above list of legislative requirements may not be exhaustive and additional legislation, codes of practices and standards may also apply to asset management.

Strategic Asset Management Plan
Page 17
4. FUTURE DEMAND
4.1 Demand Drivers and Impact on Services
Drivers affecting demand include population change, changes in demographics, seasonal factors, climate change, vehicle ownership rates, consumer preferences and expectations, government decisions, technological changes, economic factors, agricultural practices, environmental awareness, etc.
The present position and projections for population and demographics are documented in Table 4.1, with demand drivers which affect specific asset types detailed in the respective AM Plans. The impact these demand drivers may have on future service delivery and utilisation of assets is also documented.
Table 4.1: Demand Drivers Present Position and Projections
Demand
drivers
Present position Projection
Population
8,203 (based on 2016 Census data) 8,483 (based on 2017 Estimate)
The 2017 population for the District Council of Grant Local Government Area was estimated at 8,483 people. This is an Estimated Residential Population (ERP) projection, which is made by the Australian Bureau of Statistics (ABS) and subject to review after the next Census in 2021. The ERP is based on the usual residence population and includes adjustments for Census undercount and any Australian residents who were temporarily overseas on Census night.
Year NumberChange in
number
Change in
percent
2016 8,417.0 165.0 2.00%
2017 8,483.0 66.0 0.78%
2018 8,555.5 72.5 0.85%
2019 8,628.0 72.5 0.85%
2020 8,700.5 72.5 0.84%
2021 8,773.0 72.5 0.83%
2022 8,845.5 72.5 0.83%
2023 8,918.0 72.5 0.82%
2024 8,990.5 72.5 0.81%
2025 9,063.0 72.5 0.81%
2026 9,135.5 72.5 0.80%
2027 9,208.0 72.5 0.79%
2028 9,280.5 72.5 0.79%
Average 8,846.0 79.1 0.91%
District Council of Grant – Projected population
increase 2018-2028
The 2016 Census indicated that the usual residence population for the District Council of Grant was 8,203 people. Based on the data from the 2016 Census, as outlined in Figure 1, the District Council of Grant has experienced an average population growth of 72.5 people per year 2006-2017. Using this number as a baseline and considering population growth has been relatively steady since 2006, Council have forecast population growth over the next ten years as a guide to estimated growth. It should be noted that the forecast provided in this document does not take into account the various drivers of population growth such as housing supply, employment and migration patterns and is a projection of raw population data only.
Demographics The median age of people in District Council of Grant area was 44 years. Children aged 0 - 14 years made up 18.7% of the population and people aged 65 years and over made up 16.2% of the population (based on 2016 Census data).
Age Population %
0-4 417 5.1%
5-14 1,119 13.6%
15-19 511 6.2%
20-24 331 4.0%
25-34 767 9.4%
35-44 1,087 13.3%
45-54 1,398 17.0%
55-64 1,247 15.2%
65-74 892 10.9%
75-84 323 3.9%
85 + 111 1.4%
Total 8,203 100%
People aged 65 years and over increased from 840 in 2011 to 1,326 in 2016. This increase of 63.3% is indicative of an ageing population which may impact on Councils provision of services.

Strategic Asset Management Plan
Page 18
4.2 Demand Management Plan
Demand for new services will be managed through a combination of managing existing assets, upgrading of existing assets and providing new assets to meet demand and demand management. Demand management practices include non-asset solutions, insuring against risks and managing failures.
Non-asset solutions focus on providing the required service without the need for the organisation to own the assets and management actions including reducing demand for the service, reducing the level of service (allowing some assets to deteriorate beyond current service levels) or educating customers to accept appropriate asset failures9. Examples of non-asset solutions include providing joint services from existing infrastructure such as aquatic centres and libraries that may be in another community area or public toilets provided in commercial premises.
Opportunities identified for demand management are shown in the respective AM Plans.
4.3 Asset Programs to meet Demand
The new assets required to meet growth will be acquired free of cost from land developments and constructed by Council. Acquiring and constructing these new assets will commit Council to fund ongoing operations, maintenance and renewal costs for the period that the service provided from the assets is required. New assets and future costs are identified and considered in developing forecasts of future operations, maintenance and renewal costs.
Details of any new assets required to meet growth are shown in the respective AM Plans.
9 IPWEA, 2015, IIMM, Sec 2.3.6, p 2|53.

Strategic Asset Management Plan
Page 19
5. LIFECYCLE MANAGEMENT PLAN
The lifecycle management plan details how the organisation plans to manage and operate the assets at the agreed levels of service (defined in Section 3) while optimising life cycle costs and managing risks.
5.1 Background Data
5.1.1 Physical parameters
The assets covered by this Strategic AM Plan are shown in Table 2.2.1.
5.1.2 Asset age profile
A profile of asset age can be found in the respective AM Plans.
5.1.3 Asset capacity and performance
Assets are generally provided to meet design standards where these are available.
Locations where deficiencies in service performance are known are detailed in the respective AM Plans.
5.1.4 Asset condition
Asset condition is generally measured on a 0 – 6 grading system as detailed in Table 5.1.4.
Table 5.1.4: Simple Condition Grading Model
Condition Grading Description of Condition
0 Brand New: brand new condition
1 Very Good: only planned maintenance required
2 Good: minor maintenance required plus planned maintenance
3 Fair: significant maintenance required
4 Poor: significant renewal/rehabilitation required
5 Very Poor: physically unsound and/or beyond rehabilitation
An asset specific condition assessment manual can be found in the respective AM Plans.
A profile of asset condition can be found in the respective AM Plans.
5.2 Operations and Maintenance Plan
5.2.1 Operations and Maintenance Plan
Operations activities affect service levels including quality and function, such as cleanliness, appearance, etc., through street sweeping and grass mowing frequency, intensity and spacing of street lights and cleaning frequency and opening hours of building and other facilities.
Maintenance includes all actions necessary for retaining an asset as near as practicable to an appropriate service condition including regular ongoing day-to-day work necessary to keep assets operating, e.g. road patching but excluding rehabilitation or renewal.
Maintenance expenditure levels are considered to be adequate to meet projected service levels, which may be less than or equal to current service levels. Where maintenance expenditure levels are such that will result in a lesser level of service, the service consequences and service risks have been identified and service consequences highlighted in the respective AM Plan and service risks considered in the Risk Management Plan.

Strategic Asset Management Plan
Page 20
5.2.2 Operations and Maintenance Strategies
We will operate and maintain assets to provide the defined level of service to approved budgets in the most cost-efficient manner. The operations and maintenance activities include:
Scheduling operations activities to deliver the defined level of service in the most efficient manner
Undertaking maintenance activities through a planned maintenance system to reduce maintenance costs and improve maintenance outcomes. Undertake cost-benefit analysis to determine the most cost-effective split between planned and unplanned maintenance activities (50 – 70% planned desirable as measured by cost)
Maintain a current infrastructure risk register for assets and present service risks associated with providing services from infrastructure assets and reporting Very High and High risks and residual risks after treatment to management and Council
Review current and required skills base and implement workforce training and development to meet required operations and maintenance needs
Review asset utilisation to identify underutilised assets and appropriate remedies, and over utilised assets and customer demand management options
Maintain a current hierarchy of critical assets and required operations and maintenance activities
Develop and regularly review appropriate emergency response capability
Review management of operations and maintenance activities to ensure we are obtaining best value for resources used.
Operations and maintenance expenditure trends are shown in Table 5.2.2 below.
Table 5.2.2: Operations and Maintenance Expenditure Trends
Service Operations Maintenance
2018 Actual 2019 Budget 2020 Estimate 2018 Actual 2019 Budget 2020 Estimate
Buildings $108,009 $85,080 $87,037 $314,763 $369,470 $377,967
CWMS $263,983 $259,250 $263,917 $107,209 $105,286 $107,181
Fleet $339,168 $347,058 $355,040 $328,920 $296,489 $303,308 ICT $148,339 $220,575 $225,648 Included in Operations
Open Space $12,869 $14,320 $14,650 $308,040 $345,345 $353,288
Stormwater Drainage $0 $0 $0 $23,328 $33,201 $33,965 Transport $0 $0 $0 $1,876,817 $2,231,670 $2,282,998
Airport $86,099 $73,627 $75,321 $91,375 $83,204 $85,118
Saleyards $98,401 $87,206 $89,212 $219,969 $259,841 $265,818 TOTAL $1,056,868 $1,087,116 $1,110,825 $3,270,421 $3,724,506 $3,809,643
5.2.3 Summary of future operations and maintenance expenditures
Future operations and maintenance expenditure is forecast to trend in line with the value of the asset stock as shown in Figure 6. The forecast expenditures (shown in Appendix A) have been accommodated in the organisation’s long-term financial plan.
Figure 7: Projected Operations and Maintenance Expenditure and LTFP Outlays

Strategic Asset Management Plan
Page 21
The consequences of deferred maintenance, i.e. works that are identified for maintenance and unable to be funded are to be included in the risk assessment and analysis in the Risk Management Plan.
5.3 Renewal Plan
Renewal expenditure is major work which does not increase the asset’s design capacity but restores, rehabilitates, replaces or renews an existing asset to its original or lesser required service potential. Work over and above restoring an asset to original service potential is upgrade/expansion or new works expenditure.
5.3.1 Renewal Strategies
We will plan capital renewal projects to meet level of service objectives and minimise infrastructure service risks by:
Planning and scheduling renewal projects to deliver the defined level of service in the most efficient manner
Undertaking project scoping for all capital renewal projects to identify o the service delivery ‘deficiency’, present risk and optimum time for renewal/replacement o the project objectives to rectify the deficiency o the range of options, estimated capital and life cycle costs for each options that could address the
service deficiency o and evaluate the options against evaluation criteria adopted by Council, and o select the best option to be included in capital renewal programs,
Using optimal renewal methods (cost of renewal is less than replacement) wherever possible
Maintain a current infrastructure risk register for assets and service risks associated with providing services from infrastructure assets and report Very High and High risks and Residual risks after treatment to management, Audit Committee and Council
Review current and required skills base and implement workforce training and development to meet required construction and renewal needs
Maintain a current hierarchy of critical assets and capital renewal treatments and timings required
Review management of capital renewal activities to ensure we are obtaining best value for resources used. 5.3.2 Selection criteria
Asset renewal is typically undertaken to either:
Ensure the reliability of the existing infrastructure to deliver the service it was constructed to facilitate (e.g. replace a bridge that has a 5 t load limit), or
To ensure the infrastructure is of sufficient quality to meet the service requirements (e.g. roughness of a road). Capital renewal priorities are indicated by identifying assets or asset groups that:
Have a high consequence of failure
Have a high utilisation and loss of service would have a significant impact on users
Have the highest average age relative to their expected lives
Are identified in the AM Plan as key cost factors
Have high operational or maintenance costs, and
Where replacement with modern equivalent assets would yield material savings. The ranking criteria used to determine priority of identified renewal and replacement proposals is detailed in the respective AM Plans.
5.3.3 Summary of future renewal expenditure
Projected future renewal expenditures are forecast to increase over time as the asset stock ages. The forecast expenditures have been accommodated in the organisation’s long-term financial plan as shown in Figure 7. The projected renewal capital works program is shown in Appendix B.

Strategic Asset Management Plan
Page 22
Figure 7: Projected Capital Renewal and Replacement Expenditure and LTFP Outlays
5.4 New/Upgrade Plan
New works are those works that create a new asset that did not previously exist, or works which upgrade or improve an existing asset beyond its existing capacity. They may result from growth, social or environmental needs. Assets may also be acquired at no cost to Council from land development. These assets from growth are discussed in Section 4.5.
5.4.1 Capital Investment Strategies
We will plan capital new and upgrade projects to meet level of service objectives by:
Planning and scheduling capital upgrade and new projects to deliver the defined level of service in the most efficient manner
Undertake project scoping for all capital new/upgrade projects to identify o the service delivery ‘deficiency’, present risk and required timeline for delivery of the new/upgrade
asset o the project objectives to rectify the deficiency including value management for major projects o the range of options, estimated capital and life cycle costs for each option that could address the
service deficiency o management of risks associated with alternative options o and evaluate the options against evaluation criteria adopted by Council, and o select the best option to be included in capital new/upgrade programs
Review current and required skills base and implement training and development to meet required construction and project management needs
Review management of capital project management activities to ensure we are obtaining best value for resources used.
Optimal use of grant funding ie. Special Local Roads Program, Black Spot Program and other State and Commonwealth funding programs.
Standards and specifications for maintenance of existing assets and construction of new assets and upgrade/expansion of existing assets are detailed in relevant asset management plans.

Strategic Asset Management Plan
Page 23
5.4.2 Selection criteria
New assets and upgrade of existing assets are identified from various sources such as elected member or community requests, proposals identified by strategic plans or partnerships with other organisations. Candidate proposals are inspected to verify need and to develop a preliminary renewal estimate. Verified proposals are ranked by priority and available funds and scheduled in future works programmes. The priority ranking criteria is detailed in the respective AM Plans.
5.4.3 Summary of future new/upgrade assets expenditure
Projected new/upgrade asset expenditures and estimated long-term financial plan outlays are summarised in Figure 8. The forecast expenditures have been accommodated in the organisation’s long-term financial plan. The projected upgrade/new capital works program is shown in Appendix C.
Figure 8: Projected Capital Upgrade/New Asset Expenditure and Budget
* Note increased capital upgrade expenditure for Airport from 2019-2021 due to $9.2 million redevelopment
5.5 Disposal Plan
Disposal includes any activity associated with the disposal of a decommissioned asset including sale, demolition or relocation. Assets identified for possible decommissioning and disposal are shown in Table 5.5, together with estimated annual savings from not having to fund operations and maintenance of the assets. These assets will be further reinvestigated to determine the required levels of service and see what options are available for alternate service delivery, if any. Any costs or revenue gained from asset disposals is accommodated in the long term financial plan.
Table 5.5: Assets Identified for Disposal
Asset Category/Service Reason for
Disposal Timing Disposal Expenditure
Operations &
Maintenance Annual
Savings
No planned disposals (other than trade-in of Fleet
assets)
- - $0 $0

Strategic Asset Management Plan
Page 24
6. FINANCIAL SUMMARY
This section contains the financial requirements resulting from all the information presented in the previous sections of this Strategic AM Plan. The financial projections will be improved as further information becomes available on desired levels of service and current and projected future asset performance.
6.1 Asset Renewal Funding Ratio
The Asset Renewal Funding Ratio indicates whether projected capital renewal and replacement expenditure are able to be financed in the long-term financial plan. It is calculated by dividing the projected capital renewal expenditure shown in the AM Plans by the estimated capital renewal budget provided in the long-term financial plan. Over the next 10 years, we are forecasting that we will have 100% of the funds required for the optimal renewal and replacement of assets due to AM Plans being fully funded.
Further detailed information is available from Council’s Long Term Financial Plan.
6.2 Funding Strategy
The funding strategy to provide the services covered by this Strategic AM Plan and supporting asset management plans is contained within the organisation’s 10 year long term financial plan.
6.3 Valuation Forecasts
Asset values are forecast to increase as additional assets are added to the asset stock from construction and acquisition by the organisation and from assets constructed by land developers and others and donated to the organisation. Figure 9 shows the projected replacement cost asset values over the planning period.
Figure 9: Projected Asset Values
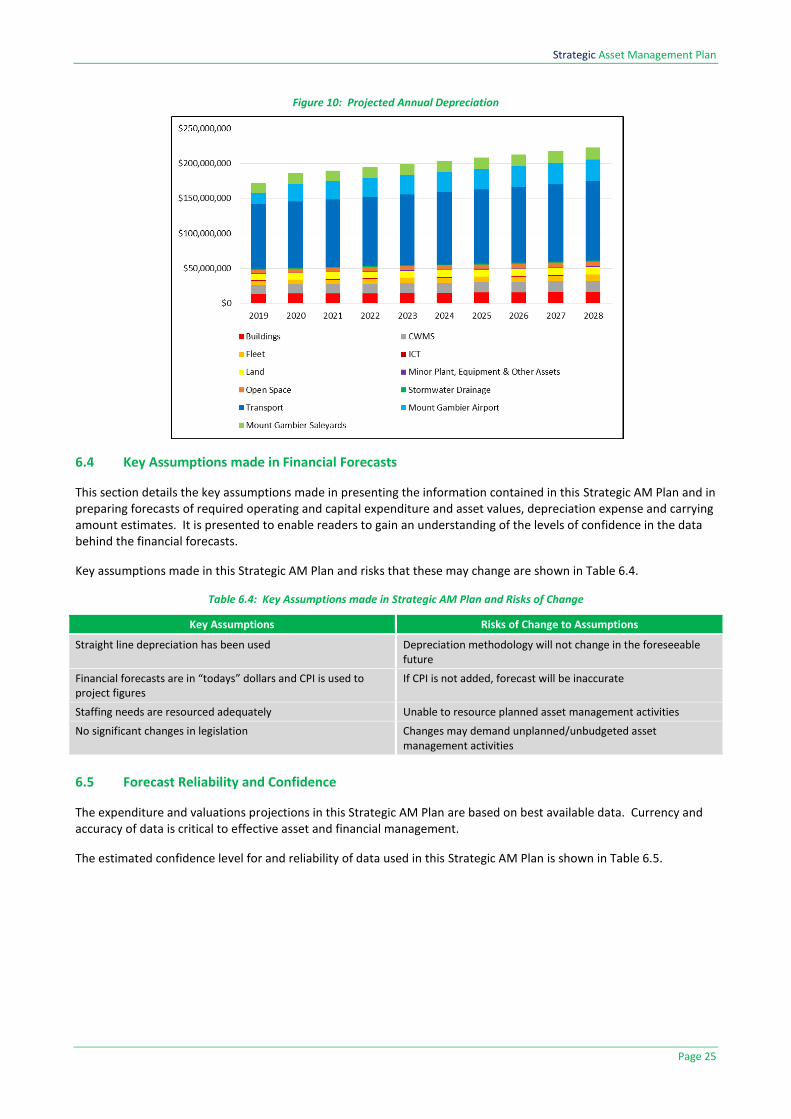
The annual depreciation will vary over the forecast period depending on the rates of addition of new assets, disposal of old assets and consumption and renewal of existing assets. Forecast of the assets’ annual depreciation is shown in Figure 10.
Strategic Asset Management Plan
Page 25
Figure 10: Projected Annual Depreciation
6.4 Key Assumptions made in Financial Forecasts
This section details the key assumptions made in presenting the information contained in this Strategic AM Plan and in preparing forecasts of required operating and capital expenditure and asset values, depreciation expense and carrying amount estimates. It is presented to enable readers to gain an understanding of the levels of confidence in the data behind the financial forecasts.
Key assumptions made in this Strategic AM Plan and risks that these may change are shown in Table 6.4.
Table 6.4: Key Assumptions made in Strategic AM Plan and Risks of Change
Key Assumptions Risks of Change to Assumptions
Straight line depreciation has been used Depreciation methodology will not change in the foreseeable future
Financial forecasts are in “todays” dollars and CPI is used to project figures
If CPI is not added, forecast will be inaccurate
Staffing needs are resourced adequately Unable to resource planned asset management activities
No significant changes in legislation Changes may demand unplanned/unbudgeted asset management activities
6.5 Forecast Reliability and Confidence
The expenditure and valuations projections in this Strategic AM Plan are based on best available data. Currency and accuracy of data is critical to effective asset and financial management.
The estimated confidence level for and reliability of data used in this Strategic AM Plan is shown in Table 6.5.

Strategic Asset Management Plan
Page 26
Table 6.5: Data Confidence Assessment for AM Plans summarised in Strategic AM Plan
Asset Category/Service Confidence Assessment Comment
Buildings High A visual condition assessment and revaluation of buildings was undertaken in 2018 by AssetVal.
CWMS High A visual condition assessment and revaluation of buildings was undertaken in 2018 by HDS Australia.
Fleet High Assets are recognised at cost and residual and depreciation rate applied on an individual basis.
ICT Medium Assets are recognised at cost and residual and depreciation rate applied on an individual basis. Low value items are excluded from valuation.
Open Space Medium A visual condition assessment and revaluation of assets within the other structures asset class was undertaken in 2018 by AssetVal. Other assets included in the Open Space AM Plan (ie. marine) have not been revalued or condition assessed recently.
Stormwater Drainage Low Due to the high cost of visual assessment, condition of stormwater drainage assets is based on age and history of failure. A revaluation using adopted unit rates was undertaken in 2013 (rural assets) and 2014 (township assets).
Transport High A visual condition assessment and formal revaluation of roads and kerbs was undertaken in 2017 by Talis Consultants/Assetic. A further desktop revaluation using adopted rates was undertaken in 2018. Footpaths have not been condition assessed since 2009, however were revalued via desktop in 2018. Bridges were visually assessed and revaluation in 2017 by Assetic.
Mount Gambier Airport Medium Assets have been assessed and revalued as per the asset categories above, with the exception of transport assets which were revalued based on condition data from 2013.
Mount Gambier Saleyards Medium Assets have been assessed and revalued as per the asset categories above, with the exception of transport assets which were revalued based on condition data from 2013.
Over all data sources, the data confidence is assessed as medium to high confidence level for data used in the preparation of this Strategic AM Plan.
Actions to mitigate the adverse effects of data quality are included within Table 8.2 Improvement Plan.

Strategic Asset Management Plan
Page 27
LONG TERM
FINANCIAL PLAN
ASSET
MANAGEMENT
PLAN
RISK
MANAGEMENT
PLAN
HUMAN
RESOURCES
PLAN
COMMUNITY
SERVICES PLAN
RISK MANAGEMENT POLICY
RISK MANAGEMENT PROCEDURE
Risk Context Business Continuity
Consequence Table IT Disaster Plan
Likelihood Table Records Disaster Plan
Risk Profile Matrix Airport Safety Plan
Risk Acceptance Criteria WHS&IM Plan
Risk Operational PlanHuman Resources
Procurement / Contract
Public Relations
Safety and Emergency
DISTRICT COUNCIL OF GRANT STRATEGIC MANAGEMENT PLAN
LGA Workers Compensation Scheme
LGA Mutual Liability Scheme
LGA Assets
SUPPORTING BODIES
RISK TOOLS CONTINGENCY PLANSRISK REGISTER
Assets / Infrastructure
Community Land / Events
Environment
Financial and Information
Governance
7. RISK MANAGEMENT
7.1 Risk Management Framework
The District Council of Grant is committed to an integrated approach to risk management to protect its employees, assets, liabilities and community against potential exposures. The Council accepts that there is a level of risk in service delivery and is not adverse to accepting risk where a thorough risk assessment has been undertaken and appropriate contingency plans and mitigation strategies to manage or reduce risk to an acceptable level have been developed.
The District Council of Grant has developed a Risk Management Framework (Figure 10) comprising a Plan, Policy and Procedure which are applied across Council to mitigate its risk.
Figure 10: Risk Management Framework
7.2 Evaluation of Risk
The Risk Management Procedure documents the process for managing risk and has been developed in accordance with Australian Standard AS/NZS ISO 31000:2009 (Figure 11). The procedure requires the application of a formal risk management process comprising risk identification, analysis (the likelihood of the risk event occurring, the consequences should the event occur and resultant risk rating), evaluation, development of a risk treatment plan for non-acceptable risks, monitoring and review.
Figure 11: Risk Management Process
Strategic Asset Management Plan
Page 28
7.3 Critical Risks and Treatment Plan
An assessment of risks associated with service delivery from assets has identified critical risks. Those critical risks that present an extreme or high risk result through business impact, people/public safety, reputation and environment and the treatment plans will be reviewed quarterly by the management team.
Critical risks, being those assessed as ‘Extreme’ - requiring immediate corrective action and ‘High’ – requiring prioritised corrective action identified in the Risk Register are summarised in Table 7.3. Risks not assessed as ‘Extreme’ are shown in the respective AM Plans.
Table 7.3: Critical Risks and Treatment Plans
Service at Risk What can Happen Risk Rating Risk Treatment Plan
There are ‘Extreme’ risks identified in the current AM Plans.

Strategic Asset Management Plan
Page 29
8. PLAN IMPROVEMENT AND MONITORING
8.1 Status of Asset Management Practices
There are no major changes to asset management practices identified in this plan.
8.2 Improvement Plan
The asset management improvement tasks identified from an asset management maturity assessment and preparation of this Strategic AM Plan are shown in Table 8.2.
Table 8.2: Improvement Plan
Task No Task Responsibility Timeline
1 Develop desired levels of service for each of our services in consultation with the community.
DCEO/AMC/WM December 2020
2 Further define the roles and responsibilities in the Asset Management Policy, identifying positions responsible for determining levels of service and positions responsible for managing the assets to meet service delivery needs.
DCEO/AMC December 2019
3 Develop a process for linking community enquiries and operational response issues to individual assets.
DCEO/AMC December 2019
4 Develop and implement a process for monitoring and evaluating compliance with technical levels of service.
WM/AMC2 December 2020
5 Ensure adequate staff and resources are allocated to the management of assets and develop a contingency plan to ensure continuity of service.
DCEO December 2019
Individual AM Plans contain additional actions to ensure continual improvement and ongoing monitoring of plans.
8.3 Monitoring and Review Procedures
The Strategic AM Plan has a life of 4 years (Council election cycle) and is due for complete revision and updating within six months of each Council election.
8.4 Performance Measures
The effectiveness of the Strategic AM Plan can be measured in the following ways:
The degree to which the required projected expenditures identified in this Strategic AM Plan are incorporated into the organisation’s long term financial plan
The degree to which 1-5 year detailed works programs, budgets, business plans and organisational structures take into account the ‘global’ works program trends provided by the summarised asset management plans
The degree to which the existing and projected service levels and service consequences (what we cannot do), risks and residual risks are incorporated into the organisation’s Strategic Plan and associated plans
The Asset Renewal Funding Ratio achieving the target of 90 - 100%.

Strategic Asset Management Plan
Page 30
9. REFERENCES
ISO, 2014, ISO 55000, Asset management – Overview, principles and terminology, International Organization for Standardization, Geneva.
ISO, 2014, ISO 55001, Asset management – Management systems - Requirements, International Organization for Standardization, Geneva.
ISO, 2014, ISO 55002, Asset management – Management systems – Guidelines for the application of ISO 55001, International Organization for Standardization, Geneva.
IPWEA, 2014, ‘NAMS.PLUS3 Asset Management’, Institute of Public Works Engineering Australia, Sydney, www.ipwea.org/namsplus.
IPWEA, 2015, ‘Australian Infrastructure Financial Management Manual, Institute of Public Works Engineering Australasia, Sydney, www.ipwea.org/AIFMM.
IPWEA, 2011, 2015, ‘International Infrastructure Management Manual’, Institute of Public Works Engineering Australasia, Sydney, www.ipwea.org/IIMM
District Council of Grant, ‘Strategic Plan 2016 – 2020’,
District Council of Grant, ‘Annual Plan and Budget’,
District Council of Grant, ‘Asset Management Plans,
District Council of Grant , ‘Asset Management Maturity Assessment’,

Strategic Asset Management Plan
Page 31
10. APPENDICES
Appendix A Projected 10 year Operations and Maintenance Expenditures
Appendix B Projected 10 year Capital Renewal and Replacement Works Program
Appendix C Projected 10 year Capital Upgrade/New Works Program

- 32 -
Page 32
Appendix A Projected Operations and Maintenance Expenditure
Projected operation and maintenance expenditures included in the Long-Term Financial Plan are shown below.
2019 2020 2021 2022 2023 2024 2025 2026 2027 2028
Buildings $464,550 $468,604 $479,199 $490,240 $508,933 $511,783 $524,697 $552,980 $548,538 $559,579
CWMS $364,537 $372,921 $383,498 $392,273 $401,249 $408,432 $417,826 $427,436 $437,267 $447,324
Fleet $643,546 $658,348 $673,490 $688,980 $704,827 $721,038 $737,622 $754,587 $771,943 $789,697
ICT $220,575 $225,648 $230,838 $236,147 $241,579 $247,135 $252,819 $258,634 $264,583 $270,668
Open Space $359,665 $367,938 $376,400 $385,057 $393,914 $402,974 $412,242 $421,724 $431,423 $441,346
Stormwater Drainage $33,201 $33,965 $34,746 $35,545 $36,363 $37,199 $38,055 $38,930 $39,825 $40,741
Transport $2,231,670 $2,282,998 $2,335,507 $2,389,224 $2,444,176 $2,500,392 $2,557,901 $2,616,733 $2,676,918 $2,738,487
Airport $156,831 $160,438 $164,129 $167,903 $171,765 $175,716 $179,757 $183,892 $188,121 $192,448
Saleyards $347,048 $355,030 $363,196 $371,549 $380,095 $388,837 $397,780 $406,929 $416,288 $425,863

- 33 -
Page 33
Appendix B Projected Capital Renewal/Replacement Program
Total 10 Year
Program2019 2020 2021 2022 2023 2024 2025 2026 2027 2028
Buildings
Blackfellows Caves Public Conveniences $16,500 $0 $15,000 $0 $0 $0 $0 $1,500 $0 $0 $0
Cape Douglas Cape Douglas Emergency Water Supply Shed $8,000 $0 $0 $3,000 $5,000 $0 $0 $0 $0 $0 $0
Carpenter Rocks Carpenter Rocks Hall $9,000 $0 $0 $0 $0 $5,000 $0 $0 $0 $4,000 $0
Public Conveniences (Foreshore) $2,500 $0 $0 $0 $2,500 $0 $0 $0 $0 $0 $0
Public Conveniences (Recreation Reserve) $2,500 $0 $0 $0 $2,500 $0 $0 $0 $0 $0 $0
Donovans Public Conveniences (Foreshore) $8,000 $0 $2,000 $3,500 $0 $2,500 $0 $0 $0 $0 $0
Public Conveniences (Recreation Reserve) $10,000 $0 $0 $3,000 $1,500 $1,000 $3,000 $0 $0 $1,500 $0
Dry Creek Public Conveniences (Foreshore) $0 $0 $0 $0 $0 $0 $0 $0 $0 $0 $0
Kongorong Public Conveniences $24,000 $0 $4,000 $0 $10,000 $1,000 $3,000 $6,000 $0 $0 $0
Mount Gambier Mount Gambier Office and Depot $255,000 $0 $58,500 $43,000 $26,000 $6,000 $33,500 $47,000 $11,000 $15,000 $15,000
Mount Schank Public Conveniences $9,200 $0 $2,500 $3,000 $0 $0 $0 $3,700 $0 $0 $0
Nene Valley Public Conveniences $7,500 $0 $1,000 $0 $2,500 $0 $0 $2,500 $1,500 $0 $0
Port MacDonnell EA Milstead Centre $15,000 $0 $5,000 $0 $2,000 $0 $0 $8,000 $0 $0 $0
Lions Park $6,500 $0 $1,500 $0 $0 $5,000 $0 $0 $0 $0 $0
Old Maritime Museum $26,000 $0 $6,000 $5,000 $0 $0 $0 $0 $0 $15,000 $0
Port MacDonnell Community Complex $45,500 $0 $0 $5,000 $12,000 $2,000 $21,500 $0 $5,000 $0 $0
Port MacDonnell Community Hall $28,500 $0 $5,000 $3,500 $0 $0 $0 $16,000 $0 $0 $4,000
Port MacDonnell Depot $79,500 $0 $0 $19,000 $14,000 $12,000 $25,500 $7,000 $0 $2,000 $0
Port MacDonnell Foreshore Tourist Park $0 $0 $0 $0 $0 $0 $0 $0 $0 $0 $0
Port MacDonnell Scout Hall $10,000 $0 $6,000 $0 $0 $0 $4,000 $0 $0 $0 $0
Public Conveniences (Tourist Park) $13,000 $0 $6,500 $2,000 $0 $0 $2,500 $0 $0 $0 $2,000
Public Conveniences (The Waterfront) $32,000 $0 $10,000 $0 $0 $0 $20,000 $2,000 $0 $0 $0
Public Conveniences (Tenterden Reserve) $13,000 $0 $6,500 $2,000 $0 $0 $2,500 $0 $0 $0 $2,000
Tarpeena Tarpeena Memorial Hall $32,000 $0 $10,000 $0 $0 $0 $20,000 $2,000 $0 $0 $0
Tarpeena Emergency Water Supply Shed $4,500 $0 $0 $0 $0 $0 $1,500 $0 $3,000 $0 $0
Public Conveniences (Recreation Reserve) $21,500 $0 $4,000 $0 $2,000 $4,000 $5,000 $4,000 $0 $0 $2,500
Wye Public Conveniences (Brown Bay) $24,000 $5,000 $0 $0 $0 $12,000 $0 $0 $7,000 $0 $0
Yahl Yahl Soldiers Memorial Hall $25,000 $0 $25,000 $0 $0 $0 $0 $0 $0 $0 $0
$728,200 $5,000 $168,500 $92,000 $80,000 $50,500 $142,000 $99,700 $27,500 $37,500 $25,500
CWMS
$76,000 $6,000 $11,000 $20,000 $0 $13,000 $13,000 $13,000 $0 $0 $0
$117,000 $117,000 $0 $0 $0 $0 $0 $0 $0 $0 $0
$0 $0 $0 $0 $0 $0 $0 $0 $0 $0 $0
$24,000 $0 $8,000 $8,000 $0 $0 $0 $8,000 $0 $0 $0
$156,000 $45,000 $45,000 $23,000 $23,000 $10,000 $10,000 $0 $0 $0 $0
$66,000 $12,000 $15,000 $13,000 $13,000 $13,000 $0 $0 $0 $0 $0
$439,000 $180,000 $79,000 $64,000 $36,000 $36,000 $23,000 $21,000 $0 $0 $0
Tarpeena
Service and Asset Details
Total Buildings Capital Renewal
Allendale East
Cape Douglas
Donovans
Pelican Point
Port MacDonnell
Total CWMS Capital Renewal

- 34 -
Page 34
Total 10 Year
Program2019 2020 2021 2022 2023 2024 2025 2026 2027 2028
Fleet
$5,798,321 $299,683 $400,000 $651,624 $1,083,935 $84,446 $701,614 $840,649 $107,188 $791,040 $838,140
$426,835 $31,001 $88,500 $21,091 $65,774 $80,953 $0 $35,003 $59,022 $8,487 $37,004
$4,542,080 $485,466 $395,240 $438,370 $433,950 $529,031 $337,812 $564,922 $428,764 $467,173 $461,352
$2,327,068 $289,380 $131,638 $318,569 $137,427 $315,467 $143,216 $346,016 $149,005 $341,554 $154,795
$13,094,304 $1,105,530 $1,015,379 $1,429,654 $1,721,086 $1,009,898 $1,182,643 $1,786,590 $743,980 $1,608,254 $1,491,291
ICT
All-in-One Computers $22,077 $10,982 $0 $0 $0 $0 $11,095 $0 $0 $0 $0
Computer Screens $41,244 $3,138 $8,672 $3,017 $5,073 $0 $3,341 $9,520 $3,148 $4,677 $658
Desktop Computers $89,156 $44,000 $0 $0 $0 $0 $45,156 $0 $0 $0 $0
Laptop Computers $18,831 $9,266 $0 $0 $0 $0 $9,565 $0 $0 $0 $0
Printers/Multi Function Devices $30,631 $2,400 $12,178 $0 $0 $0 $2,660 $13,392 $0 $0 $0
Tablet Computers $51,464 $10,800 $5,631 $1,180 $1,576 $12,937 $2,900 $0 $6,353 $10,086 $0
IT Applications and Software $54,028 $0 $25,739 $0 $0 $0 $0 $28,289 $0 $0 $0
Network Equipment $21,482 $0 $2,383 $6,175 $1,389 $455 $0 $2,508 $6,615 $1,455 $502
Server Equipment $366,319 $3,661 $38,645 $37,232 $26,852 $72,199 $4,024 $35,526 $40,247 $28,287 $79,645
Audio/Video Equipment $35,045 $3,700 $1,588 $0 $12,174 $0 $2,406 $1,748 $0 $13,429 $0
Fixed Telephony $21,840 $9,200 $213 $1,110 $1,115 $0 $7,693 $235 $1,135 $1,140 $0
Mobile Telephones $64,237 $0 $12,706 $74 $12,745 $78 $12,784 $81 $12,823 $84 $12,862
Radio Communication Equipment $90,855 $0 $0 $0 $0 $0 $0 $51,193 $39,661 $0 $0
$907,209 $97,147 $107,756 $48,789 $60,923 $85,669 $101,625 $142,493 $109,983 $59,159 $93,667
Open Space
No planned capital renewals. $0 $0 $0 $0 $0 $0 $0 $0 $0 $0 $0
$0 $0 $0 $0 $0 $0 $0 $0 $0 $0 $0
Stormwater Drainage
No planned capital renewals. $0 $0 $0 $0 $0 $0 $0 $0 $0 $0 $0
$0 $0 $0 $0 $0 $0 $0 $0 $0 $0 $0
Transport
$9,171,103 $800,000 $824,000 $848,720 $874,182 $900,407 $927,419 $955,242 $983,899 $1,013,416 $1,043,819
$11,463,879 $1,000,000 $1,030,000 $1,060,900 $1,092,727 $1,125,509 $1,159,274 $1,194,052 $1,229,874 $1,266,770 $1,304,773
$20,634,983 $1,800,000 $1,854,000 $1,909,620 $1,966,909 $2,025,916 $2,086,693 $2,149,294 $2,213,773 $2,280,186 $2,348,592
Heavy Plant
Light Plant
Commercial Vehicles
Manager and Passenger Vehicles
Total Transport Capital Renewal
Total Open Space Capital Renewal
Total Stormwater Drainage Capital Renewal
Sealed Roads
Unsealed Roads
Service and Asset Details
Total Fleet Capital Renewal
Total ICT Capital Renewal
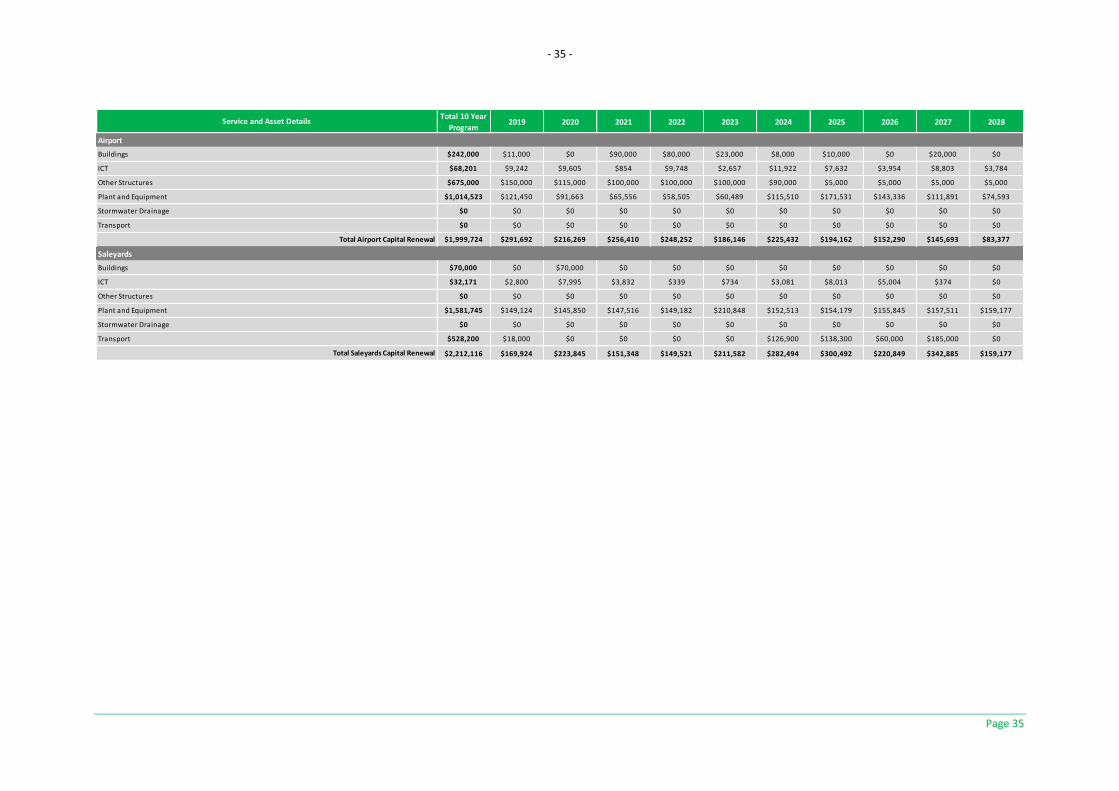
- 35 -
Page 35
Total 10 Year
Program2019 2020 2021 2022 2023 2024 2025 2026 2027 2028
Airport
$242,000 $11,000 $0 $90,000 $80,000 $23,000 $8,000 $10,000 $0 $20,000 $0
$68,201 $9,242 $9,605 $854 $9,748 $2,657 $11,922 $7,632 $3,954 $8,803 $3,784
$675,000 $150,000 $115,000 $100,000 $100,000 $100,000 $90,000 $5,000 $5,000 $5,000 $5,000
$1,014,523 $121,450 $91,663 $65,556 $58,505 $60,489 $115,510 $171,531 $143,336 $111,891 $74,593
$0 $0 $0 $0 $0 $0 $0 $0 $0 $0 $0
$0 $0 $0 $0 $0 $0 $0 $0 $0 $0 $0
$1,999,724 $291,692 $216,269 $256,410 $248,252 $186,146 $225,432 $194,162 $152,290 $145,693 $83,377
Saleyards
$70,000 $0 $70,000 $0 $0 $0 $0 $0 $0 $0 $0
$32,171 $2,800 $7,995 $3,832 $339 $734 $3,081 $8,013 $5,004 $374 $0
$0 $0 $0 $0 $0 $0 $0 $0 $0 $0 $0
$1,581,745 $149,124 $145,850 $147,516 $149,182 $210,848 $152,513 $154,179 $155,845 $157,511 $159,177
$0 $0 $0 $0 $0 $0 $0 $0 $0 $0 $0
$528,200 $18,000 $0 $0 $0 $0 $126,900 $138,300 $60,000 $185,000 $0
$2,212,116 $169,924 $223,845 $151,348 $149,521 $211,582 $282,494 $300,492 $220,849 $342,885 $159,177
Total Airport Capital Renewal
Buildings
ICT
Buildings
ICT
Other Structures
Service and Asset Details
Plant and Equipment
Stormwater Drainage
Transport
Other Structures
Plant and Equipment
Stormwater Drainage
Transport
Total Saleyards Capital Renewal
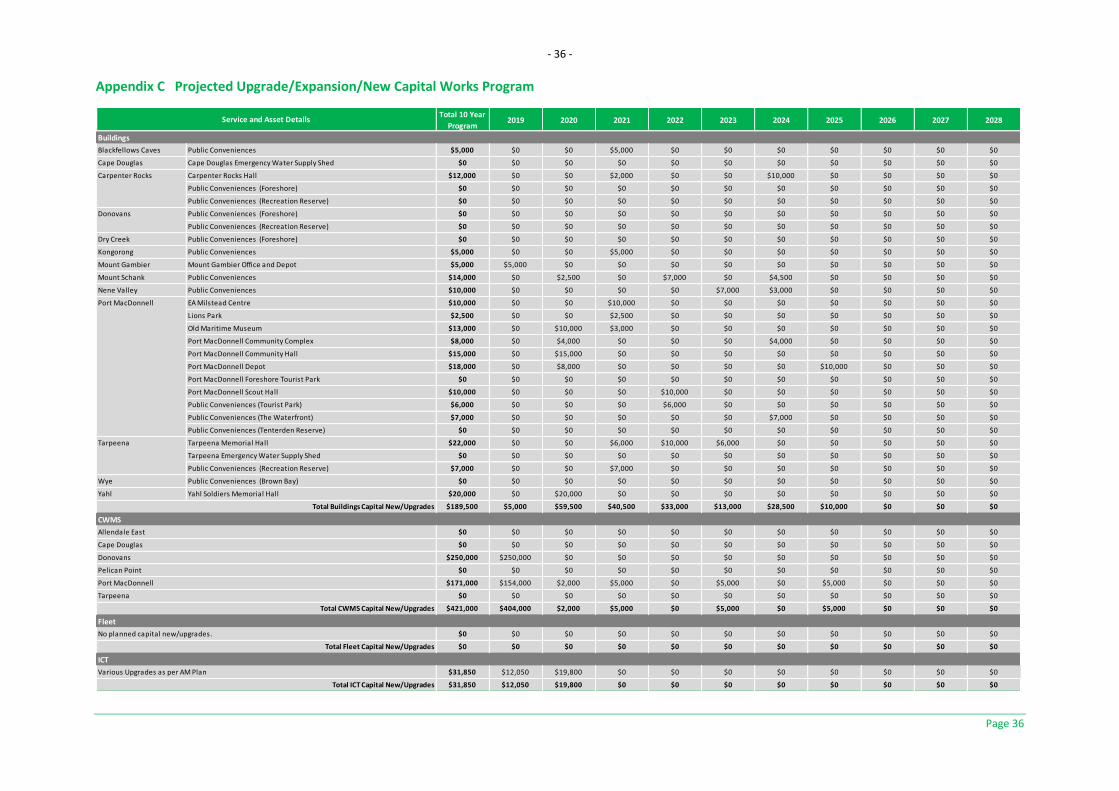
- 36 -
Page 36
Appendix C Projected Upgrade/Expansion/New Capital Works Program
Total 10 Year
Program2019 2020 2021 2022 2023 2024 2025 2026 2027 2028
Buildings
Blackfellows Caves Public Conveniences $5,000 $0 $0 $5,000 $0 $0 $0 $0 $0 $0 $0
Cape Douglas Cape Douglas Emergency Water Supply Shed $0 $0 $0 $0 $0 $0 $0 $0 $0 $0 $0
Carpenter Rocks Carpenter Rocks Hall $12,000 $0 $0 $2,000 $0 $0 $10,000 $0 $0 $0 $0
Public Conveniences (Foreshore) $0 $0 $0 $0 $0 $0 $0 $0 $0 $0 $0
Public Conveniences (Recreation Reserve) $0 $0 $0 $0 $0 $0 $0 $0 $0 $0 $0
Donovans Public Conveniences (Foreshore) $0 $0 $0 $0 $0 $0 $0 $0 $0 $0 $0
Public Conveniences (Recreation Reserve) $0 $0 $0 $0 $0 $0 $0 $0 $0 $0 $0
Dry Creek Public Conveniences (Foreshore) $0 $0 $0 $0 $0 $0 $0 $0 $0 $0 $0
Kongorong Public Conveniences $5,000 $0 $0 $5,000 $0 $0 $0 $0 $0 $0 $0
Mount Gambier Mount Gambier Office and Depot $5,000 $5,000 $0 $0 $0 $0 $0 $0 $0 $0 $0
Mount Schank Public Conveniences $14,000 $0 $2,500 $0 $7,000 $0 $4,500 $0 $0 $0 $0
Nene Valley Public Conveniences $10,000 $0 $0 $0 $0 $7,000 $3,000 $0 $0 $0 $0
Port MacDonnell EA Milstead Centre $10,000 $0 $0 $10,000 $0 $0 $0 $0 $0 $0 $0
Lions Park $2,500 $0 $0 $2,500 $0 $0 $0 $0 $0 $0 $0
Old Maritime Museum $13,000 $0 $10,000 $3,000 $0 $0 $0 $0 $0 $0 $0
Port MacDonnell Community Complex $8,000 $0 $4,000 $0 $0 $0 $4,000 $0 $0 $0 $0
Port MacDonnell Community Hall $15,000 $0 $15,000 $0 $0 $0 $0 $0 $0 $0 $0
Port MacDonnell Depot $18,000 $0 $8,000 $0 $0 $0 $0 $10,000 $0 $0 $0
Port MacDonnell Foreshore Tourist Park $0 $0 $0 $0 $0 $0 $0 $0 $0 $0 $0
Port MacDonnell Scout Hall $10,000 $0 $0 $0 $10,000 $0 $0 $0 $0 $0 $0
Public Conveniences (Tourist Park) $6,000 $0 $0 $0 $6,000 $0 $0 $0 $0 $0 $0
Public Conveniences (The Waterfront) $7,000 $0 $0 $0 $0 $0 $7,000 $0 $0 $0 $0
Public Conveniences (Tenterden Reserve) $0 $0 $0 $0 $0 $0 $0 $0 $0 $0 $0
Tarpeena Tarpeena Memorial Hall $22,000 $0 $0 $6,000 $10,000 $6,000 $0 $0 $0 $0 $0
Tarpeena Emergency Water Supply Shed $0 $0 $0 $0 $0 $0 $0 $0 $0 $0 $0
Public Conveniences (Recreation Reserve) $7,000 $0 $0 $7,000 $0 $0 $0 $0 $0 $0 $0
Wye Public Conveniences (Brown Bay) $0 $0 $0 $0 $0 $0 $0 $0 $0 $0 $0
Yahl Yahl Soldiers Memorial Hall $20,000 $0 $20,000 $0 $0 $0 $0 $0 $0 $0 $0
$189,500 $5,000 $59,500 $40,500 $33,000 $13,000 $28,500 $10,000 $0 $0 $0
CWMS
$0 $0 $0 $0 $0 $0 $0 $0 $0 $0 $0
$0 $0 $0 $0 $0 $0 $0 $0 $0 $0 $0
$250,000 $250,000 $0 $0 $0 $0 $0 $0 $0 $0 $0
$0 $0 $0 $0 $0 $0 $0 $0 $0 $0 $0
$171,000 $154,000 $2,000 $5,000 $0 $5,000 $0 $5,000 $0 $0 $0
$0 $0 $0 $0 $0 $0 $0 $0 $0 $0 $0
$421,000 $404,000 $2,000 $5,000 $0 $5,000 $0 $5,000 $0 $0 $0
Fleet
$0 $0 $0 $0 $0 $0 $0 $0 $0 $0 $0
$0 $0 $0 $0 $0 $0 $0 $0 $0 $0 $0
ICT
Various Upgrades as per AM Plan $31,850 $12,050 $19,800 $0 $0 $0 $0 $0 $0 $0 $0
$31,850 $12,050 $19,800 $0 $0 $0 $0 $0 $0 $0 $0
Tarpeena
Pelican Point
Total Buildings Capital New/Upgrades
Total CWMS Capital New/Upgrades
Total Fleet Capital New/Upgrades
No planned capital new/upgrades.
Allendale East
Cape Douglas
Donovans
Port MacDonnell
Service and Asset Details
Total ICT Capital New/Upgrades