Strategic Assessment Summary - Community Safety ... · Strategic Assessment Summary - Community...
13
1 Strategic Assessment Summary - Community Safety Partnership (1/03/2012) 1. Summary Overview (October 2010-Sept 2011 vs previous year unless otherwise stated) N.B. This should be read in conjunction with the attached, separate needs assessments for drugs, alcohol and domestic violence 1.1 Long-term trends and key changes Recorded crime fell nationally and consistently between 2002/3 and 2009/10. In Haringey, it fell by 35% (down to 25,735 offences) and there was a corresponding improvement in residents’ perceptions of – and concern about – crime, falling from 54% worried in 2005 to 35% worried in 2009/10. This period coincided with a strong economy and high levels of investment in community safety and other public services 1.2 The rate of reduction for overall recorded crime is now in decline. It fell by 4.5% in 2010/11 – the lowest reduction since 2007/8 – but has since flattened out. However, serious youth violence was up 26% (126 offences) at end December 2011 and knife crime by 21% (258) compared with the previous year. Correspondingly concern about crime rose in 2011-12 by 10% for the first time since 2005/6. 1.3 Property crime has increased significantly over the past 18 months with a 19% (+500) increase in residential burglary; 37% (+331) increase in personal robbery; theft of motor vehicles (+24% 580) and theft from MVs (+99% 778). This coincides with rising unemployment and economic downturn but follows many years of significant and sustained reductions in these crimes. 1.4 There is a clear trend in Haringey for younger people offending with 18-24 year old offenders heavily overrepresented; young offenders tend to commit robbery, burglary, theft and carry offensive weapons. Offenders are overwhelmingly male (80%) and over half are unemployed. African/Caribbean offenders are overrepresented (accounting for twice their borough proportion). These representations are considerably less marked when the School Census data from January 2011 are used and these are quoted in the document. 1.5 Victims aged between 18 and 25 are most vulnerable and youths (10-17) are most likely to be victims of robbery and assaults. Male and female victims are split evenly. 60% of gang-related victims and 25% of gang-related offenders are youths. There is also a growing concern about the impact of domestic violence on young people. 1.6 The north-east corner of the borough and the length of both High Roads (Tottenham and Wood Green) have been long-standing hot spots for crime, ASB and disorder with notable clusters around transport hubs such as Seven Sisters and Wood Green to Turnpike Lane.
-
Upload
vuongkhanh -
Category
Documents
-
view
213 -
download
0
Transcript of Strategic Assessment Summary - Community Safety ... · Strategic Assessment Summary - Community...

1
Strategic Assessment Summary - Community Safety Partnership (1/03/2012) 1. Summary Overview (October 2010-Sept 2011 vs previous year unless otherwise
stated)
N.B. This should be read in conjunction with the attached, separate needs assessments for drugs, alcohol and domestic violence
1.1 Long-term trends and key changes Recorded crime fell nationally and consistently between 2002/3 and 2009/10. In
Haringey, it fell by 35% (down to 25,735 offences) and there was a corresponding improvement in residents’ perceptions of – and concern about – crime, falling from 54% worried in 2005 to 35% worried in 2009/10. This period coincided with a strong economy and high levels of investment in community safety and other public services
1.2 The rate of reduction for overall recorded crime is now in decline. It fell by 4.5% in
2010/11 – the lowest reduction since 2007/8 – but has since flattened out. However, serious youth violence was up 26% (126 offences) at end December 2011 and knife crime by 21% (258) compared with the previous year. Correspondingly concern about crime rose in 2011-12 by 10% for the first time since 2005/6.
1.3 Property crime has increased significantly over the past 18 months with a 19%
(+500) increase in residential burglary; 37% (+331) increase in personal robbery; theft of motor vehicles (+24% 580) and theft from MVs (+99% 778). This coincides with rising unemployment and economic downturn but follows many years of significant and sustained reductions in these crimes.
1.4 There is a clear trend in Haringey for younger people offending with 18-24 year old
offenders heavily overrepresented; young offenders tend to commit robbery, burglary, theft and carry offensive weapons. Offenders are overwhelmingly male (80%) and over half are unemployed. African/Caribbean offenders are overrepresented (accounting for twice their borough proportion). These representations are considerably less marked when the School Census data from January 2011 are used and these are quoted in the document.
1.5 Victims aged between 18 and 25 are most vulnerable and youths (10-17) are most
likely to be victims of robbery and assaults. Male and female victims are split evenly. 60% of gang-related victims and 25% of gang-related offenders are youths. There is also a growing concern about the impact of domestic violence on young people.
1.6 The north-east corner of the borough and the length of both High Roads
(Tottenham and Wood Green) have been long-standing hot spots for crime, ASB and disorder with notable clusters around transport hubs such as Seven Sisters and Wood Green to Turnpike Lane.

2
1.7 Noise complaints to the Council have decreased by 16% over the period but calls
relating to rowdy and inconsiderate public behaviour remain high (61% of all disorder calls) with Noel Park, Northumberland Park and Tottenham Green combined accounting for 30%. Mental health related calls correlate strongly with areas of dense local authority housing. Respondents to surveys by Mind UK have historically shown very high levels of victimisation among this group – up to 90%.
1.8 Noel Park ward (incorporating Hollywood/Tube area; High Road and the Shopping Centre) is a very significant hotspot and the only ward to have a crime rate that is double the borough average. This ward has had notable increases in personal robbery (+ 118 offences 195%); youth robbery (+36 offences 200%); theft and snatch (+50% 48 offences); gang-related crime (+ 195% 37 offences – 4 x higher than other wards); knife-enabled crime (+105% 30 offences); highest volumes of all ASB disorder
1.9 Tottenham Hale, Tottenham Green and Northumberland Park together account for
28% of recorded violent offences (exc. domestic violence) and 26% of criminal damage to buildings. Peaks occur mid-week especially Tuesday and Wednesday between 1pm and 7pm and are driven by retail and transport interchanges causing high footfall and opportunities for aggravated robbery.
0% 10% 20% 30% 40% 50% 60% 70% 80% 90% 100%
Picking Pockets, etc
Snatches
Criminal Damage To
Other Bldg
Theft From Shops
VAP excl. DV
Wood Green
Town Centre
Northumberland
Park
Tottenham
Green
Tottenham
Hale
Rest of the
borough
Rest of the
borough
64.3%59.9%61.9%32.1%62.7%
Tottenham
Hale
3.7%8.8%10.4%4.0%9.7%
Tottenham
Green
3.5%13.3%7.8%10.6%9.0%
Northumberland
Park
2.8%5.0%6.5%1.0%9.0%
Wood Green
Town Centre
25.8%13.0%13.4%52.2%9.57%
Picking Pockets,
etcSnatches
Criminal Damage
To Other BldgTheft From ShopsVAP excl. DV
2. Vulnerable Localities Index (VLI)

3
2.1 The Vulnerable Localities Index (VLI)1 is a method used for measuring community cohesion. As a scanning tool, it uses seven indices combined and mapped to act as an indicator of where neighborhoods with low level community cohesion issues might exist.
2.2 The recent riots in Tottenham shared common themes with previous serious disturbances such as fragmented communities, deprivation, high unemployment and disenfranchised youth.
The seven indices selected as most relevant to Haringey were domestic burglary, criminal damage, racial and religious hate offences, low educational attainment, youth population demographic, income deprivation and employment status.
2.3 Both Noel Park and Tottenham Hale contain major shopping centres and busy transport interchanges. They also contain the highest volumes of social housing stock in the borough (31.2% of the total). Many of the high scoring areas identified also experience high numbers of anti-social behaviour (ASB) related emergency calls, further implying that these areas are particularly vulnerable with issues beyond the indices measured in the VLI (no data sourced from disorder databases was included in the VLI indices). This map illustrates the intense clustering of VLI hot spots in the east of the borough i.e. high scoring neighbourhoods surrounded by other high scoring neighbourhoods.
3. Ethnicity by location (based on School Census January 2011)
3.1 Census data on ethnicity is now over 10 years out-of-date and the latest information is not yet publicly available. Data gleaned from the school census gives a much better picture of the local demographics.
3.2 The map overleaf shows the dominant ethnic groups for each Super Output Area
(SOA) – an index of multiple deprivation - based on school census data. This shows
1 The VLI was developed jointly by the Central Police Training and Development Authority (Centrex) and the Jill Dando Institute for Crime Science, in response to the riots which occured in 2001 in Oldham, Burnley, Bradford and Wrexham.

4
the prevalence of Black Caribbean and White Turkish children in some of the most deprived areas. Black Caribbean children comprise the majority ethnicity within the nine highest risk SOAs for racial/religious crime, accounting for 12% of the total.
3.3 Comparing the ethnic make-up of accused by School Census, Black offenders remain over-represented but markedly less so i.e. index score of 152 rather than 299 as below. White offenders remain under-represented but also less so (index score of 89 rather than 57). Asian offenders remained broadly similar but Other-Chinese/Arabic offenders appear significantly less under-represented.
Resident % Accused (%) Accused Index
White 66.4% 37.6% 57
Black 17.9% 53.6% 299
Asian 10.7% 4.0% 37
Other 5.0% 4.8% 97 Data according to previous Census
4. Gang crime
4.1 There are currently eleven gangs and one Organised Criminal Network (OCN) in
Haringey. These gangs commit violent offences and are, in some cases, involved in drug dealing. The groups are currently in dispute with one another - the most high profile and historic gang tension being between Wood Green Mob and

5
Tottenham based gangs. There are also cross borough tensions between Tottenham and Edmonton gangs, Wood Green and Enfield gangs and Tottenham and Hackney gangs.
4.2 The 12 months to September 2011 have seen an overall 39.3% increase (n=48)
compared to the previous year2. It should be noted that one of the inherent limitations when monitoring gang related offences is that they are dependent on a gang (GA) flag being correctly applied to the offence record. Compliance can vary depending on force priorities and resource. However, as officer awareness has increased with time the level of conformity has improved. This may have contributed to the significant increase seen during this period.
4.3 The impact of the August 2011 disturbances has led to an increase in reported offences in the 12 months to September 2011. During this period there were 169 gang flagged offences, a third (56 offences) of which occurred during the troubles (between 6th and 10th August 2011). During the same period (6th-11th August) in 2010 there was only 1 gang flagged offence. Noel Park ward recorded the greatest percentage increase of nearly 200% (37 additional offences) which accounted for one third of all gang offending and almost 4 times higher than any other ward.
4.4 Gang related offending has also seen increasing levels in relation to the seriousness of offences committed; both robbery and violence against the person have increased notably, driven by personal robbery (183%, n=11) and serious wounding 61%, n=14) respectively. The most commonly committed offence is serious wounding (37 offences or 22% of offences).
4.5 The map below shows the location of gang territories in Haringey (shaded
areas), overlaid with hotspots for gang crime. The dots indicate the intensity.
2 Gang flags are only used locally, not MPS wide and therefore are not automatically generated by CRIS. Hence there are no official figures for gang crime

6
GA by Time of Day FY09/10
0
5
10
15
20
25
30
35
40
45
00:00-04:00 04:00-08:00 08:00-12:00 12:00-16:00 16:00-20:00 20:00-00:00
GA by Time of Day FY09/10
0
5
10
15
20
25
30
35
40
45
00:00-04:00 04:00-08:00 08:00-12:00 12:00-16:00 16:00-20:00 20:00-00:00
GA hotspot with gang territory FY09/10 Gang crime is fairly evenly spread across all days of the week, but varies by time of day. It becomes increasingly busy towards the late afternoon/evening. The peak hours were specifically between 15:00 through to 17:00, which coincides with school finishing times. Most of the lower level gang members who are involved in gang related ASB are of school age. The graph below shows that victims and those accused of gang crime are overwhelmingly likely to be young. Young victims of gang crime are disproportionately likely to be victims of violent crime (assaults and robberies), with older victims more likely to be victims of property crime or criminal damage. Overall, 60% of gang crime victims and 25% of gang accused were youths (please note that accused data is only available for 16 gang flagged incidents, making gang accused analysis less statistically significant).

7
Gang crime accused and victims by age, FY09/10
0
0.1
0.2
0.3
0.4
0.5
0.6
0.7
0.8
0-4 5-9 10-
14
15-
19
20-
24
25-
29
30-
34
35-
39
40-
44
45-
49
50-
54
55-
59
60-
64
65-
69
70-
74
75-
79
80-
84
85-
89
90+
Accused
Victims
Population %
22 year olds were the most likely to be accused and represent numbers 20 times greater than their equivalent in the local population. All of the gang accused were male. 13 of the 16 were Black African and Caribbean. Most were British. Where occupation was recorded, the majority was unemployed. Most were being charged for the third or more time, reflecting that gang members are persistent re-offenders.
The Gang Action Group A problem solving group set up in response to increasing violence between rival gangs in Haringey, the group was formalised as the Gang Action Group. The group was set up to bring together partners to add value to the enforcement options delivered by the police.
• To prevent and minimise violence between gangs
• To identify and share information about individual gang members
• To identify what interventions are in place for individual gang members; what has worked, what has not worked and why.
• To ensure that each gang member targeted by the group is assigned a lead agency
• To coordinate and implement plans for individual gang members through enforcement, intervention and support with referrals as relevant
• To consider and implement the full range enforcement options available to all partners
• To identify safeguarding issues relating to gang members and their families and appropriate referrals
8
• To identify gaps in provision and recommend projects and approaches which might address these gaps
• To adhere to the terms of the Crime, Disorder and Anti-Social Behaviour Information Sharing Protocol
• To recognise and respond to the impact of gang activity on families and wider communities
Expected Outcomes The expected outcomes of this group are to establish clear lines of accountability for managing gang members and an infrastructure for sharing information with a view to reducing violence between gangs. Gang Injunctions: The Anti-Social Behaviour Action Team (ASBAT) has recently secured the borough’s first gang injunctions against three individuals in South Tottenham. They hope to use this legislation again to deal with North Tottenham gang members.
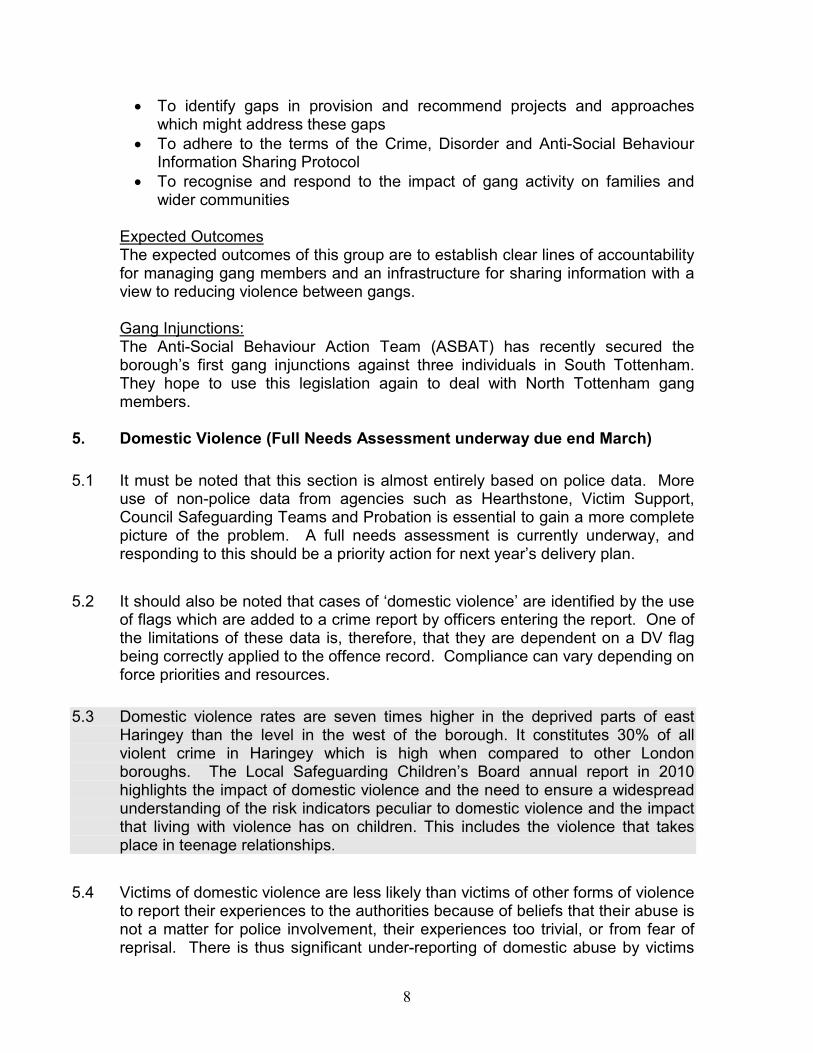
5. Domestic Violence (Full Needs Assessment underway due end March)
5.1 It must be noted that this section is almost entirely based on police data. More use of non-police data from agencies such as Hearthstone, Victim Support, Council Safeguarding Teams and Probation is essential to gain a more complete picture of the problem. A full needs assessment is currently underway, and responding to this should be a priority action for next year’s delivery plan.
5.2 It should also be noted that cases of ‘domestic violence’ are identified by the use of flags which are added to a crime report by officers entering the report. One of the limitations of these data is, therefore, that they are dependent on a DV flag being correctly applied to the offence record. Compliance can vary depending on force priorities and resources.
5.3 Domestic violence rates are seven times higher in the deprived parts of east
Haringey than the level in the west of the borough. It constitutes 30% of all violent crime in Haringey which is high when compared to other London boroughs. The Local Safeguarding Children’s Board annual report in 2010 highlights the impact of domestic violence and the need to ensure a widespread understanding of the risk indicators peculiar to domestic violence and the impact that living with violence has on children. This includes the violence that takes place in teenage relationships.
5.4 Victims of domestic violence are less likely than victims of other forms of violence to report their experiences to the authorities because of beliefs that their abuse is not a matter for police involvement, their experiences too trivial, or from fear of reprisal. There is thus significant under-reporting of domestic abuse by victims

9
with an estimated 21% of incidents being reported to the police (Walby and Allen, 2004).
5.5 Victims are predominantly young with the 21 – 33 age group accounting for 45% or all victims. 25 is the peak age. Residents in single adult households with children, social renters and those living in the top 20% most deprived areas are at significantly higher risk. Data from London Probation and the Hearthstone DV facility indicate that female victims have considerable mental health problems and are at a much higher risk from a partner or ex-partner than current or former spouse.
5.6 Of the 165 women interviewed in a recent British Crime Survey; three quarters were repeat victims with nearly one third having been victimised three or more times.
5.7 In the 12 months to September 2011 there were 1,420 DV offences3 (DV in Haringey was ranked 17th highest in London for FY 2010/11). DV recorded offences have not differed significantly during the last 12 months (3.9% reduction or n=58) and total DV offences for the last two 12 month periods are lower than for the previous 3 years.
5.8 There has been a steady falling trend since 2006/7 of 15% (258 fewer records) which conflicts somewhat with reports from colleagues and partners who are detecting high levels of domestic violence among their client groups. Probation data suggest very high levels of domestic violence among their community case load (between 70% – 82%). Domestic abuse is also a feature of the current nominals on the Gang Action Group.
5.9 DV accounts for 30% of violence against the person and 6% of total recorded offences and has remained at around this average proportion for the past few years. However, given the caveats above, it could be much more significant.
5.10 Half of all offences occur over the weekends with a fifth occurring late at night and into the early hours of the morning, reflecting periods of increased contact between partners and families
6. Mental health 6.1 People with mental health problems are more frequently victims than perpetrators.
Responses to a widely recognised 2009 MIND survey concluded that:
3 Figures taken from the Financial Year End MPS TP Weekly Scorecard

10
Ø 71% of people with mental health issues had been victimised in the previous 2 years
Ø Over three quarters living in local authority housing had been victimised Ø 41% were victims of ongoing bullying Ø 22% had been physically assaulted
6.2 The prevalence of mental health reports in the borough relate closely to secure and
high density housing provision and, of course, the St Ann’s hospital site. Having said this, mental disorders and depression correlate strongly with substance misuse, unemployment and general ill health.
6.3 Haringey has recently launched Mental Health First Aid Training that is evidence-
based and has been developed and regulated by the National Institute for Mental Health in England (NIMHE). It covers the causes, symptoms and treatments of common mental health problems. Its aim is to offer a range of front-line workers (including probation officers, librarian, school staff) the knowledge and confidence to recognise signs of mental health problems, encourage someone to seek the right help, and to reduce the stigma around mental illness.
7. Impact of the riots (2011) 7.1 The riots in Haringey took place in two distinct areas, adjacent to the two arterial
high roads (N17 and N22). Of the 2,222 crimes recorded in Haringey during August, 303 (14%) related to the disorder between 6th-11th August. This was joint highest with Croydon of the 15 local authorities affected.
7.2 The main crimes recorded were: property related (50%), criminal damage to buildings inc arson (36%), violent offences (7%), other (7%)
7.3 Wood Green is a key hotspot for gang-related crime but a high proportion of
these offences was recorded during the riots (6 – 10th August 2011). One third (56) of the overall annual gang-related offences was recorded during the riots and three quarters of the Wood Green gang offences (26) were recorded during this period.
7.4 28 youths have so far been before the courts for riot-related offences. 30% of this group are from a ‘Black Other’ background; 20% from Black Caribbean and 18% White UK. Contrary to public opinion, it has been consistently estimated that youths accounted for 20% of the total offences committed during the riots but not everyone has yet been processed so there is no final confirmation.
7.5 It is recognised that the causes of these riots were multifarious. However, they have unfortunately raised some old wounds in the community, raising police/community understanding, interface and relationship building as a priority for the coming year.

11
8. Re-offending 8.1 As well as making up a much smaller proportion of all offenders (16.5% of the
total) than men, women are also less likely to re-offend than men, although not significantly so. Of women who had proceedings brought against them, 9.3% were charged for the 3rd or more time, compared with 13% of men. Conversely women were more likely to receive less serious sanctions, such as cautions or fixed penalty notices, than men.
8.2 Particular crime types which featured high levels of re-offending were drug
trafficking (41.7%), burglary in other buildings (31.4%) and personal robbery (26.8%) charged for the 3rd or more time. Property criminals are unsurprisingly prone to re-offend but there are high levels of persistent crime among gang nominals and those committing serious wounding. Serious wounding accounts for 18% of those re-offending for the 3rd time or more.
8.3 White accused offenders were most likely to re-offend, with 47.7% charged for
the 3rd or more time, slightly more than Black accused who account for 45.7%. Asian and Other accused were the least likely to re-offend for a 3rd time or more representing 5.2% and 1.2% respectively. Re-offending rates appear to increase with age up to the early twenties, after which they stabilise before trailing off slowly by the mid-forties.
8.4 The criminogenic needs of offenders are well documented. The chart below gives a snapshot from a recent probation caseload which is indicative. Of these pathways, Haringey has particularly acute needs around employment, stable accommodation and lifestyle associates. Thinking and attitude issues are paramount.
Haringey Probation population and drug misuse by criminogenic need
Sept 2010 - Nov 2011
0%
10%
20%
30%
40%
50%
60%
70%
80%
90%
100%
Accommodation
ETE *
Finance
Relationsh ips
Lifestyle
Emotional
Thinking
Attitudes
Alcohol_All_LPA
Criminogenic need
% of populations
Haringey Probation - Misusing
Haringey Probation - Not misusing

12
8.5 Recorded offences for youth offending have reduced by 30% over the past year from 1,210 offences committed by 489 individuals to 845 committed by 386. However, many young offenders are still awaiting sentence since the August disturbances so this may distort the picture. The successful triage process operating in Haringey YOS may also have had an impact.
8.6 The most common offence types were theft (21%), robbery, violence against the
person and drug-related. Repeat offenders make up 48% of youth offences, accounting for 76% of all offences.
8.7 The peak offending age for young males is 14 years (22% of the total) and 17 years (60%) for girls. These age groups are strongly over-represented in the criminal justice system relative to their numbers in the local population.
8.8 Using the school census data, black boys remain over-represented with an index score of 157 (100 of above indicates over-representation) and white girls even more so with an index score of 175.
8.9 Similar to adult profiles, the ASSET scores for youths indicate the highest risk factors as ‘Thinking and Behaviour’, ‘Lifestyle’ and ‘Attitudes to offending’. The lowest risks registered as ‘physical health’, ‘substance misuse’ and ‘neighbourhood’.
9. Initial areas of concern (not including drug and alcohol specific)
Ø Sharp rises in property crime (links to unemployment, growing inequality, reduced
social investment). Forthcoming welfare reform is set to further exacerbate the situation
Ø Concentrated crime/disorder in key wards (e.g. Noel Park, Northumberland Park, Tottenham Green, Tottenham Hale, Bruce Grove)
Ø Noel Park continues to be a significant hotspot for which will need to be addressed within the plan
Ø Gang-related violence (often with weapons) Ø Young victims inc young adult (esp of violence) Ø Domestic violence – significance, under-reporting, impact on young people Ø Young male offenders and victims of Black Caribbean origin Ø Police/community relations in Tottenham (recent consultations) Ø Few if any resources identifiable to manage offenders beyond PPO and DIP cohorts Ø Recent borough-wide consultation highlighted a strong concern with lack of
environmental enforcement (inc. housing (HMOs), planning, landlords etc). 10. Current responses / what works Experience and review indicates that our interventions and responses outlined below are likely to be the most successful in the long run. They rely heavily on a holistic

13
approach and robust partnership collaboration. Most of them also require highly skilled staff over a sustained period and are, therefore, resource intensive. 1. Diversion from the criminal justice system. Examples of this include the triage
system for young offenders operating in Haringey YOS; forensic/mental health assessments by nurses in custody suites
3. Targeted, individual intervention and support. Examples include Priority and Prolific Offenders Scheme (PPOs), Drug Intervention Projects, Gang Action Group, Family Intervention, Nursing Partnerships, Offender resettlement brokering
4. Visible neighbourhood policing with strong community links and attention to lower level incidents, early intervention and confidence building
5. Swift, effective and early enforcement. Examples include use of all ASB tools inc behavioural contracts, injunctions, ASBOs; police rapid response teams (eg Q Cars); environmental enforcement inc all forms of licensing
6. Activities and specific facilities for young people e.g. sport and leisure especially if also combined with education back up and pathways into work as a prevention measure
Designing out crime at early planning stages can also be very effective.