Strategic and Financial Valuation of - AU...
89
Strategic and Financial Valuation of MSc Finance & International Business Department of Business Studies Author: Vilhjálmur Pétursson Aarhus School of Business Student number: 282210 Aarhus University Academic advisor: Baran Siyahhan June 2011
Transcript of Strategic and Financial Valuation of - AU...

Strategic and Financial Valuation of
MSc Finance & International Business Department of Business Studies
Author: Vilhjálmur Pétursson Aarhus School of Business
Student number: 282210 Aarhus University
Academic advisor: Baran Siyahhan June 2011

Preface
First of all, I want to thank my mother, Hjördís Vilhjálmsdóttir teacher in
Grundarfjörður, for showing me endless support and interest in this thesis. I also want to
thank my brother, Jón Pétur Pétursson, and my best friend, Magnús Már Þorvarðarson,
for being there for me in the writing process. I furthermore, want to express my
gratitude to Mr. Jóhannes Gíslason for proofreading this thesis and my academic
advisor, Mr. Baran Siyahhan, for his instructions and assistance.
Table of Contents
1 Introduction ............................................................................................................ 1
1.1 Problem Statement ............................................................................................. 2
1.2 Structure of the thesis ........................................................................................ 2
1.3 Methodology and models ................................................................................... 4
1.4 Data collection ................................................................................................... 5
1.5 Delimitation ....................................................................................................... 6
2 Icelandair Group .................................................................................................... 6
2.1 The history ......................................................................................................... 7
2.2 The business model ............................................................................................ 9
2.2.1 The Route Network .................................................................................. 10
2.2.2 The Tourism Services ............................................................................... 12
2.2.3 Discontinued Businesses .......................................................................... 14
3.2 Summary .......................................................................................................... 14
3 Financial restructuring ........................................................................................ 15
3.1 Background of the financial restructuring ....................................................... 15
3.2 The implementation ......................................................................................... 16
3.3 The capital structure ......................................................................................... 18
3.4 Summary .......................................................................................................... 20
4 Strategic analysis .................................................................................................. 21
4.1 PESTEL analysis ............................................................................................. 22
4.1.1 Political factors ......................................................................................... 22
4.1.2 Economic factors ...................................................................................... 24
4.1.3 Socio-cultural factors ................................................................................ 27
4.1.4 Technological factors ............................................................................... 29
4.1.5 Environmental factors............................................................................... 31
4.1.6 Legal factors ............................................................................................. 32

4.2 Porter„s five forces ........................................................................................... 33
4.2.1 Threat of new entrants .............................................................................. 34
4.2.2 Intensity of competitive rivalry ................................................................ 35
4.2.3 Substitute products ................................................................................... 36
4.2.4 Bargaining power of customers ................................................................ 37
4.2.5 Bargaining power of suppliers .................................................................. 38
4.3 Icelandair Groups core competences ............................................................... 39
4.4 SWOT analysis ................................................................................................ 41
4.5 Summary .......................................................................................................... 41
5 Financial analysis .................................................................................................. 41
5.1 Financial Statement Analysis ........................................................................... 42
5.2 Organic revenue growth ................................................................................... 44
5.3 ROCE, ROIC and financial leverage ............................................................... 45
5.4 Operating costs and cost drivers ...................................................................... 47
5.5 Summary .......................................................................................................... 49
6 Forecasting ............................................................................................................ 50
6.1 The explicit forecast period ............................................................................. 50
6.2 The revenue forecast ........................................................................................ 50
6.3 Financial statements forecast ........................................................................... 52
6.4 Summary .......................................................................................................... 54
7 Valuation ............................................................................................................... 54
7.1 Valuation models ............................................................................................. 54
7.2 WACC ............................................................................................................. 56
7.3 Valuation results .............................................................................................. 59
7.3.1 Enterprise DCF ......................................................................................... 60
7.3.2 Discounted Economic-Profit .................................................................... 60
7.3.3 Multiples ................................................................................................... 61

7.4 Scenarios and sensitivity analysis .................................................................... 62
7.5 Summary .......................................................................................................... 63
8 Conclusion ............................................................................................................. 64
9 References.............................................................................................................. 67
10 Appendices ............................................................................................................ 73
10.1 Historical NOPLAT ..................................................................................... 73
10.2 Historical invested capital ............................................................................ 73
10.3 Historical FCF .............................................................................................. 74
10.4 Operating cash taxes..................................................................................... 75
10.5 Capitalized operating leases ......................................................................... 75
10.6 Historical ROIC break-down ....................................................................... 76
10.7 Performance ratios........................................................................................ 77
10.8 Historical total operating income, expenses & profit ................................... 77
10.9 Weighted GDP forecast ................................................................................ 78
10.10 The revenue forecast .................................................................................... 79
10.11 Weighted risk free rate ................................................................................. 80
10.12 Beta regression output .................................................................................. 80
10.13 Estimated share price comparison between valuation models ..................... 81
10.14 Discounted FCF, continuing value and non-operating assets ...................... 81
10.15 Multiples....................................................................................................... 82
10.16 Peer group comparison based on the Orbis financial database .................... 83
10.17 Sensitivity analyses ...................................................................................... 83
Table of Figures
Figure 1.1: Book value vs fair value of companies .......................................................... 2
Figure 1.2: Thesis structure .............................................................................................. 2
Figure 1.3: The valuation process: Strategy-Activity-Return .......................................... 5
Figure 2.1: The Subsidiaries ............................................................................................. 9
Figure 2.2: Revenue contribution by subsidiaries 2007-1H 2010. ................................... 9
Figure 3.1: Icelandair Groups share price and turnover 2006-2011 ............................... 16
Figure 3.2: The 3 components of the financial restructuring ......................................... 18
Figure 3.3: Ownership structure ..................................................................................... 18
Figure 3.4: Total assets 31.12.2010 ................................................................................ 19
Figure 3.5: Total equity and liabilities 31.12.2010......................................................... 20
Figure 3.6: The restructured maturity profile ................................................................. 20
Figure 4.1: Layers of the business environment ............................................................. 21
Figure 4.2: The PESTEL framework .............................................................................. 22
Figure 4.3: Changes in air service regulation ................................................................. 23
Figure 4.4: Jet Fuel and Crude Oil Prices ($/barrel)....................................................... 25
Figure 4.5: Total revenues and expenses 2010 split down to currencies ....................... 27
Figure 4.6: Porter's five forces ........................................................................................ 34
Figure 4.7: SWOT .......................................................................................................... 41
Figure 5.1: Organic revenue growth 2007-2010 ............................................................ 45
Figure 5.2: ROCE tree .................................................................................................... 45
Figure 5.3: Financial leverage ........................................................................................ 46
Figure 5.4: ROIC break-down ........................................................................................ 47
Figure 5.5: The peer groups operating margin break-down ........................................... 48
Figure 5.6: Labor expense break-down .......................................................................... 48
Figure 5.7: Labor expense drivers .................................................................................. 49
Figure 6.1: Total revenue contribution by regions 2010 ................................................ 51
Figure 6.2: Operation costs as percentage of revenues 2006-2010 ................................ 53
Figure 7.1: DCF frameworks .......................................................................................... 55
Figure 7.2: The estimated WACC .................................................................................. 56
Figure 7.3: From enterprise value to value per share ..................................................... 60
Figure 7.4: Discounted economic profit valuation ......................................................... 61
Figure 7.5: Worst case and best case scenarios .............................................................. 62
Figure 7.6: Sensitivity analysis with terminal growth rate and the WACC ................... 63
-1-
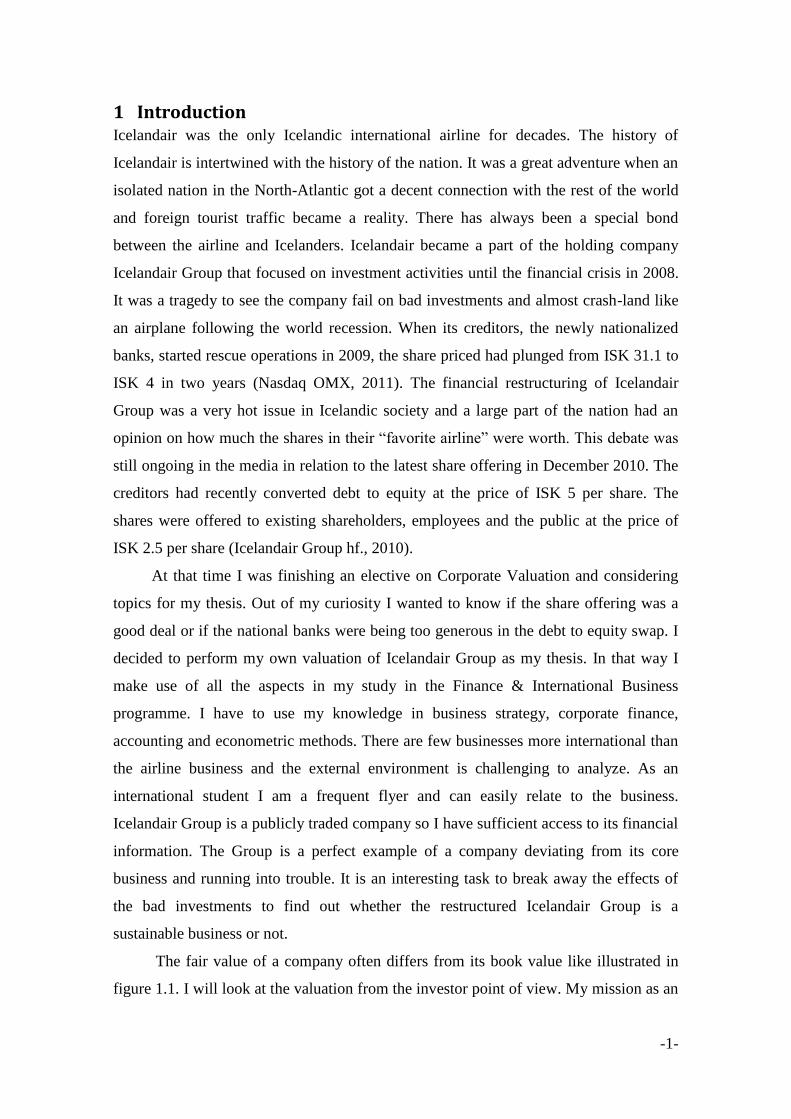
1 Introduction Icelandair was the only Icelandic international airline for decades. The history of
Icelandair is intertwined with the history of the nation. It was a great adventure when an
isolated nation in the North-Atlantic got a decent connection with the rest of the world
and foreign tourist traffic became a reality. There has always been a special bond
between the airline and Icelanders. Icelandair became a part of the holding company
Icelandair Group that focused on investment activities until the financial crisis in 2008.
It was a tragedy to see the company fail on bad investments and almost crash-land like
an airplane following the world recession. When its creditors, the newly nationalized
banks, started rescue operations in 2009, the share priced had plunged from ISK 31.1 to
ISK 4 in two years (Nasdaq OMX, 2011). The financial restructuring of Icelandair
Group was a very hot issue in Icelandic society and a large part of the nation had an
opinion on how much the shares in their “favorite airline” were worth. This debate was
still ongoing in the media in relation to the latest share offering in December 2010. The
creditors had recently converted debt to equity at the price of ISK 5 per share. The
shares were offered to existing shareholders, employees and the public at the price of
ISK 2.5 per share (Icelandair Group hf., 2010).
At that time I was finishing an elective on Corporate Valuation and considering
topics for my thesis. Out of my curiosity I wanted to know if the share offering was a
good deal or if the national banks were being too generous in the debt to equity swap. I
decided to perform my own valuation of Icelandair Group as my thesis. In that way I
make use of all the aspects in my study in the Finance & International Business
programme. I have to use my knowledge in business strategy, corporate finance,
accounting and econometric methods. There are few businesses more international than
the airline business and the external environment is challenging to analyze. As an
international student I am a frequent flyer and can easily relate to the business.
Icelandair Group is a publicly traded company so I have sufficient access to its financial
information. The Group is a perfect example of a company deviating from its core
business and running into trouble. It is an interesting task to break away the effects of
the bad investments to find out whether the restructured Icelandair Group is a
sustainable business or not.
The fair value of a company often differs from its book value like illustrated in
figure 1.1. I will look at the valuation from the investor point of view. My mission as an

-2-
investor is to evaluate how capable
Icelandair Group is in maximizing my
capital inputs and eventually
returning cash in the form of
dividends or capital gain. I have to
identify and predict whether the
reported profit is due to fiction in the
accounting or if the profit can be
realized.
The key findings of this thesis are that Icelandair Group has competitive
advantages in a price premium on its home market and capital efficiency on the
transatlantic route. The fair value was estimated ISK 4.98 per share. That is the result of
applying the enterprise DCF model and the discounted economic profit model. The
estimated fair value is 5.5% higher than the market price on 10th
of May which was ISK
4.71 per share. Valuation with multiples resulted in a share price of ISK 3.44 and ISK
6.52 per share.
1.1 Problem Statement
What is the estimated fair value per share of Icelandair Group hf1on May 10
th
2011?
1.2 Structure of the thesis Figure 1.2 presents the structure of the thesis.
Figure 1.2: Thesis structure
Source: Own creation.
1 Hf is short for Hlutafélag wich means Public Limited Comany.
Figure 1.1: Book value vs fair value of companies
Source: Own creation.

-3-
In order to reach a sensible fair value I will answer supporting research questions in
each chapter that eventually help me summarizing the main findings.
In chapter 2 I introduce Icelandair Group to the reader and subsequently answer the
following questions that are meant to give a glimpse on its current situation and explain
why there became a need for change:
Icelandair Group
Which events in history have influenced the Group‟s current strategic and
financial position the most?
How is the Group composited?
What is the basis of the business model?
What is the future strategy?
In chapter 3 I cover the overhaul of the Group in its financial restructuring and by
answering the subsequent research questions I will show how its financial position has
improved:
Financial restructuring
What were the reasons for the financial restructuring?
How was the financial position before?
What where the main procedures in the restructuring process?
How is the financial position after the restructuring process?
In chapter 4 I discuss and evaluate the Groups main external threats. The answers to the
following research questions describe how the business strategy can be applied in
defense for the company‟s survival in the industry:
Strategic analysis
Which external macroeconomic factors influence Icelandair Group?
What is the strength of the competitive factors in the airline and tourism
industry?
Has Icelandair Group any competitive advantages?
In chapter 5 I reveal the accounting numbers to discover the actual operating
performance of Icelandair Group. A company‟s value is driven by its ability to earn a
healthy return on invested capital and by its ability to grow (Tim Koller, 2010). The

-4-
following research questions support the analysis of the key value drivers. Knowledge
of their historical pattern gives an indication of how they might develop in the future.
Financial analysis
How were the financial statements reformulated?
What is the historical organic revenue growth?
What is the historical growth in ROIC?
How does Icelandair Groups operating margin compare to its competitors?
In chapter 6 I describe the forecast process. As most of the individual line items in the
financial statements forecasts are based on the forecasted revenue growth, it is
extremely important to identify the Groups proper revenue drivers. The answers to the
subsequent research questions are used in the preparation for the forecast:
Forecasting
How long explicit forecast period is appropriate?
What are the main forecast drivers?
In chapter 7 I discount the forecasted free cash flow to get the estimated share price. To
finish the calculations, a suitable valuation model for this job is required. The following
research questions assist in the search for the right models. Furthermore they are meant
to explain how the model inputs are estimated and how sensitive the share price is to
variation in the inputs:
Valuation
Which valuation models are appropriate?
How is the required return (WACC) calculated?
How does the fair value change with different valuation inputs?
I will answer the research questions in the summaries at the end of each chapter and
give a final conclusion of them in chapter 8. The research questions help me keeping a
clear focus on the path toward the fair value of Icelandair Group hf.
1.3 Methodology and models I am going to evaluate how the macro-economic and industry factors form Icelandair
Groups strategy and how the Group exploits its strategy in its operating activities to
provide a return for the group of interest. The return serves as a feedback for the

-5-
management to see whether the strategy is functioning or if there is need for re-
designing. Although the return is satisfying the strategy can be played out by new
changes in the external business environment. My approach is to link these factors and
base my estimated fair value on the process presented in figure 1.3.
Figure 1.3: The valuation process: Strategy-Activity-Return
Source: Own creation2.
The accounting captures the profit from operations. The accounting is not a useful tool
to evaluate the business from shareholders point of view because of manipulating. I
prefer to base my estimates on tangent cash from operations that is not subject to
accounting tricks nor fiction. I will also uncover the effects of non-recurring events and
effects that are not in the control of the management, like currency fluctuations. Then I
can evaluate how good Icelandair Groups core operations are in turning inputs into cash.
In the strategic analysis I apply the PESTEL framework (Johnson, Scholes, &
Whittington, 2006) to investigate how the strategy is affected by influences in the
macro-environment. To account for the competitive forces in the industry, I use the
Porter‟s five forces model (Porter, 1980). The results of such analyses could be used to
form a company strategy in order to hedge against known threats and capitalize on
possible opportunities. In the valuation part I apply the following models: the CAPM,
the Enterprise DCF, the Discounted Economic Profit and valuation with Multiples (Tim
Koller, 2010). The models will be further introduced in the relevant chapters.
1.4 Data collection I only use publicly available information in this thesis. My primary sources about
Icelandair Group are its annual reports and a prospectus published in relation with the
share offering at the end of 2010. Other information I collected from news reports,
journal articles and web sites. I use the Bloomberg terminal and the Orbis financial
database to collect information about the peers. I rely mostly on qualitative information
2 Based on my own notes from Dr Mahbub Zamans‟ lectures in International Financial Accounting II the
6th
-7th
May 2010.

-6-
from Porter‟s (1980) theories in the strategic part. In the financial part of the thesis the
quantitative information from Koller et.al (2010) is my central guideline.
1.5 Delimitation Valuation is not an objective exercise and any preconceptions and biases that an analyst
brings to the process will find its way into the value (Damodaran, 2002). As an
Icelander valuing the nation‟s airline I will do my best in avoiding biases by keeping a
neutral but critical focus. To prevent repetition, I often just refer to the airline industry
instead of the airline and tourism industry, as the two are closely related. Due to the
scope of this thesis I do not make assumptions about uncertain economical factors like
interest rates and currency fluctuations. Furthermore, I focus primarily on Icelandair
Group and its business. Therefore I will neither describe the competitors that I mention
precisely nor the peer group3.
The CEO Björgólfur Jóhannsson mentioned in his speech at the presentation of
first quarter results 2011, the Groups current aircraft fleet is expected to be sufficient for
up to 10 years of future operations. Based on this statement, I will not predict about the
renewal of the aircraft fleet as that would change the estimates significantly. The
operating leases are capitalized according to the current repayment schedule (Icelandair,
2011).
Lastly, I expect the reader to have a basic understanding in the field of business
strategy and corporate finance. As a result, the background and history of theories
applied will not be explained in detail.
2 Icelandair Group In this chapter4 I will give the reader an overview of the company in order to display
how it has reached its current position. I start off by presenting the key milestones in the
history of Icelandair Group. Although the Group in its current form was founded in
2006, the roots of the company reach over 70 years back. It all started with the two
founding airlines, Flugfélag Íslands and Loftleiðir.
Following I will explain the most important elements of the business model and
the business sectors.
3 Financial Information about the peer group can be found in Appendices 10.15 and 10.16.
4 This chapter is based on Icelandair Groups annual reports and Prospecus published in relation to the
share offering at year end 2010.

-7-
Finally I give the reader insight into the subsidiaries and an introduction of their
operations. I will also briefly talk about the businesses that are currently being divested
to see what kind of operations the Group is moving away from.
2.1 The history The history of Icelandair Group began already back in 1937, when its forerunner
Flugfélag Akureyrar was established. The company started domestic flight with a single
seaplane which was a very daring step as previous attempts by Icelanders to launch
commercial flights had failed. When the company moved its headquarters from the
north coast to the capital, Reykjavík, in 1943 the name was changed to Flugfélag
Íslands which later became internationally known as Icelandair. In 1944, three young
pioneering pilots returning from flight training in Canada founded another domestic
airline called Loftleiðir or Icelandic Airlines.
In 1945 Flugfélag Íslands started air transportation to Scotland and Denmark and
two years later Loftleiðir followed and started international operations. Loftleiðir took a
ground-breaking step in 1953 by offering low-fare flights the shortest way across the
North-Atlantic and introduced Iceland as a stop-over destination. This shook up the
competition on the transatlantic route and many people are quite familiar with Lofleiðir
as the airline that made flights to the other side of the ocean affordable.
Flugfélag Íslands acquired Iceland‟s first jet in 1967 a Boeing 727-100C which
was specially suited for the airline. The two companies merged in 1973 after
government intervention in the market. In 1979 the new company took up the Icelandic
domestic name Flugleiðir and the international trade name Icelandair (Icelandair Group
hf., 2010).
The next important steps in the company‟s history were the listing on the
Icelandic stock exchange in 1992 and when Icelandair completed the total renewal of
the international aircraft fleet in 1993 following a breakthrough agreement with the
Boeing Company. The development of the tourist services made a big jump in 1996.
Icelandair acquired one of Iceland‟s largest travel agency and followed up with a
substantial marketing campaign to promote the country.
Flugfélag Norðulands merged with Icelandairs domestic flight operations and
became Air Iceland, a wholly-owned subsidiary in 1997. In 1998 Icelandair Hotels
became a distinct subsidiary and so did Icelandair Cargo in 2000. Both of these had
been part of the Icelandair‟s operations before (Icelandair, 2011). The Icelandic Ground
-8-
Services (IGS) where founded in 2001 and the wet lease5 and charter subsidiary
Loftleiðir-Icelandic a year later.
In the next couple of years the aviation company deviated from their core
operations and went through fundamental changes in terms of structure and ownership.
In January 2003, Icelandair became a holding company with 11 subsidiaries within the
travel and tourist industry which acquired an 8.4% holding in EasyJet in 2004. The
name was changed to FL Group in 2005 and the focus was shifted to investment
activities. FL Group‟s airline and tourist service were operated through two subsidiaries,
Icelandair Group and FL Travel Group.
The history of the group in its current form began in October 2006. Three core
investors founded Icelandair Group Holding hf6 which on the same day acquired all the
shares in Icelandair Group. The parent company was listed on the Main Market of
NASDAQ OMX Iceland in December 2006. The only asset of Icelandair Group
Holding hf was the shares in Icelandair Group and the companies merged as of 1
November 2006 under the latter name. In February 2007 the shareholders of Icelandair
Group Holding hf agreed to delist that company and Icelandair Group was listed
instead.
It is safe to say that the new company stuck to the new investment strategy. In
the years 2006-2008 the operations were wildly expanded abroad and mainly financed
with new borrowings. Among acquisitions were the Latvian charter airline Latcharter,
later known as Smart Lynx. Airline Services Estonia was acquired which is an Estonian
accountancy firm and also Travel Service, the largest privately owned airline in the
Czech Republic. Furthermore a Franchise Agreement was made with Hilton Hotels
Corporation for the 252 room 4-star Nordica Hotel in Reykjavík.
After Iceland was hit hard by the financial crisis in 2008 the shareholder structure
of the Group changed significantly. Two of the three largest banks in Iceland and their
resolution committees acquired large stakes in Icelandair Group through enforcement of
a pledge of shares held by shareholders. At the end of 2009 Íslandsbanki hf held 47%
and Landsbanki Íslands held 23.8% of the shares (Icelandair Group, 2010). Due to the
circumstances, the Financial Supervisory Authority granted Íslandsbanki an exemption
from having to make a mandatory offer for the remaining share capital. It was decided
5 The leasing of an aircraft including crew, maintenance and insurance, usually for a very short period of
time. 6 Hf is short for Hlutafélag wich means Public Limited Comany.
-9-
that these shares should be sold in an open and a transparent sales procedure. Icelandair
Group had to go through financial restructuring and the business model simplified
(Icelandair Group, 2009).
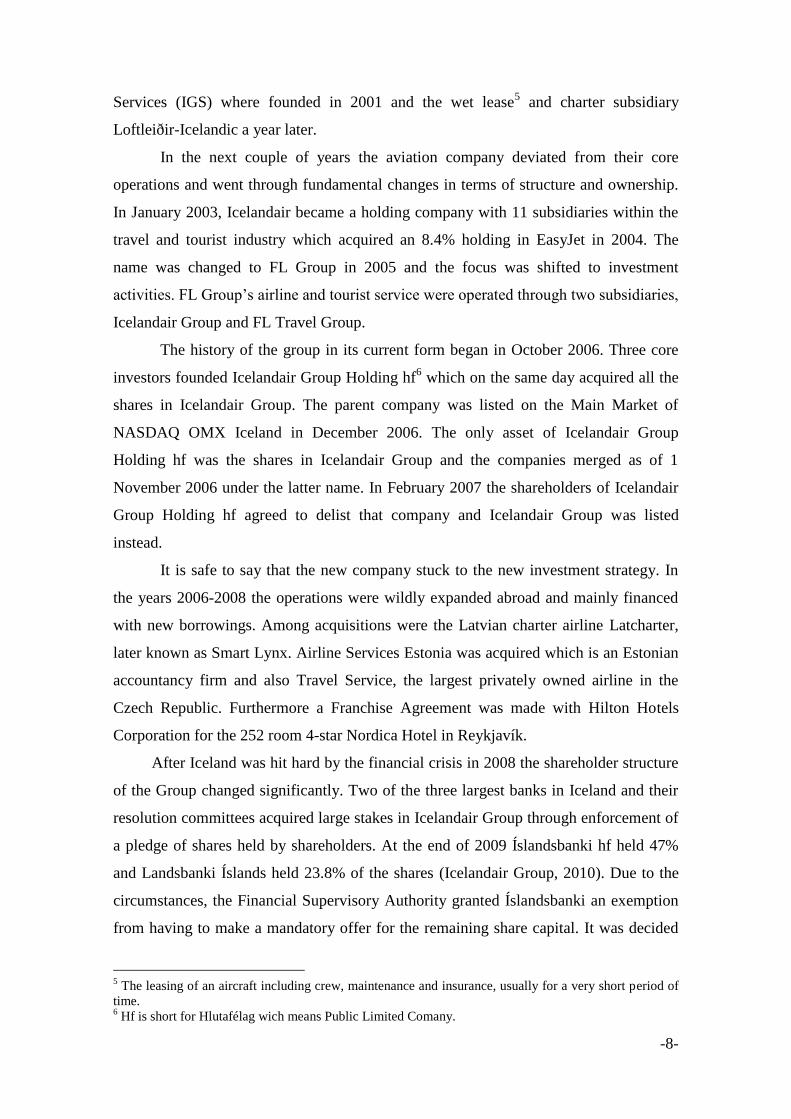
2.2 The business model Icelandair Group has shifted its focus to the core operations and has redefined itself as
an operating Group in aviation and tourism. Its two main business areas are The Route
Network and The Tourism services. The subsidiaries are placed accordingly into the
two categories like presented in figure 2.1.
Figure 2.1: The Subsidiaries
Source:Own creation & Icelandair Group Prospectus (2010).
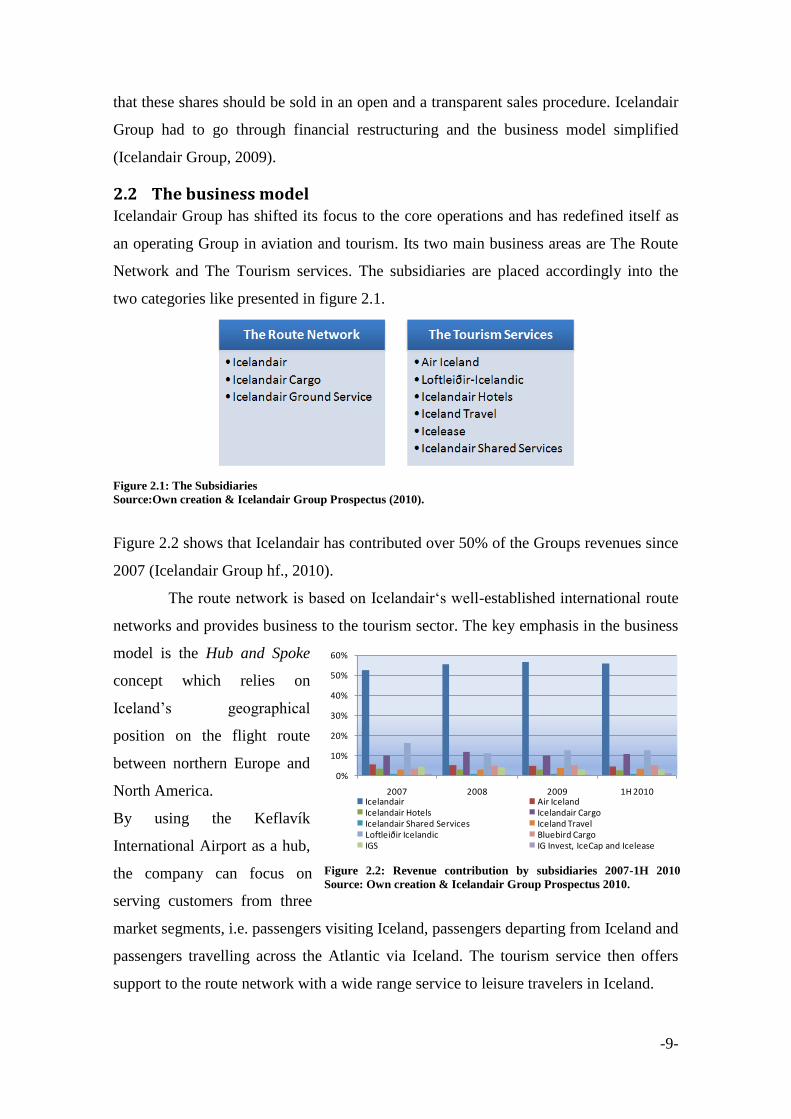
Figure 2.2 shows that Icelandair has contributed over 50% of the Groups revenues since
2007 (Icelandair Group hf., 2010).
The route network is based on Icelandair„s well-established international route
networks and provides business to the tourism sector. The key emphasis in the business
model is the Hub and Spoke
concept which relies on
Iceland‟s geographical
position on the flight route
between northern Europe and
North America.
By using the Keflavík
International Airport as a hub,
the company can focus on
serving customers from three
market segments, i.e. passengers visiting Iceland, passengers departing from Iceland and
passengers travelling across the Atlantic via Iceland. The tourism service then offers
support to the route network with a wide range service to leisure travelers in Iceland.
0%
10%
20%
30%
40%
50%
60%
2007 2008 2009 1H 2010Icelandair Air IcelandIcelandair Hotels Icelandair CargoIcelandair Shared Services Iceland TravelLoftleiðir Icelandic Bluebird CargoIGS IG Invest, IceCap and Icelease
Figure 2.2: Revenue contribution by subsidiaries 2007-1H 2010
Source: Own creation & Icelandair Group Prospectus 2010.

-10-
2.2.1 The Route Network There are 3 subsidiaries that are part of the Route Network and all of them are 100%
owned by the Group. These are Icelandair, Icelandair Cargo and Icelandair Ground
Service. There were four subsidiaries in the Route Network in 2010, until Bluebird
Cargo was divested at the year end.
Icelandair ehf7
Icelandair is the national flag carrier of Iceland with over 70
years experience in the aviation business. It is one of the longest
serving airline names in the world and has been a member of the
International Air Transport Association (IATA) since 1950, a member of the
Association of European Airlines8 since 1957 and a member of the Flight Safety
Foundation9 since 1966 (Icelandair, 2011).
Icelandair is the Groups main cash cow and the center of its operations. The airline
provided 59% of the total income in 2010 (Icelandair, 2011). The company has used its
long experience and know-how to build up a solid network. The network has
successfully been expanded steadily by linking the three markets, “TO”, “FROM” and
“VIA”, using the same aircraft and the same route network which is based on a 24 hour
rotation displayed in figure 2.2. Aircrafts departing Iceland for Europe in the early
morning, return in the late afternoon and then take off to Canada and the USA in the
early evening. The aircrafts land back in Iceland again early next morning and continue
on another route. The isolated geographical position of Iceland is used in this strategy as
a business opportunity instead of an obstacle.
7 Ehf is short for Eignarhaldsfélag which means private limited company.
8 AEA.
9 FSF.

-11-
Figure 2.3: Icelandairs route network
Source: Icelandair Group Prospectus (2010).
The “TO” market and the “VIA” market made up 38% each of the total passengers
in 2010 and passengers on the “FROM” market 24%. Icelandair carried 1.5 million
passengers in 2010 and 5 cities will be added to the summer schedule 2011. Total of 24
European cities will be directly connected to 8 North American cities through the hub in
Iceland. Icelandair operates 14 aircrafts this summer, 2 aircrafts more than the year
before. The company owns 7 Boeing 757-200 aircrafts and 1 Boeing 757-300 aircraft
(Icelandair, 2011).
Icelandair Cargo
Icelandair Cargo is the largest air freight service provider in
Iceland. The business is based on the scheduled flights between
Iceland, Europe and North America. Up to 25 of Icelandair‟s
passenger network destinations are serviced with its own cargo fleet as well as selling
cargo space on Icelandair‟s passenger aircrafts. The company‟s business is supported by
trucking networks in Europe and in the USA. It is important for the company to offer
customers a quick global service as 90% of the Icelandic exports consist of fresh
seafood and the exports account for almost 38% of its income (Icelandair Group, 2010).
Icelandair Cargo has also for many years carried express freight for TNT, DHL and
FedEx to and from Iceland. The company owns 5 Boeing 757-200 aircrafts and leases 1
Boeing 757-300 aircraft
Icelandair Ground Services

-12-
The purpose of the company is to offer airlines and passengers
at the Keflavík International airport a comprehensive airport and
ground handling service. This includes service for airlines like
overall aircraft handling at airports, passenger check-in, baggage management and meal
preparation. At the Leifur Eiriksson Air Terminal in Keflavík the company also runs a
restaurant division and a cutting edge cargo centre.
2.2.2 The Tourism Services There are 5 companies in the Tourism Services defined as subsidiaries in 100%
ownership of the Group. These are Air Iceland, Loftleiðir-Icelandic, Icelandair Hotels,
Iceland Travel and Icelandair Shared Service. In addition to those, Icelandair Group
owns 50% stake in IG Invest.
Air Iceland
Air Iceland is a dynamic domestic airline that offers flight to
seven major towns in Iceland as well as connecting flights to
some of the smaller ones. Air Iceland also offers routes from
Iceland to three year-round destinations in Greenland and two additional summer
destinations. The airline can thereby offer a strong connection point for passengers on
the route between Greenland and Denmark. Air Iceland sells flights to the Faroe Islands
all year round. The flights are operated by the Faroese airline Atlantic Airways. The
airline has therefore established a good position in servicing the West Nordic countries.
Air Iceland has a dominant position on the domestic air transport market where the
demand is picking up again after a stagnating period. Air Iceland owns 6 Fokker F-50
aircrafts and 2 Dash 8-100 aircrafts out of which one got damaged in a landing in
Greenland in March 2011 (Mbl.is, 2011).
Loftleiðir-Icelandic
Loftleidir–Icelandic is a capacity solution company for the
international passenger airlines and tour operator industries. Wet
leases have been among the main pillars of the operations
throughout the years. Today Loftleiðir-Icelandic carries out AM10
, ACMI11
and full
charter contracts in Europe, Africa, the Middle East, North and South America.
10
Aircraft and maintenance.

-13-
Operating in regions where the aviation infrastructure is considered underdeveloped
offers a higher return for greater risk. Furthermore the company has increased its
brokering activities with third-party leases and aircraft brokering. Loftleiðir-Icelandic
leases 5 Boeing-757 aircrafts and 5-Boeing 767 aircrafts.
Icelandair Hotels
Icelandair Hotel is the market leader and is currently fully
operating the Hilton Reykjavík Nordica Hotel, 2 Icelandair
Hotels and 10 Edda Hotels. Edda hotel is a summer hotel chain
widely spread around the country but serves as student housing at boarding schools
during the winter. Additional 5 Icelandair Hotels and 3 Edda Hotels are franchised,
allowing them to use the Icelandair Hotels trademark. The company rents all the hotel
facilities. Icelandair Hotels cooperates closely with Icelandair and another subsidiary,
Iceland Travel (Icelandair Group hf., 2010).
Iceland Travel
Iceland Travel is among the largest tour operators in Iceland. It
produces, markets, distributes and sells package tours to
incoming tourists, both groups and individuals. The company
cooperates with almost all the licensed vendors operating in the domestic tourist
industry for example car rentals, hotels and professional guides. The company runs the
VITA brand, which offers variety of leisure tours to Icelanders travelling abroad, taking
advantage of opportunities that stem from the company‟s partnership with Icelandair.
With intense marketing campaigns, Iceland Travel has gained significant revenue
growth from the cruise ship market which grows larger year by year in Iceland
(Icelandair Group hf., 2010).
IG Invest
Icelease and IG invest, operate as aircraft trading arrangement
companies, buying, selling and leasing aircrafts. IG Invest was
founded as a holding company for the assets of Icelease. The
11
Aircraft, crew, maintenance and insurance.

-14-
trading portfolio today consists of six passenger aircraft and four future deliveries of
Boeing 787 Dreamliner passenger aircraft with an additional three purchase options.
Icelease prefers having less than 50% stake in each investment and therefore operates
with equity partners.
Icelandair Shared Services
The subsidiary Icelandair Shared Services serves as a support
department for the companies within the Group.
The company handles finance service such as accounting,
collection, payments, payroll, tax reporting and preparation of financial statements.
2.2.3 Discontinued Businesses
Bluebird Cargo
Bluebird Cargo provided the Icelandic market with a reliable and fast access to the
world-wide air cargo networks through business relations with companies like Cargolux
Airlines, UPS Air Cargo, LTU and Luxair.
SmartLynx
SmartLynx is a charter and wet lease airline based in Riga, Latvia. The main
assignments are air charter services for tour operators in the domestic market in Latvia.
Also, wet lease12
projects in Europe and South America and dry lease13
projects.
Travel Service
Travel Service is the largest private air carrier in the Czech Republic and one of the
fastest growing charter carriers in Central Europe. The operations include charter flight,
scheduled low cost flight under the Smart Wings brand, ACMI leases and private
flights.
3.2 Summary There are many steppingstones in Icelandair Groups history that have guided the
company to its current position. The most significant is when the Group became a
holding company and shifted the focus to investing activities in 2005. Icelandair Groups
12
The leasing of an aircraft including crew, maintenance and insurance, usually for a very short period of
time. 13
Leasing of an aircraft without insurance, crew, ground staff, supporting equipment, maintenance, etc.

-15-
is an operating company today with a clear future focus on the route network business
with 3 subsidiaries and tourist services offered by 6 subsidiaries. Icelandair‟s Hub and
Spoke concept is the center of the business model.
3 Financial restructuring In the preceding chapter, I described how Icelandair Group went from being a
successful airline with a simple business concept to become a holding company that lost
sight of the core activities.
In this chapter I will cover the background of the financial restructuring that the
Group went through after the financial crisis in 2008.
Next I am going to show the financial position of the Group before and after the
rescue operations by digging into the capital structure.
3.1 Background of the financial restructuring Icelandair Group was left in bad shape after the years when investments, acquisitions
and expansion abroad were among the main strategies of the company. The Group was
overleveraged and the balance sheet was not sustainable. It was clear even before the
financial turbulence in Iceland that something had to be done to lighten the extremely
high debt burden which had piled up during the investment period.
If it had not been for the major cost-cutting measures in the first half of 2008, the
company would likely not have survived the downturn in 2008 and early 2009. More
than 500 employees were let go, capacity was reduced, followed by renegotiations with
suppliers. Orders for four new Airbus 330 cargo aircraft were cancelled, which reduced
the Groups commitments by USD 450 millions (Icelandair, 2010).
The operational environment for Icelandair Group got very difficult when the
Icelandic banking system collapsed in 2008 and the recession hit the world. Domestic
demand decreased significantly because the inflation rate went from 5.8% at the start of
2008 to 18.6% at the start of 2009. The Krona depreciated 127% from July 2007 to
December 2008 (Central Bank of Iceland, 2011). Most of the Groups borrowings were
denominated in foreign currency. Strain was put on cash flow after the termination of
the Groups banking service and the international money market demanded increased
cash collateral to replace bank guarantees. Refinancing became difficult for the Group
and the liquidity dried up almost all together. Although the daily operations in 2009
went well and according to the plan, the financial expenses were a drain on the Groups
cash flow. The balance sheet had to be restructured (Icelandair Group hf., 2010).

-16-
3.2 The implementation The financial restructuring had to be done in such a way that it maximized the benefits
of the shareholders. In this case the largest stakeholders were two state owned banks,
Íslandsbanki hf and Landsbanki Íslands that were the Groups biggest lenders. The two
banks and their resolution committees acquired 70.8% holding (Icelandair, 2011).
There are number of procedures available to improve a company‟s financial
position but given the Group‟s history, owner structure and capital structure, there were
in my opinion not that many suitable options. If the Icelandair Group had been
liquidated there would not have been any recovery. The debt ratio was 83.6% at the end
of 2009. The management would not have gotten high returns for the assets if they
would have been sold on a fire sale. In my opinion, this option was also not acceptable
because of how much the Icelandair and its history mean for the nation. It should be
kept in mind that the banks had just been nationalized. There are three restructuring
strategies that firms use according to Hitt et al. (2005). These are leveraged buyouts,
downsizing, and downscoping. The company had already gone through downscoping in
2008-2009.
Executing a leveraged buyout at the time would have been difficult. Foreigners
avoided investments opportunities in a country with capital restrictions. There were no
large individual investors on Iceland likely to invest significantly in the company after
the company had changed the strategy completely and invested precious capital and
management effort on assets that failed. The share priced had dropped 87% from 31.07
Krones14
per share the 10th of July 2007 to 4.00 Krones per share on the 20th of May
2009 like described in figure 3.1. (Nasdaq OMX, 2011).
Figure 3.1: Icelandair Groups share price and turnover 2006-2011
Source: Own creation & Nasdaq OMX (2011).
14
The currency in Iceland is „„Króna„„ or Krona in English. The symbol ISK stands for Icelandic Krones.
0
100
200
300
400
500
600
700
800
900
1.000
0
5
10
15
20
25
30
35
14.12.06 14.12.07 14.12.08 14.12.09 14.12.10
Mill
ions
Turnover in ISK (right axis) Share Price in ISK
-17-
The third practice available to management, downscoping, means that non-core
assets are separated and sold off and the proceeds can be used to lower the debt. This is
the most rational way in my opinion. Firstly, this is a desirable way for both the
management and the claimants to obtain an improved equity ratio. Secondly, the
management can put their capital and effort into the core operations that are likely to
contribute to the company‟s viability. Thirdly, the banks that swap debt to equity, can
participate in a possible upside in the company. Fourthly, as a consequence this makes
the company a more appealing investment vehicle, which possibly attracts new equity
investors.
This is the method that the management of Icelandair Group decided on. Finding
new investors to the domestic equity market which in the year 2008 returned -90% was
a tricky task (Nasdaq OMX, 2011). The government was prohibited from spending
large amounts of money on new projects due to the conditions of the International
Monetary Fund15
rescue package. At the same time the Icelandic pensions funds were
not allowed to make any new foreign investments and the schemes were among few
organizations in the country that had cash on hand (Financial Times Mandate, 2009)
In June 2010 the Enterprise Investment Fund (EIF) an investment company owned
by 16 Icelandic pension funds and The Pension Fund of Commerce (PCF) entered into a
binding agreement with Icelandair Group on investing in the Group for a total of ISK 4
billion. EIF undertook to contribute approximately ISK 3 billion and PFC ISK 1 billion
but the agreement was made with three conditions:
Positive results of Icelandair Groups due diligence.
That EIF would get an exemption from an obligatory take-over of Group from
the Financial Supervisory Authority (FME).
That Icelandair Group should raise a minimum another ISK 1 billion in market
value through the sale of New Shares to other investors.
Icelandair Group announced on 12th
of August 2010 that these conditions were met.
The management had a new business strategy and the pension funds on board. After a
work with the main creditors, the financial restructuring were concluded based on the 3
components presented in figure 3.2.
15
IMF.

-18-
Figure 3.2: The 3 components of the financial restructuring
Source: Own creation & Icelandair Groups Presentation of Q4 and 12M results (2011).
All the newly issued shares were issued for cash consideration for approximately
ISK 8.2 billion in market value. The largest shareholders after the restructuring can be
seen in figure 3.3. Landsbanki Íslands, the other main creditor of the Group, sold the
remaining 6% of its share in February 2011. The two largest shareholders, THE EIF and
Íslandsbanki, made an agreement with the Group to not sell the shares that the
companies owned prior to the share offering in December 2010, until November 2010
(Viðskiptablaðið, 2011).
The sale of Bluebird
Cargo was finalized following
the approval of the Icelandic
Competition Authority on the
10th
of February 2010. The plan
was to sell all the three
businesses that were categorized
as discontinued business to
companies owned by the banks.
The lenders and shareholders of SmartLynx and Travel Service did not approve the sale
of the two companies but Icelandair Group will continue the sales process. There are no
cash contribution related to these divestments, all the proceeds will be used to pay down
debt.
3.3 The capital structure
Assets
The Enterprice Investment
Funds29%
Íslandsbanki hf21%
The Pension Fund of
Commerce12%
Pension Funds Bankastræti 7
6%
Glitnir banki hf4%
Other28%
Figure 3.3: Ownership structure
Source: Own creation & Icelandair Group Annual Report 2010.

-19-
By examining the balance sheet which can be seen in figure 3.4 and by comparing the
results from 2009 to 2010 I will show the improvement between years. I will show the
changes as cash flow effects for the company.
Non-core assets for the amount of ISK 7.6 billion were sold to creditors with a
gain of ISK 4.2 billion. After tax and translation difference the sale had ISK 1.3 billion
positive impact on the Groups equity. Total assets decreased from ISK 89.1 billion to
ISK 84.2 billion. The current assets increased by ISK 1 billion and the non-current
assets decreased by ISK 5.9 billion, improving the current ratio from 0.58 to 1.16.
Operating assets increased by ISK 0.6 billion while intangible assets decreased by ISK
2.4 billion, because of the sale of non-core assets. The current intangible assets are
mainly goodwill with a book value of ISK 16.6 billion and trademarks-and slots with a
book value of ISK 4 billion. Trade and other receivables increased by ISK 4.8 billion in
connection with the share capital subscription in December of ISK 2.7 billion. The ISK
2.8 billion assets held for sale are the shares in SmartLynx and the remaining share in
Travel Service. Finally the cash and cash equivalents and marketable securities have
increased by ISK 11.1 billion due to the divestments. Additionally, the new share
capital injection in the amount of ISK 5.5 billion improved the Groups liquidity position
significantly.
Figure 3.4: Total assets 31.12.2010
Source: Own creation & Icelandair Group Annual Report 2010.
Equity and liabilities
The equity ratio has gone up from 16.4% to 33.7% following the financial restructuring.
Total equity increased from ISK 14.6 billion to ISK 28.4 billion. As figure 3.5 shows,
interest bearing debt decreased from ISK 36.4 billion to ISK 24.6 billion. The current

-20-
liabilities have become less burden with a decrease from ISK 54.9 billion to ISK 28.5
billion while the non-current liabilities increased by only ISK 7.8 billion, to 27.4 billion.
Figure 3.5: Total equity and liabilities 31.12.2010
Source: Own creation Icelandair Group Annual Report 2010.
Maturity profile
Icelandair Groups liabilities had become an excessive constraint on its cash flow. All
the short term borrowings were restructured and the maturity profile was extended.
Figure 3.6 compares the maturity profile before and after the financial restructuring and
as can be seen, there was a payment of ISK 25.5 billion scheduled this year which has
now been stretched over the next couple of years. There is a big payment coming up in
2013 but overall I estimate that the new maturity profile will be manageable for the
Group.
Figure 3.6: The restructured maturity profile
Source: Own creation & Icelandair Group Annual Report 2010.
3.4 Summary After investing too much with foreign currency debt, the balance sheet was not
sustainable after the financial crisis. The financial restructuring was based on three
components: the Group sold off non-core assets to companies owned by the creditors
0
5
10
15
20
25
2011 2012 2013 2014 2015 2016 2017 Later
Bill
ion
s
Maturity profile before restructuring Restructured maturity profile
-21-
and the proceeds were used to reduce interest bearing debt by ISK 9.4 billion. The
banks swapped ISK 3.6 billion debt into equity. Finally ISK 8.2 billion was raised in
new share capital. The current ratio increased from 0.58 to 1.16, the equity ratio went up
from 16.4% to 33.7% and the cash balance improved by ISK 9.8 billion.
4 Strategic analysis The previous chapters have introduced Icelandair Group and the latest developments in
the company thoroughly to the reader. In this chapter I will apply this knowledge in a
strategic analysis, in order to get a better understanding of the Groups business
environment and strategic position.
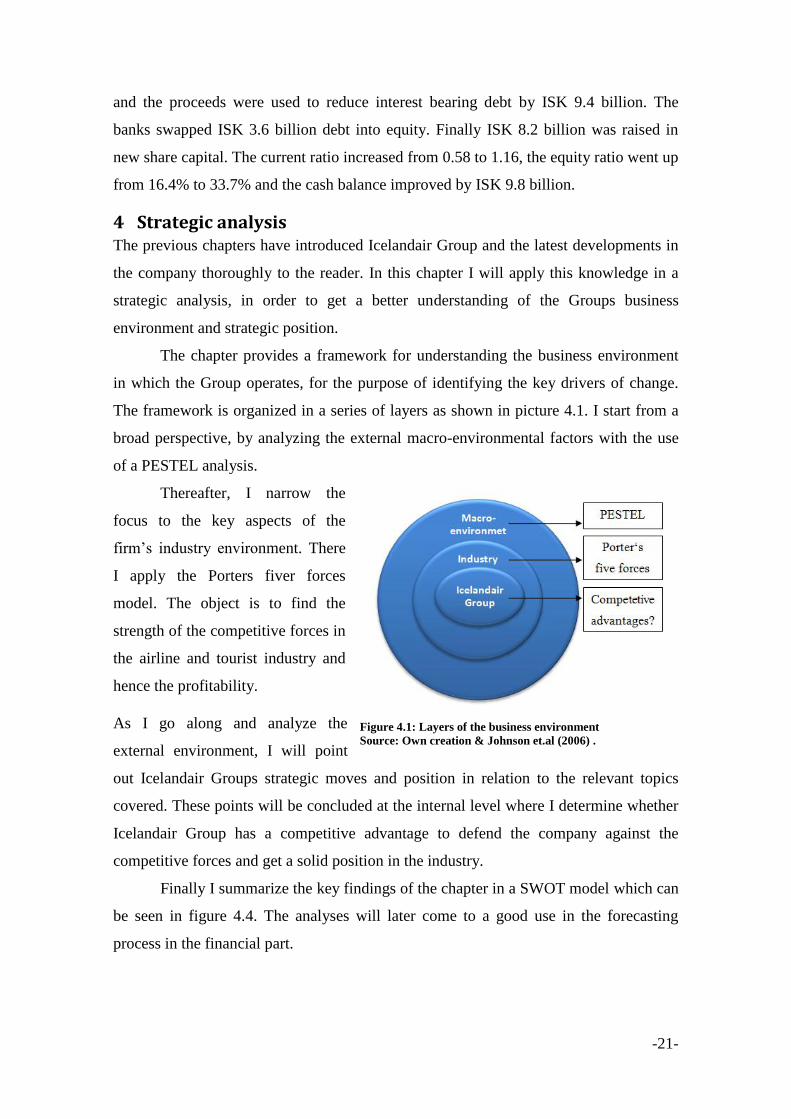
The chapter provides a framework for understanding the business environment
in which the Group operates, for the purpose of identifying the key drivers of change.
The framework is organized in a series of layers as shown in picture 4.1. I start from a
broad perspective, by analyzing the external macro-environmental factors with the use
of a PESTEL analysis.
Thereafter, I narrow the
focus to the key aspects of the
firm‟s industry environment. There
I apply the Porters fiver forces
model. The object is to find the
strength of the competitive forces in
the airline and tourist industry and
hence the profitability.
As I go along and analyze the
external environment, I will point
out Icelandair Groups strategic moves and position in relation to the relevant topics
covered. These points will be concluded at the internal level where I determine whether
Icelandair Group has a competitive advantage to defend the company against the
competitive forces and get a solid position in the industry.
Finally I summarize the key findings of the chapter in a SWOT model which can
be seen in figure 4.4. The analyses will later come to a good use in the forecasting
process in the financial part.
Figure 4.1: Layers of the business environment
Source: Own creation & Johnson et.al (2006) .
-22-
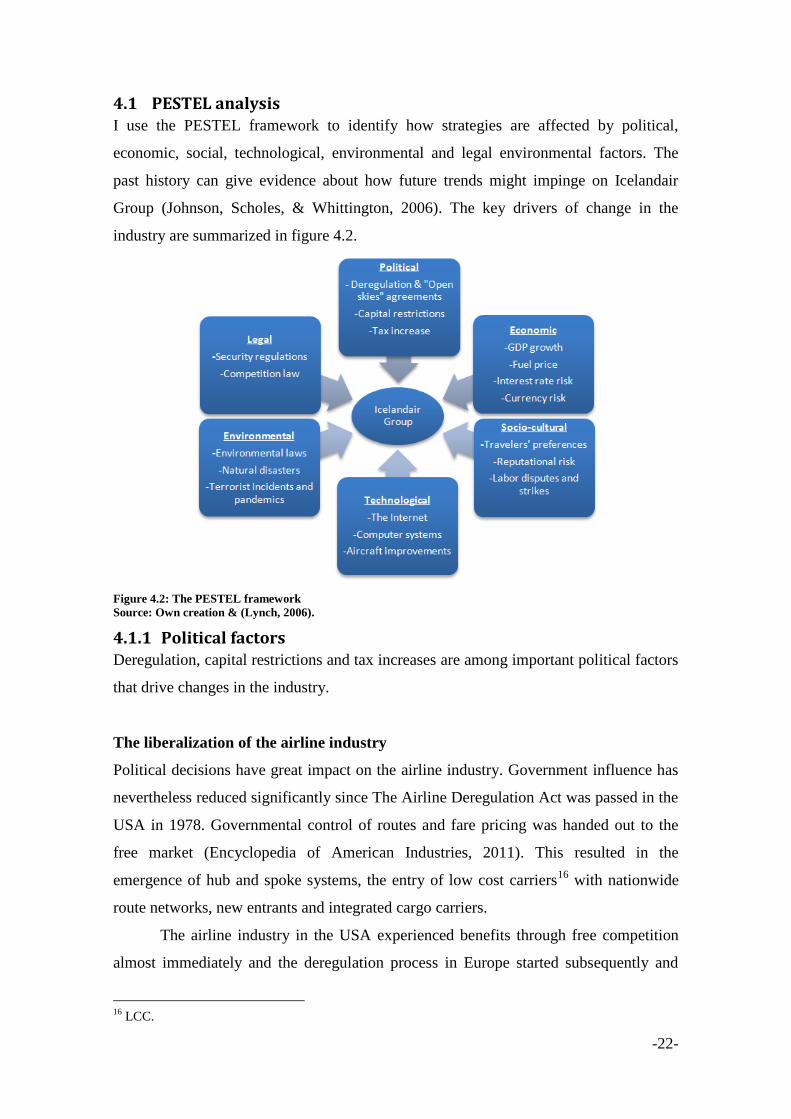
4.1 PESTEL analysis I use the PESTEL framework to identify how strategies are affected by political,
economic, social, technological, environmental and legal environmental factors. The
past history can give evidence about how future trends might impinge on Icelandair
Group (Johnson, Scholes, & Whittington, 2006). The key drivers of change in the
industry are summarized in figure 4.2.
Figure 4.2: The PESTEL framework
Source: Own creation & (Lynch, 2006).
4.1.1 Political factors Deregulation, capital restrictions and tax increases are among important political factors
that drive changes in the industry.
The liberalization of the airline industry
Political decisions have great impact on the airline industry. Government influence has
nevertheless reduced significantly since The Airline Deregulation Act was passed in the
USA in 1978. Governmental control of routes and fare pricing was handed out to the
free market (Encyclopedia of American Industries, 2011). This resulted in the
emergence of hub and spoke systems, the entry of low cost carriers16
with nationwide
route networks, new entrants and integrated cargo carriers.
The airline industry in the USA experienced benefits through free competition
almost immediately and the deregulation process in Europe started subsequently and
16
LCC.

-23-
was concluded in 1997. The European liberalization process generated the Single
European Aviation Market in 1993 which led to substantial traffic growth and economic
benefits. Low-cost operators increased their share of capacity from 1.4% in 1996 to
20.2% in 2003. A causal chain can be identified in figure 4.3, which links the changes
in air service regulation to the broader economy and the failure of any one link can halt
the process of expansion (IATA, 2006):
Figure 4.3: Changes in air service regulation
Source: Own creation & IATA.
After the liberalization of the airline industry, bilateral “open skies” agreements
have been signed between more and more countries resulting in the removal of many
barriers to competition. Airlines were allowed to have foreign partners, access to
international routes to and from their home countries, and freedom from many
traditional forms of economic regulations (Cox, 2008). These air service agreements
have led to incremental passenger traffic and economic growth (IATA, 2006).
Capital controls in Iceland
Foreign exchange transactions have been subject to comprehensive capital controls in
Iceland since November 2008 after the banking system collapsed and the local currency
Krona plunged. This is part of a Government economic programme, in co-operation
with the International Monetary Fund17
, in order to support the exchange rate, control
inflation and secure financial stability. Stability of both banks and currencies are based
on confidence and if that confidence disappears, banks fail and currencies fall, often
lower than justified by fundamentals (Sighvatsson, 2010).
It is not the optimal financial environment for an international company like
Icelandair Group to operate in. The main negative consequences of the capital
restrictions are the difficulties in getting new international investors, as they are forced
to stick with its investment until the controls will be lifted. All exporting companies are
also according to the regulations, forced to return foreign income to Iceland at an
official foreign exchange rate or divert it to a foreign currency account. This has not a
considerable direct impact on Icelandair Group as around 70% of the income and costs
17
IMF.

-24-
are denominated in foreign currency (Icelandair Group hf., 2010). The Groups hedging
and risk management policies have been affected on the other hand as various hedging
instruments are not offered to the same extent as before the time of capital controls.
Furthermore, the ISK forward market is non-existent today.
The Central Bank of Iceland introduced a plan to gradually liberalize the capital
controls in August 2009. The strategy is implemented in two phases without a timetable,
but depends on whether certain conditions have been met. The latest development by
the Government is to propose an extension of the capital controls until the end of 2015
(The Central Bank of Iceland, 2011). The uncertainty about the liberalization of the
controls puts managers of Icelandic firms in a very challenging position and some of the
larger corporations have already stressed their intention to move operations abroad.
Changing tax policies
The airline and tourism industries are subject to an ever changing environment of taxes,
aviation and license fees and the trend has been to increase taxation rather than reduce it
(Icelandair Group hf., 2010). The airline industry is subject to charges regarding take-
off and landing along with emission, noise, navigation charges and ticket tax. Added
local taxation is always a threat, especially now due to growing imbalance in public
finance and they can have a direct effect on ticket pricing and demand. The Icelandic
Government has recently announced increased taxation in 2011 that will affect
Icelandair, Icelandair Hotels and Air Iceland. These are taxes and charges on
passengers, hotel rooms, ticket tax and more. The increased cost can to some extent be
shifted to air travelers. Björgólfur Jóhannsson, the CEO of Icelandair Group, says that
the ticket price on the domestic routes could increase by 10-15% but less on the
international routes (Vísir.is, 2010).
4.1.2 Economic factors There are several economic factors that a company operating in the international
aviation industry, has to take into consideration. Some of these factors like fuel price,
interest rate and currency fluctuations are so important that if they are not favorable for
a firm, they can have serious effects on its viability. The global GDP growth is the
single most important factor because GDP affects other important external factors in the
industry.
Fuel price
-25-
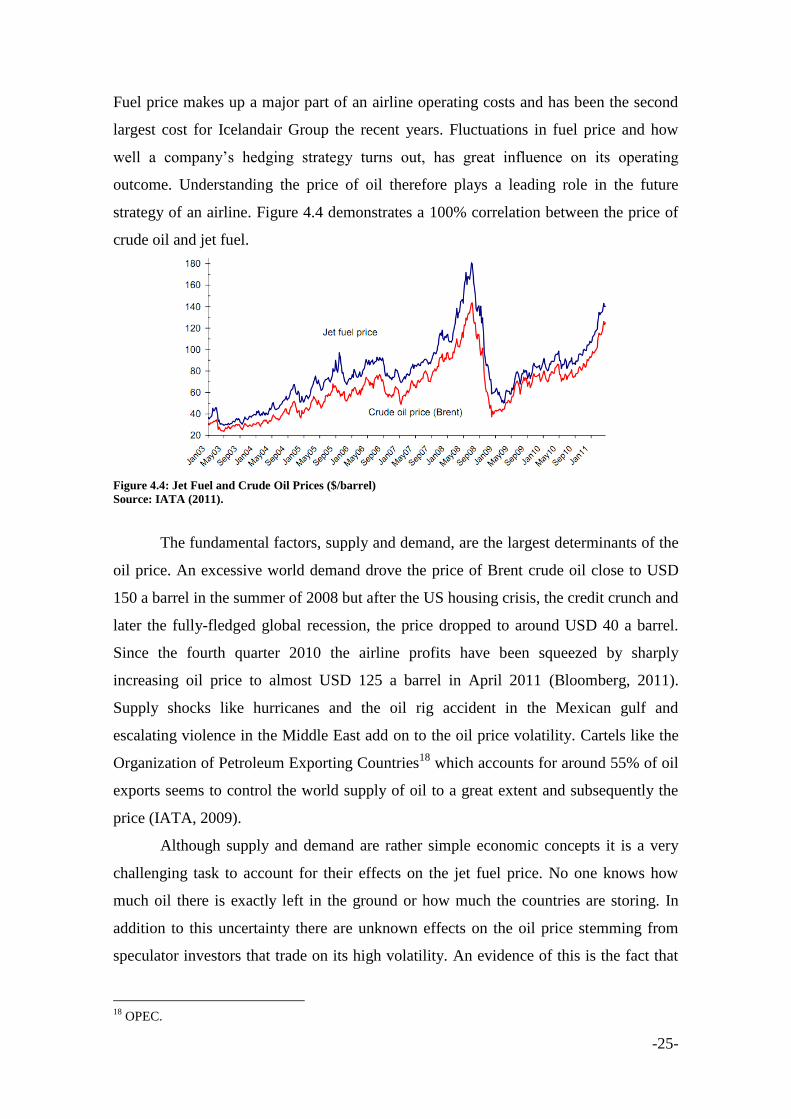
Fuel price makes up a major part of an airline operating costs and has been the second
largest cost for Icelandair Group the recent years. Fluctuations in fuel price and how
well a company‟s hedging strategy turns out, has great influence on its operating
outcome. Understanding the price of oil therefore plays a leading role in the future
strategy of an airline. Figure 4.4 demonstrates a 100% correlation between the price of
crude oil and jet fuel.
Figure 4.4: Jet Fuel and Crude Oil Prices ($/barrel)
Source: IATA (2011).
The fundamental factors, supply and demand, are the largest determinants of the
oil price. An excessive world demand drove the price of Brent crude oil close to USD
150 a barrel in the summer of 2008 but after the US housing crisis, the credit crunch and
later the fully-fledged global recession, the price dropped to around USD 40 a barrel.
Since the fourth quarter 2010 the airline profits have been squeezed by sharply
increasing oil price to almost USD 125 a barrel in April 2011 (Bloomberg, 2011).
Supply shocks like hurricanes and the oil rig accident in the Mexican gulf and
escalating violence in the Middle East add on to the oil price volatility. Cartels like the
Organization of Petroleum Exporting Countries18
which accounts for around 55% of oil
exports seems to control the world supply of oil to a great extent and subsequently the
price (IATA, 2009).
Although supply and demand are rather simple economic concepts it is a very
challenging task to account for their effects on the jet fuel price. No one knows how
much oil there is exactly left in the ground or how much the countries are storing. In
addition to this uncertainty there are unknown effects on the oil price stemming from
speculator investors that trade on its high volatility. An evidence of this is the fact that
18
OPEC.
-26-
the world consumption of oil in 2009 was about 85 million barrels a day whereas oil
trading is thought to have involved more than one billion barrels a day (IATA, 2009). A
part of this trading can be explained by the hedging activities of airlines, their effort to
bring stability to their cost base. Icelandair Group maintains a policy of hedging fuel
price exposure by a ratio of 40-80% but because of the capital controls, high
opportunity costs and up-front payments, the ratio has fallen below lower limits in this
current climate (Icelandair, 2011).
Interest rate risk
Interest rate risk is a great concern for the Airlines, given the high leverage ratio in the
industry. The airline sector is capital intense, the cost of equity is high and it is difficult
to attract new equity as a result of high earnings volatility. An increase in interest rates
has direct effects on the firms in higher borrowing costs and more expensive leasing
contracts. Higher interest rates is also costly for aviation firms indirectly, as higher yield
has an effect on general economic conditions and thus negative effects on the cyclical
demand in the airline industry.
The largest share of Icelandair Groups outstanding long-term loans are directly
related to aircraft financing and denominated in USD like the majority of the loans in
the most liquid market for commercial aircraft. These loans carry 3- 6 months floating
interest rates but the Group hedges the interest rate exposure with fixed-rate loans or
SWAP contracts up to 5 years ahead, where the floating rates are exchanged for fixed
interest rates. The floating rates exceeded the fixed rates in recent years and the SWAP
contract contributed to a profit. The last two years however, the floating interest rates
have fallen sharply and the contracts proved unfavorable. All the contracts have expired
except for one that expires in 2011 (Icelandair Group hf., 2010).
Foreign currency risk
Management of exchange rate risk is important for airlines as revenues, expenses and
borrowings are often denominated in several different currencies. Tourist demand is
also affected by the exchange rate levels. When the Icelandic Krona depreciates, it
increases the tourist flow to Iceland but decreases the customers travelling from the
country. Laudon (2004) argues that the competitive structure of the industry has a great
influence on the exposure determinant. For example industry related factors such as
markup and pass-through can be used to protect the revenues from the impact of

-27-
currency movements. This is difficult to implement in the airline industry because of the
high competition and low markup.
Icelandair Groups strategy is to minimize the foreign currency exposure by
firstly, matching receipts and payments in each individual currency as far as possible.
Secondly the Group reduces any mismatch with internal trades across the range of
subsidiaries as possible before turning to outside parties. Figure 4.5 presents the Groups
total revenues and expenses in 2010 split down to currencies (Icelandair, 2011). The
biggest currency mismatch is found in Icelandair, or USD 100 million in 2010.
Figure 4.5: Total revenues and expenses 2010 split down to currencies
Source: Own creation and Icelandair Group Annual report 2010.
The USD inflow does not cover the USD outflow because fuel costs, lease payments
and capital-related payments, are to a large extent denominated in US dollars and the
shortage is financed mainly with surplus in Euro and Scandinavian currencies. The
hedging ratio of currency risk also fell below lower limits after the banking crisis in
2008 but the Group managed to resume accordance with its policy at the end of 2010,
mainly because of the Groups improved liquidity (Icelandair, 2011).
4.1.3 Socio-cultural factors It is very valuable to have an overview of the socio-cultural factors affecting the
industry, because these inspire people‟s behavior and customers are the main premise in
the service business. The fact that international airlines operate across many borders
makes it an even more crucial factor to be aware of. Travelers‟ preferences, the
company„s reputation and labor disputes and strikes can change the business
environment.
Travelers’ preferences
0%
10%
20%
30%
40%
50%
ISK USD EUR OtherTotal revenue Total expenses

-28-
Economic changes and the general condition of the economy are closely tied to socio-
cultural actions. In a booming economy people have afford a more luxurious lifestyle
and tend to travel more than during recessions, both for business and pleasure. The
financial turmoil and the credit crunch in 2008 made the average consumer worse off
and it was clearly noticed in a demand squeeze on worldwide air carrier services.
Icelandair felt the consequences of this and had to respond with drastic reduction of the
scope of its operations. Furthermore the consumer behavior changed in the way that
travelers shifted from flying business class to flying economy class. Icelandair managed
to reduce the yield drop caused by this change by altering its pricing structure to include
the “Economy-Comfort” class as of November 2008. In that way the airline could better
meet the altered demand pattern (Icelandair Group hf., 2010). Lifestyles, needs, tastes
and fashions are amongst the numerous social and cultural influences and they vary
from country to country. Understanding the impact that these factors have on the
business makes it possible for companies to be prepared when the environmental
conditions change and respond in a convenient way.
Reputational risk
It is essential for a company in the aviation and tourism industry to have a good
reputation of safety and quality service. Not only to attract customers but also the secure
access to existing and new markets. A poor reputation can directly hinder an airline in
getting a first class access to airports which is vital to minimize the likelihood of delays.
Delays and cancelled flights cause additional costs for operations but also indirect cost
through damage to reputation and brand names. It can take years or decades to establish
outstanding reputation but any misfortune can easily wipe it out instantaneously. Some
of Icelandair Groups registered trademarks have been known for over 70 years and are
of great value for the company. Through good business relations and because of long
history in the aviation service, Icelandair has gained access to airport slots on important
destinations and is known for being one of the most punctual airlines in Europe (The
Association of European Airlines, 2009). Airlines reputation can easily be seriously
damaged if one of their aircraft were to be involved in an accident or crash. The
Scandinavian airline SAS experienced a reputational shock in 2007 when three of their
aircraft were involved in accidents when landing, in just two months period (Politiken,
2010). A public perception that a company‟s aircrafts are not reliable is hard to recover
from.

-29-
Labor disputes and strikes
Another socio-cultural influence worth to mention is the human factor. The airline
industry is labor-intensive and having high-quality employees is a key success factor.
There is always the risk that airline do not reach an agreement about employee salaries
and benefits with the unions and thus ending in a strike. Strikes have usually very high
consequences for airlines as they have effect on many people and therefore attract
negative global publicity. If a strike forces an airline to shut down routes temporary,
subsidiaries that rely on the incoming passengers can be financially adversely affected
and the high fixed cost in the industry can soon become a heavy burden for the
company. There is also uncertainty about the willingness of key employees to continue
working for a company and risk that they resign, or worse, that they join a competitor.
Icelandair is known for having very experienced aviators but its current union
agreement with its pilots and cabin attendants expired at the end of 2010 (Icelandair
Group hf., 2010). It is of great importance for the Group to reach a new agreement with
the Icelandic Air Line Pilots´ Association in the current renegotiations (The Icelandic
Air Line Pilots' Accociation, 2011).
4.1.4 Technological factors It is safe to say that technological factors have significant influences on the airline and
tourism industry. The internet has made communication, marketing and booking a lot
easier than before and technological improvements have made the aircraft fleet safer,
more eco friendly and a more relaxed travel option. Companies need to be aware of the
latest relevant technologies so they can take advantage of them before their competitor
does so.
The internet
The internet has improved the infrastructure of the airline and tourism industry in many
ways. Like in other sectors it has shortened the communication channels and allowed
for quicker decision making with for example e-mails and modern teleconference
equipments. The internet has completely altered the marketing world and the ways
companies approach customers and vice versa. Home pages, databases and search
engines have to a large extent substituted travel agencies. Information about the service
is distributed quicker to the online customers with fewer intermediaries. These changes
have reduced costs, improved services and made it possible to respond faster to

-30-
opportunities in an ever changing business environment. Icelandair has websites in local
languages in all markets and attracts unusually high percentage of its customers, or 75%
from outside its home market (Icelandair Group hf., 2010).
Computer systems
It is not enough for an airline to have a well executed route network. A key ingredient
for a successful airline is the revenue management, and the way it controls capacity,
booking and pricing. Although computer systems are very expensive to develop and
manage for airlines, hotels and travel agents, they have been extremely helpful. The
costs can be reduced with cooperation between players in the industry and Icelandair is
for example in a partnership in the Amadeus computer reservation system19
. Through
the distribution engine and numerous agreements with other airlines, the Group can sell
airline tickets and other reservations through more than 12,000 travel agents in addition
to its own sales offices. This has significantly improved revenues (Icelandair Group hf.,
2010). Icelandair has established a control station on the Keflavík international airport
that operates a Data Link computer system. The system keeps constant communication
and track of the aircraft locations on the route system. The computer system has helped
in preventing delays and reacting to unexpected events (AMX News Centre, 2009).
Furthermore, recent technological progresses in the travelling process, like self check-in
on airports and mobile boarding passes have saved time and money.
Aircraft improvements
Technological changes have reduced negative externalities like carbon emissions in the
environment. Aircraft engines are designed to use less amount of fuel than previous
models. Icelandair has recently invested in winglets on its Boeing aircraft fleet. Those
are designed to reduce fuel consumption and noise, lower emissions and make the
aircraft safer to handle (Boeing, 2011). The company is also the first airline in Europe to
make certain changes to the cockpits in the whole Boeing 737 fleet which make the
aircraft lighter and subsequently more fuel efficient. The aircraft flight safety improves,
maintenance costs are reduced and the pilots working conditions increases.
Furthermore, the company has been renovating the fleets with new interiors including
new seats and personal entertainment systems in all aircrafts (Viðskiptablaðið, 2011).
19
CRS.
-31-
4.1.5 Environmental factors With a growing concern for the environment, governments keep on fighting for its
sustainability with regulations and restrictions. The airline industry, as a fuel intense
sector, is partly responsible for rising carbon emissions and is therefore expected to
contribute to this fight. This comes with a price for the airlines. Unforeseen events like
natural disasters and deceases that hold back air traffic can also become very costly.
Environment law
Airlines can be affected by local restrictions around airports to reduce noise and
pollution. If opening hours of airports, availability of slots and the usage of airspace is
limited to honor environmental restrictions, delays and complexity of departures can
have adverse effect on efficiency in the industry. As a step to meet the obligations of the
Kyoto Protocol, the European Union20
has issued legislation intended to minimize
excess emissions. The laws are enforced with carbon limits on the airline industry. The
airlines who stay within the limits can sell their emission quotas to other airlines
(Icelandair Group hf., 2010). The price of the quota trading brings additional
uncertainty to the airlines cost base.
Natural disasters
The volcanic eruptions in the Icelandic Eyjafjallajökull in April 2011 showed the world
just how vulnerable the airline industry is to unexpected natural disasters. The volcanic
ash plume led to the closure of large parts of Europe‟s airspace over a period of seven
days, causing over 100,000 flights to be cancelled and an estimated USD 1.7 billion
revenue loss from scheduled services. The International Air Transport Association
stated that airlines based in Northern Europe had all of their fleet effectively grounded
as a result of the airspace closures. (IATA, 2010). Icelandair managed to minimize the
loss of income by moving its hub to Glasgow and fly to Akureyri in the Northern
Iceland instead of Keflavík. The passengers were then transported between Reykjavík
and Akureyri. The estimated losses were ISK 1.5 billion but the long-term effects of a
communication and marketing campaign launched shortly after the eruptions are
estimated to balance out the damages (Icelandair Group, 2011). Airlines were
challenged by Mother Nature yet another time in late 2010 when middle Europe was hit
by a snowstorm resulting in grounded airplanes in England. The pilots of an Icelandair
20
EU.

-32-
aircraft were told that there was not enough snow clearing equipment to clear a path for
the refueling car and therefore had to face an overnight stay. Instead of delaying the
flight like other airlines did, they cleared the path with shovels in their hands, got their
aircraft refueled and took off (Moussaieff, 2010).
The 11 March 2011 earthquake and tsunami in Japan is another recent natural
catastrophe that is expected to effect the air transport market adversely (IATA, 2011).
Terrorist Incidents and pandemics
General fear of travelling has negative effects on demand for air and tourism service.
The airline industry has throughout the history experienced unanticipated incidences
that have had instant depressing effects that in some cases lasted for years. For example,
the terrorist attacks in September 2001 turned an industry downturn into a major slump
and the following years became some of the most difficult times that the sector has ever
faced (Morrell, 2007). The war in Iraq and the terrorist attacks in London the summer of
2005 made the outlook even worse.
On the of the unstable environment in the current decade, demand for airline travel has
dropped several times due to global outbreaks of deceases like the SARS in 2003, the
bird flu pandemic in 2007 and 2008 and the swine flu pandemic in 2009. The airlines
have to accept and be prepared for times when people lose their appetite for traveling,
which can occur at any time.
4.1.6 Legal factors Although laws and regulations are set in good faith for the purpose of hindering
something dangerous or unethical from happening, they can have negative
consequences for companies in an industry. Security regulations, competition laws and
other aviation regulations have the tendency to reduce the profit margin. Legal
influences in the environment are closely tied to the political factors. To avoid repetition
I briefly touch up on what I belief are the central legal issues.
Security regulations
Disasters like the 9/11 terrorist attacks have considerable indirect cost implications for
the airline industry, even years after its recovery, in the form of safety precautions.
International security measures where tightened up after the fly-capture incidents. For
instance, legislation regarding the booking process, the security checks and the baggage

-33-
handling procedures were stepped up. Incidents like these have caused short term and
long term flight interruption before and could possibly have similar effects in the future.
Competition law
The competition in the airline industry is fierce. Transparency in ticket pricing has
increased with the appearance of the internet and companies must constantly come up
with keener marketing campaigns than the competitors, in the battle for the customers.
The competition authorities monitor every move and they are ready to cut in and
penalize the airlines if they are guilty of breaching the competition laws. Apart from big
fines in this sector, the firms then might have to change strategies and the way they
usually conduct their business, going against the regulations can thereby have serious
consequences. Companies with strong market position, like some of Icelandair Groups
subsidiaries have in their home market, are subject to even more stringent anti-trust
regulations than smaller players. Icelandair has since 2004 been involved in a dispute
with Iceland Express, which was at the time a new Icelandic low cost carrier21
.
Icelandair was charged for alleged misusage of its market position by offering low fares
on its route from Keflavík to London and Copenhagen, the exact markets Iceland
Express was penetrating. Icelandair was ruled guilty on part of the charges but the
courts have not reach a final decision whether the airline has to pay a fine to the amount
of ISK 130 million (Viðskiptablaðið, 2011).
4.2 Porter‘s five forces In the last chapter I identified the main external macro-environmental factors that effect
the airline industry. The companies have no control over these influences but they must
be aware of them and make their best effort to act in a pro-active way rather than taking
a reactive approach. The coverage gave the reader an insight in the general condition
and attractiveness of the industry.
To support discussions I follow up with an analysis of the strength of the
competitive forces in the airline industry. I apply the Porter‟s Five Forces model which
can be seen in figure 4.6. The five forces driving industry competition are according to
Porter (1980) the threat of new entrants and substitute products or services, the rivalry
among existing firms and the bargaining power of suppliers and buyers.
21
LCC.

-34-
Figure 4.6: Porter's five forces
Source: Own creation & Porter (1980).
These outside forces, usually effect all firms in the industry but the key is found in the
differing abilities of firms to find a favorable position to protect themselves against the
influences. Knowledge of the forces highlights the critical strengths and weaknesses of
the organization and gives the management an opportunity to develop a business
strategy that maximizes its profitability (Porter, 1980).
4.2.1 Threat of new entrants There is always a threat of new players on markets where profit potentials exists. The
threat of entry into an industry depends on the barriers to entry coupled with the
reaction from existing competitors that the entrant can expect (Porter, 1980). Increased
competition for Icelandair Group can stem from completely new air service operators as
well as from existing airlines that enter Icelandair‟s routes. The Group has felt an
escalating competition from Iceland Express since its establishment in 2003 (Iceland
Express, 2011) and is preparing for Delta Airlines‟ “break in” on the New York to
Keflavík route 1st of June 2011 (Delta Airlines, 2010). Delta has recently started
advertising their new destination placing emphasis on their wide spread connection
flights in the USA. Icelandair responded with a new break through agreement with
JetBlue Airways, the biggest airline that offers domestic flights from Boston and New
York to 64 cities in the US (Vísir, 2011).
Government policy
The deregulation of the airline industry increased competition by lowering barriers to
entry from a legislation point of view, like I pointed out in the PESTEL analysis in

-35-
chapter 4.1.1. The Airline Deregulation Act in the USA, the Single European Aviation
Market and the “open skies” agreements have served as stepping stones for new entrants
and simultaneously new threats to Icelandair Group.
Capital requirements
Entering the airline industry requires major investment in aircraft and equipment. That
is the reason why about 30% of the world‟s commercial fleet is owned by leasing
companies (IATA, 2010). The airline business is also human capital intensive and a new
player may have to enter into long term contracts with aircraft leasing companies and
employee unions. Acquiring airport slots before being able to introduce new services or
expand the existing ones comes with a great cost and is therefore another major entry
barrier. There is always high risk involved in such outflow of capital when a business is
established. This can easily repel possible entrants.
Product differentiation, access to distribution channels and switching costs
Brand identity, customer knowledge and special levels of service, create a barrier to
entry. These factors are in favor of Icelandair for being the first on the home market.
New entrants must also persuade distribution channels that the established firm has
utilized, to accept their service. One of Icelandair‟s four sale channels is an Internet
Club with 600,000 active members of which 90% are foreigners (Icelandair Group hf.,
2010). Although switching costs is low in the industry, Icelandair‟s well-known
distribution channels and its frequent flyer program serve as entry barriers to some
extent.
I estimate the threat of new entrants high. This is based on the discussions above
and the fact that 13 airlines have announced that they will fly scheduled flight or charter
flight to Iceland this summer (Mbl.is, 2011).
4.2.2 Intensity of competitive rivalry
In this section I want to investigate how intense the existing rivalry on the market is by
going through couple of interacting structural factors. Rivalry occurs because one or
more competitors either feel the pressure or see the opportunity to improve position. In
the battle for the customers, existing competitors use tactics like price competition,
advertising battles, product introductions, and increased customer service. Price cuts are
quickly met by rivals and can damage the markets profitability but advertising battles
are likely to expand demand and boost product differentiation (Porter, 1980).

-36-
One market leader
Advertising battles is exactly what is currently happening on the Icelandic International
Airline market. Latest warlike advertises from Iceland Express are meant to remind
customers of how the airline stood up to Icelandair, which was at the time Iceland‟s
only international air service operator, and offered a cheaper alternative. Iceland
Express furthermore tries to cause sympathy for the airline because of Icelandair‟s good
market position. Icelandair followed up by launching an advertising campaign that puts
its excellent service and customer satisfaction in the spotlight.
Slow industry growth and high fixed costs
As the airline industry can be defined as a mature market, firms seeking expansion must
take sales from its competitors. The market share competition is more intense than in
rapid growing industries where firms can increase profit by taking advantage of larger
market. There are very high fixed costs in the airlines cost base but low variable costs.
Furthermore, the fact that it is impossible to store service for later use puts a pressure on
carriers to cut prices to make use of excess capacity. Because of high exit barriers, the
excess capacity does not leave the industry. Corporations that fall behind the
competition tend to hang in there and fight to their last resorts. This can be conducive of
low industry profitability (Porter, 1980).
I conclude that the intensity of existing competitive rivalry is high in the
industry.
4.2.3 Substitute products The introduction of substitute products or services is the result of innovation and new
technology. Substitute products can perform the same functions as the existing ones
only in a more effective way or with lower costs (Lynch, 2006). The task of an airline is
to transport passengers and cargo between places and can therefore be substituted by
trains, boats, busses, trucks and cars. The choice between these alternatives depends on
distance, time, price and personal preferences.
Effectiveness and lower price
Icelandair has a rather unique position when it comes to substitute products because of
the geographical position of its Hub. With nothing but the Atlantic Ocean between

-37-
Iceland and the mainland, ships and ferries are really the only other transport options to
and from the country. Icelandair has a great advantage over boats when it comes to the
time and the speed factors, but how much of a constraint the airline fare is depends on
what is being transported and who is travelling. The business customer is less concerned
about the price than the leisure customer because his main concern is getting to
meetings in the shortest time possible. Latest teleconference equipment can serve as a
substitute in the sense that business meetings can take place via the internet.
Other subsidiaries of Icelandair Group are more threatened by substitute
products. There are no trains in Iceland but Air Iceland faces competition from the
improving road network and travel agencies offering coach tours. Icelandair Hotels
shares the tourist market with guesthouses and youth hotels. Since the companies do not
contribute substantially to the Groups income I will not go into more detail on these
substitutes.
In general, I assess that the threat of substitute products is low for Icelandair, and
medium for Air Iceland. I belief, that the threat is high for other subsidiaries in the
tourism sector as options for tourist activities in Iceland are plenty.
4.2.4 Bargaining power of customers Bargaining power of customers refers to the amount of pressure customers can place on
the industry by forcing down prices, bargain for higher quality or services and play
competitors against each other, all at the expense of industry profitability (Porter, 1980).
In order to find out the bargaining power of customers in the airline industry, I will in
the following sector take a look at the most relevant determining factors.
Buying volume, switching costs and undifferentiated service
There are very many individual buyers of airline tickets and usually they do not
purchase large volumes relative to the airline sales. My experience as a customer is that
I cannot have any influence on the lowest ticket price that is offered at each time.
Business customers fly more frequently than the leisure customer but in my opinion
they are not in a much better position to bargain unless they are represented by a
corporation that is a large volume buyer. The switching cost between airlines for the
customer is very low and the service is undifferentiated when comparing flights on
same class so the customer usually has alternatives. The price is generally the decisive
factor for the leisure customer and he can quickly spot any price discrepancies between
airlines on the internet and choose the cheapest one. He is especially indifferent if the

-38-
travel is not very long and therefore unnecessary to pay for better service. Icelandair has
a niche in business class travelers. When the airline responded to decreasing first class
sales following the recession by including the “Economy-Comfort” class, it may have
saved the demand but in my view they subsequently reduced the differentiation from
Iceland Express.
Overall I estimate that the average individual leisure and business traveler have
low bargaining power but large volume buyers like corporations and travel agencies
have medium strength.
4.2.5 Bargaining power of suppliers Suppliers have the bargaining power to squeeze profit out of the industry by threatening
to raise prices or reduce the quality of purchased goods and services. To which degree
this pressure from suppliers becomes, relies a great deal on conditions that mirror those
making buyers powerful (Porter, 1980).
Labor unions
Icelandair Group‟s highest items of expenditures are salaries and other personnel
expenses with the average of 30% of total operating expenses since 2006. Labor must
be recognized as suppliers, particularly as the airline and tourist industry is labor-
intensive. Moreover the industry includes highly skilled employees and tightly
unionized labor which according to Porter (1980) means that this supplier can bargain
away a significant fraction of potential profits. As I mentioned in the PESTEL analysis
in section 4.1.3, airlines always run the risk that the labor unions use their rights to
strike if the two parties do not reach an agreement in re-negotiations. This right gives
the suppliers a powerful weapon to bargain. Icelandair has the reputation of employing
very qualified pilots and whilst the airline sticks to that strategy instead of recruiting
less experienced pilots on lower salary, this group of suppliers maintains a considerable
bargaining power.
Jet Fuel suppliers
Aircraft fuel is the second highest cost item with 18% average of the total cost base over
the 5 years period. At present, airlines cannot operate without the jet fuel and there are
only a small number of suppliers on the market which is highly concentrated. Jet fuel
suppliers have no influence on the world market price of crude oil which is their main
-39-
ingredient. That tones down their bargaining power. The search and implementation of
more sustainable and cheaper energy like bio fuel is ongoing. As long as that issue
remains unsolved, airlines have to accept being highly dependent on the price and the
availability of the jet fuel.
Aircraft prices and operations
The market for commercial airplane manufacturers is best described as a duopoly
market with the two giant providers Boeing and Airbus dominant. Although they are
contingent upon the sales to the commercial airlines, the two airplane suppliers have the
bargaining advantage. Icelandair Group for example mainly uses Boeing aircraft,
reportedly to minimize costs while maximizing passenger safety (Icelandair Group hf.,
2010). When the airlines have investment preferences like that, the aircraft brands are
differentiated for the firms and they get stuck with extremely high switching costs.
Airports are in a favorable bargaining position against Icelandair concerning the
landing and takeoff authorizations. The airport in Keflavík is the only International
airport on the home market and Icelandair does not make up a considerable part of fly
traffic abroad. Icelandair Group has a good strategic position against smaller suppliers
because of backward integration. The subsidiaries carry out all the aircraft maintenance,
ground services, finance and accounting work etc.
I conclude that the suppliers enjoy a medium to strong bargaining power against
the Group.
4.3 Icelandair Groups core competences In order to relate the strategic analysis to the financial analysis I explore the following
representation of the ROIC formula that links strategy and competitive advantage to
return on invested capital (Tim Koller, 2010):
Accordingly, the reasons why companies that enjoy competitive advantage earn higher
ROIC is because they charge higher price premiums or produces its products more
efficiently, or both.
Competitive advantage is divided into two groups based on its sources: the first
being price premium and the second cost and capital efficiency (Tim Koller, 2010). I
could list numerous strategic moves from the discussions above that could be
categorized into these groups. Icelandair Group increased their cost efficiency for
-40-
example when they started to offer self check-in on airports and mobile boarding passes.
On the other hand, that did not secure competitive advantage because all the other
airlines had the same opportunity for cost improvements which eventually results in
lower ticket prices for the customers. Competitive advantage has to be unique for the
company, something that is difficult for competitors to replicate. I identified three
sources of competitive advantages from which Icelandair Group benefits.
Price premium
A company has competitive advantage when the cost of providing extra quality
compared to competitors is less than the price premium that customers are willing to
pay for the additional quality. Icelandair has a distinctive standing in the mind of
Icelanders thanks to its long aviation history. The airline has a dominant position on the
home market and competes based on its high quality perceived by customers and its
brand. Quality and brand are usually highly correlated and it can be hard to distinguish
their differences but sometimes the brand is what matters more if has lasted very long
(Tim Koller, 2010). Icelanders are willing to pay higher fares for better quality from an
airline they trust.
Cost and capital efficiency
Icelandair is a small player on the transatlantic route. The competition is high, the brand
perception is low and the airline is forced to compete based on prices like all other
companies. The airline cannot transport passengers over the ocean with lower costs than
others but Icelandair has a competitive advantage in a unique aircraft fleet utilization.
The geographical position of Iceland means that Icelandair is closer to its customers on
both sides of the Atlantic. The airline manages to exploit this opportunity with the route
network that allows for a utilization of a sizable part of the aircraft fleet almost around
the clock. Capital efficiency means selling more products or service per unit of invested
capital than competitors. In the preceding formula that means lower denominator and
higher ROIC.

-41-
4.4 SWOT analysis
Figure 4.7: SWOT
Source: Own creation & (Lynch, 2006).
4.5 Summary Overall I conclude that conducting business in the airline and tourist industry is
extremely challenging because of many external influences that constantly change the
business environment. As a result, the industry is very cyclical and uncertain. These are
factors like fuel price fluctuations and currency development, which is especially
important to Icelandair Group due to a small home currency. I estimate that the global
GDP growth is the single most determinant factor as the GDP has much to do with how
others external factors fluctuate. The Groups core competences are price premium on
the home market and capital efficiency on the transatlantic market.
5 Financial analysis Like I mentioned in chapter 1.2 companies value is primarily driven by ROIC and
growth. To find out the fair value of Icelandair Group I have to dig into the financial
statements and evaluate the historical financial performance. Unfortunately the financial
statements are not originally prepared for thorough investigation of operating
performance and value. First I have to reformulate the statements into operating items,
non-operating items and sources of financing.
With the reformulated financial income statements in place I can calculate the
key numbers like value drivers and growth. A company can grow year by year based on
Strenghts
-Dominant position in Iceland
-High quality
-Strong brand
-Aircraft fleet utilization
-Diversification
-Vertical integration
-Strong ownership
Weaknesses
-Small home market
-Capital control in Iceland
-Unstable business
-Seasonality
-Sensitivity to external threats
Opportunities
-The devaluation of the Icelandic Krona
-Increased number of tourists to Iceland
-Lenghten the tourist season
-High income from foreign origin
-Future growth outside of Iceland
-New investors
Threats
- Volcanic eruptions!
-GDP growth
-Fuel prices
-Environmental regulations - Carbon Emissions
-New and current competitors
-Tax increases
-Icelandair has almost reached max utilization
SWOT

-42-
earnings from solid operations, but a quicker way to grow is to take over others
operations with a fair premium. I will uncover these acquisition effects and also
currency effects to determine the real organic revenue growth.
When I have calculated the organic revenue growth I can analyze it historically
along with the Groups cost base, on which I later build my forecast.
5.1 Financial Statement Analysis The consolidated financial statements of Icelandair Group have from its foundation
been prepared in accordance with International Financial Reporting Standards22
as
adopted by the EU with additional Icelandic disclosure requirements for listed
companies. The management signs the financial statements in good faith and that they
give a true and fair view of the financial performance. It is stated that when preparing
the financial statements the management is requires to make judgements, estimates and
assumptions that effect the application of accounting policies and the reported amounts
of assets, liabilities, income and expenses. Actual results may differ from these
estimates (Icelandair, 2011). For me this looks like a safeguard against mistakes but also
against manipulation to which accounting is often subject. Especially when the
performance has not lived up to expectations and the management wants investors to
keep faith in the company until the operations improve. I investigated the numbers
critically in my quest for the fair value.
Icelandair Group started operations in October 2006 but the financial statement
for the first year was prepared so that it illustrated how the operations might have been
if the acquisition of Icelandair Group hf. had been effected at the beginning of the year.
I analyzed the pro-forma financial statement for 2006 and the full year financial
statements for the years 2007 to 2010.
NOPLAT
The mission of this chapter is to find the historical growth in ROIC which can be
calculated according to the following formula (Tim Koller, 2010):
OI NOPL
In e ed pi l
22
IFRS.
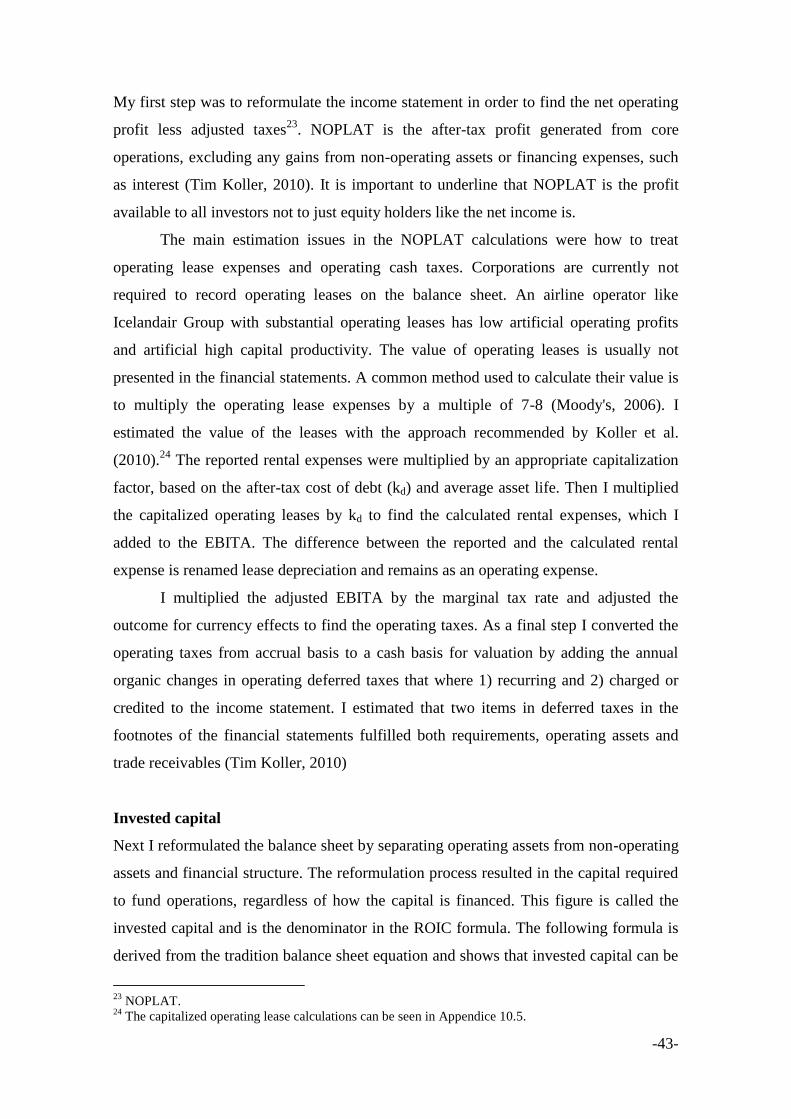
-43-
My first step was to reformulate the income statement in order to find the net operating
profit less adjusted taxes23
. NOPLAT is the after-tax profit generated from core
operations, excluding any gains from non-operating assets or financing expenses, such
as interest (Tim Koller, 2010). It is important to underline that NOPLAT is the profit
available to all investors not to just equity holders like the net income is.
The main estimation issues in the NOPLAT calculations were how to treat
operating lease expenses and operating cash taxes. Corporations are currently not
required to record operating leases on the balance sheet. An airline operator like
Icelandair Group with substantial operating leases has low artificial operating profits
and artificial high capital productivity. The value of operating leases is usually not
presented in the financial statements. A common method used to calculate their value is
to multiply the operating lease expenses by a multiple of 7-8 (Moody's, 2006). I
estimated the value of the leases with the approach recommended by Koller et al.
(2010).24
The reported rental expenses were multiplied by an appropriate capitalization
factor, based on the after-tax cost of debt (kd) and average asset life. Then I multiplied
the capitalized operating leases by kd to find the calculated rental expenses, which I
added to the EBITA. The difference between the reported and the calculated rental
expense is renamed lease depreciation and remains as an operating expense.
I multiplied the adjusted EBITA by the marginal tax rate and adjusted the
outcome for currency effects to find the operating taxes. As a final step I converted the
operating taxes from accrual basis to a cash basis for valuation by adding the annual
organic changes in operating deferred taxes that where 1) recurring and 2) charged or
credited to the income statement. I estimated that two items in deferred taxes in the
footnotes of the financial statements fulfilled both requirements, operating assets and
trade receivables (Tim Koller, 2010)
Invested capital
Next I reformulated the balance sheet by separating operating assets from non-operating
assets and financial structure. The reformulation process resulted in the capital required
to fund operations, regardless of how the capital is financed. This figure is called the
invested capital and is the denominator in the ROIC formula. The following formula is
derived from the tradition balance sheet equation and shows that invested capital can be
23
NOPLAT. 24
The capitalized operating lease calculations can be seen in Appendice 10.5.

-44-
calculated using the operating method or the financing method (Tim Koller, 2010). By
adding non-operating assets I get the total funds invested.
I capitalized the operating leases and included them in the invested capital, just
like if the Group had used debt financing for their aircrafts and hotel buildings.
Free Cash Flow25
I started with NOPLAT in my FCF calculations instead of net income like in the
reported cash flow statement and excluded any non-operating flows and items related to
capital structure like the following formula shows (Tim Koller, 2010):
Next I added the depreciation and amortization of operating intangibles and subtracted
the investments invested capital which resulted in after-tax cash flow as if the company
held only core operating assets and financed the business entirely with equity (Tim
Koller, 2010). To get the FCF available to all investors I added non-operating cash
flows.
I treated the capitalized operating leases in the FCF just like other operating assets
by subtracting the annual investments which were substantial in the Groups expanding
years.
5.2 Organic revenue growth Before I went on to build my forecast based on the historical revenue growth I
investigated how much of the growth were the contribution of a sound operation and
how much growth was due to non-recurring items. Like concluded in chapter 4.1.2, the
majority of the Groups income and expenses are denominated in USD. Foreign currency
translation differences can recur when the currency is converted to ISK in the end of the
fiscal year.
Figure 5.1 presents the difference between the reported and the organic revenue
growth caused by currency effects and acquisition effect. In the years 2007 and 2008
when the Group followed its investment strategy, it reported a solid 13% average
revenue growth. When I stripped down the effects of currency translations and the
acquisition of Travel Service the average organic growth for the two years is only 1%.
25
FCF.
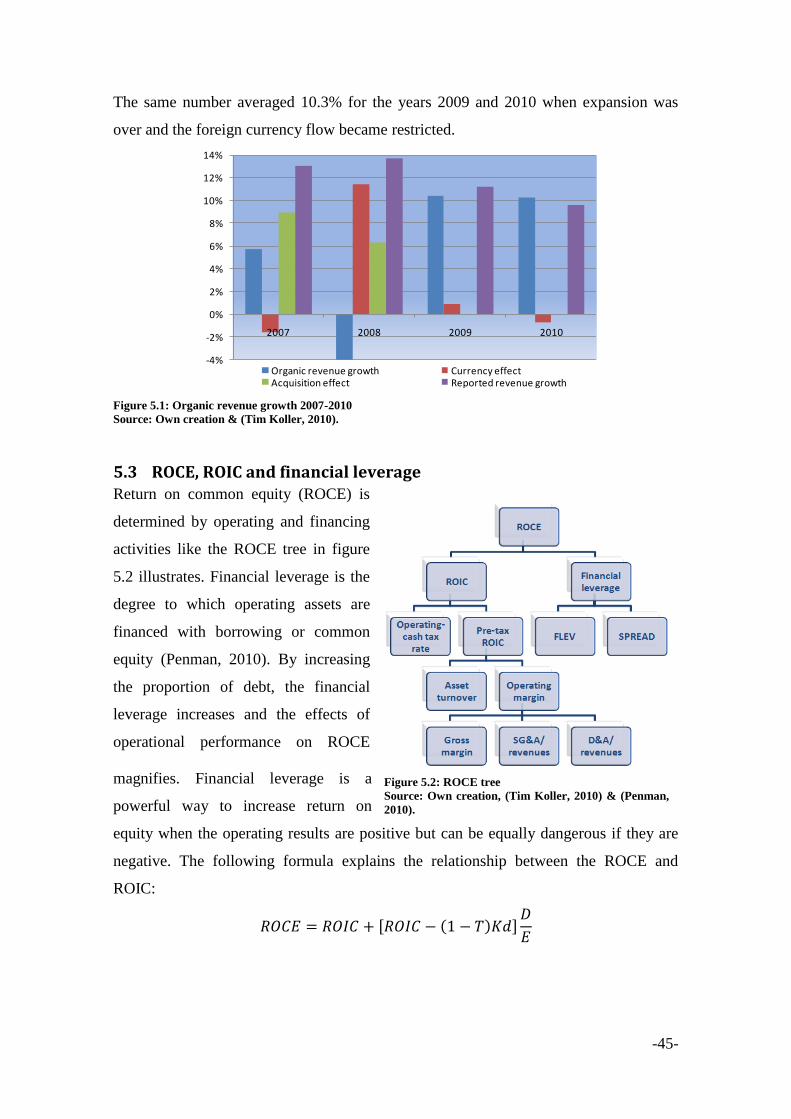
-45-
The same number averaged 10.3% for the years 2009 and 2010 when expansion was
over and the foreign currency flow became restricted.
Figure 5.1: Organic revenue growth 2007-2010
Source: Own creation & (Tim Koller, 2010).
5.3 ROCE, ROIC and financial leverage Return on common equity (ROCE) is
determined by operating and financing
activities like the ROCE tree in figure
5.2 illustrates. Financial leverage is the
degree to which operating assets are
financed with borrowing or common
equity (Penman, 2010). By increasing
the proportion of debt, the financial
leverage increases and the effects of
operational performance on ROCE
magnifies. Financial leverage is a
powerful way to increase return on
equity when the operating results are positive but can be equally dangerous if they are
negative. The following formula explains the relationship between the ROCE and
ROIC:
-4%
-2%
0%
2%
4%
6%
8%
10%
12%
14%
2007 2008 2009 2010
Organic revenue growth Currency effectAcquisition effect Reported revenue growth
Figure 5.2: ROCE tree
Source: Own creation, (Tim Koller, 2010) & (Penman,
2010).
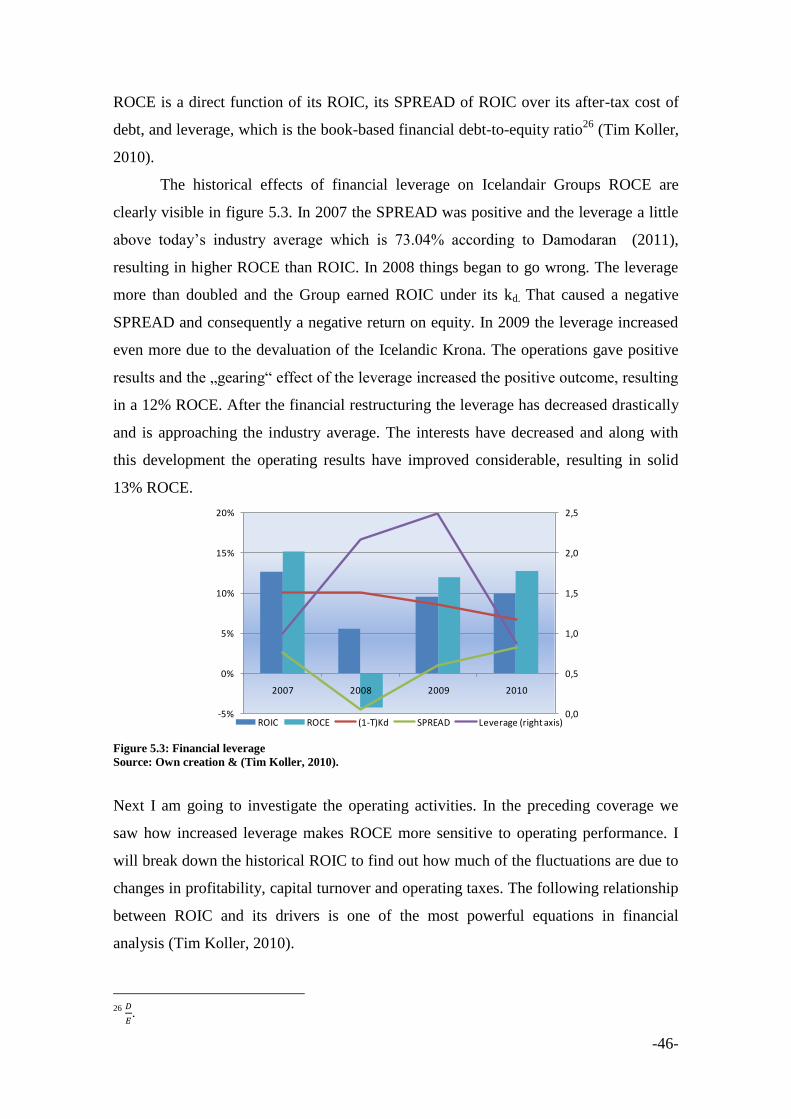
-46-
ROCE is a direct function of its ROIC, its SPREAD of ROIC over its after-tax cost of
debt, and leverage, which is the book-based financial debt-to-equity ratio26
(Tim Koller,
2010).
The historical effects of financial leverage on Icelandair Groups ROCE are
clearly visible in figure 5.3. In 2007 the SPREAD was positive and the leverage a little
above today‟s industry average which is 73.04% according to Damodaran (2011),
resulting in higher ROCE than ROIC. In 2008 things began to go wrong. The leverage
more than doubled and the Group earned ROIC under its kd. That caused a negative
SPREAD and consequently a negative return on equity. In 2009 the leverage increased
even more due to the devaluation of the Icelandic Krona. The operations gave positive
results and the „gearing“ effect of the leverage increased the positive outcome, resulting
in a 12% ROCE. After the financial restructuring the leverage has decreased drastically
and is approaching the industry average. The interests have decreased and along with
this development the operating results have improved considerable, resulting in solid
13% ROCE.
Figure 5.3: Financial leverage
Source: Own creation & (Tim Koller, 2010).
Next I am going to investigate the operating activities. In the preceding coverage we
saw how increased leverage makes ROCE more sensitive to operating performance. I
will break down the historical ROIC to find out how much of the fluctuations are due to
changes in profitability, capital turnover and operating taxes. The following relationship
between ROIC and its drivers is one of the most powerful equations in financial
analysis (Tim Koller, 2010).
26
.
0,0
0,5
1,0
1,5
2,0
2,5
-5%
0%
5%
10%
15%
20%
2007 2008 2009 2010
ROIC ROCE (1-T)Kd SPREAD Leverage (right axis)

-47-
I calculated the ROIC using the average investing capital each year and both with and
without goodwill to see how the premiums paid for acquisitions have a decreasing effect
on the ROIC. Like figure 5.4 demonstrates, the ROIC in 2007 was 12.7%. Capital
turnover and profitability were high and increase in deferred operating taxes causes an
extremely low operating cash tax rate of 5%. In 2008 the ROIC decreased to only 5.5%
because of aggregating effects of all the three drivers. In 2009 we see other evidence of
improved operational performance as the profitability is the main driver behind an
increase in the ROIC to 9.6%. The government increased the marginal tax on
corporations from 15% to 18% in 2010. Despite that, the ROIC turned out to be 9.9%
because of increase in both capital turnover and profitability after the financial
restructuring.
Figure 5.4: ROIC break-down
Source: Own creation & (Tim Koller, 2010).
5.4 Operating costs and cost drivers In my opinion, the operating margin is a metaphor for the roots of the ROCE tree, the
foundation on which the final operating results rely. Next I will compare Icelandair
Groups operating margin for 2010 to the operating margin of a chosen peer group. The
results are presented in figure 5.5. I complete my investigation of the operating
activities of Icelandair Group with an analysis of the historical operational costs, and a
search for the main cost drivers.
0%
20%
40%
60%
80%
100%
120%
140%
0%
5%
10%
15%
20%
25%
2007 2008 2009 2010ROIC excluding goodwill ROIC including goodwillOperating cash taxes ProfitabilityCapital turnover (right axis)
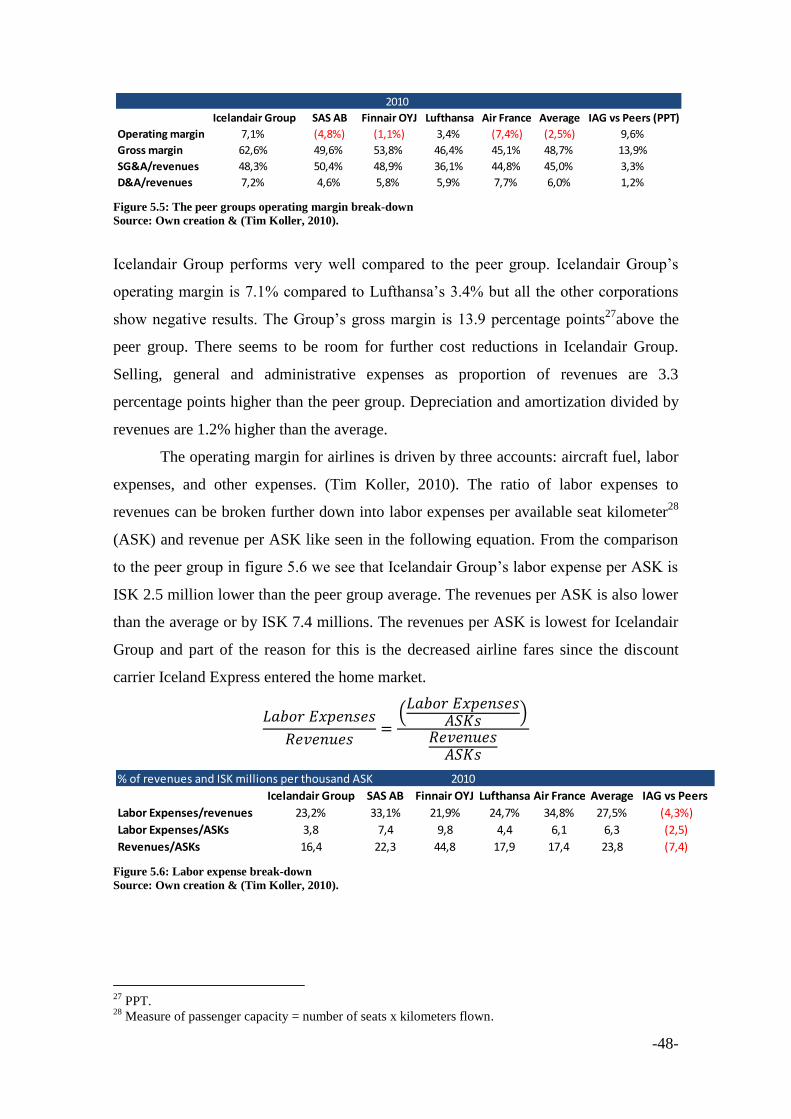
-48-
Figure 5.5: The peer groups operating margin break-down
Source: Own creation & (Tim Koller, 2010).
Icelandair Group performs very well compared to the peer group. Icelandair Group‟s
operating margin is 7.1% compared to Lufthansa‟s 3.4% but all the other corporations
show negative results. The Group‟s gross margin is 13.9 percentage points27
above the
peer group. There seems to be room for further cost reductions in Icelandair Group.
Selling, general and administrative expenses as proportion of revenues are 3.3
percentage points higher than the peer group. Depreciation and amortization divided by
revenues are 1.2% higher than the average.
The operating margin for airlines is driven by three accounts: aircraft fuel, labor
expenses, and other expenses. (Tim Koller, 2010). The ratio of labor expenses to
revenues can be broken further down into labor expenses per available seat kilometer28
(ASK) and revenue per ASK like seen in the following equation. From the comparison
to the peer group in figure 5.6 we see that Icelandair Group‟s labor expense per ASK is
ISK 2.5 million lower than the peer group average. The revenues per ASK is also lower
than the average or by ISK 7.4 millions. The revenues per ASK is lowest for Icelandair
Group and part of the reason for this is the decreased airline fares since the discount
carrier Iceland Express entered the home market.
Figure 5.6: Labor expense break-down
Source: Own creation & (Tim Koller, 2010).
27
PPT. 28
Measure of passenger capacity = number of seats x kilometers flown.
Icelandair Group SAS AB Finnair OYJ Lufthansa Air France Average IAG vs Peers (PPT)
Operating margin 7,1% (4,8%) (1,1%) 3,4% (7,4%) (2,5%) 9,6%
Gross margin 62,6% 49,6% 53,8% 46,4% 45,1% 48,7% 13,9%
SG&A/revenues 48,3% 50,4% 48,9% 36,1% 44,8% 45,0% 3,3%
D&A/revenues 7,2% 4,6% 5,8% 5,9% 7,7% 6,0% 1,2%
2010
% of revenues and ISK millions per thousand ASK 2010
Icelandair Group SAS AB Finnair OYJ Lufthansa Air France Average IAG vs Peers
Labor Expenses/revenues 23,2% 33,1% 21,9% 24,7% 34,8% 27,5% (4,3%)
Labor Expenses/ASKs 3,8 7,4 9,8 4,4 6,1 6,3 (2,5)
Revenues/ASKs 16,4 22,3 44,8 17,9 17,4 23,8 (7,4)
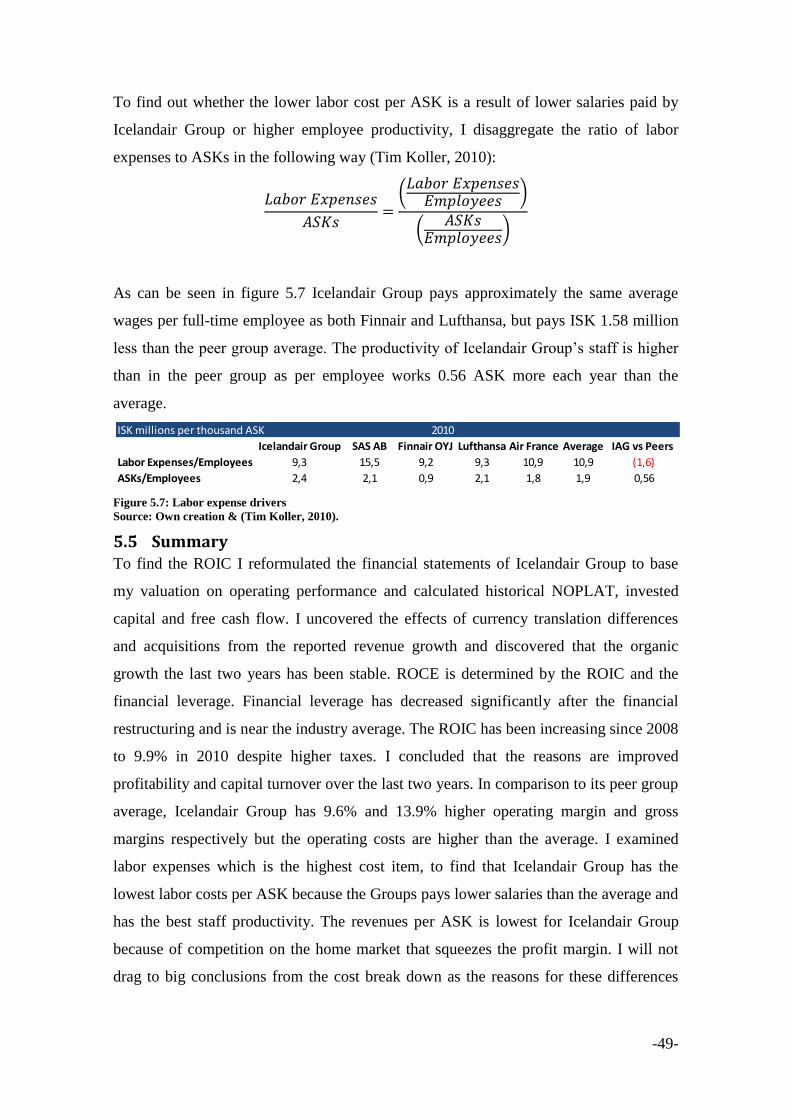
-49-
To find out whether the lower labor cost per ASK is a result of lower salaries paid by
Icelandair Group or higher employee productivity, I disaggregate the ratio of labor
expenses to ASKs in the following way (Tim Koller, 2010):
As can be seen in figure 5.7 Icelandair Group pays approximately the same average
wages per full-time employee as both Finnair and Lufthansa, but pays ISK 1.58 million
less than the peer group average. The productivity of Icelandair Group‟s staff is higher
than in the peer group as per employee works 0.56 ASK more each year than the
average.
Figure 5.7: Labor expense drivers
Source: Own creation & (Tim Koller, 2010).
5.5 Summary To find the ROIC I reformulated the financial statements of Icelandair Group to base
my valuation on operating performance and calculated historical NOPLAT, invested
capital and free cash flow. I uncovered the effects of currency translation differences
and acquisitions from the reported revenue growth and discovered that the organic
growth the last two years has been stable. ROCE is determined by the ROIC and the
financial leverage. Financial leverage has decreased significantly after the financial
restructuring and is near the industry average. The ROIC has been increasing since 2008
to 9.9% in 2010 despite higher taxes. I concluded that the reasons are improved
profitability and capital turnover over the last two years. In comparison to its peer group
average, Icelandair Group has 9.6% and 13.9% higher operating margin and gross
margins respectively but the operating costs are higher than the average. I examined
labor expenses which is the highest cost item, to find that Icelandair Group has the
lowest labor costs per ASK because the Groups pays lower salaries than the average and
has the best staff productivity. The revenues per ASK is lowest for Icelandair Group
because of competition on the home market that squeezes the profit margin. I will not
drag to big conclusions from the cost break down as the reasons for these differences
ISK millions per thousand ASK 2010
Icelandair Group SAS AB Finnair OYJ Lufthansa Air France Average IAG vs Peers
Labor Expenses/Employees 9,3 15,5 9,2 9,3 10,9 10,9 (1,6)
ASKs/Employees 2,4 2,1 0,9 2,1 1,8 1,9 0,56

-50-
can be a mixture of a lot of other factors. The analysis gave me insight into the
competitive differences between the corporations.
6 Forecasting After the strategic and financial analysis of Icelandair Groups history the next step was
to build a forecast based on the conclusions. The bygone developments and patterns can
give an indication of the future but like legendary investor Warren Buffet put it so
cleverly: “If past history was all there was to the game, the richest people would be
librarians“ (Lewis, 2011).
The first mission in the forecasting process was to find a fitting forecast period
for the industry. An explicit forecast period of five years tends to be too short and often
leads to an undervaluation of the company. Using exceedingly long period creates
problems in predicting individual line items perhaps ten to fifteen years into the future
(Tim Koller, 2010).
When the length of the explicit forecast period was decided the next assignment
was to use the drivers that I concluded were most decisive for the revenue growth to
build the revenue forecast. When I had that in place I could base the forecasted income
statement and the balance sheet to a great deal on the forecasted revenues. Lastly I
calculated ROIC and FCF for the forecast period in the same manner as in the historical
analysis, and at that point I had all what I needed for the valuation process.
6.1 The explicit forecast period Koller et al. (2010) argues that the explicit forecast period should be long enough that
the company„s growth rate is less than or equal to that of the economy (Tim Koller,
2010). I decided to use a ten years explicit forecast period from 2011 to 2020, because I
assume that by then the Group should have reached a steady growth rate. This matches
the forecast horizon for airlines recommended by Morrell (2007). The industry is very
cyclical and ten years is considered long enough to include any future downturn.
6.2 The revenue forecast After the strategic analysis in chapter 4 I concluded that the GDP growth has the biggest
impact on air traffic growth. The state of the world economy influences other external
factors that threaten airlines as they operate across borders. The effects of the current
recession on the industry is solid evidence of this.
I decided to build a GDP forecast weighted in each of the major currencies that
contribute considerable to Icelandair Groups income. The total revenues for 2010 are

-51-
split between regions and displayed in figure 6.1. I gathered GDP forecasts for the
largest regions. Revenues from Iceland were 28% of total revenues and Statistics
Iceland provides a detailed GDP forecast until 2016 (Statistic Iceland, 2011). I used a
detailed forecast until 2012 for all the European countries provided by Eurostat (2011).
Revenues from Scandinavia were 14% of the total revenues and 22% from rest of
Europe. I used a ten year GDP forecast for North America which contributed 16% of the
total revenues (United North America, 2011). For the last years I used the average from
2006 in each currency.
IATA expects 3.1% global
GDP growth in 2011 and 5.6%
passenger growth (IATA, 2011).
That is a multiplier of 1.8 between
estimated GDP growth and air
traffic growth. Morrell (2007)
suggests using air traffic growth
that is twice the growth of the GDP
and that multiplier should decline
steadily towards 1 as maturity
is approached. This method
gave me a 2.17% air traffic growth which is much lower than the historical industry
average of 5%-6% (IATA, 2010). Mckinsey&Company (2007) uses a multiplier of
1.65. In my view it is reasonable to assume that the long term air traffic growth
approaches the general economy growth to some degree but not completely given the
historical facts. That is why I used 1.8 as multiplier for 2011 and 1.65 for the remaining
years which resulted in a 3.73% air traffic growth for 2020. Although this is lower than
the historical growth in passenger air travel I consider it a fair growth because the
Group operates in the cargo, leasing and tourist industries as well.
The measure that airlines use to quantify, predict and promote their air traffic
data is ASKs. To estimate the ASKs for 2011 I used Icelandair Groups traffic numbers
for the first four months. Icelandair‟s ASKs increased by 17% compared to the 2010
numbers, passengers increased by 22% and the load factor was 79.2% in April, which is
a record. The fleet utilization was amazingly high or 95%, up by 6% since 2010. Air
Iceland‟s ASKs increased by 9%, and the available tonne kilometers (ATKs) in the
cargo operations increased by 5%. Available hotel room nights were at the 2010 levels
Figure 6.1: Total revenue contribution by regions 2010
Source: Own creation and Icelandair Groups Annual Report 2010.
North
Amercia16%
South America
5%
Iceland
28%
Scandinavia
14%
UK6%
Rest of
Europe22%
Asia5%
Oceania4%

-52-
but the sold hotel room nights decreased by 2% because of renovations according to the
company (Icelandair Group, 2011). Icelandair estimates 15%-20% more tourists than in
2010 based on the promising booking status for the high season (Nasdaq OMX, 2011).
To meet this increase the airline is raising the capacity by 18% before the summer
(Icelandair, 2011). These predictions of increasing tourism can be supported by the
latest numbers of traffic through the Keflavík International airport. There was a 17.5%
increase in tourists to Iceland in the first four months of 2011 compared to 2010
(Icelandic Tourist Board, 2011))
Derived from these facts I estimated an 18% increase in both Icelandair‟s ASKs
and the available hotel room nights. I predict a 4% increase in Air Iceland‟s ASK‟s
which is twice the forecasted GDP in Iceland. Loftleiðir Icelandic has increased its
capacity by 11.1% following good results last year, consequently, I use that number as
the estimated revenue increase in aircraft and aircraft lease (Icelandair, 2011). IATA
predicts a 6.1% air cargo growth and as a result I expect the same growth in ATKs.
For the rest of the explicit forecast period I use the growth rate in my weighted
GDP and the multiple, times the revenue drivers ASKs, ATKs, and available hotel room
nights for 2011. Finally I found the forecast ratio between the 2010 revenues and the
relevant forecast driver and multiplied that ratio by the pre-discussed estimate of its
driver. I removed Bluebird Cargo‟s revenues for 2010 from total revenues because the
business was divested in the financial restructuring.
6.3 Financial statements forecast The following are my main assumptions about the forecast drivers for the line items in
the financial statements. The forecasted revenues are used for most items but I made
exception in cases where I believed there were more relevant drivers available.
Income statement and NOPLAT
When I analyzed the historical cost base I discovered that each cost item has been a
rather stable proportion of the total operating revenues. Figure 6.2 shows that the most
noticeable differences are the decreasing salary expenses following the cutback in 2008,
the fluctuations in the fuel price and escalating leasing costs along with the expanded
capacity. Considering this development I decided to use the revenue growth as the
driver for all the operating costs. In that way I can make sure that for example the
aircraft and aircrew lease expenses rise with the announced capacity increase 2011
which I included in the revenue forecast. The only exception is the aircraft fuel costs for

-53-
which I expect a 20%
increase in 2011. The
estimation is based on
the 31% rise in
Icelandair Groups fuel
costs the first quarter of
2011 (Nasdaq OMX,
2010), its hedging
strategy and ISK 9.5
billion EBITDA forecast
for the year (Icelandair, 2011) and the IATA industry outlook report (IATA, 2011).
I used the operating assets the prior year as a cost driver for depreciation of
operating assets. The operating lease depreciation is the difference between the reported
aircraft and aircrew lease expenses and the calculated after-tax operating lease expense.
Prior year cash and cash equivalents were the drivers for interest income. The interest
expenses are set according to the borrowing repayment schedule in the footnotes of the
2010 annual report. I did not forecast the foreign currency fluctuations as they are very
unpredictable.
Balance sheet and invested capital
I adopted the 2% proxy used for the working cash from Koller et.al. (2010). The
remaining of the cash and cash equivalents is considered excess cash. I concluded that
the forecasted revenues were the appropriate driver for the operating intangibles which
mainly consist of trademarks and slots. I hold the goodwill at constant level for the
reasons that potential acquisitions are difficult to model and the typical acquisition fails
to create value according to the empirical literature (Tim Koller, 2010). For the same
reasons and the fact that Icelandair Group‟s future focus will be on core business, I did
not allow for any investments in associates. The sale process of the assets held for sale
will continue as announced and I expect them to be sold within three years. Long-term
cost, receivables and deposits correspond to amounts paid for heavy maintenance, and
deposits for aircraft and engine lease according to the annual report (Icelandair, 2011).
It was rationale in my view to use the capitalized leases as a driver for these items.
Figure 6.2: Operation costs as percentage of revenues 2006-2010
Source: Own creation and Icelandair Groups Annual Report 2010.
35% 34% 29% 26% 27%
20% 17% 23%18% 20%
9% 13% 13%18% 16%
8% 8% 7% 8% 8%6% 9% 8% 9% 9%
21% 20% 20% 20% 21%
0%
50%
100%
2006 2007 2008 2009 2010Salaries and other personnel expenses Aircraft fuelAircraft and aircrew leaseAircraft handling, landing and communicationAircraft maintenance expensesOther operating expenses
-54-
6.4 Summary I concluded that a 10 year explicit forecast period was long enough to counter for the
cyclical nature of the industry. Based on my findings in the strategic analysis, GDP
growth has the most effect on revenue growth. I built a GDP growth forecast weighted
in the Groups main income currencies. I used the forecasted GDP growth to estimate
growth in ASKs, ATKs, and available hotel room nights for 2011 on which I based the
revenue forecast. Most of the line items in the forecasted financial statements are driven
by these drivers.
7 Valuation In the following chapter I start on deciding which of the many valuation models
available are best suitable in the case of Icelandair Group. Next I explain how I estimate
the inputs to the WACC which I use to discount the FCF. Finally I answer the problem
statement and test how sensible the share price is to the calculated inputs.
7.1 Valuation models Damodaran (2002) recognizes three basic approaches to valuation, all with their pros
and cons which I considered before choosing a model. These are: discounted cash flow
valuation, relative valuation and contingent claim valuation. I started off by
investigating the two latter approaches that I was less familiar with than the first one.
Relative valuation
In relative valuation, the value of an asset is derived from the pricing of comparable
assets. In reality this is how we value most assets. Whether we are on the market for a
new house, car or a stock, the value is based on the price of similar assets. In this
approach, company‟s performances are compared on the basis of performance ratios in
the hope to find an undervalued stock compared to the industry average. A multiple
comparison is a quick and simple method that is especially useful when there are a large
number of comparable firms being traded on financial markets. It is argued that the
relative valuation approach is easy to misuse and manipulate when the companies are
chosen in the comparison group because less explicit assumptions are required than for
example in the DCF valuation. In my view, the most significant disadvantage is the fact
that the comparison is not very useful when companies have negative earnings
(Damodaran, 2002) as the case is for many airlines today.

-55-
Contingent claim valuation
The basis of contingent claim valuation is that the value of an asset may not be greater
than the present value of expected cash flows if the cash flows are contingent on the
occurrence or non-occurrence of an event. Probabilities of an event happening are
estimated and a real option pricing model is used in the valuation just as if it was a
traded option. This approach has become widely accepted and DCF models tend to
understate the value of assets when payoffs are contingent on the occurrence of an
event. The contingent claim approach is very relevant when valuing patents and
undeveloped natural resource reserves (Damodaran, 2002) but I concluded that its
application is not as relevant in the case of Icelandair Group.
Discounted cash flow valuation
The DCF is the foundation on which the preceding valuation methods are built. The
DCF is based on the present value rule, where the value of any asset is the present value
of expected future cash flows that the asset generates. The uncertainty around the
expected cash flow is taken into considerations when the discount rate is calculated. The
discount rate is higher for riskier assets and lower for safer projects (Damodaran, 2011).
There are many implementations for the DCF model available. Koller et.al (2010)
mentions the five common frameworks in figure 7.1 and covers their properties.
Figure 7.1: DCF frameworks
Source: Own creation & (Tim Koller, 2010).
Enterprise DCF is the preferred model amongst practitioners and academics because it
relies solely on the cash flow in and out of the company rather than on accounting-based
earnings (Tim Koller, 2010). The main advantage of the enterprise DCF model is that it
Model:Enterprise
DCF
Discounted
economic
profit
Adjusted
present
value
Capital
cash flow
Equity
cash flow
Measure:
Free cash
flow
Economic
profit
Free cash
flow
Capital
cash flow
Cash flow
to equity
Discount
factor:WACC WACC
Unlevered
cost of
equity
Unlevered
cost of
equity
Levered
cost of
equity
Valuation
Pros/cons:
Companies
with target
capital
structure
Highlights
when
company
creates
value
Highlights
changing
capital
structure
Comparison
difficult
between
companies
and over
time
Capital
structure
in FCF,
best when
valuing
banks

-56-
works best for companies that manage their capital structure to a target level like
Icelandair Group after the financial restructuring.
I decided to use the enterprise DCF as my central model. The discounted
economic profit model should yield the same results if applied correctly but it has some
nice properties. The model closely links economic theory and competitive strategy by
highlighting which years the company is earning its cost of capital (Tim Koller, 2010). I
applied the discounted economic profit and the relative valuation with multiples as
supporting approaches.
7.2 WACC The weighted average cost of capital (WACC) is the discount factor that is used in the
enterprise DCF model and the economic profit model. The WACC represents the
opportunity cost that investors face for investing their funds in Icelandair Group instead
of other companies with similar risks. Before calculating the WACC I had to estimate
its three components: the cost of equity, the after-tax cost of debt and the Group„s target
capital structure. The WACC is calculated according to the following equation and
figure 7.2 presents an overview of the inputs used (Tim Koller, 2010):
kd m
ke
Where D = Market value of debt, E = Market value of equity, kd = Cost of debt, ke =
Cost of equity, Tm = Company‟s marginal income tax rate, V = Enterprise value
Figure 7.2: The estimated WACC
Source: Own creation.
The cost of equity
The cost of equity represents the required rate of return that investors expect from their
investment. There are a number of models that estimate cost of equity such as the Fama-
French three-factor model and the arbitrage pricing theory model29
. The capital asset
29
APT.

-57-
pricing model (CAPM) is easier to implement and the most commonly used model. The
subsequent CAPM relationship describes the expected returns on any asset or portfolio
of assets as a function of the expected return on the market portfolio (Verbeek, 2008).
i f i m f
Where
E(Ri) = expected return of security i, Rf = risk-free rate, Βi = stock‟s sensitivity to the
market, E(R m) = expected return of the market
The CAPM formula is not complicated but the challenging part is to estimate its
three required inputs, the risk free rate, the market risk premium and the beta.
The risk-free rate
The ideal risk free rate is a government bond in the same maturity as the cash flow that
should be discounted. I used the 10 year non-indexed Icelandic government bond RIKB
19 0226 (Government Debt Management, Central Bank of Iceland, 2011). Its maturity
is one year before my last explicit forecast year but the next available government bond
maturity is in 2025 and that bond is not traded as frequently. Icelandair Group is
exposed to many currencies, especially the USD. Consequently, I gathered yields for 10
year government bonds in the main currencies that represented the Groups net cash flow
exposure in 2010 (Icelandair Group hf., 2010). Afterward I built a weighted risk-free
rate in these currencies and the outcome was 6.22%.
The market risk premium
The market risk premium is the difference between the market‟s expected return and the
risk-free rate. The market risk premium is a hot topic in corporate finance as it is not
easily observable and the results from the empirical evidences vary. Dimson et.al (2003)
suggests a 3% to 5% risk premium. Fernandez et.al (2010) found that professors used
equity premium in a range from 3% to 10% and that investors used an average around
6% in 2010. Koller et.al (2010) recommends using a premium between 4.5% and 5.5%.
The market risk premium I decided to use is 8% which is the latest update of the
country risk premium for Iceland, published by Damodaran (2011) in January. That
market risk premium reflects in my opinion a fair estimate for a market with a small
currency and capital restrictions compared to the average around 5% for developed
markets.
-58-
The beta
The beta measures how the shares in Icelandair Group move together with the market. It
is the only variable of the three inputs to CAPM that is not common to all companies on
the market. Total risk equals the market risk plus firm-specific risk. The firm-specific
risk can be eliminated by constructing a well diversified portfolio and is therefore not
compensated. The beta is the key to market return as the beta represents the market risk,
which is rewarded (Verbeek, 2008).
The beta is unobservable. For that reason I applied OLS regression on the
CAPM relationship to estimate the beta coefficient. I collected five year monthly returns
for Icelandair Group, companies from its peer group, the S&P 500 (Yahoo!, 2011), the
MSCI world index (MSCI, 2011), and the Bloomberg American airline index (2011). I
regressed the return of the companies upon the return on the market indexes. The
reported unlevered beta for Icelandair Group against the NASDAQ OMX Iceland is
0.431 according to Bloomberg.com which results in a levered beta of 0.85. I have my
doubts about the accuracy of this estimate as the Icelandic stock exchange consists of
only 6 corporations and is highly illiquid. I tried my own regression of the Groups
return against the return of the MSCI index but the outcome was not statistically
significant (Verbeek, 2008). Next I regressed the Bloomberg American airline index
upon the MSCI index. The results were highly statistically significant and after applying
the Bloomberg smoothing formula (Tim Koller, 2010) I got an adjusted beta of 1.20.
This is close to latest beta of 1.21 that Damodaran (2011) suggests for the airline
industry.
I was not convinced that these were the right betas for Icelandair Group
considering the extremely high concentration on the American airline routes. I
undertook several regressions for the companies in the peer group against the S&P
index. The regressions that were statistically significant provided adjusted betas ranging
from 0.76 to 1.29. It is not possible to average the individual betas because of the
varying capital structures between companies. I settled on making my own weighted
European airline index including the companies that gave statistically significant results
in the former regressions. The peer group index was then regressed30
against the MSCI
index which gave statistically significant beta coefficient at the 5% level, with t-value of
30
The regression outputs can be seen in Appendice 10.12.
-59-
4, a p-value of 0.00018 and the R2 value was 21.6. The outcome was a raw beta estimate
of 1.17 and the adjusted beta was 1.12.
When the 6.22% risk free rate, beta value of 1.12 and the 8% market risk
premium were put in the CAPM formula it provided me with a 15.18% expected return
on equity .The only thing needed at this point to calculate the WACC was the cost of
debt.
The cost of debt
There is no liquid market for corporate debt in Iceland. My search for an alternative
value was based on finding an appropriate risk premium on the risk free rate.
Damodaran (2011) suggests using a method where the company is given an estimated
bond rating according to the size of the firm and its interest coverage ratio. Icelandair
Group is categorized as a small firm with market value under USD 5 billion and has an
interest coverage ratio of 3.20. As a consequence the estimated bond rating, default
spread and cost of debt are BB, 3.35% and 9.57% respectively.
There is a repayment schedule and detailed interest rates information about
Icelandair Groups borrowings in the footnote of the financial statements (Icelandair,
2011). I multiplied the interest rate of each loan with the weight of its remaining
principal to the total remaining balance. The summarized weighted cost of debt was
5.08%. It is unlikely that the company can provide debt financing that is lower than the
risk free rate today.
I settled on using a 2.10% credit default spread31
for Iceland found by Damodaran
(2011) in February which is within the 0.5%-4% range suggested by Koller et.al (2010).
The 6.22% risk free rate plus the CDS spread resulted in an estimated 8.22% cost of
debt.
7.3 Valuation results
I used market value of equity but book value of debt over the enterprise value to
complete the WACC calculations because there is no market value available for the
corporate debt. I assumed that the Group had reached its target capital structure after the
financial restructuring. With all the necessary inputs ready I got an estimated WACC of
10.8%.
31
CDS.
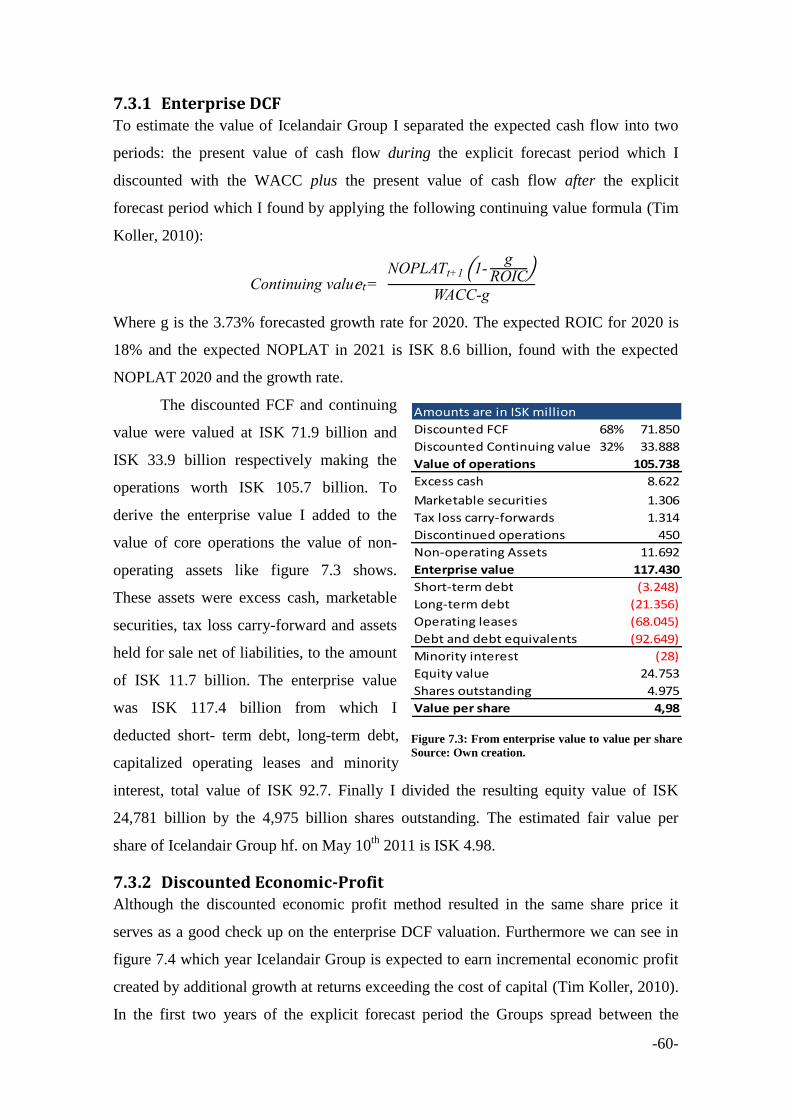
-60-
7.3.1 Enterprise DCF To estimate the value of Icelandair Group I separated the expected cash flow into two
periods: the present value of cash flow during the explicit forecast period which I
discounted with the WACC plus the present value of cash flow after the explicit
forecast period which I found by applying the following continuing value formula (Tim
Koller, 2010):
on in ing l NOPL
g OI
g
Where g is the 3.73% forecasted growth rate for 2020. The expected ROIC for 2020 is
18% and the expected NOPLAT in 2021 is ISK 8.6 billion, found with the expected
NOPLAT 2020 and the growth rate.
The discounted FCF and continuing
value were valued at ISK 71.9 billion and
ISK 33.9 billion respectively making the
operations worth ISK 105.7 billion. To
derive the enterprise value I added to the
value of core operations the value of non-
operating assets like figure 7.3 shows.
These assets were excess cash, marketable
securities, tax loss carry-forward and assets
held for sale net of liabilities, to the amount
of ISK 11.7 billion. The enterprise value
was ISK 117.4 billion from which I
deducted short- term debt, long-term debt,
capitalized operating leases and minority
interest, total value of ISK 92.7. Finally I divided the resulting equity value of ISK
24,781 billion by the 4,975 billion shares outstanding. The estimated fair value per
share of Icelandair Group hf. on May 10th
2011 is ISK 4.98.
7.3.2 Discounted Economic-Profit Although the discounted economic profit method resulted in the same share price it
serves as a good check up on the enterprise DCF valuation. Furthermore we can see in
figure 7.4 which year Icelandair Group is expected to earn incremental economic profit
created by additional growth at returns exceeding the cost of capital (Tim Koller, 2010).
In the first two years of the explicit forecast period the Groups spread between the
Amounts are in ISK million
Discounted FCF 68% 71.850
Discounted Continuing value 32% 33.888
Value of operations 105.738
Excess cash 8.622
Marketable securities 1.306
Tax loss carry-forwards 1.314
Discontinued operations 450
Non-operating Assets 11.692
Enterprise value 117.430
Short-term debt (3.248)
Long-term debt (21.356)
Operating leases (68.045)
Debt and debt equivalents (92.649)
Minority interest (28)
Equity value 24.753
Shares outstanding 4.975
Value per share 4,98
Figure 7.3: From enterprise value to value per share
Source: Own creation.

-61-
ROIC and WACC is negative because of rising fuel costs and thus negative economic
profit. In the last years the invested capital is incrementally decreasing because the
remaining balance of the operating lease payments will be paid the last five years. That
causes decrease in capitalized operating leases and the ROIC increases subsequently.
7.3.3 Multiples Valuation with multiples is a quick and useful check of my DCF forecast. With the use
of a Bloomberg terminal I assembled information about a peer group consisting of 7
European airlines32
that are in similar operations and markets as Icelandair Group. The
first thing I noticed about the peer group is that all of the airlines had a negative return
this year compared to a 48% positive return in the Icelandair Group shares. My belief is
that the volcanic eruptions in 2010 had varying impact on the airlines and the year is not
very convenient for comparison. To avoid inaccuracy due to this, I used forward
looking multiples. That is consistent with the principle of valuation that company‟s
value equals the present value of future cash flow not historical. Forward looking
multiples are usually normalized as they avoid one-time past charges and the empirical
evidence shows that they are more precise than historical (Tim Koller, 2010).
Next I collected information about the peer group‟s performance ratios. Koller
etal. (2010) recommends using the enterprise value (EV) to EBITA multiple for
valuation comparison across companies. I used the EV to EBITDA multiplier for two
reasons: One, I used forward looking multiples and there are not as many EBITA
forecasts available as EBITDA forecasts. Two, Icelandair Group publishes their
forecasts in EBITDA.
When applying the EV/EBITDA multiplier on airlines it has to be kept in mind
that an airline that own a substantial part of its aircraft fleets do not include the
32
The peer group and the multiples are presented in Appendice 10.15.
Amounts are in ISK million Economic Capital Economic Discount Present
Forecast year Invested capital ROIC WACC Spread Profit = NOPLAT charge Profit factor value
2011 86.462 5,5% 10,8% -5,3% -4.593 4.760 9.353 -4.593 0,902 -4.144
2012 74.917 10,6% 10,8% -0,3% -189 7.915 8.104 -189 0,814 -154
2013 65.721 11,6% 10,8% 0,8% 501 7.610 7.109 501 0,735 368
2014 53.399 13,4% 10,8% 2,6% 1.394 7.170 5.776 1.394 0,663 924
2015 48.675 15,1% 10,8% 4,3% 2.076 7.342 5.265 2.076 0,598 1.242
2016 52.067 15,2% 10,8% 4,4% 2.302 7.934 5.632 2.302 0,540 1.243
2017 53.687 14,7% 10,8% 3,9% 2.082 7.889 5.807 2.082 0,487 1.014
2018 52.764 15,5% 10,8% 4,7% 2.459 8.166 5.707 2.459 0,440 1.081
2019 50.652 15,8% 10,8% 4,9% 2.506 7.985 5.479 2.506 0,397 994
2020 48.582 17,0% 10,8% 6,2% 3.022 8.277 5.255 3.022 0,358 1.082
Present value of forecasted Economic Profit during the explicit forecast period 3.652
Figure 7.4: Discounted economic profit valuation
Own creation & (Tim Koller, 2010).
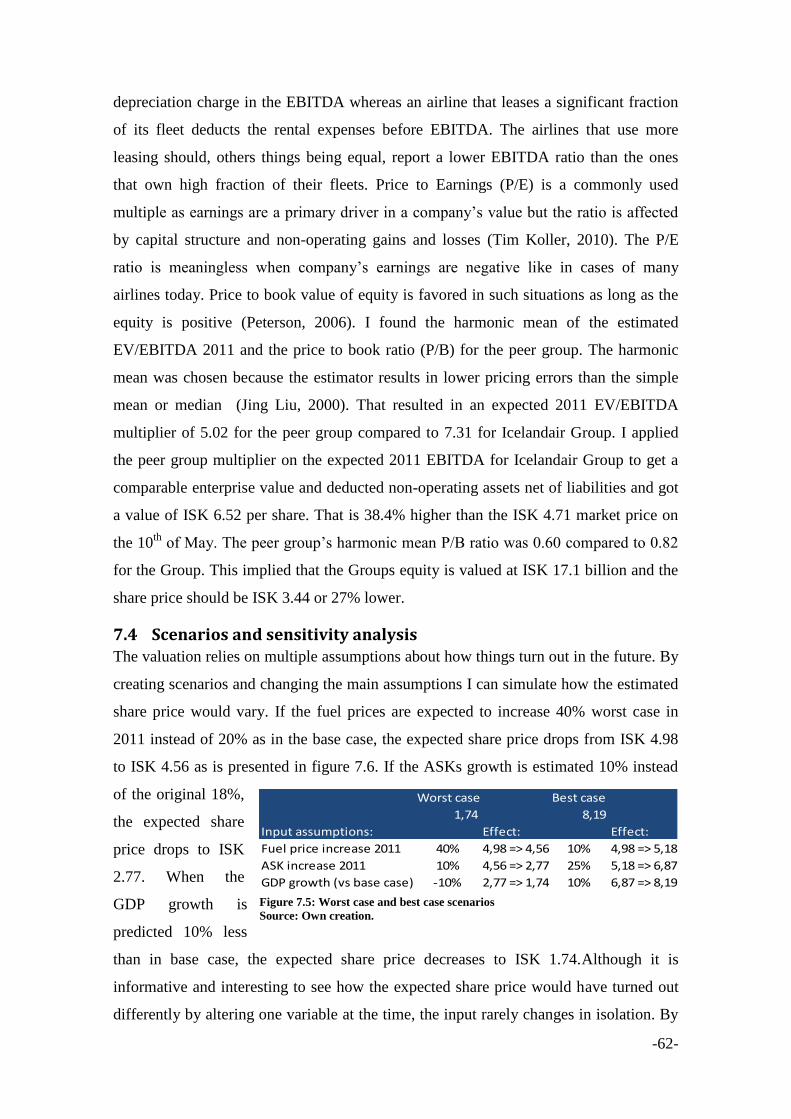
-62-
depreciation charge in the EBITDA whereas an airline that leases a significant fraction
of its fleet deducts the rental expenses before EBITDA. The airlines that use more
leasing should, others things being equal, report a lower EBITDA ratio than the ones
that own high fraction of their fleets. Price to Earnings (P/E) is a commonly used
multiple as earnings are a primary driver in a company‟s value but the ratio is affected
by capital structure and non-operating gains and losses (Tim Koller, 2010). The P/E
ratio is meaningless when company‟s earnings are negative like in cases of many
airlines today. Price to book value of equity is favored in such situations as long as the
equity is positive (Peterson, 2006). I found the harmonic mean of the estimated
EV/EBITDA 2011 and the price to book ratio (P/B) for the peer group. The harmonic
mean was chosen because the estimator results in lower pricing errors than the simple
mean or median (Jing Liu, 2000). That resulted in an expected 2011 EV/EBITDA
multiplier of 5.02 for the peer group compared to 7.31 for Icelandair Group. I applied
the peer group multiplier on the expected 2011 EBITDA for Icelandair Group to get a
comparable enterprise value and deducted non-operating assets net of liabilities and got
a value of ISK 6.52 per share. That is 38.4% higher than the ISK 4.71 market price on
the 10th
of May. The peer group‟s harmonic mean P/B ratio was 0.60 compared to 0.82
for the Group. This implied that the Groups equity is valued at ISK 17.1 billion and the
share price should be ISK 3.44 or 27% lower.
7.4 Scenarios and sensitivity analysis The valuation relies on multiple assumptions about how things turn out in the future. By
creating scenarios and changing the main assumptions I can simulate how the estimated
share price would vary. If the fuel prices are expected to increase 40% worst case in
2011 instead of 20% as in the base case, the expected share price drops from ISK 4.98
to ISK 4.56 as is presented in figure 7.6. If the ASKs growth is estimated 10% instead
of the original 18%,
the expected share
price drops to ISK
2.77. When the
GDP growth is
predicted 10% less
than in base case, the expected share price decreases to ISK 1.74.Although it is
informative and interesting to see how the expected share price would have turned out
differently by altering one variable at the time, the input rarely changes in isolation. By
Worst case Best case
1,74 8,19
Input assumptions: Effect: Effect:
Fuel price increase 2011 40% 4,98 => 4,56 10% 4,98 => 5,18
ASK increase 2011 10% 4,56 => 2,77 25% 5,18 => 6,87
GDP growth (vs base case) -10% 2,77 => 1,74 10% 6,87 => 8,19
Figure 7.5: Worst case and best case scenarios
Source: Own creation.

-63-
performing sensitivity analyses I could capture the interacting effects of two variables at
the time. Figure 7.6 presents how the estimated share price is more sensitive to change
in the WACC than terminal growth rate33
. If the terminal growth rate increases by
0.5ppt from 3.70% to 4.20%, the share price increases by 4.8%. When the WACC is
decreased by 0.5ppt from 10.8%-10.30% the share price increases by 10.2%. If both
these changes happen simultaneously, their interactions would cause the share price to
increase by 16.5%, which is more than the sum of the individual effects.
Figure 7.6: Sensitivity analysis with terminal growth rate and the WACC.
Source: Own creation.
7.5 Summary I concluded that the most suitable valuation model for Icelandair Group is the enterprise
DCF model. The fair value was estimated ISK 4.98 per share. The discounted
economic-profit model gets the same results but has the advantage that it highlights
which year the company is earning its cost of capital. I decided to use both models. I
also performed a valuation with multiples as a check up on my results. The 6.22% risk
free rate was found by weighting the yields on 10 year government bonds in the
currencies that form the Groups net cash flow. I calculated the beta of 1.12 by
regressing my own peer group index including European airlines against the MSCI
world index. The CAPM relationship was used to find the 15.22% cost of capital. I used
Iceland‟s current 2.10% CDS spread on the risk free rate to get the 8.3% cost of debt.
These inputs with the market value of equity and book value of debt resulted in a
WACC of 10.8%. I built a worst case scenario and a best case scenario in which I
changed 3 important drivers for costs and revenues. That gave me expected fair values
of ISK 1.74 in the worst case and ISK 8.19 in the best case. In the sensitivity analysis I
found the expected fair value to be highly sensitive to changes in GDP growth and the
WACC.
33
Sensitivity analyses can further be seen in Appendice 10.17.
4,98 1,70% 2,20% 2,70% 3,20% 3,70% 4,20% 4,70% 5,20% 5,70%
8,80% 6,00 6,32 6,69 7,13 7,65 8,29 9,08 10,09 11,43
9,30% 5,48 5,74 6,04 6,39 6,80 7,29 7,89 8,64 9,59
9,80% 5,03 5,24 5,49 5,77 6,09 6,48 6,94 7,50 8,19
10,30% 4,63 4,81 5,01 5,23 5,49 5,80 6,15 6,58 7,10
10,80% 4,28 4,42 4,58 4,77 4,98 5,22 5,50 5,83 6,23
11,30% 3,96 4,08 4,21 4,36 4,53 4,72 4,94 5,20 5,51
11,80% 3,67 3,77 3,88 4,00 4,14 4,29 4,47 4,67 4,91
12,30% 3,41 3,49 3,58 3,68 3,79 3,91 4,05 4,21 4,39
12,80% 3,18 3,24 3,31 3,39 3,48 3,58 3,69 3,81 3,96
Share price Terminal growth rate
WAC
C

-64-
8 Conclusion My motivation for valuating Icelandair Group was to find out whether it was a good
deal to buy the Icelandair Groups stock for ISK 2.5 in a share offering in December
2010. The Groups largest creditors converted part of its debt into equity in the company
at the price of ISK 5 per share. The government had just taken over the banks after a
total collapse of the banking system and the nation felt that money was being wasted
again.
To find out the fair value of Icelandair Group I knew I had to start by knowing
the company and its business strategy. I learned that Icelandairs Hub and Spoke concept
is essential to the business model. The route network that consists of 3 subsidiaries,
feeds business into the tourist service that consists of 6 subsidiaries. The central focus
had been on investing activities in the years before the financial crises. The company
made poor investments that did not contribute to the company‟s viability. This was
mainly financed with borrowing in foreign currency. When the Krona had depreciated
by 127% since the investments were made, the maturity profile was not manageable for
the firm and the balance sheet was not sustainable. In the financial restructuring ISK 8.2
billion were raised in new share capital and ISK 3.6 billion of debt was swapped for
shares. Furthermore, non-core assets were divested and the proceeds were used to
reduce interest bearing debt by ISK 9.4 billion.
Growth and ROIC are the main drivers of a company‟s value. Knowledge of
Icelandair Groups external business environment was necessary to see whether the
company had the capabilities to keep up a long term rate of return. In a PESTEL
analysis of the macro-economic factors I found that GDP growth, fuel price and
currency fluctuations were the biggest threats for Icelandair Group. I applied the
Porter‟s five forces model which confirmed my belief, that the competitive forces in the
airline and tourism industry are very strong and profitability potential low. I identified
three sources of competitive advantages from which Icelandair Group benefits. Firstly,
price premium through its quality and brand on the home market. Secondly, cost and
capital efficiency through the unique utilization of its aircraft fleet on the transatlantic
route due to the convenient geographical location of its hub.
I wanted to determine whether Icelandair Groups profits were based on
fundamental operations or accounting manipulating and non-recurring items. Profits
originating from the core business are expected to be maintained in the future and
eventually realized. The financial statements were reformulated to find the drivers for
-65-
growth and ROIC. I separated the effects of currency differences and acquisitions from
the reported revenue growth, which was 13% on average in 2007-2008. Interestingly,
that growth was only 1% attributable to core revenue growth but the same number
averaged 10.3% in 2009-2010. The ROIC was calculated with and without goodwill and
I discovered how the premiums paid for poor investment decrease the ROIC. ROCE is
determined by the ROIC and the financial leverage. In the investment period the
increased borrowing “leveraged” the negative ROIC into an even more negative ROCE.
Since 2009, the financial leverage has decreased significantly which has increased the
positive ROIC into an even higher ROCE. The ROIC has been increasing since 2008 to
9.9% in 2010 despite higher taxes. I concluded that the reasons are improved
profitability and capital turnover over the last two years. As a result I could draw the
conclusions that the core business following the financial restructuring is likely to
deliver real rewards in the future.
In comparison to its peers, Icelandair Group had a 9.6% higher operating margin
and a 13.9% higher gross margin than the average in 2010. The operating costs were
3.3% higher. I broke the highest cost item down to its drivers and found that Icelandair
Group has the lowest labor costs per ASK. Further investigation revealed that this is
caused by lower than average salaries and solid staff productivity. The revenues per
ASK was lowest for Icelandair Group. Part of the reason is that the strongest
competition on the homer market comes from the low cost carrier Iceland Express
which has driven ticket prices down beneath Icelandair‟s comfort zone.
Based on my findings in the strategic analysis I used GDP growth as a forecast
driver for the revenue growth in the 10 year explicit forecast period. I built a GDP
growth forecast weighted in the Groups main income currencies and used it to forecast
growth in ASKs. The forecasted ASK growth was used as a driver for the estimated
revenues. Most of the line items in the forecasted financial statements are driven by the
estimated revenues, except for fuel price for which I predicted a 20% increase in 2011.
My calculations lead me to a 10.8% WACC. The 6.22% risk free rate was found
by weighting the yields on 10 year government bonds in the currencies that form the
Groups net cash flow. A regression of my own European airline index against the MSCI
world index resulted in an estimated adjusted beta of 1.12. The CAPM relationship
provided me with a 15.22% cost of capital. I added Iceland‟s current 2.10% CDS spread
to the risk free rate and used 8.3% cost of debt.
-66-
By applying the enterprise DCF model I estimated the fair value per share of
Icelandair Group hf. on May 10th
2011 to be ISK 4.98. The discounted economic profit
model supported my result. The estimated peer group EV/EBITDA multiplier suggested
a fair value of ISK 6.52 per share and the P/B multiplier ISK 3.44 per share. To test the
effects of the factors that I previously found to be most decisive to the share price, I
built scenarios and performed sensitivity analyses. The worst case scenario resulted in a
share price of ISK 1.74 and the best case scenario in the price of ISK 8.19 per share.
The estimated share price was highly sensitive to changes in the WACC and GDP
growth, which supports previous findings.
I conclude that shares in Icelandair Group are a good investment. My estimated
share price is 99% higher than in the share offering, but I build this conclusion on long
term prospects. My opinion is that the banks did not waste money by investing in the
Group. On the contrary, they now have the opportunity to participate in a possible
upside. The balance sheet is strong, the business model is practical and the tourist traffic
to Iceland has grown year by year. It is official that the current largest shareholders are
not long term investors. The management is considering a secondary listing for its share
in another Nordic stock exchange later this year (Euroinvestor, 2011). It will be
interesting to watch how that turns out. With new and strong foreign investors onboard
and the right amount of momentum I think that Icelandair Group has a bright future.
Overall I estimate that the business in which Icelandair operates is not attractive.
Warren Buffet said recently when he was asked about his assessment of a business: “If
you‟ve got the power to raise prices without losing business to a competitor, you‟ve got
a very good business. And if you have to have a prayer session before raising the price
by 10 percent, then you‟ve got a terrible business” (Bloomberg, 2011). The customers
in the airline and tourist industry are very price sensitive. In that sense the business is
indeed terrible. I belief, that if Icelandair Group knows the external influences and the
competitive forces, it can better anticipate changes and exploit its core competences to
confront the challenges. Only by doing so can the company sustain long term revenue
growth and ROIC.

-67-
9 References AMX News Centre. (2009, November 3). Enn bætir Icelandair met sitt í stundvísi.
Retrieved March 24, 2011, from Amx.is: http://www.amx.is/vidskipti/11117/
Bloomberg. (2011, April 20). Commodity Futures. Retrieved April 25, 2011, from
Blomberg.com: http://www.bloomberg.com/markets/commodities/futures/
Bloomberg. (2011, February 18). News:Bloomberg. Retrieved April 29, 2011, from
Bloomberg.com: http://www.bloomberg.com/news/2011-02-18/buffett-says-pricing-
power-more-important-than-good-management.html
Boeing. (2011). Commercia 737l airplanes, winglets. Retrieved March 24, 2011, from
Boeing.com: http://www.boeing.com/commercial/737family/winglets/wing2.html
Central Bank of Iceland. (2011, March 24). Currency Time Series. Retrieved March 24,
2011, from Sedlabanki.is: http://sedlabanki.is/?PageID=286
Cox, F. L. (2008). Airline Deregulation. Retrieved April 19, 2011, from The Concise
Encyclopedia of Economics:
http://www.econlib.org/library/Enc/AirlineDeregulation.html
Damodaran, A. (2011, January). Betas by Sector. Retrieved March 24, 2011, from
Damodaran Online: http://pages.stern.nyu.edu/~adamodar/
Damodaran, A. (2011, January). Country Default Spreads and Risk Premiums.
Retrieved February 2011, from Damodaran Online:
http://pages.stern.nyu.edu/~adamodar/
Damodaran, A. (2011, January). Debt Fundamentals by Sector. Retrieved May 20,
2011, from Damodaran online: Homepage for Aswath Damodaran:
http://pages.stern.nyu.edu/~adamodar/
Damodaran, A. (2011, February). Equity Risk Premiums (ERP): Determinants,
Estimation and Implications – The 2011 Edition. Retrieved March 24, 2011, from
Damodaran Online: pages.stern.nyu.edu/~adamodar/pdfiles/papers/ERP2011.pdf
Damodaran, A. (2002). Investment Valuation: Tools and Techniques for Determining
the Value of Any Asset. New York: Wiley.
Damodaran, A. (2011, January). Ratings, Spreads and Interest Coverage Ratios.
Retrieved February 15, 2011, from Damodaran Online:
http://pages.stern.nyu.edu/~adamodar/
Delta Airlines. (2010, August 6). Delta Air Lines to Connect New York, Iceland.
Retrieved May 6, 2011, from Delta.com:
http://news.delta.com/index.php?s=43&item=1094
Elroy Dimson, P. M. (2003). Global evidence on the equity risk premium. London: LBS
Institute of Finance and Accounting .

-68-
Encyclopedia of American Industries. (2011, April 19). Air Transportation, Scheduled.
Farmington Hills, Michigan, United States of America.
Euroinvestor. (2011, February 14). News: Secondary listing - Icelandair Group.
Retrieved February 14, 2011, from Euroinvestor.co.uk:
http://www.euroinvestor.co.uk/news/story.aspx?id=11596611
Eurostat. (2011, May 14). Real GDP growth rate. Retrieved May 14, 2011, from
European Commission, Eurostat:
http://epp.eurostat.ec.europa.eu/tgm/table.do;jsessionid=9ea7974b30dc63e76b63f12540
74a3e8d738ab191762.e34SbxiOchiKc40LbNmLahiKb3yLe0?tab=table&plugin=1&lan
guage=en&pcode=tsieb020
Financial Times Mandate. (2009, December). News & Analysis: Ftmandate.com.
Retrieved March 24, 2011, from FTMandate:
http://www.ftmandate.com/news/fullstory.php/aid/2256/Icelandic_pension_fund_ventur
e_stalls.html
Government Debt Management, Central Bank of Iceland. (2011, May 22). Market
Overview: Bonds.is. Retrieved May 22, 2011, from Bonds.is:
http://www.bonds.is/MarketOverview.aspx?catID=1631&Type=Bond&OrderBookId=5
3175
Hitt, M. A., Ireland, R. D., & Hoskisson, R. E. (2005). Strategic Management,
Competitiveness and Globalization. Mason: South-Western.
IATA. (2011). Financial Forecast. Montreal: IATA.
IATA. (2010, December 30). Press Releases: IATA. Retrieved May 22, 2011, from The
International Air Transport Association web site:
http://www.iata.org/pressroom/pr/Pages/2010-12-30-01.aspx
IATA. (2010, August). Special Report - Opportunities in Aircraft Leasing: IATA.org.
Retrieved April 18, 2011, from Pressroom: IATA.org:
http://www.iata.org/pressroom/airlines-international/august-2010/Pages/07a.aspx
IATA. (2009, Oktober). Striking Oil - Understanding Oil Price Volatility. Retrieved
April 25, 2011, from IATA.org: http://www.iata.org/pressroom/airlines-
international/october-2009/Pages/2009-10-07.aspx?NRMODE=Unpublished
IATA. (2011, May 21). Terminology. Retrieved May 14, 2011, from IATA.org.
IATA. (2011). The 11 March Japan Earthquake. Montreal: IATA.
IATA. (2006, May). The Economic Impact of Airline Liberalization. Retrieved April 19,
2011, from IATA.org:
http://www.iata.org/whatwedo/Documents/economics/liberalization_air_transport_stud
y_30may06.pdf

-69-
IATA. (2010). H IMP OF YJ FJ LL JOKULL’S OL NI SH PLUM .
Montreal: IATA.
Iceland Express. (2011, May 6). The Company History. Retrieved May 6, 2011, from
Icelandexpress.com: http://www.icelandexpress.com/about_us/the_company/
Icelandair Group. (2007). Annual Report.2006 Reykjavík: Icelandair Group.
Icelandair Group. (2008). Annual Report.2007 Reykjavík: Icelandair Group.
Icelandair Group. (2009). Annual Report.2008 Reykjavík: Icelandair Group.
Icelandair Group. (2010). Annual Report 2009. Reykjavík: Icelandair Group.
Icelandair Group. (2011). Annual Report 2010. Reykjavík: Icelandair Group.
Icelandair Group. (2011, February 14). CEO's Q4 and annual comment. Retrieved
February 14, 2011, from Icelandairgroup.is: http://www.icelandairgroup.is/investor-
relations/news/detail/item490452/CEO's_Q4_and_annual_comment/
Icelandair Group hf. (2010, October). Prospectus. Reykjavík, Iceland.
Icelandair Group. (2011, May 4). Traffic Data April 2011. Retrieved May 14, 2011,
from Icelandairgroup.is:
https://newsclient.omxgroup.com/cdsPublic/viewDisclosure.action?disclosureId=45221
1&messageId=549975
Icelandair. (2011). Icelandair.is. Retrieved March 29, 2011, from Saga Icelandair:
http://www.icelandair.is/information/about-icelandair/world-wide-sites/
Icelandic Tourist Board. (2011, May 12). April record. Retrieved May 12, 2011, from
www.ferdamalastofa.is:
http://www.ferdamalastofa.is/Category.mvc/DisplayElement?catid=747&moduleid=220
&sid=7096
Jing Liu, D. N. (2000, October 18). Equity Valuation Using Multiples. Retrieved May
22, 2011, from Social Science Research Network:
http://papers.ssrn.com/sol3/papers.cfm?abstract_id=241266
Johnson, G., Scholes, K., & Whittington, R. (2006). Exploring Corporate Strategy.
Essex: Pearson Education Limited.
Lewis, A. (2011, April 10). Article: Rethinking the Oracle
Retrieved May 20, 2011, from Wall Street Journal Europe edition :
http://online.wsj.com/article/SB10001424052748704302704576253281187206082.html
?mod=WSJ_topics_obama
Loudon, G. F. (2004, December). Financial Risk Exposures in the Airline Industry:
Evidence from Australia and New Zealand. Retrieved April 26, 2011, from Australian
School of Business: http://www.agsm.edu.au/eajm/0412/pdf/loudon.pdf

-70-
Lynch, R. (2006). Strategic Management. Essex: Pearson Education Limited.
Market Data. (2011, May 12). Retrieved May 12, 2011, from Bloomberg.com:
http://www.bloomberg.com/apps/quote?ticker=BUSAIRLX:IND
Mbl.is. (2011, March 2). Domestic: Mbl.is. Retrieved March 2, 2011, from Mbl.is:
http://mbl.is/frettir/innlent/2011/03/02/threttan_erlend_flugfelog_med_flug_hingad_i_s
umar/
Mbl.is. (2011, March 4). Domestic: Mbl.is. Retrieved March 4, 2011, from Mbl.is:
http://www.mbl.is/frettir/innlent/2011/03/04/flugvel_fi_for_ut_af_flugbraut/
McKinsey&Company. (2007). Curbing Global Energy Demand Growth: The Energy
Productivity Opportunity. Boston: Mckinsey&Company.
Moody's. (2006). Moody’ pp o ch o Glob l S nd d dj men in he n ly i of
Financial Statements for Non-Financial Corporations – Part I. New York: Moody's
Investors Service.
Morrell, P. S. (2007). Airline Finance. Surrey: Ashgate Publishing Limited.
Moussaieff, D. (2010, December 24). How Iceland Air Kept Flying When British
Airways Was Grounded . Retrieved March 24, 2011, from Huffingtonpost.com:
http://www.huffingtonpost.com/dorrit-moussaieff/how-iceland-air-kept-
flyi_b_801077.html
MSCI. (2011, May 12). Performance: MSCE. Retrieved May 12, 2011, from MSCE
Index Performance:
http://www.msci.com/products/indices/performance.html?chart=regional&priceLevel=4
0&scope=R&style=C&asOf=May, 20, 2011¤cy=15&size=36&indexId=106
Nasdaq OMX. (2011, April 13). Icelandair: Record number of tourists to Iceland
foreseen. Retrieved April 13, 2011, from omxgroup.com:
https://newsclient.omxgroup.com/cdsPublic/viewDisclosure.action?disclosureId=44854
2&messageId=545182
Nasdaq OMX. (2011, April 6). Nasdaq OMX. Retrieved April 6, 2011, from
http://www.nasdaqomxnordic.com/hlutabref/Soguleg_gogn/?Instrument=ICE37744
Nasdaq OMX. (2010, May 9). Presentation of Q1 2011 results - Icelandair Group.
Retrieved May 9, 2011, from omxgroup.com:
https://newsclient.omxgroup.com/cdsPublic/viewDisclosure.action?disclosureId=45290
7&messageId=550879
Nasdaq OMX. (2011, February 14). Presentation of Q4 and 12M results - Icelandair
Group. Retrieved February 14, 2011, from Newsclient.omxgroup.com:
https://newsclient.omxgroup.com/cdsPublic/viewDisclosure.action?disclosureId=43851
8&messageId=532017

-71-
Pablo Fernandez, J. d. (2010). Market Risk Premium used in 2010 by Professors, a
survey with 1,500 answers. Navarra: IESE Business School.
Penman, S. H. (2010). Financial Statement Analysis and Security Valuation. New York:
McGraw-Hill/Irwin.
Peterson, P. (2006). Valuation Multiples. Retrieved February 15, 2011, from Florida
Atlantic Iniversity: http://wise.fau.edu/~ppeter/fin4422/multiples.pdf
Politiken. (2010, February 9). SAS-ulykke havde 10 forklaringer. Retrieved April 27,
2011, from Politiken.dk: http://politiken.dk/erhverv/ECE896946/sas-ulykke-havde-10-
forklaringer/
Porter, M. E. (1980). Competitive Strategy, Techniques for Analyzing Industries and
Competitors. New York: The Free Press.
Sighvatsson, A. (2010, Mars 24). Capital controls, fiscal policy and economic recovery.
Retrieved April 22, 2011, from Bank for International Settlement:
http://www.bis.org/review/r100511d.pdf
Statistic Iceland. (2011, May 14). Statistics, National accounts and public finance .
Retrieved May 14, 2011, from Statice.is:
http://www.statice.is/?PageID=1267&src=/temp_en/Dialog/varval.asp?ma=THJ01000
%26ti=Overview+of+Gross+Domestic+Product+and+Gross+National+Product+1945%
2D2010%26path=../Database/thjodhagsreikningar/landsframleidsla/%26lang=1%26unit
s=Index/percent/number
The Association of European Airlines. (2009, June). Consumer report. Retrieved April
27, 2011, from http://www.aea.be/: http://files.aea.be/News/PR/Pr09-016.pdf
The Central Bank of Iceland. (2011). Capital account liberalisation strategy.
Reykjavík: The Central Bank of Iceland.
The Icelandic Air Line Pilots' Accociation. (2011, March). FIA newsletter March 2011.
Retrieved April 27, 2011, from Fia.is:
http://www.fia.is/media/frettabref/2011/11mars.pdf
Tim Koller, M. G. (2010). Valuation, Measuring and managing the value of companies.
New Jersey: John Wiley & Sons, Inc.
United North America. (2011, May 14). Similarities & Differences Between Canada &
United States. Retrieved May 14, 2011, from www.unitednorthamerica.org:
http://www.unitednorthamerica.org/simdiff.htm
Verbeek, M. (2008). A Guide to Modern Econometrics. Chichester: John Wiley & Sons
Ltd.
Viðskiptablaðið. (2011, March 14). Icelandair endurnýjar stjórnklefa. Retrieved March
14, 2011, from Vb.is: Icelandair endurnýjar stjórnklefa

-72-
Viðskiptablaðið. (2011, February 3). Sjö ára gamlir Netsmellir Icelandair enn fyrir
dómstólum: Óútséð með 130 milljóna sekt. Retrieved March 24, 2011, from Vb.is:
http://www.pressan.is/Vidskipti/Lesavidskiptafrettir/sjo-ara-gamlir-netsmellir-
icelandair-enn-fyrir-domstolum-outsed-med-130-mmilljona-sekt
Viðskiptablaðið. (2011). vb.is. Retrieved April 9, 2011, from vb.is:
http://www.vb.is/frett/60544/?q=skilanefnd%20Glitnis
Vísir. (2011, May 3). Icelandair og JetBlue Airways hefja samstarf í dag. Retrieved
May 3, 2011, from Visir.is: http://visir.is/icelandair-og-jetblue-airways-hefja-samstarf-i-
dag/article/2011110509786
Vísir.is. (2010, December 30). Býst við 10-15% hækkun á flugfargjöldum. Retrieved
January 15, 2011, from Visir.is: http://www.visir.is/byst-vid-10-15-prosent-haekkun-a-
flugfargjoldum-/article/2010907358966
Yahoo! (2011, May 12). Investing: Yahoo. Retrieved May 12, 2011, from
finance.yahoo.com: http://finance.yahoo.com/q?s=SAS.ST&ql=0

-73-
10 Appendices
10.1 Historical NOPLAT
10.2 Historical invested capital
*Pro Forma
Amounts are in ISK million 2006 2007 2008 2009 2010
NOPLAT
Total revenues 56.143 63.477 72.199 80.321 88.015
Salaries (17.761) (20.008) (20.275) (18.652) (20.415)
Aircraft fuel (9.821) (9.769) (15.703) (13.250) (14.927)
Aircraft handling, landing and communication (4.038) (4.367) (5.060) (5.881) (6.103)
Aircraft maintenance expenses (3.229) (5.128) (5.499) (6.825) (6.475)
Other operating expenses (10.747) (11.375) (13.688) (14.781) (15.651)
Depreciation of operating assets (2.177) (2.587) (3.327) (4.611) (5.188)
Aircraft and aircrew lease (depreciation) (4.489) (7.353) (8.921) (12.797) (11.866)
EBITA 3.881 2.890 (274) 3.524 7.390
Add: Implicit operating lease interest expense 2.236 4.069 5.317 7.394 5.327
Adjusted EBITA 6.117 6.959 5.043 10.918 12.717
Adjusted operating cash taxes (1.262) (320) (1.014) (1.986) (2.930)
NOPLAT 4.855 6.640 4.028 8.933 9.787
Historical
*Pro Forma
Amounts are in ISK million 2006 2007 2008 2009 2010
Invested capital
Working cash 1.123 1.270 1.444 1.606 1.760
Current receivables 6.149 7.284 13.836 9.725 14.574
Inventories 1.131 1.301 2.309 1.393 1.580
Prepayments 271 366 2.536 1.350 950
Operating current assets 8.674 10.221 20.125 14.074 18.864
Trade payables 5.009 4.546 7.898 3.464 3.298
Other payables 7.010 7.902 10.687 10.559 10.697
Deferred income 3.059 3.904 7.875 7.178 8.807
Operating current liabilities 15.078 16.352 26.460 21.201 22.802
Operating working capital (6.404) (6.131) (6.335) (7.127) (3.938)
Operating assets 22.935 22.832 36.798 27.014 27.594
Operating intangibles 6.731 6.703 8.487 5.286 4.662
Capitalized operating leases 22.064 36.158 47.282 75.632 68.045
Invested capital exl. intangibles 45.326 59.561 86.232 100.805 96.363
Goodwill 21.114 20.143 20.819 18.312 16.550
Accumalated goodwill amortization and impairments 0 0 5.182 1.023 339
Reversal of intangibles value adjustment (DTL's) 0 0 (38) (195) (11)
Adjusted goodwill 21.114 20.143 25.963 19.140 16.878
Invested capital 66.440 79.704 112.195 119.945 113.241
Excess cash 1.653 736 2.531 303 8.622
Marketable securities 0 0 90 0 1.306
Investment in associates 2.058 2.335 1.008 545 178
Receivables from sale of aircraft 1.094 1.753 0 0 0
Derivatives 215 0 0 0 0
Assets classified as held for sale 0 0 0 17.500 2.815
Prepaid aircraft acquisitions 9.669 249 4.226 1.134 0
Long-term cost 0 0 2.029 1.347 918
Long-term receivables and deposits 2.689 1.788 3.834 3.449 1.424
Tax loss carry-forwards (265) (1.339) 1.200 2.096 1.314
Deferred tax asset 0 0 0 140 0
Total funds invested 83.553 85.227 127.113 146.459 129.818
Historical
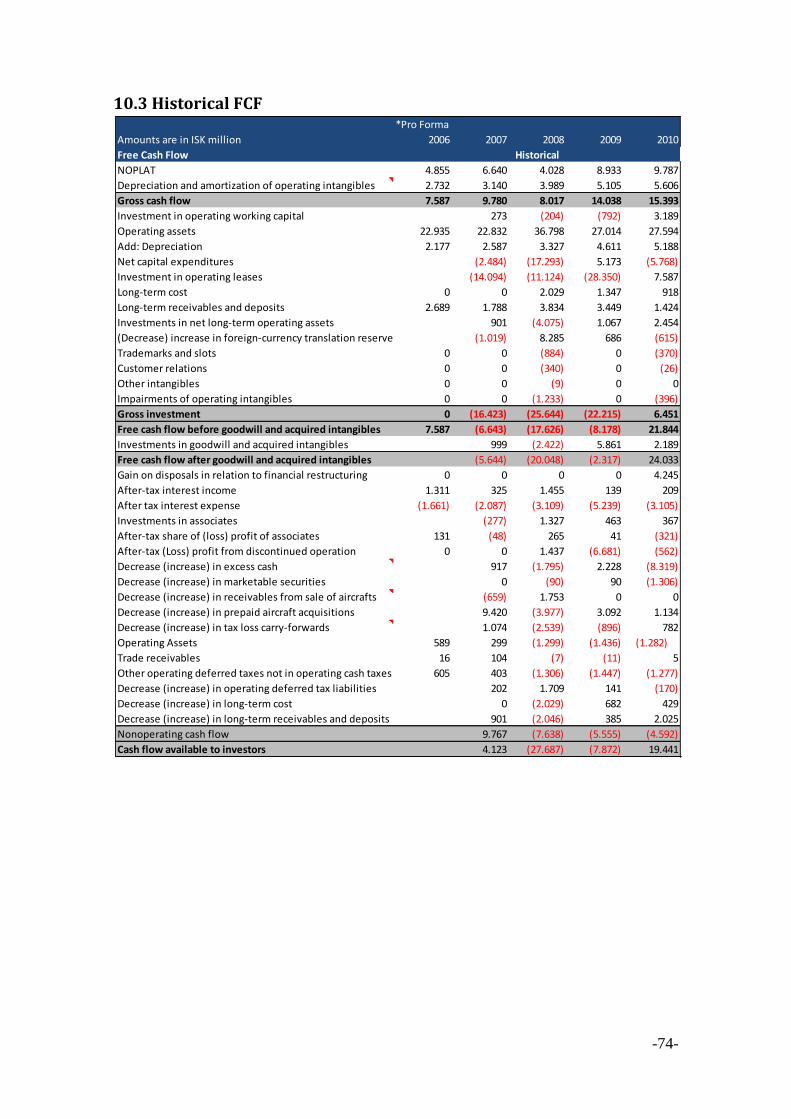
-74-
10.3 Historical FCF
*Pro Forma
Amounts are in ISK million 2006 2007 2008 2009 2010
Free Cash Flow
NOPLAT 4.855 6.640 4.028 8.933 9.787
Depreciation and amortization of operating intangibles 2.732 3.140 3.989 5.105 5.606
Gross cash flow 7.587 9.780 8.017 14.038 15.393
Investment in operating working capital 273 (204) (792) 3.189
Operating assets 22.935 22.832 36.798 27.014 27.594
Add: Depreciation 2.177 2.587 3.327 4.611 5.188
Net capital expenditures (2.484) (17.293) 5.173 (5.768)
Investment in operating leases (14.094) (11.124) (28.350) 7.587
Long-term cost 0 0 2.029 1.347 918
Long-term receivables and deposits 2.689 1.788 3.834 3.449 1.424
Investments in net long-term operating assets 901 (4.075) 1.067 2.454
(Decrease) increase in foreign-currency translation reserve (1.019) 8.285 686 (615)
Trademarks and slots 0 0 (884) 0 (370)
Customer relations 0 0 (340) 0 (26)
Other intangibles 0 0 (9) 0 0
Impairments of operating intangibles 0 0 (1.233) 0 (396)
Gross investment 0 (16.423) (25.644) (22.215) 6.451
Free cash flow before goodwill and acquired intangibles 7.587 (6.643) (17.626) (8.178) 21.844
Investments in goodwill and acquired intangibles 999 (2.422) 5.861 2.189
Free cash flow after goodwill and acquired intangibles (5.644) (20.048) (2.317) 24.033
Gain on disposals in relation to financial restructuring 0 0 0 0 4.245
After-tax interest income 1.311 325 1.455 139 209
After tax interest expense (1.661) (2.087) (3.109) (5.239) (3.105)
Investments in associates (277) 1.327 463 367
After-tax share of (loss) profit of associates 131 (48) 265 41 (321)
After-tax (Loss) profit from discontinued operation 0 0 1.437 (6.681) (562)
Decrease (increase) in excess cash 917 (1.795) 2.228 (8.319)
Decrease (increase) in marketable securities 0 (90) 90 (1.306)
Decrease (increase) in receivables from sale of aircrafts (659) 1.753 0 0
Decrease (increase) in prepaid aircraft acquisitions 9.420 (3.977) 3.092 1.134
Decrease (increase) in tax loss carry-forwards 1.074 (2.539) (896) 782
Operating Assets 589 299 (1.299) (1.436) (1.282)
Trade receivables 16 104 (7) (11) 5
Other operating deferred taxes not in operating cash taxes 605 403 (1.306) (1.447) (1.277)
Decrease (increase) in operating deferred tax liabilities 202 1.709 141 (170)
Decrease (increase) in long-term cost 0 (2.029) 682 429
Decrease (increase) in long-term receivables and deposits 901 (2.046) 385 2.025
Nonoperating cash flow 9.767 (7.638) (5.555) (4.592)
Cash flow available to investors 4.123 (27.687) (7.872) 19.441
Historical

-75-
10.4 Operating cash taxes
10.5 Capitalized operating leases
*Pro Forma
Amounts are in ISK million 2006 2007 2008 2009 2010
Operating cash taxes
Adjusted EBITA 6.117 6.959 5.043 10.918 12.717
Marginal tax rate 0 0 0 0 0
Marginal taxes on EBITA (1.101) (1.253) (756) (1.638) (2.289)
(0) (1) (0) 0 0
Foreign currency subsidiaries (87) (151) 207 0 0
Operating taxes (1.188) (1.404) (549) (1.638) (2.289)
1) Recurring, 2) Recognised in income statement
Operating assets (162) 1.154 (489) (365) (809)
Trade receivables 88 (70) 24 17 168
Changes in Operating deferred tax assets and (liabilities): (74) 1.084 (465) (348) (641)
Operating cash taxes (1.262) (320) (1.014) (1.986) (2.930)
Operating cash tax rate 21% 5% 20% 18% 23%
Adjusted operating cash taxes (1.262) (320) (1.014) (1.986) (2.930)
NOPLAT 4.855 6.640 4.028 8.933 9.787
Historical
*Pro Forma
Amounts are in ISK million 2006 2007 2008 2009 2010
Estimated synthetic rating 3,50% 3,50% 3,50% 3,50% 3,50%
Risk-free rate, % 8,86% 10,23% 9,73% 8,00% 6,05%
Pre-tax cost of debt, % 12,36% 13,73% 13,23% 11,50% 9,55%
Marginal tax rate, % 18% 18% 15% 15% 18%
After-tax cost of debt, % 10,14% 11,25% 11,25% 9,78% 7,83%
Asset life 11 11 11 11 11
1/asset life 0,09 0,09 0,09 0,09 0,09
Kd + (1/asset life) 0,19 0,20 0,20 0,19 0,17
Rental expenses 4.489 7.353 8.921 12.797 11.866
Operating lease expense 2.236 4.069 5.317 7.394 5.327
Depreciation 2.253 3.284 3.604 5.403 6.539
Capitalized operating leases 22.064 36.158 47.282 75.632 68.045

-76-
10.6 Historical ROIC break-down

-77-
10.7 Performance ratios
10.8 Historical total operating income, expenses & profit
*Pro Forma
2006 2007 2008 2009 2010
Historical Performance
Operating ratios
Salaries and other personnel expenses/ Revenues 31,6% 31,5% 28,1% 23,2% 23,2%
Aircraft Fuel/Revenues 17,5% 15,4% 21,7% 16,5% 17,0%
Aircraft ground service/Revenues 7,2% 6,9% 7,0% 7,3% 6,9%
Aircraft maintenance expenses/Revenues 5,8% 8,1% 7,6% 8,5% 7,4%
Other operating expenses/Revenues 19,1% 17,9% 19,0% 18,4% 17,8%
Depreciation of operating assets/Revenues 3,9% 4,1% 4,6% 5,7% 5,9%
Aircraft and aircrew lease (depreciation)/Revenues 8,0% 11,6% 12,4% 15,9% 13,5%
EBITDA (income statement)/Revenues 10,8% 8,6% 4,2% 10,1% 14,3%
EBITA/Revenues 6,9% 4,6% -0,4% 4,4% 8,4%
Adjusted EBITA/Revenues 10,9% 11,0% 7,0% 13,6% 14,4%
Return on invested capital (average)
Operating Assets / Revenues 36,1% 41,3% 39,7% 31,0%
Operating working capital/Revenues -14,9% -12,9% -12,3% -10,3%
Revenues/invested capital (excluding intangibles) 121,0% 99,0% 85,9% 89,3%
Revenues/invested capital (including intangibles) 59,7% 53,2% 46,7% 49,8%
Pretax ROIC (Adjusted EBITA/Invested capital excluding intangibles) 13,3% 6,9% 11,7% 12,9%
Operating cash tax rate 20,6% 4,6% 20,1% 18,2% 23,0%
Growth rates
Revenue growth rate 13,1% 13,7% 11,2% 9,6%
Adjusted EBITA growth rate 13,8% -27,5% 116,5% 16,5%
NOPLAT growth rate 36,8% -39,3% 121,7% 9,6%
Invested capital growth rate (excluding intangibles) 31,4% 44,8% 16,9% -4,4%
Invested capital growth rate (including intangibles) 20,0% 40,8% 6,9% -5,6%
Net income growth rate -90,2% -3005,8% 42,8% -142,7%
Investment rates
Gross investment rate -167,9% -319,8% -158,3% 41,9%
Net investment (Invested capital t+1 - Invested capital 1) 14.236 26.671 14.573 -4.442
Net investment rate: Net investment / NOPLAT 214,4% 662,1% 163,1% -45,4%
Coverage ratios
EBIT/interest 1,6 0,9 -2,0 0,2 2,8
EBITA/interest 1,9 1,1 -0,1 0,6 2,0
EBITDA/interest 3,0 2,2 0,8 1,3 3,3
EBITDAR/interest 0,8 -0,7 -1,6 -0,8 0,2
-11.000
-9.000
-7.000
-5.000
-3.000
-1.000
1.000
3.000
5.000
0
10.000
20.000
30.000
40.000
50.000
60.000
70.000
80.000
90.000
2006 2007 2008 2009 2010
In ISK millions
Total operating income Total operating expenses(Loss) Profit for the year (right axis)

-78-
10.9 Weighted GDP forecast
2011 2012 2013 2014 2015 2016 2017 2018 2019 2020
Forecasted performance
ROIC 6% 11% 12% 14% 16% 16% 15% 16% 17% 18%
Operating ratios
Salaries and other personnel expenses/ Revenues 23,2% 23,2% 23,2% 23,2% 23,2% 23,2% 23,2% 23,2% 23,2% 23,2%
Aircraft Fuel/Revenues 20,4% 17,0% 17,0% 17,0% 17,0% 17,0% 17,0% 17,0% 17,0% 17,0%
Aircraft ground service/Revenues 6,9% 6,9% 6,9% 6,9% 6,9% 6,9% 6,9% 6,9% 6,9% 6,9%
Aircraft maintenance expenses/Revenues 7,4% 7,4% 7,4% 7,4% 7,4% 7,4% 7,4% 7,4% 7,4% 7,4%
Other operating expenses/Revenues 17,8% 17,8% 17,8% 17,8% 17,8% 17,8% 17,8% 17,8% 17,8% 17,8%
Depreciation of operating assets/Revenues 5,9% 5,9% 5,9% 5,9% 5,9% 5,9% 5,9% 5,9% 5,9% 5,9%
Aircraft and aircrew lease (depreciation)/Revenues 15,3% 14,6% 13,8% 13,8% 13,8% 13,8% 13,8% 13,8% 13,8% 13,8%
EBITDA (income statement)/Revenues 9,0% 13,2% 14,0% 14,0% 14,0% 14,0% 14,0% 14,0% 14,0% 14,0%
EBITA/Revenues 3,1% 7,3% 8,1% 8,1% 8,1% 8,1% 8,1% 8,1% 8,1% 8,1%
Adjusted EBITA/Revenues 7,0% 10,1% 9,6% 8,8% 8,7% 9,0% 8,6% 8,6% 8,2% 8,2%
Return on invested capital (average)
Operating Assets / Revenues 29,9% 29,9% 30,5% 30,5% 30,5% 30,5% 30,4% 30,3% 30,4% 30,4%
Operating working capital/Revenues -6,3% -6,3% -6,5% -6,5% -6,5% -6,5% -6,4% -6,4% -6,4% -6,5%
Revenues/invested capital (excluding intangibles) 112,5% 143,2% 171,8% 220,7% 252,3% 246,7% 250,8% 265,6% 285,2% 305,9%
Revenues/invested capital (including intangibles) 60,8% 77,5% 88,6% 110,0% 126,1% 127,8% 128,5% 138,0% 145,3% 158,2%
Pretax ROIC 7,9% 14,5% 16,5% 19,5% 21,9% 22,1% 21,7% 22,8% 23,4% 25,1%
Operating cash tax rate 30,4% 27,2% 27,6% 28,3% 28,4% 28,1% 28,4% 28,5% 28,9% 28,9%
Growth rates
Revenue growth rate 10,6% 10,3% 5,7% 5,7% 5,8% 5,9% 6,8% 7,0% 6,2% 6,1%
Adjusted EBITA growth rate -46,2% 59,0% 0,4% -3,1% 4,3% 9,1% 2,9% 6,5% 1,4% 6,0%
NOPLAT growth rate -51,4% 66,3% -0,2% -4,0% 4,1% 9,5% 2,4% 6,5% 0,8% 6,0%
Invested capital growth rate (excluding intangibles) -20,5% -4,3% -19,8% -15,2% 1,6% 14,8% -3,6% 5,7% -7,5% 5,9%
Invested capital growth rate (including intangibles) -17,5% -3,5% -16,1% -11,8% 1,2% 11,1% -2,8% 4,4% -5,8% 4,5%
Net income growth rate -110,1% -861,0% -76,1% 392,2% 73,4% -4,5% 14,9% 13,8% 14,2% 6,6%
Investment rates
Gross investment rate 128,4% -24,8% 50,9% 9,5% -56,8% -95,9% -40,0% -69,3% -30,2% -69,0%
Net investment (Invested capital t+1 - Invested capital 1)-19.802 -3.288 -14.542 -8.907 820 7.515 -2.066 3.209 -4.423 3.214
Net investment rate: Net investment / NOPLAT -416,0% -41,5% -184,0% -117,5% 10,4% 87,0% -23,3% 34,1% -46,5% 31,9%
Coverage ratios
EBIT/interest 0,6 2,1 1,0 2,0 8,6 4,6 6,6 10,6 45,2 48,2
EBITA/interest 0,9 2,5 1,2 2,3 9,9 5,3 7,5 12,0 51,0 54,1
EBITDA/interest 2,7 4,6 2,0 3,9 17,2 9,1 12,9 20,8 88,2 93,6
EBITDAR/interest -1,9 -0,5 0,0 0,1 0,2 0,1 0,2 0,3 1,2 1,3
Short term forecast Long term forecast
2011 2012 2013 2014 2015 2016 2017 2018 2019 2020
GDP forecast
Weights
29% 2,3% 2,9% 2,7% 2,7% 3,0% 3,0% 3,9% 3,9% 3,9% 3,9%
Iceland 26% 1,8% 1,9% 5,4% 5,4% 5,4% 5,4% 5,4% 5,4% 5,4% 5,4%
Euro zone 5,3% 1,7% 2,1% 1,4% 1,4% 1,4% 1,4% 1,4% 1,4% 1,4% 1,4%
UK 1,7% 1,5%
Denmark 3,7% 2,6%
Finland 4,2% 2,5%
Sweden 2,7% 2,5%
Norway 13% 3,1% 2,3% 2,9% 2,8% 2,7% 3,2% 5,3% 6,1% 2,7% 2,3%
Scandinavia average 14% 3,0% 3,0% 3,0% 3,0% 3,0% 3,0% 3,0% 3,0% 3,0% 3,0%
North America 10 year growth 12,3% 3,1% 3,1% 3,1% 3,1% 3,1% 3,1% 3,1% 3,1% 3,1% 3,1%
Other 1,00 5,60% 4,22% 5,67% 5,65% 5,78% 5,89% 6,78% 6,96% 6,22% 6,14%
IATA GDP growth forecast 3,1%
Passenger growth 5,6%
GDP growth to passenger growth ratio 1,8 1,65 1,65 1,65 1,65 1,65 1,65 1,65 1,65 1,65
IATA Cargo forecast 6,1%
Short term forecast Long term forecast

-79-
10.10 The revenue forecast
2011 2012 2013 2014 2015 2016 2017 2018 2019 2020
Revenues
Passenger revenues 51.724 59.808 62.229 64.701 67.303 70.031 72.710 75.486 78.368 81.293
% change 6,4% 15,6% 4,0% 4,0% 4,0% 4,1% 3,8% 3,8% 3,8% 3,7%
Icelandair
Number of Passengers (PAX) 1.748.957 1.822.691 1.896.500 1.971.821 2.051.110 2.134.269 2.215.910 2.300.515 2.388.351 2.477.492
% change 18,0% 4,2% 4,0% 4,0% 4,0% 4,1% 3,8% 3,8% 3,8% 3,7%
Load Factor (%) 78% 78% 78% 78% 78% 78% 78% 78% 78% 78%
ppt change 0 0 0 0 0 0 0 0 0 0
Available Seat Kilometers (ASK) - in thousand 6.116.105 6.373.953 6.632.063 6.895.460 7.172.733 7.463.540 7.749.039 8.044.905 8.352.067 8.663.791
17,5% 4,2% 4,0% 4,0% 4,0% 4,1% 3,8% 3,8% 3,8% 3,7%
Air Iceland
Number of Passengers (PAX) 359.071 379.897 400.411 422.034 447.356 474.197 489.889 506.099 522.847 540.148
% change 4,6% 5,8% 5,4% 5,4% 6,0% 6,0% 3,3% 3,3% 3,3% 3,3%
Load Factor (%) 69% 69% 69% 69% 69% 69% 69% 69% 69% 69%
ppt change 1,2% 0,0% 0,0% 0,0% 0,0% 0,0% 0,0% 0,0% 0,0% 0,0%
Available Seat Kilometers (ASK) - in thousand 175.015 185.165 195.164 205.703 218.045 231.128 238.776 246.678 254.841 263.273
% change 4,6% 5,8% 5,4% 5,4% 6,0% 6,0% 3,3% 3,3% 3,3% 3,3%
Scheduled Airlines Total
Number of Passangers (PAX) - in thousand 2.108.028 2.202.588 2.296.912 2.393.855 2.498.465 2.608.466 2.705.798 2.806.615 2.911.198 3.017.640
% change 15,5% 4,5% 4,3% 4,2% 4,4% 4,4% 3,7% 3,7% 3,7% 3,7%
Load Factor (%) 76% 76% 76% 76% 76% 76% 76% 76% 76% 76%
ppt change
Total Available Seat Kilometers (ASK) - in thousand 6.339.045 6.606.292 6.873.811 7.146.809 7.434.189 7.735.597 8.031.502 8.338.152 8.656.511 8.979.598
% change 18,0% 4,2% 4,0% 4,0% 4,0% 4,1% 3,8% 3,8% 3,8% 3,7%
Revenue Passanger Kilometers (RPK) - in thousand 4.848.220 5.052.615 5.257.219 5.466.013 5.685.806 5.916.328 6.142.643 6.377.174 6.620.661 6.867.764
% change 18,0% 4,2% 4,0% 4,0% 4,0% 4,1% 3,8% 3,8% 3,8% 3,7%
Revenue Per Available Seat Kilometre (RASK) (Yield) 8,2 9,1 9,1 9,1 9,1 9,1 9,1 9,1 9,1 9,1
% change -10% 11% 11% 0% 0% 0% 0% 0% 0% 0%
Capacity
Fleet Utilization (%) 95% 95% 95% 95% 95% 95% 95% 95% 95% 95%
ppt change 3,6% 0,0% 0,0% 0,0% 0,0% 0,0% 0,0% 0,0% 0,0% 0,0%
Sold Block Hours 73.283 76.372 79.465 82.621 85.943 89.428 92.848 96.393 100.074 103.809
% change 18,0% 4,2% 4,0% 4,0% 4,0% 4,1% 3,8% 3,8% 3,8% 3,7%
Revenues
Cargo and mail 5.634 5.871 6.109 6.352 6.607 6.875 7.138 7.411 7.694 7.981
% change 6,1% 4,2% 4,0% 4,0% 4,0% 4,1% 3,8% 3,8% 3,8% 3,7%
Available Tonne Kilometers (ATK) - in thousand 177.728 185.221 192.721 200.375 208.433 216.883 225.180 233.777 242.703 251.761
% change 6,1% 4,2% 4,0% 4,0% 4,0% 4,1% 3,8% 3,8% 3,8% 3,7%
Freight Tonne Kilometers (FTK) - in thousand 88.299 92.021 95.747 99.550 103.553 107.752 111.873 116.145 120.579 125.080
% change 6,1% 4,2% 4,0% 4,0% 4,0% 4,1% 3,8% 3,8% 3,8% 3,7%
Total transport revenue 57.358 65.679 68.339 71.053 73.910 76.906 79.848 82.897 86.062 89.274
% change 6,3% 14,5% 4,0% 4,0% 4,0% 4,1% 3,8% 3,8% 3,8% 3,7%
Revenues
Other operating revenue 16.637 17.338 18.040 18.757 19.511 20.302 21.079 21.883 22.719 23.567
% change 18% 4,2% 4,0% 4,0% 4,0% 4,1% 3,8% 3,8% 3,8% 3,7%
Tourism
Available Hotel Room Nights 279.681 291.472 303.275 315.320 327.999 341.298 354.353 367.883 381.929 396.183
% change 18,0% 4,2% 4,0% 4,0% 4,0% 4,1% 3,8% 3,8% 3,8% 3,7%
Sold Hotel Room Nights 184.751 192.540 200.337 208.294 216.669 225.454 234.078 243.015 252.294 261.710
18,0% 4,2% 4,0% 4,0% 4,0% 4,1% 3,8% 3,8% 3,8% 3,7%
Utilization of Hotel Rooms 66% 66% 66% 66% 66% 66% 66% 66% 66% 66%
% change 0,0% 0,0% 0,0% 0,0% 0,0% 0,0% 0,0% 0,0% 0,0% 0,0%
Revenues
Aircraft and aircrew lease 23.310 24.292 25.276 26.280 27.337 28.445 29.533 30.661 31.831 33.019
16,7% 4,2% 4,0% 4,0% 4,0% 4,1% 3,8% 3,8% 3,8% 3,7%
Total operating revenues 97.304 107.309 111.655 116.089 120.757 125.653 130.460 135.441 140.612 145.860
Short term forecast Long term forecast

-80-
10.11 Weighted risk free rate
10.12 Beta regression output
Icelandair Group's currency exposure USD EUR DKK SEK NOK ISK
Average FX rate 122,5 162,6 21,8 17,1 20,2
Forecast revenue 29 13 3 4 3
ISK million 3.587 2.124 66 60 64 82.113
Forecast purchases (40) (9) (1) (0) (0)
ISK million (4.856) (1.427) (28) (6) (9) (69.111)
Net cash flow exposure (10) 4 2 3 3 0
ISK million (1.269) 697 38 55 56 13.002
Net cash flow exposure in absolute values 1.269 697 38 55 56 13.002
Currency weight 8,4% 4,6% 0,3% 0,4% 0,4% 86,0%
Risk free rates 3,47% 3,29% 3,39% 3,36% 3,78% 6,68%
Weighted 0,29% 0,15% 0,01% 0,01% 0,01% 5,75%
Total rf 6,22%
My European airline idex vs MSCE
SUMMARY OUTPUT
Regression Statistics
Multiple R 0,4652
R Square 0,216411
Adjusted R Square 0,202901
Standard Error 0,129109
Observations 60
ANOVA
df SS MS F Significance F
Regression 1 0,267014 0,267014 16,01837 0,000180344
Residual 58 0,966816 0,016669
Total 59 1,233831
CoefficientsStandard Error t Stat P-value Lower 95% Upper 95% Lower 95,0% Upper 95,0%
Intercept -0,0083 0,016687 -0,49735 0,62082 -0,041701298 0,025102881 -0,041701298 0,025102881
X Variable 1 1,174623 0,293487 4,002295 0,00018 0,587144239 1,762101602 0,587144239 1,762101602

-81-
10.13 Estimated share price comparison between valuation models
10.14 Discounted FCF, continuing value and non-operating assets
Enterprise DCF
Discounted economic profit
0
1
2
3
4
5
6
7
8
9
Best case EV/EBITDA E2011
Enterprice DCF
Discounted EP
Market price
P/B Worst case
Discounted FCF51%
Discounted Continuing value
40%
Non-operating Assets
9%
Invested capital in the beginning of
period64%Discounted
Economic Profit
4%
PV Continuing value2020
23%
Nonoperating Assets
9%

-82-
10.15 Multiples
Company EV/EBITDA E 2011 Price/Book
Air Berlin PLC 7,31 0,53
Air France-KLM 5,75 0,51
Air Lingus 4,95 0,47
Deutsche Lufthansa-RG 2,95 0,84
Finnair OYJ 6,33 0,59
INTL CONSOLIDATED AIRLINE-DI 5,59 1,30
SAS AB 4,84 0,50
Median 5,59 0,53
Harmonic mean 5,02 0,60
Icelandair Group 7,31 0,82
Compared to the median 31% 56%
Compared to the harmonic mean 46% 37%
Icelandair Group calculated EV according to Koller et.al: Icelandair Group with peer group EV/EBITDA E 2011
Market value of equity 23.432 EBITDA 2011 (E) 8.794
Market value of debt 24.604 EV/EBITDA E 2011 multiplier 5,02
EV 48.036 EV 44.129
Excess cash 8.622 Excess cash 8.622
Marketable securities 1.306 Marketable securities 1.306
Tax loss carry-forwards 1.314 Tax loss carry-forwards 1.314
Discontinued operations 450 Discontinued operations 450
Non-operating Assets 11.692 Non-operating Assets 11.692
Enterprice value 36.345 Enterprice value 32.437
Shares outstanding 4.975 Shares outstanding 4.975
Value per share 7,31 Value per share 6,52
Icelandair Group Price/Book multiplier Icelandair with peer Price/Book multiplier
Icelandair Group market value of equity 23.432
Icelandair Group book value of equity 28.403 Icelandair Group book value of equity 28.403
Price/Book multiplier 0,82 Icelandair Group book value of equity 0,60
Equity value 23.432 Equity value 17.096
Shares outstanding 4.975 Shares outstanding 4.975
Value per share 4,71 Value per share 3,44
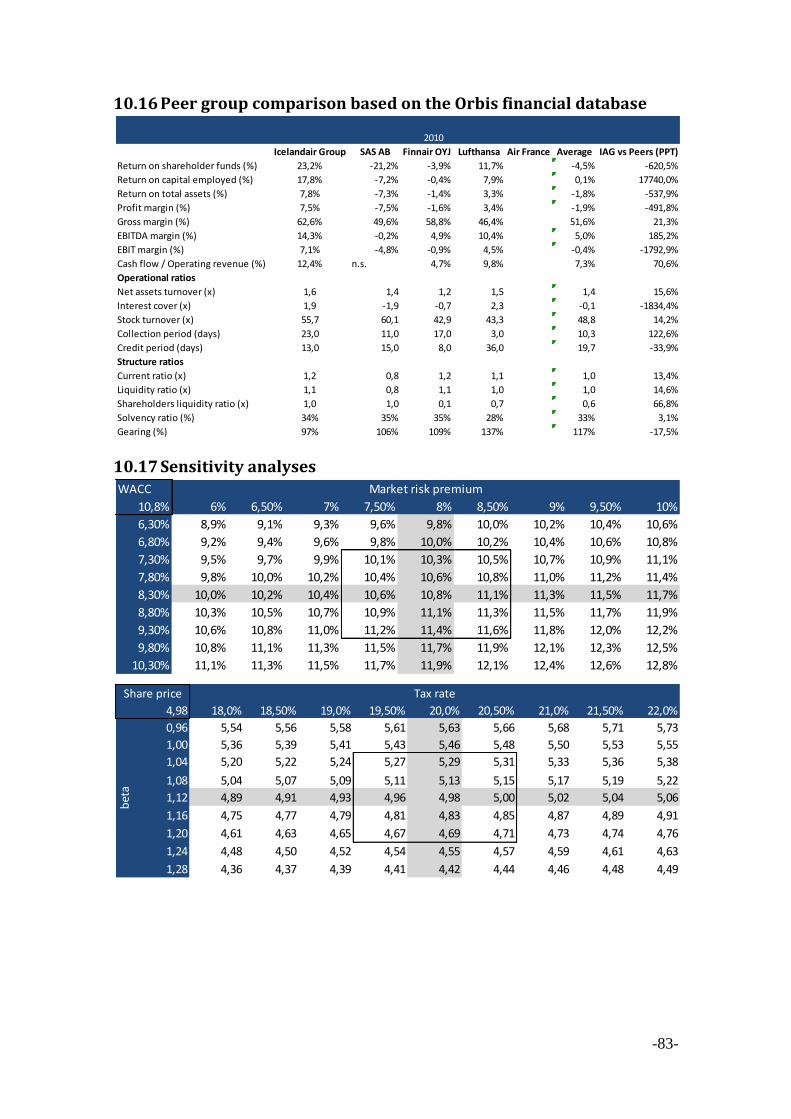
-83-
10.16 Peer group comparison based on the Orbis financial database
10.17 Sensitivity analyses
Icelandair Group SAS AB Finnair OYJ Lufthansa Air France Average IAG vs Peers (PPT)
Return on shareholder funds (%) 23,2% -21,2% -3,9% 11,7% -4,5% -620,5%
Return on capital employed (%) 17,8% -7,2% -0,4% 7,9% 0,1% 17740,0%
Return on total assets (%) 7,8% -7,3% -1,4% 3,3% -1,8% -537,9%
Profit margin (%) 7,5% -7,5% -1,6% 3,4% -1,9% -491,8%
Gross margin (%) 62,6% 49,6% 58,8% 46,4% 51,6% 21,3%
EBITDA margin (%) 14,3% -0,2% 4,9% 10,4% 5,0% 185,2%
EBIT margin (%) 7,1% -4,8% -0,9% 4,5% -0,4% -1792,9%
Cash flow / Operating revenue (%) 12,4% n.s. 4,7% 9,8% 7,3% 70,6%
Operational ratios
Net assets turnover (x) 1,6 1,4 1,2 1,5 1,4 15,6%
Interest cover (x) 1,9 -1,9 -0,7 2,3 -0,1 -1834,4%
Stock turnover (x) 55,7 60,1 42,9 43,3 48,8 14,2%
Collection period (days) 23,0 11,0 17,0 3,0 10,3 122,6%
Credit period (days) 13,0 15,0 8,0 36,0 19,7 -33,9%
Structure ratios
Current ratio (x) 1,2 0,8 1,2 1,1 1,0 13,4%
Liquidity ratio (x) 1,1 0,8 1,1 1,0 1,0 14,6%
Shareholders liquidity ratio (x) 1,0 1,0 0,1 0,7 0,6 66,8%
Solvency ratio (%) 34% 35% 35% 28% 33% 3,1%
Gearing (%) 97% 106% 109% 137% 117% -17,5%
2010
WACC
10,8% 6% 6,50% 7% 7,50% 8% 8,50% 9% 9,50% 10%
6,30% 8,9% 9,1% 9,3% 9,6% 9,8% 10,0% 10,2% 10,4% 10,6%
6,80% 9,2% 9,4% 9,6% 9,8% 10,0% 10,2% 10,4% 10,6% 10,8%
7,30% 9,5% 9,7% 9,9% 10,1% 10,3% 10,5% 10,7% 10,9% 11,1%
7,80% 9,8% 10,0% 10,2% 10,4% 10,6% 10,8% 11,0% 11,2% 11,4%
8,30% 10,0% 10,2% 10,4% 10,6% 10,8% 11,1% 11,3% 11,5% 11,7%
8,80% 10,3% 10,5% 10,7% 10,9% 11,1% 11,3% 11,5% 11,7% 11,9%
9,30% 10,6% 10,8% 11,0% 11,2% 11,4% 11,6% 11,8% 12,0% 12,2%
9,80% 10,8% 11,1% 11,3% 11,5% 11,7% 11,9% 12,1% 12,3% 12,5%
10,30% 11,1% 11,3% 11,5% 11,7% 11,9% 12,1% 12,4% 12,6% 12,8%
Market risk premium
4,98 18,0% 18,50% 19,0% 19,50% 20,0% 20,50% 21,0% 21,50% 22,0%
0,96 5,54 5,56 5,58 5,61 5,63 5,66 5,68 5,71 5,73
1,00 5,36 5,39 5,41 5,43 5,46 5,48 5,50 5,53 5,55
1,04 5,20 5,22 5,24 5,27 5,29 5,31 5,33 5,36 5,38
1,08 5,04 5,07 5,09 5,11 5,13 5,15 5,17 5,19 5,22
1,12 4,89 4,91 4,93 4,96 4,98 5,00 5,02 5,04 5,06
1,16 4,75 4,77 4,79 4,81 4,83 4,85 4,87 4,89 4,91
1,20 4,61 4,63 4,65 4,67 4,69 4,71 4,73 4,74 4,76
1,24 4,48 4,50 4,52 4,54 4,55 4,57 4,59 4,61 4,63
1,28 4,36 4,37 4,39 4,41 4,42 4,44 4,46 4,48 4,49
Share price Tax rate
bet
a