Strategic alliances for sustainable development: An ...
15
Strategic alliances for sustainable development: An application of DEA and Grey Theory Models Chia-Nan Wang National Kaohsiung University of Science and Technology Hoang-Phu Nguyen ( [email protected] ) National Kaohsiung University of Science and Technology Nhat-Luong Nhieu National Kaohsiung University of Science and Technology Research Article Keywords: Strategic alliance, optimization algorithms, Grey forecasting model, Data envelopment analysis (DEA), sustainable development, Coal mining industry Posted Date: September 28th, 2021 DOI: https://doi.org/10.21203/rs.3.rs-933451/v1 License: This work is licensed under a Creative Commons Attribution 4.0 International License. Read Full License
Transcript of Strategic alliances for sustainable development: An ...

Strategic alliances for sustainable development: Anapplication of DEA and Grey Theory ModelsChia-Nan Wang
National Kaohsiung University of Science and TechnologyHoang-Phu Nguyen ( [email protected] )
National Kaohsiung University of Science and TechnologyNhat-Luong Nhieu
National Kaohsiung University of Science and Technology
Research Article
Keywords: Strategic alliance, optimization algorithms, Grey forecasting model, Data envelopmentanalysis (DEA), sustainable development, Coal mining industry
Posted Date: September 28th, 2021
DOI: https://doi.org/10.21203/rs.3.rs-933451/v1
License: This work is licensed under a Creative Commons Attribution 4.0 International License. Read Full License

Article 1
Strategic alliances for sustainable development: An application of 2
DEA and Grey Theory Models 3
Chia-Nan Wang 1 ; Hoang-Phu Nguyen 1,2,* ; Nhat-Luong Nhieu1* 4
1 Department of Industrial Engineering and Management, National Kaohsiung University of Science and Technology, 5 Kaohsiung 80778, Taiwan ; email : [email protected] 6
2 Ho Chi Minh International University _ Vietnam National University; email: [email protected] 7 * Correspondence: [email protected] ; [email protected] 8
Abstract: Sustainable development is a global trend and an economic priority for many nations. Although 9
new energies can be considered good investments in green growth, it may lead to financial barriers to devel- 10
oping countries. The purpose of the study concentrates on an alternative solution that increasing the efficiency 11
performance of current fossil energy industries. The study has combined two models of Data Envelopment 12
Analysis (DEA) and Grey Theory in determining inefficiency units and proposed potential strategic alliances 13
for sustainable development in the Vietnam Coal industry. Besides considering inputs and outputs in the mod- 14
els, the location of coal mines is also a key indicator in recommending good alliances. The results show that 15
the collaborations between Cao Son coal mine and Coc Sau coal mine; between Nui Beo coal mine and Vang 16
Danh coal mine brings the best improvement for sustainable development. The study suggests detailed strate- 17
gies in action that enterprises and policymakers can refer to apply in practice. 18
Keywords: Strategic alliance; optimization algorithms; Grey forecasting model; Data envelopment analysis 19
(DEA); sustainable development; Coal mining industry 20
21
1. Introduction 22
In 2020, given the impact of the Covid-19 pandemic, Vietnam is one of few countries keeping 23
a positive GDP growth rate due to the successful efforts in containing the spread of the virus na- 24
tionwide. Vietnam’s economy is expected to develop by robust domestic demand and export-ori- 25
ented manufacturing. It is accompanied by a surge in power demand and consumption to support 26
its fast-growing economy. The energy demand is forecasted to rise by 8% per annum during 2021- 27
2030 (Vietnam Coal supply & demand 2021, market report,2/2021). It boosts the demand for coal 28
since this is still a cheap fuel source for power generation in a developing economy as Vietnam. 29
Since 2015, coal has overtaken hydropower to rank the most important energy source for the 30
power industry, making up 49.86% power generation share. With about 49 billion tons of coal 31
reserves over the country, Vietnam has become a key coal supplier for both domestic and the Asia 32
Pacific region. It has been attracted up to $150 billion from energy investors in the coming decades, 33
in which the coal set is to dominate. Hence, the coal mining sector has contributed significantly to 34
the economic growth of Vietnam. 35
1.1. The coal mining sector in Vietnam 36
In Vietnam, all coal is owned by the government. Approximately 95% of the total coal is pro- 37
duced and mined by a state-owned holding company called Vietnam National Coal-Mineral Indus- 38
tries Group (VINACOMIN). 39
VINACOMIN is established in 2005 through the merger of Vietnam National Coal Corp. (Vi- 40
nacoal) and the Vietnam National Minerals Corp. (Minh Chuan, 2019). The corporation has be- 41
come a major coal producer in Vietnam and has various activities such as providing anthracite for 42
the power sector, industries for both domestic and global markets. 43
Most of Vietnam’s coal resources are located in the north. In the red river Delta coal basin 39.4 44
billion tons of Sub-bituminous accounted for 81% of four types of coal including Anthracite; Fat 45

2
coal; sub-bituminous; peat coal. VINACOMIN has operated five large surface coal mines with an 46
annual capacity greater than 2 million tonnes (Cao Son, Coc Sau, Deo Nai, Ha Tu, and 47
Nui Beo mines), 15 surface coal mines with production from 0.1 to 0.7 million tonnes per year. 48
1.2. Environmental issues from mining coal: 49
Vietnam's coal mining industry meets many difficulties in the increase of coal production, 50
prospecting, and exploration, mining technologies. It would be more challenging when the Viet- 51
namese government has much effort to go green, the environmental problems and sustainable de- 52
velopment are two significant issues that the Vietnam coal mining sector could encounter. In terms 53
of the environmental aspect, mining coal causes land subsidence, damages to the water ecology, 54
mining waste disposal, and air pollution. It may change either environmental pollution or landscape 55
(Zheng-fu et al., 2010) 56
Coal exploration could impact the water systems and extraction can affect groundwater levels 57
and acidity. There is approximately 75 Tg / S per year of sulfur dioxide (SO2) released from coal 58
burning. It causes acid rain and acidification of ecosystems (EIA, 26 July 2020). Moreover, there 59
are many problems from wasted coal mines such as occurring settlements in tunnels, infrastructure, 60
or arable land damages. In 2013, the head of the UN climate agency argued that the inefficiency 61
mining of underground coal contributes to global warming. 62
1.3. Strategic Alliance for sustainable development 63
There are many difficulties that an organization encounters if they have a sustainably develop- 64
ing orientation. These challenges are related to various aspects such as technical, social, and organ- 65
izational innovations. Strategic alliances can be considered as an important sustainability innova- 66
tion in improving resources efficiency (Chia-Nan et al., 2021) 67
The strategic alliance is a collaboration form to achieve mutual goals, for example, two differ- 68
ent units collaborate to facilitate reciprocal learning processes (Nguyen & Nguyen, 2020). Across 69
the world, there are many examples of alliances for sustainable development. The Central American 70
Council for Sustainable Development has promoted alliance agreements designed to support sus- 71
tainable development in Central America at both the national and regional levels (UNHR, 2015). 72
The Italian landscape applied alliance strategies to enhance the importance of the Sustainable De- 73
velopment Agenda for Italian society and economic stakeholders. The participating in alliances 74
support them to pursue the Sustainable Development Goals by United Nation (Martino, 2016) 75
This study aims to propose a model integrating Data Envelopment Analysis (DEA) and Grey 76
theory, in which the authors determine the inefficiency units in the Vietnam coal mining sector and 77
recommend potential alliances for sustainable development. 78
1.4. Problem statement 79
Currently, these mining projects of VINACOMIN current are operating independently and lack 80
efficient performance measurement. As mentioned above, the inefficiency of coal mining causes 81
many environmental problems, especially significant barriers if the Vietnamese government wants 82
to have sustainable development. It is necessary to study the effectiveness and efficiency of sub- 83
projects that VINACOMIN operates, then having recommendations in improving its performance. 84
This study would use a novelty research model with a combination of Data Envelopment Anal- 85
ysis (DEA) and Grey-Theory models to evaluate the efficiency performance of major coal mines, 86
then suggest possible strategic alliances. Such collaborations can improve the coal mining effi- 87
ciency as well as contribute to reducing environmental issues from this industry. 88
2. Literature Review and Research Process: 89
2.1. DEA model, Grey Theory, and its application 90
Charnes et al. (1978) implemented Data Envelopment Analysis (DEA) to evaluate the perfor- 91
mance of business units through estimating the ratio between inputs and outputs as efficiency index 92
(Le, Wang, & Nguyen, 2020) (Nguyen & Nguyen, 2020). There are two traditional versions of 93
DEA models, namely the Charnes–Cooper–Rhodes (CCR) and the Banker–Charnes–Cooper (BCC) 94
model (Charnes, Cooper, & Rhodes, 1978). The former is used to determine the overall inefficiency, 95
whereas the latter differentiates between technical efficiency and scale efficiency. After several 96
years, the super slack-based measure (super SBM) model is developed to optimize the shortcomings 97

3
of the traditional DEA model and obtain reasonable metrics. It has eliminated the slack problems 98
while accurately ranking the effectiveness of DMUs (Zhou, Min, Xu, & Cao, 2008; Nguyen & Ngu- 99
yen, 2020). Many studies related to the application of DEA are studied across different fields such 100
as logistics (Le, Wang, & Nguyen, 2020), automobile manufacturer (Wang, Nguyen, & Wang, 101
2016) , coal mining industry (Nguyen & Nguyen, 2020), textile and Garment industry (Phu & Duy, 102
2019), seaport (Wang et al. ,2021). 103
The research implemented in developing countries as Vietnam often encounters a problem of 104
disorderly and unsystematic data. To deal with the small amount of random data, the authors take 105
the advantage of the Grey system model introduced by Deng (1982). Grey theory has been a pow- 106
erful tool in projecting historical business data with a limited amount (Gilliland, 2010 ; Phu & Duy 107
, 2019; Le, Wang, & Nguyen, 2020) 108
There is much literature on the application of DEA in efficiency evaluation, however, a lim- 109
ited number of studies on environmental efficiency or sustainable development (Wang et al., 2021). 110
There has been no research implemented for the case of the Vietnamese coal mining industry to 111
evaluate the performance efficiency and give suggestions for sustainable development. This study 112
aims to fill the gap in the existing literature by evaluating the efficiency of 10 independent coal 113
mining projects that are operated by VINACOMIN, then combining Grey Model (i.e GM (1,1) ) to 114
simulate strategic alliances between inefficiency projects 115
116
Table 1: Summary of methodologies and inputs/outputs selection in previous studies.
Authors Inputs Outputs Methodologies Applied Areas
(Zhou, Min, Xu, & Cao,
2008)
Net fixed asset
Salaries and wages
Operating expenses
Current liabilities
Operating
income
CCR
BCC Logistics
(Wang, Nguyen, &
Wang, 2016)
Fixed Assets
Cost of Good Sold
Operating Expenses
Long-term Investment
Revenue
Total Equity
Net Income
Hybrid DEA
Grey Theory model
Automobile Industry
(Phu & Duy, 2019) Fixed Assets
Cost of Good Sold
Revenue
Net Profit
DEA and Grey
Theory
Textile and Garment
Industry
(Nguyen & Nguyen,
2020)
Fixed Assets
Cost of Good Sold
Operating Cost
Net revenue
Net Profit
Super-SBM-I-V
Grey Theory Coal mining Industry
Wang et al. (2021)
Total Asset
Total Equity
Liabilities
Operating expense
Revenue
Net profit
Malmquist
EBM Seaport
Note : Charnes–Cooper–Rhodes (CCR), Banker–Charnes–Cooper (BCC) , slack-based measure (SBM) , epsilon-
based measure (EBM)

4
2.2. Research Process 117
The authors implemented three phases in the research process as the Figure 1 below. 118
Phase 1: Literature review and variable selection 119
Step1: Data collection 120
There is 95% of total coal production in Vietnam explored by the VINACOMIN. Regarding 121
underground mining, VINACOMIN has operated 30 coal mines in which some mines with pro- 122
duction lower than 0.1 million tonnes per year. 123
In this study, the authors decided to select the top 10 major mines with high investments and 124
a producing capacity greater than 1 million tonnes per year (see the list of mines in Table 2). 125
These are referred to as DMUs in the research model. 126
Step 2: Inputs/ Outputs selection 127
• For manufacturing and producing firms, the cash flow will be allocated with the high 128
weighted indicators such as Fixed Assets, Cost of Good Sold (COGS), and Operating Cost. These 129
factors significantly impact the expenditure of DMUs (Chia-Nan et al., 2021) 130
• In addition, the final goal of any business is profit. The performance of a firm, hence, is well 131
measured by two key indicators, namely Revenue and Operating Profit. (Nguyen & Nguyen, 132
2020) 133
• The recent relevant literature are reviewed to support the selection of variables as inputs/ 134
outputs in the model. 135
• Table 1 presented the studies that applied DEA in evaluating the efficiency performance of 136
DMUs across sectors. 137
Determining Goal and Reviewing literature
Inputs/ Outputs selection
Pearson Correlation
Grey Prediction
Prediction Accuracy
DEA Model
Alliance Before Alliance
Alliance After Alliance
Recommendation for Sustainable
development
Super SBM-I-V
MAPE < 10%
Positive
High errors
Negative
Phase 1:
Variables
Determination
Phase 2:
Grey Prediction
Phase 3:
DEA model and
Alliance
recommendations
Figure 1: Research development

5
For the reasons above, the authors selected three Input factors: (I1) Fixed assets; (I2) Cost of 138
goods sold ; (I3) Operating Costs; and two Output factors : (O1 ) Revenues ; (O2 ) Operating 139
profit. 140
Step 3: Pearson correlation 141
A requirement of applying DEA is the positive correlation between inputs and outputs. The Pear- 142
son correlation, hence, is implemented to make sure the accuracy of the selection of the indica- 143
tors. 144
Phase 2: Grey Prediction 145
Step 4: Implementing Grey Model 146
The authors decide to use the Grey Model (1,1) model to forecast the inputs and outputs of 147
each DMUs in the next 3-year period (i.e. 2021-2023). 148
Step 5: Checking the level of accuracy 149
To check the accuracy level of projections, the authors estimated the index of Mean Abso- 150
lute Percent Error (MAPE). If the value of MAPE is higher than 20%, then the errors of forecast- 151
ing are too high than the actual values (Gilliland, 2010; Wang, Nguyen, & Wang, 2016; Nguyen 152
& Nguyen, 2020). It means that the data must be re-selected. 153
Phase 3: DEA application 154
Step 6: Choosing the DEA model 155
To eliminate the slack problems that traditional DEA models (i.e CCR and BCC) cannot 156
deal with, the authors take the advantage of the Super -SBM-I-V of DEA to evaluate efficiency 157
points and rankings of each coal mining project. 158
Step 7: Before collaboration 159
In this step, the SBM model established by (Tone, 2001) is used to evaluate the efficiency 160
of DMU(x0, y0) over the period 2016-2020. It aims to define a target DMU that is received a 161
high investment from VINACOMIN but has shown a low-efficiency score in performance. 162
Step 8: After Collaboration 163
After the target DMU is determined, the authors set up “virtual alliances” by getting the 164
forecasted values between the target and other DMUs (see the list in Table 9). Then, the super 165
SBM-I-V model is reimplemented to compare the difference. 166
Step 9: Alliance suggested a sustainable development 167
The study shows the coal mines operating inefficiency and then suggests possible strategic 168
alliances for a sustainable development orientation at VINACOMIN as well as the government 169
level. 170
3. Methodology 171
3.1. Grey theory model: 172
The GM(1,1) model has five main steps described as following: 173
Input original time series data X(0) (Deng, 1982) 174 𝑋((0)) = (𝑥((0))(1), 𝑥((0))(2), ⋯ , 𝑥((0))(𝑛)) , 𝑛 ≥ 4 (1) 175
where 𝑋((0)): a non-negative sequence; n: the number of data observed 176
then, generate time-series data X(1)
(k) by 1-Accumulating Generation Operator AGO (1-AGO) of 177
X(0)
And Generate partial series data Z(1)
(k) from X(1)
(k) as equation (2) below 178

6
𝑋((1)) = (𝑥((1))(1), 𝑥((1))(2), ⋯ , 𝑥((1))(𝑛)) , n ≥ 4 (2) 179
where 𝑥(1)(𝑘) = ∑ 𝑥(0)(𝑖)𝑘𝑖=1 , 𝑘 = 1,2, ⋯ 𝑛. (3) 180
Next, the data matrix is established by a least square method to acquire the value of coefficient a & 181
grey input b 182 𝑍((1)) = (𝑧((1))(2), 𝑧((1))(3), ⋯ , 𝑧((1))(𝑛)), (4) 183
Where 𝑧((1))(𝑘) = 1/2 (𝑥((1))(𝑘) + 𝑥((1))(𝑘 − 1)) , k = 2,3,…,n (5) 184
Construct GM(1,1) forecasting equation 185
𝑑𝑋(1)(𝑘)𝑑𝑘 + 𝑎𝑥(1)(𝑘) = 𝑏 (6) 186
where: parameters a and b are called the developing coefficient and grey input, respectively. 187
However, these parameters a and b are undetermined from Equation (6). Instead, the least square 188
method as the equations (7 – 11) below can be used : 189 �̂�(1)(𝑘 + 1) = (𝑋(0)(1) − 𝑏𝑎) 𝑒−𝑎𝑘 + 𝑏𝑎 , k=1,2,3... (7) 190
Where 𝑋(1)(𝑘 + 1) denotes the prediction X at time point k+1 and the coefficients [a,b]T can be 191
obtained by the Ordinary Least Squares (OLS) method: 192 [𝑎𝑏]𝑇 = �̂� = (𝐵𝑇𝐵)−1𝐵𝑇𝑌𝑁 (8) 193
And 𝐵 = [−𝑍(1)(2) 1⋯ ⋯−𝑍(1)(𝑛) 1 ] (9) 194
𝑌𝑁 = [𝑋(0)(2)⋯𝑋(0)(𝑛)] (10) 195
(B is data matrix, YN is data series, [a,b]T is parameter series ) 196 �̂�(1)is acquired from Equation (7). Let �̂�(0)be the GM(1,1) fitted and predicted series : 197 �̂�(0) = (�̂�(0)(1), �̂�(0)(2), … , �̂�(0)(𝑛), … )where �̂�(0)(1) = 𝑋(0)(1) 198
Evaluate average residual γ, and calculate forecast values as equation (11): 199 𝑋(0)(𝑘 + 1) = (𝑋(0)(1) − 𝑏𝑎) 𝑒−𝑎𝑘(1 − 𝑒𝑎) (k=1,2,3...) (11) 200
3.2. Super Slacks-Based Measure model : 201
The non-negative data input is a compulsory requirement in the application of DEA models. 202
Tone (2001) developed the Slacks-based measure of efficiency (SBM) that supposes yr0 ≤ 0 and 203
defines �̅�𝑟+ and �̅�−𝑟+ by equation (12) & (13): 204 �̅�𝑟+ = max𝑗=1,…𝑛{𝑦𝑟𝑗|𝑦𝑟𝑗 > 0}, (12) 205
�̅�−𝑟+ = min𝑗=1,…𝑛{𝑦𝑟𝑗|𝑦𝑟𝑗 > 0}, (13) 206
If the output r does not have positive values, then it is defined as �̅�𝑟+ = �̅�−𝑟+ = 1. 207
The value 𝑦𝑟0 is never changed in the constraints. The term is 𝑠𝑟+/𝑦𝑟0 will be replaced by 208
equations (14) & (15) 209

7
𝑠𝑟+/ 𝑦−𝑟+ (�̅�𝑟+−𝑦−𝑟+ )�̅�𝑟+−𝑦𝑟0 if�̅�𝑟+>𝑦−𝑟+ (14) 210
𝑠𝑟+/ (𝑦−𝑟+ )2𝐵(�̅�𝑟+−𝑦𝑟0)if�̅�𝑟+ = 𝑦−𝑟+ (15) 211
With B=100. 212
The estimated score is units’ invariant that is independent of the measuring units (Düzakın & 213
Düzakın, 2007) 214
215
4. Empirical Analysis And Results: 216
4.1. Collecting the DMUs 217
According to the rule of thumb from (Golany & Roll, 1989), the number of DMUs selected 218
needs to be at least double the number of inputs and outputs in total. With 5 variables considered, 219
hence, the authors decide to study 10 major coal mining projects of VINACOMIN as DMUs in the 220
research model. 221
The financial statements during 2016-2020 are collected from a reliable database source, the 222
State Securities Commission of Vietnam (ssc.gov.vn) and double-checked with the official reports 223
of VINACOMIN. Table 2 presents the list of DMUs and their market capitals in Billions of Vi- 224
etnam Dong (Bil. VND) 225
226
4.2. Variables Collection 227
By reviewing the relevant literature of DEA and coal mining industry reports, the authors 228
decide to select inputs and output variables. According to step 2 in section 2.2, three key reasons 229
are supporting to the selection of inputs. There are important factors to the sources of coal mining 230
manufactures are fixed assets, operating cost, and cost of goods sold (COGS). In terms of outputs, 231
Revenues and Operating profit are considered as two output factors because the indicators are good 232
signals to analyze the company’s financial effectiveness. 233
Table 2: The list of DMUs
No. DMUs Stock Code Company Name Market Capital
( in Bil.VND)
1 DMU1 MVB Vinacomin - Viet Bac Mining Industry Holding Corporation 1,627.50
2 DMU2 TVD Vinacomin - Vang Danh Coal Joint Stock Company 350.71
3 DMU3 NBC Vinacomin - Nui Beo Coal Joint Stock Company 270.09
4 DMU4 TDN Vinacomin - DeoNai Coal Joint Stock Company 235.51
5 DMU5 TMB Vinacomin - Northern Coal Trading Joint Stock Company 216.08
6 DMU6 TCS Vinacomin - Cao Son Coal Joint Stock Company 214.07
7 DMU7 HLC Vinacomin - Ha Lam Coal Joint Stock Company 210.95
8 DMU8 THT Vinacomin - Ha Tu Coal Joint Stock Company 203.92
9 DMU9 TC6 Vinacomin - Coc Sau Coal Joint Stock Company 149.48
10 DMU10 MDC Vinacomin - Mong Duong Coal Joint Stock Company 147.79
8
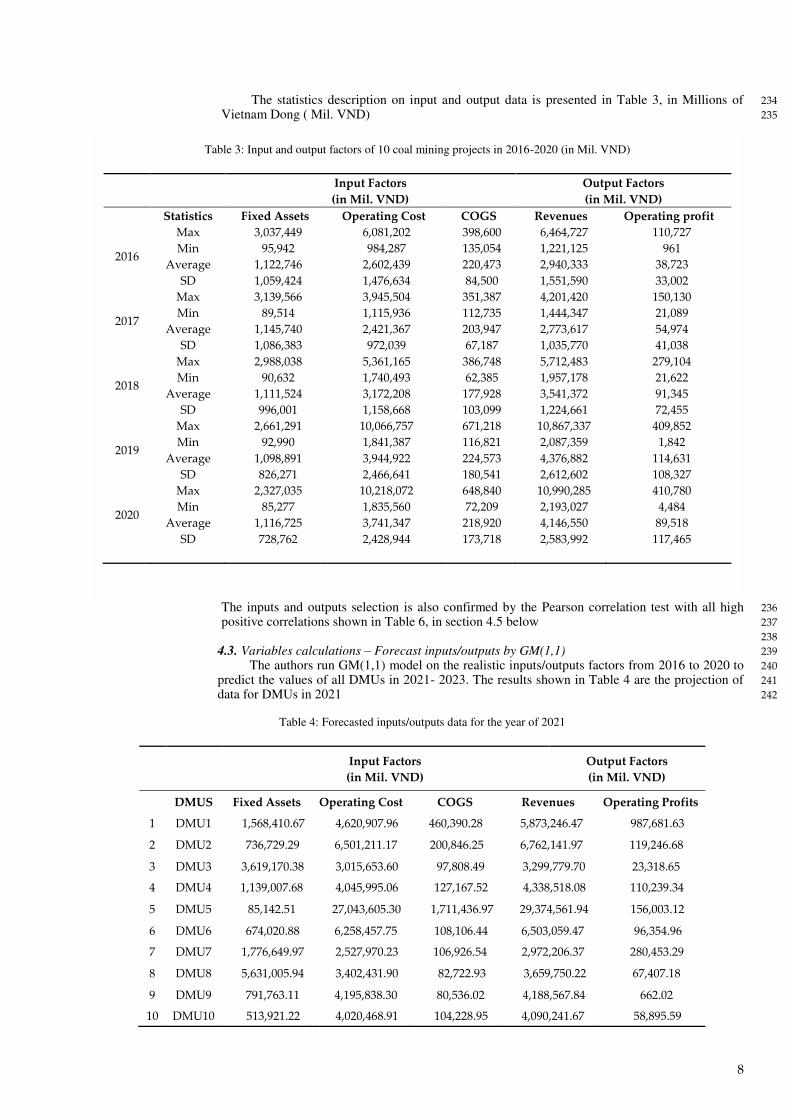
The statistics description on input and output data is presented in Table 3, in Millions of 234
Vietnam Dong ( Mil. VND) 235
The inputs and outputs selection is also confirmed by the Pearson correlation test with all high 236
positive correlations shown in Table 6, in section 4.5 below 237
238
4.3. Variables calculations – Forecast inputs/outputs by GM(1,1) 239
The authors run GM(1,1) model on the realistic inputs/outputs factors from 2016 to 2020 to 240
predict the values of all DMUs in 2021- 2023. The results shown in Table 4 are the projection of 241
data for DMUs in 2021 242
Table 4: Forecasted inputs/outputs data for the year of 2021
Input Factors
(in Mil. VND)
Output Factors
(in Mil. VND)
DMUS Fixed Assets Operating Cost COGS Revenues Operating Profits
1 DMU1 1,568,410.67 4,620,907.96 460,390.28 5,873,246.47 987,681.63
2 DMU2 736,729.29 6,501,211.17 200,846.25 6,762,141.97 119,246.68
3 DMU3 3,619,170.38 3,015,653.60 97,808.49 3,299,779.70 23,318.65
4 DMU4 1,139,007.68 4,045,995.06 127,167.52 4,338,518.08 110,239.34
5 DMU5 85,142.51 27,043,605.30 1,711,436.97 29,374,561.94 156,003.12
6 DMU6 674,020.88 6,258,457.75 108,106.44 6,503,059.47 96,354.96
7 DMU7 1,776,649.97 2,527,970.23 106,926.54 2,972,206.37 280,453.29
8 DMU8 5,631,005.94 3,402,431.90 82,722.93 3,659,750.22 67,407.18
9 DMU9 791,763.11 4,195,838.30 80,536.02 4,188,567.84 662.02
10 DMU10 513,921.22 4,020,468.91 104,228.95 4,090,241.67 58,895.59
Table 3: Input and output factors of 10 coal mining projects in 2016-2020 (in Mil. VND)
Input Factors
(in Mil. VND)
Output Factors
(in Mil. VND)
Statistics Fixed Assets Operating Cost COGS Revenues Operating profit
2016
Max 3,037,449 6,081,202 398,600 6,464,727 110,727
Min 95,942 984,287 135,054 1,221,125 961
Average 1,122,746 2,602,439 220,473 2,940,333 38,723
SD 1,059,424 1,476,634 84,500 1,551,590 33,002
2017
Max 3,139,566 3,945,504 351,387 4,201,420 150,130
Min 89,514 1,115,936 112,735 1,444,347 21,089
Average 1,145,740 2,421,367 203,947 2,773,617 54,974
SD 1,086,383 972,039 67,187 1,035,770 41,038
2018
Max 2,988,038 5,361,165 386,748 5,712,483 279,104
Min 90,632 1,740,493 62,385 1,957,178 21,622
Average 1,111,524 3,172,208 177,928 3,541,372 91,345
SD 996,001 1,158,668 103,099 1,224,661 72,455
2019
Max 2,661,291 10,066,757 671,218 10,867,337 409,852
Min 92,990 1,841,387 116,821 2,087,359 1,842
Average 1,098,891 3,944,922 224,573 4,376,882 114,631
SD 826,271 2,466,641 180,541 2,612,602 108,327
2020
Max 2,327,035 10,218,072 648,840 10,990,285 410,780
Min 85,277 1,835,560 72,209 2,193,027 4,484
Average 1,116,725 3,741,347 218,920 4,146,550 89,518
SD 728,762 2,428,944 173,718 2,583,992 117,465

9
243
4.4. Accurate checking 244
The imperfect information is a constraint in the prediction. To check the accuracy of applying 245
GM(1,1), the authors estimate the MAPE score in percentage and shown as follows (Table 5) 246
247
248
The predicted values are good and qualified if the value of MAPE is less than 10% (Gilliland, 249
2010). In Table 5, the average MAPE of 8.49% confirms the estimations by using GM(1,1) are 250
accurate to use in the study. 251
252
4.5. Pearson Correlation 253
Table 6 presents the results of the Pearson correlation test between inputs and outputs over 254
the period 2016-2020. The significant positive associations confirm the “homogeneity” and “isoto- 255
nicity” data that satisfied two requirements for applying the DEA model. 256
257
4.6. Analysis before alliance 258
Table 5 : Average MAPE of DMUs (in %)
DMUs Fixed
Assets
Operating
Cost COGS Revenues
Operating
Profits
Average MAPE of
DMUs
DMU1 2.81 6.34 10.67 15.24 7.34 8.48
DMU2 10.28 3.38 7.72 12.11 14.75 9.648
DMU3 12.25 5.34 6.54 10.34 16.54 10.202
DMU4 14.28 10.55 12.91 5.22 13.43 11.278
DMU5 5.23 14.22 12.27 5.65 7.32 8.938
DMU6 4.76 12.02 9.65 4.78 4.71 7.184
DMU7 7.56 5.69 7.83 5.23 4.05 6.072
DMU8 3.09 2.35 8.34 4.87 12.31 6.192
DMU9 12.34 6.12 2.65 11.23 15.23 9.514
DMU10 5.43 7.23 15.34 5.12 3.78 7.38
Average MAPE of all 10 DMUs 8.49
Table 6: Pearson Correlation of input and output data in 2016-2020
FA COGS OC RE OP
Fixed Asset (FA) Pearson Correlation 1 0.927** 0.841** 0.775** 0.673* Sig. (2-tailed) 0.000 0.000 0.000 0.000 0.000 Sample 504 504 504 504 504
Cost of Good Sold (COGS) Pearson Correlation 0.927** 1 0.912** 0.997** 0.812** Sig. (2-tailed) 0.000 0.000 0.000 0.000 0.000 Sample 504 504 504 504 504
Operating Cost (OC) Pearson Correlation 0.841** 0.912** 1 0.612* 0.854** Sig. (2-tailed) 0.000 0.000 0.000 0.000 0.000 Sample 504 504 504 504 504
Revenue (RE) Pearson Correlation 0.775** 0.997** 0.612* 1 0.572* Sig. (2-tailed) 0.000 0.000 0.000 0.000 0.000 Sample 504 504 504 504 504
Operating Profit (OP) Pearson Correlation 0.673* 0.812** 0.854** 0.572* 1 Sig. (2-tailed) 0.000 0.000 0.000 0.000 0.000 Sample 504 504 504 504 504
*;**. Correlation is significant at the 0.05; 0.01 level (2-tailed).

10
The super-SBM-I-V algorithm based the business performance of all DMUs in 2020 to eval- 259
uate the efficiency of 10 major coal mines 260
261
Table 7 and Table 8 present the example of efficiency score ranking in 2019 and 2020 respec- 262
tively, the authors considered all the performance rankings in the period of 2016-2020 to select the 263
target DMU. 264
The Vang Danh coal mine referred to as TVD (i.e. DMU2) is one of the big projects invested 265
by VINACOMIN and a major unit in exploring the coal industry that accounts for the second- 266
highest market capital with 350.71 Bil. VND in 2020 (Table 2). However, the TVD has performed 267
with the “less 1” efficiency score over the 5-year period (2016-2020). It means that there are some 268
issues in operating despite having good potential inputs. Therefore, the authors consider TVD as 269
the target DMU to set up different virtual alliances. 270
In terms of geography, the authors also consider 4 major coal mines namely Cao Son (TCS), 271
Mong Duong (MDC), Deo Nai ( TDN), and Coc Sau (TC6). Because the locations of these coal 272
mines are very closed ( as Figure 2). However, TC6 has performed inefficiency (i.e “less 1”) 273
throughout 2016-2020. The authors set up 3 virtual alliances between TC6 with three neighbor coal 274
mines. 275
276
4.7. Analysis after alliance 277
278
Table 8: Performance ranking of DMUs 2020
Rank Score DMUs Rank Score DMUs
1st 1.71416 HLC 6th 1.02582 TDN
2nd 1.30716 THT 7th 1 MVB
3rd 1.13554 MDC 8th 1 TMB
4th 1.1233 NBC 9th 0.92088 TVD
5th 1.06334 TCS 10th 0.88667 TC6
Table 7: Performance ranking of DMUs 2019
Rank Score DMUs Rank Score DMUs
1st 1.83798 HLC 6th 1.00001 MVB
2nd 1.45566 TCS 7th 1 TMB
3rd 1.26283 MDC 8th 0.88751 TVD
4th 1.18094 TDN 9th 0.87454 TC6
5th 1.06304 NBC 10th 0.85346 THT
Figure 2 : Locations of Cao Son, Mong Duong, Deo Nai and Coc Sau coal mines. Source: (Nguyen B. ,

11
With the data forecasted by the Grey model, the authors formed 12 virtual alliances in total, 279
including 9 collaborations between DMU2 (i.e. TVD) and other DMUs and 3 virtual alliances be- 280
tween TC6 and other coal mines nearby (TCS; MDC; TDN) as Table 9. 281
Then, Super-SBM-I-V is repeatedly implemented to estimate and rank the efficiency of these 282
DMUs in 2021 and 2022. 283
284
4.8. Alliance selection: 285
286
Anand & Khanna (2000) argued that the advantages of alliances are improving performance; 287
enhancing productivity; raising a firm’s market power. A key motivation to form alliances is im- 288
proving performance efficiency. 289
This study aims to figure out the inefficiency DMUs and suggest potential partners improve 290
the performance. As the analysis in step 7, there are two target DMUs (i.e. TVD and TC6) that 291
authors formed 22 virtual DMUs including 12 virtual alliances. Then, the super SBM-I-V model is 292
applied to estimate the performance efficiency scores. Table 10 and Table 11 showed that five 293
potential good alliances improve the efficiency ranking of TVD and TC6 after cooperating. How- 294
ever, the authors separated two groups of these alliances according to the level of priority. 295
296
297
A good strategic alliance should be a collaboration that brings benefits to every counterpart. 298
In this context, the first group includes DMUs that improve the efficiency scores of the target 299
DMUs and themselves. In Table 10 and Table 11, the virtual alliances in green cells ( TCS & TC6; 300
TVD & NBC) have increased the performance of counterparts. If there is a cooperation between 301
Table 9: Forecasted inputs/outputs data for the year of 2021
Input Factors
(in Mil. VND)
Output Factors
(in Mil. VND)
DMUs Fixed Assets Operating Cost COGS Revenues Opertaing Profits
1 MVB 1,568,410.67 4,620,907.96 460,390.28 5,873,246.47 987,681.63
2 TVD 736,729.29 6,501,211.17 200,846.25 6,762,141.97 119,246.68
3 NBC 3,619,170.38 3,015,653.60 97,808.49 3,299,779.70 23,318.65
4 TDN 1,139,007.68 4,045,995.06 127,167.52 4,338,518.08 110,239.34
5 TMB 85,142.51 27,043,605.30 1,711,436.97 29,374,561.94 156,003.12
6 TCS 674,020.88 6,258,457.75 108,106.44 6,503,059.47 96,354.96
7 HLC 1,776,649.97 2,527,970.23 106,926.54 2,972,206.37 280,453.29
8 THT 5,631,005.94 3,402,431.90 82,722.93 3,659,750.22 67,407.18
9 TC6 791,763.11 4,195,838.30 80,536.02 4,188,567.84 662.02
10 MDC 513,921.22 4,020,468.91 104,228.95 4,090,241.67 58,895.59
11 TVD+MVB 2,305,139.96 11,122,119.13 661,236.53 12,635,388.44 1,106,928.31
12 TVD+NBC 4,355,899.67 9,516,864.77 298,654.74 10,061,921.67 142,565.33
13 TVD+TDN 1,875,736.97 10,547,206.23 328,013.77 11,100,660.05 229,486.02
14 TVD+TMB 821,871.80 33,544,816.47 1,912,283.22 36,136,703.91 275,249.80
15 TVD+TCS 1,410,750.18 12,759,668.92 308,952.69 13,265,201.44 215,601.63
16 TVD+HLC 2,513,379.27 9,029,181.40 307,772.79 9,734,348.34 399,699.97
17 TVD+THT 6,367,735.24 9,903,643.07 283,569.18 10,421,892.19 186,653.85
18 TVD+TC6 1,528,492.41 10,697,049.47 281,382.27 10,950,709.81 119,908.69
19 TVD+MDC 1,250,650.51 10,521,680.08 305,075.20 10,852,383.64 178,142.27
20 TC6+ TCS 1,465,784.00 10,454,296.04 188,642.46 10,691,627.32 97,016.97
21 TC6 + MDC 1,305,684.33 8,216,307.21 184,764.97 8,278,809.52 59,557.61
22 TC6+TDN 1,930,770.79 8,241,833.36 207,703.54 8,527,085.92 110,901.36

12
TCS & TC6, the position in the efficiency ranking of both is 6th in 2021 (Table 10). It is better than 302
the position of TCS and TC6 if they operate independently. Similarly, the virtual alliance TVD & 303
NBC improves significant performance scores of TVD and NBC in 2021 and 2022. Without col- 304
laboration, the performance of TVD and NBC is ranked at 16th and 17th in 2021 according to the 305
authors’ estimation in Table 10 & Table 11. Hence, the authors have the most priority in strategic 306
alliance recommendation for VINACOMIN; including TCS &TC6 (Cao Son coal mine & Coc Sau 307
coal mine) and Nui Beo coal mine & Vang Danh coal mine (TVD). 308
In addition, the authors consider the second priority group including potential DMUs that 309
support the target DMU to improve performance although it may influence its performance. How- 310
ever, the study recommends them to VINACOMIN since the efficiency scores are still higher 1 that 311
is an acceptable level. In addition, these DMUs are all under-managed by VINACOMIN, so such 312
alliances are possible to implement toward a common goal of sustainable development. 313
314
315
5. Discussion : 316
As mentioned above, sustainable development has become a global trend and long-term ori- 317
entation in most countries. There are many various approaches to achieve this goal, however, each 318
government will choose different ways that are suitable for its contexts. For example, some nations 319
have applied the environmental tax on sectors that have significant negative impacts on the envi- 320
ronment such as steel manufacturing, mining, etc. On the other hand, some countries choose to 321
support using alternative renewable energies such as hydrogen (water, solar, wind, etc.). Neverthe- 322
less, in developing countries such as Vietnam, economic growth is still the most priority and fossil 323
energies such as the coal mining industry have an important role in economic development. Alt- 324
hough the Vietnamese Government has some commitment to climate change, the internal energy 325
market is still dominated mainly by fossil fuel-based technologies, and new thermal coal power 326
plants are heavily invested during the last two decades. Therefore, if the Vietnam Government 327
wants to integrate with global tendency as well as keeping growth in the economy, it is necessary 328
to improve efficiency performance of current sectors. 329
There is no denying that the coal industry has a significant impact on the environment, espe- 330
cially in global climate change. If coal mines have the inefficient operation, it causes serious prob- 331
lems in terms of environmental, social, and economic aspects. Therefore, it is necessary to define 332
the inefficiency of coal mines and have solutions such as M&A or involving partnership; because 333
this is not only a common motivation among units but also is aligned with the orientation of the 334
government. 335
The findings of this study are valuable references to answer the questions “what” and “how” 336
to have good strategic alliances in sustainable development. 337
338
Which are inefficiency units? 339
The authors take advantage of combing two models of DEA and Grey Theory to define inef- 340
ficiency units. The study has considered the ratio between the outputs that units have created and 341
the inputs that units have been invested, then has made comparisons among units. Table 7 and Table 342
8 present the performance estimation of the top 10 coal mines managed by VINACOMIN. There 343
are two units namely “Coc Sau coal mine” (TC6) and “ Vang Danh coal mine” (TVD) obtained 344
performance scores less than 1, i.e. these mines have not optimized investments from the head 345
Table 10 : Performance ranking of virtual alliance 2021
Rank DMU Score Rank DMU Score
1st TMB 1.89008 12th TVD+TMB 1
2nd THT 1.72023 13th TDN 0.94399
3rd MVB 1.6074 14th TVD+MDC 0.8995
4th HLC 1.43775 15th TVD+TC6 0.86549
5th MDC 1.22765 16th TVD 0.86385
6th TC6+TCS 1.19298 17th NBC 0.8582
7th TVD+ NBC 1.11977 18th TVD+TDN 0.84941
8th TCS 1.09497 19th TC6 + MDC 0.83482
9th TC6 1.09339 20th TC6+TDN 0.75497
10th TVD+MVB 1.02966 21st TVD+TCS 0.73032
11th TVD+HLC 1.0028 22nd TVD+THT 0.71258
Table 11: Performance ranking of virtual alliance 2022
Rank DMU Score Rank DMU Score
1st TMB 2.43506 12th TVD+TMB 1
2nd THT 1.86798 13th TVD 0.959
3rd MVB 1.65072 14th TVD+TC6 0.92934
4th HLC 1.56983 15th TVD+TDN 0.87388
5th TC6+TCS 1.20859 16th TDN 0.86126
6th MDC 1.20185 17th TC6+MDC 0.85962
7th TCS 1.16004 18th NBC 0.76097
8th TC6 1.13052 19th TC6+TDN 0.74546
9th TVD+NBC 1.06859 20th TVD+MVB 0.72076
10th TVD+MDC 1.06054 21st TVD+THT 0.70813
11th TVD+HLC 1.00084 22nd TVD+TCS 0.36444
13
corporation, VINACOMIN, to achieve an efficient performance as other units. Hence, these two 346
coal mines are selected as target units by the authors to propose virtual alliances. 347
348
How to improve its performance? 349
Eliminating under-performance units is necessary for sustainable development. This is more 350
important in sectors related to fossil energy such as coal mining due to its environmental impacts. 351
A strategic alliance, hence, is worth taking into account as a solution. 352
Various enterprises with different missions and visions will have different forms of alliances 353
(Nguyen & Nguyen, 2020). For example, two firms will sign a formal contract regarding equity 354
ownership; shared managerial control; cross-selling; or shared resources (Phu & Duy, 2019; 355
Nguyen & Nguyen, 2020). Chen & Chen (2002) introduced asymmetric alliances in which small 356
firms accept to invest more than a larger partner, but they expect to gain more reputable in the 357
market. 358
There are two key reasons that strategic alliance is a suitable and less costly solution. Firstly, 359
an agreement toward a correlating business goal such as developing a more effective process; shar- 360
ing the resources and risks; etc. is the foundation of strategic alliance (Kogut, 1988). The scope 361
of this study is regarded to all coal mines under operated by VINACOMIN, hence, the goal of 362
sustainable development is a key motivation in strategic alliances. In addition, setting alliances is 363
possible to implement since all units are under-controlled by VINACOMIN. 364
Secondly, the authors also consider the location of units as a key indicator in selection. Most 365
coal mines in the study are located nearby areas, hence, the process of cooperating is easy and 366
feasible. 367
The finding and recommendations in this study can be seen as a good reference for managers 368
due to the advantage of the research model. The authors made estimations based on the realistic 369
data during many consecutive years from 2016 to 2020. It is better than the only 3-year period in 370
many previous studies (Wang C. N., Nguyen, Tran, & Huong, 2015; Wang, Nguyen, & Wang, 371
2016; Nguyen & Tran, 2018 ). In addition, policymakers can apply the proposed model to evaluate 372
the performance in various fields for a common goal of sustainable development. 373 374
Declarations 375 Author Contributions: All authors contributed to the study's conception and design. Material preparation, 376 data collection, and analysis were performed by Hoang Phu Nguyen , Chia-Nan Wang, and Nhat-Luong Nhieu 377 . The first draft of the manuscript was written by Hoang Phu Nguyen and all authors commented on previous 378 versions of the manuscript. All authors read and approved the final manuscript. 379
Funding: The authors have no relevant financial or non-financial interests to disclose. 380
Data Availability Statement: The datasets generated and analyzed during the current study are available 381 from the corresponding author on reasonable request. 382
Conflicts of Interest: The authors declare no conflict of interest 383
384
References 385
Anand, B. N., & Khanna, T. (2000). Do firms learn to create value? The case of alliances. Strategic Management Journal, 21(3), 386
295-315. 387
Charnes, A., Cooper, W., & Rhodes, E. (1978). Measuring the efficiency of decision making units. . Eur. J. Oper. Res. , 2, 429– 388
444. 389
Chen, H., & Chen, T. J. (2002). Asymmetric strategic alliances: A network view. . Journal of Business Research, 55(12), 1007- 390
1013. 391
Chia Nan, W., Hoang Phu, N., & Cheng Wen, C. (2021). Environmental Efficiency Evaluation in the Top Asian Economies: An 392
Application of DEA. Mathematics. 393
Chia Nan, W., Ngoc Ai Thy, N., Hsin Pin, F., Hsien Pin, H., & Thanh Tuan, D. (2021). Efficiency Assessment of Seaport Terminal 394
Operators Using DEA Malmquist and Epsilon-Based Measure Models. Axioms, 10(48). 395
Deng. (1982). “Control Problems of Grey Systems.”. Systems & Control Letters 1, 288–294. 396
Düzakın, E., & Düzakın, H. (2007). Measuring the performance of manufacturing firms with super slacks based model of data 397
envelopment analysis: an application of 500 major industrial enterprises in Turkey. Eur. J. Oper. Res. 182 (3), 1412–1432. 398
EIA, U. (26 July 2020). Primary Coal Exports. US Energy Information Administration. 399

14
Gilliland, M. (2010). The Business Forecasting Deal: Exposing Myths, Eliminating Bad Practices, Providing Practical Solutions. 400
SAS Institute, Inc. 401
Golany, B., & Roll, Y. (1989). An application procedure for DEA. Omega , 17, 237–250. 402
Kogut, B. (1988). Joint ventures: theoretical and empirical perspectives. Strateg Manage J, 9:319 – 32. 403
Le, T.-M., Wang, C.-N., & Nguyen, H.-K. (2020). Using the optimization algorithm to evaluate and predict the business performance 404
of logistics companies–a case study in Vietnam. Applied Economics. 405
Martino, C. M. (2016). Italian Alliance for Sustainable Development. Sustainable Development Goals. 406
Minh Chuan, L. (2019). Current Status of Coal Demand and Supply in Vietnam and Plan of Vinacomin in the coming time. 407
VINACOMIN. 408
Nguyen, B. (2015). Vietnam coal potential and development orientation. APEC Coal Supply Security Tokyo, Japan. Retrieved from 409
http://www.jcoal.org.jp/ 410
Nguyen, N.-T., & Tran, T.-T. (2018). A two-stage study of grey system theory and DEA in strategic alliance: An application in 411
Vietnamese fertilizing industry. International Journal of Advanced and Applied Sciences, 73-81. 412
Nguyen, P., & Nguyen, T. (2020). Using optimization algorithms of DEA and Grey system theory in strategic partner selection: An 413
empirical study in Vietnam steel industry. Cogent Business & Management, 7(1). doi:10.1080/23311975.2020.1832810 414
Phu, N., & Duy, N. (2019). A two-stage study of grey system theory and DEA model in strategic alliance: an application in 415
Vietnamese textile and garment industry. Asian J. Management Science and Applications, 4(2), 77-98. 416
Tone, K. (2001). A slacks-based measure of efficiency in data envelopment analysis. European Journal of Operational Research, 417
130(3), 498-509. 418
UNHR. (2015). Alliance for the Sustainable Development of Central America. United Nations human rights. 419
Wang, C. N., Nguyen, N. T., Tran, T. T., & Huong, B. B. (2015). A study of the strategic alliance for EMS industry: the application 420
of a hybrid DEA and GM (1, 1) approach. The Scientific World Journal, 2015. 421
Wang, C.-N., Nguyen, X.-T., & Wang, Y.-H. (2016). Automobile Industry Strategic Alliance Partner Selection: The Application of 422
a Hybrid DEA and Grey Theory Model. Sustainability, 8, 173. 423
Zheng-fu, B., Hilary, I. I., John, L. D., Frank, O., & Sue, S. (2010). Environmental issues from coal mining and their solutions. 424
Mining Science and Technology, 20(2), 215-223. doi:10.1016/S1674-5264(09)60187-3 425
Zhou, G., Min, H., Xu, C., & Cao, Z. ( 2008). Evaluating the comparative efficiency of Chinese third-party logistics providers using 426
data envelopment analysis. Int. J. Phys. Distrib. Logist. Manag., 38, 262–279. 427
428