STRAIN LOCALIZATION IN THE UPPER CRUST AND STRESS …
115
STRAIN LOCALIZATION IN THE UPPER CRUST AND STRESS FIELD EVOLUTION ADJACENT TO THE ALPINE FAULT IN NORTHERN FIORDLAND, NEW ZEALAND A Thesis Presented by Phoebe A. Judge to The Faculty of the Graduate College of The University of Vermont In Partial Fulfillment of the Requirements for the Degree of Master of Science Specializing in Geology October, 2006
Transcript of STRAIN LOCALIZATION IN THE UPPER CRUST AND STRESS …
STRAIN LOCALIZATION IN THE UPPER CRUST AND STRESS FIELD EVOLUTION ADJACENT TO THE ALPINE FAULT
IN NORTHERN FIORDLAND, NEW ZEALAND
A Thesis Presented
by
Phoebe A. Judge
to
The Faculty of the Graduate College
of
The University of Vermont
In Partial Fulfillment of the Requirements for the Degree of Master of Science
Specializing in Geology
October, 2006

Accepted by the Faculty of the Graduate College, The University of Vermont, in partial fulfillment of the requirements for the degree of Master of Science, specializing in Geology. Thesis Examination Committee: ________________________________ Advisor Keith A. Klepeis, Ph.D.
________________________________ Thomas Neumann, Ph.D.
________________________________ Chairperson Mandar Dewoolkar, Ph.D. ________________________________ Vice President for Frances E. Carr, Ph.D. Research and Dean Of Graduate Studies Date: August 28, 2006
ii
Abstract In this thesis, I present structural, kinematic, and stress inversion data from the Darran Range in northern Fiordland, New Zealand. The ~800 km2 Darran Range has excellent exposure of faults within the upper crust, and provides an opportunity to study strain localization and fluid-induced weakening processes adjacent to the obliquely convergent Australia-Pacific plate boundary. Fault-slip data collected in the region outline several distinct zones of deformation, as well as the presence of elevated pore fluid pressure in the upper crust. Strain localization and weakening mechanisms, including elevated fluid pressure, may assist in explaining differences in deformation, such as the width of the deformation zone and the continued reactivation of major faults, near collisional plate boundaries. Kinematic solutions and stress inversions reveal spatial variations in the degree of strain localization and strike-slip partitioning adjacent to the Alpine Fault. Stress inversions of fault-slip data from major fault segments within ~10 km of the plate boundary show evidence of elevated pore fluid pressure. Geometrical and frictional constrains on the analysis of stress tensors calculated from stress inversions indicate that the coefficient of friction is extremely low (µ = 0.10) near the Alpine Fault. Compression axes are oriented ~60º from the dominantly northeasterly strike of the plate boundary, and this orientation, combined with the low coefficient of friction, suggest a weakening of the crust around the Alpine Fault Zone. Deformation within 10 km of the plate boundary is characterized by reverse, oblique-reverse, and strike-slip fault populations. At distances greater than 10 km to the southeast of the plate boundary zone, deformation is characterized by oblique-reverse and strike-slip motion on reactivated steep, brittle faults; vertical motion is predominantly localized at lithologic boundaries. This deformation results in the extrusion of wedge-shaped blocks in the Darran Range. Cross-cutting relationships and kinematic analysis indicate the superposition of stress fields in northern Fiordland, including an older phase of normal faulting from the Late Cretaceous – Early Tertiary. Descriptions of strain localization mechanisms, such as fluid-induced weakening and the partitioning of strain in different regions, improves our understanding of deformation processes at collisional plate boundaries, and how the upper crust responds to tectonic stresses. The dominant strain localization mechanism in northern Fiordland is elevated pore fluid pressure in the near-boundary deformation zone. The inherited structure of the region assists in the localization of strain along rheological and lithologic boundaries, but it is subordinate to fluid-induced weakening.

iii
Acknowledgements
I owe heart-felt thanks to many people for their help, knowledge, and support during
this project. Above all, I am extremely grateful to Keith Klepeis for being an outstanding
advisor and mentor, and for having such a thoroughly engaging project. And for
hesitantly eating silverbeets in the Milford Lodge. Many thanks also to Tom Neumann
and Mandar Dewoolkar for being part of my thesis committee.
I am indebted to the all wonderful faculty, staff, and students in the Geology
department. Tom Neumann and Adam Schoonmaker provided me with entertaining
comments and very helpful suggestions during the crucial periods when I thought neither
were available. Dan King and Rob Zimmermann were superior field “assistants.”
(‘Assistant’ does not properly evoke the help they provided, but it shall have to suffice.)
Certainly I owe thanks to Bernard Célérier, Rick Allmendinger, and Arnaud
Etchecopar for willfully serving as my adopted structure community, and answering
endless questions about stress and strain models. I am also grateful for the education and
support I received from the Geology and Physics departments at Mount Holyoke College
in preparation for graduate work, especially from Michelle Markley and Janice Hudgings.
The National Science Foundation, the UVM Geology department, and the New
Zealand Institute of Geological and Nuclear Sciences in Dunedin have given me financial
support, a job, and technical support (or some combination thereof) for the past two
years, and deserve proper recognition.
I owe thanks to all of my dear friends, in and out of Vermont, for their incredible
support when I needed it most, and for knowing when that was.
Last but not least, thanks again to my parents for just about everything else.
iv
Table of Contents Acknowledgements.......................................................................................................iii List of Tables ...............................................................................................................vii List of Figures.............................................................................................................viii Chapter I: Introduction ...............................................................................................9
1. Overview of project .................................................................................................9
2. Research methodology...........................................................................................12
2.1 Field methods ..................................................................................................12
2.2 Laboratory methods.........................................................................................13
3. Thesis outline ........................................................................................................14
Chapter II: Literature Review...................................................................................15
1. Overview of the geology and the tectonic history of Fiordland, New Zealand ........15
1.1 Tectonic & geologic history of Fiordland and the Australia-Pacific plate
boundary ...............................................................................................................15
1.2 The modern Australia-Pacific plate boundary..................................................19
1.3 The modern structure of Northern Fiordland ...................................................21
2. Transpressional tectonics ......................................................................................22
3. The role of fluid in upper crustal faulting...............................................................24
3.1 Pore fluid pressure ..........................................................................................25
3.2 Fluid infiltration and frictional weakening of crustal-scale faults ....................26
4. The application of fault-slip data to tectonic settings .............................................28
Chapter III: Strain localization in the upper crust adjacent to the tectonically active Alpine Fault Zone in Fiordland, New Zealand...........................................................34
1. Introduction..........................................................................................................35
2. Geologic history and evolution of the Australia-Pacific plate boundary.................38
v
2.1 Geology and tectonic history of Fiordland & the Australia-Pacific plate
boundary ...............................................................................................................38
2.2 Modern tectonic setting of the Alpine Fault......................................................39
3. Structure of field regions in Fiordland..................................................................41
3.1 Structure of the Darran Range and Northern Fiordland..................................41
3.1a The Hollyford Valley Fault Zone...................................................................42
3.1b The interior of the Darran Range..................................................................46
3.1c The northern margin of the Darran Range ....................................................47
3.1d The Harrison-Kaipo Fault Zone....................................................................48
3.2 Structure of the Skippers Range ......................................................................49
3.3 Structure of Doubtful Sound............................................................................52
4. Kinematics of the Darran Range...........................................................................52
4.1 Kinematic methods..........................................................................................52
4.2 Kinematic results ................................................................................................54
4.2a The Hollyford Fault Valley and the interior of the Darran Range..................54
4.2b The northern margin of the Darran Range and the Harrison-Kaipo Fault
Valley ....................................................................................................................57
4.2c Doubtful Sound .............................................................................................59
5. Stress inversion.....................................................................................................60
5.1 Methods...........................................................................................................60
5.2 Results using the geometric constraint ............................................................67
5.3 Results using the friction constraint ................................................................69
6. Discussion .............................................................................................................70
6.1 Normal faults in Fiordland .............................................................................70
6.2 The evolution of the stress field in the Darran Range .......................................72
6.3 Fluid infiltration and strain-induced weakening of the crust ...........................75
6.4 Strain localization and deformation partitioning.............................................77
7. Conclusions...........................................................................................................81

vi
Chapter IV: Discussion ..............................................................................................83
1. Overview and conclusions .....................................................................................83
2. Future work...........................................................................................................85
Bibliography ................................................................................................................87 Appendices: ............................................................................................................... 101

vii
List of Tables Table 3.1: Fault populations used for geometric constraint experiments and the principle stress axis orientations..................................................................................62
viii
List of Figures Figure 2.1: a. Tectonic setting of New Zealand and the Australia/Pacific plate boundary.......................................................................................................................................16 Figure 3.1: a. Tectonic setting of New Zealand and the Australia/Pacific plate boundary.......................................................................................................................................37 Figure 3.2: Topography, sitemap, and cross-section of the Darran Range northern Fiordland. ..................................................................................................43 Figure 3.3: Photographs, sketches, and photomicrographs from sites in the Darran Range.........................................................................................................45 Figure 3.4: a. Map of Skippers Range showing location of cross-section. .....................51 Figure 3.5: Detailed map of southern region showing normal fault slip data .................55 Figure 3.6: Detailed map of southern region showing dextral fault slip data .................57 Figure 3.7: a. Detailed map of northern region showing fault slip data (b - i) and fault- 58 Figure 3.8: Simplified geologic map of Doubtful Sound region ....................................58 Figure 3.9: Results of frictional constraint method........................................................66 Figure 3.10: Results of geometric constraint method. ...................................................68 Figure 3.11: A DEM showing the central and northern Fiordland.................................71 Figure 3.12: Equal-area lower-hemisphere stereoplot of stress and strain data from.....73 Figure 3.13: Cartoon cross-section of the plate boundary..............................................78
9
Chapter I: Introduction
1. Overview of project
Deformation at obliquely convergent plate boundaries often includes uplift,
shortening, and lateral strike-slip motion, but the dominant mechanisms that control these
features is unresolved. Strain localization processes such as elevated pore fluid pressure
or the preferential reactivation of a weak fault are important in controlling deformation
patterns (Stewart et al., 2000; Bunds, 2001; Rutter et al., 2001), but it may be difficult to
identify features related to inherited structures versus those signals related to deformation
mechanisms (Koons et al., 1998; Little et al., 2002a). Studying the development of
structures in the upper crust near obliquely convergent plate boundaries assists in the
description of large-scale processes that control deformation in these areas. The
Fiordland region of the Alpine Fault Zone in New Zealand is a zone of transpression
because it accommodates both shearing and stretching related to oblique convergence.
Additionally, the region contains excellent exposure of structures in the upper crust. A
more complete understanding of the nature of processes controlling deformation
partitioning and strain localization in regions such as Fiordland can help to refine models
that describe continental tectonics. Describing the structural evolution and crustal
strength of the Alpine Fault may generate new models and predictions for the behavior of
other plate boundary systems.
For this project, I use field-based structural observations combined with quantitative
modeling of strain and strain fields to study deformation processes in the upper crust.
Fault-slip data collected in the field allowed me to make spatial and temporal
10
observations about structures present in northern Fiordland. I then used these data to
model the kinematic compatibility of fault populations in different deformation zones,
and to model the stress fields in which fault populations can be activated. By collecting
these data and using quantitative models, I was able to answer several specific questions
about deformation and strain localization processes in the upper crust: 1) In a region of
transpression with several superposed fault populations, is there evidence of strain
partitioning within the populations? 2) Is there a specific style of structure that controls
strain localization at obliquely collisional plate boundaries? 3) What role do strain-
induced weakening processes, such as elevated pore fluid pressure or the presence of
inherited structures, have in reducing the work required to strain the crust near a plate
boundary? 4) Do fault populations in Fiordland preserve evidence of superimposed stress
fields?
There are several primary results of this study. First, I document the presence of a 10
km-wide zone of deformation adjacent to the Alpine Fault that contains fault populations
consistent with the modern stress field. Fluid infiltration and frictionally weak faults are
also characteristic of this zone. Outside of the near-boundary zone, strain is localized
along lithologic boundaries, and on steep brittle faults that are reactivated. Secondly, this
work shows the frictionally weak characteristsics of the Alpine Fault in Fiordland. The
frictionally weak faults and the moderately high angles between the plate boundary and
compression angles confirm previous descriptions of the Alpine Fault as a weak plate
boundary fault. Finally, this work describes several superimposed phases of faults
preserved in central and northern Fiordland, including phases of older extension.
11
Results of this study have both local and regional tectonic significance. Locally, this
study is significant because of its new description of the interior of the Darran Range, and
the documentation and interpretation of normal faults in Fiordland. The Darran Range is
characterized by widely-spaced (500 – 1000 m) steep dextral faults that record a
component of vertical motion. These dextral faults everywhere cut across older normal
faults in the Darran Range and elsewhere in Fiordland. Normal faults in the region
represent two phases of extension that likely occurred during the Late Cretaceous and the
Oligocene.
The regional significance of this study is its description of fluid-induced strain
localization and partitioning processes, and of the relatively weak nature of the Alpine
Fault. The existence of the near-boundary deformation zone is consistent with other
studies of strain localization and GPS surveys from the South Island of New Zealand
(Norris & Cooper, 2001; Sutherland et al., 2006). I show that it is likely that the elevated
pore fluid pressure near the plate boundary is partially responsible for the localization of
strain in the near-boundary zone. The enhanced fluid pressure in the region contributes
to the frictionally weak nature of faults in this zone, and suggests that the Alpine Fault in
northern Fiordland may be generally weak. This weakness may allow the Alpine Fault to
continue slipping for several hundreds of kilometers within a narrow fault zone. Several
studies of faults and earthquake data near the plate boundary in other sections of the
South Island (Liu & Bird, 2001; Balfour et al., 2005), which suggests that the Alpine
Fault may be a weak plate boundary fault.
12
2. Research methodology
2.1 Field methods
I completed the field-based component of this work over two field seasons in
northern Fiordland. I collected data from 8 field sites near Mount Thunder, Lake Truth,
in the central Skippers Range, from the southeast of Mount Madeline between Madeline
Creek and Catch Creek, Homer’s Tunnel, Gertrude’s Saddle, and from a prominent
roadcut between Key Summit and the Lower Hollyford Road on the Milford – Te Anau
Road (Fig. 3.2 B). Sites were selected on the basis of their proximity to mapped faults,
lithology, exposure of bedrock, and accessibility (for helicopter access). Helicopter
access to remote regions such as Mount Thunder, Lake Truth, and the Skippers Range
allowed me to spend the majority of each field season collecting data instead of traveling
to field sites.
Fieldwork at each site included the identification of lithologies and mineral
assemblages, measurement of the orientation of fault planes and fractures, and the
orientation of slip indicators such as slickenlines, grooves, mineral lineations,
chattermarks, and offset markers; and the collection of oriented samples to make thin-
sections to determine composition and kinematics on a microstructural scale. Field notes
included sketches and maps, and observations of ductile fabrics, larger patterns of
dominant fault populations, and other features that may have been site-specific.
Field sites are located on Figure 3.2 B. Fault-slip data are presented in Appendices A
and B, and are plotted on equal-area lower-hemisphere stereographic projections on
detailed maps of geographic regions in Chapter III. Descriptions and interpretations of
structural and kinematic data are discussed in detail in Chapter III.
13
2.2 Laboratory methods
I used two computer-modeling techniques for this study that invert the fault-slip data
collected in the field to determine average stress and strain axes. The first technique
involved the calculation of fault-plane solutions for fault populations using the program
FaultKin v. 4.3.5, created by R. W. Allmendinger, R. A. Marrett, & T. Cladouhos (1994;
modified 2006). This program allowed me to determine the kinematic compatibility of
populations from each field site and from field sites within a specific region. I also used
the results to compare the orientation of contraction and extension axes to compressional
(P) axes from regional earthquakes and to principle stress axes determined from stress
inversions. The method and results of this technique are fully described in Chapter III.
The second quantitative technique involved the inversion of fault-slip data using Fault
Slip Analysis (FSA) v. 28.5 created by B. Célérier (1988; modified 2006). I used this
program to model the orientation of paleostress fields using idealized fault populations
for different deformation zones. As part of this inversion method, I tested the frictional
strength of the modeled fault populations to determine the relative role of fluid pressure
or other strain-induced weakness. I describe the methods and results of this technique in
Chapter III.
I also analyzed approximately 20 thin sections of leucogabbros, mylonites, and
cataclasites using a petrographic microscope made from hand samples collected from
field sites to supplement my structural observations. The mineral assemblages in thin
sections helped to determine the composition of fluids, if present, and the conditions of

14
deformation at each field site. The primary results of the microscopy were mineralogy
and microstructural observations.
3. Thesis outline
I have organized this thesis into four chapters. Chapter I (this section) serves as an
introduction to the significance of the project and describes the main results of the thesis.
This chapter also provides an overview of the methodology I used for this study. Chapter
II is a literature review of the geology and tectonic history of the Fiordland region of New
Zealand. Chapter II also contains information on the role of fluids in deformation
processes, and on the development of fault-slip analysis techniques described in Chapter
I. Chapter III serves as the main body of this thesis, and I have structured this chapter in
the form of a manuscript intended for submission to the Geophysical Journal
International on the nature of processes controlling deformation and strain localization in
the upper crust adjacent to a tectonically active transpressional plate boundary. Because
Chapter III is intended for submission and must function independently from the
remainder of the thesis, there is some overlap in content with other chapters in the thesis.
Chapter IV is a synthesis of the main results from Chapter III and places the results in a
broader context. This section also outlines possible future work that could provide
additional depth to the findings of this study.
15
Chapter II: Literature Review
1. Overview of the geology and the tectonic history of Fiordland, New Zealand
1.1 Tectonic & geologic history of Fiordland and the Australia-Pacific plate boundary
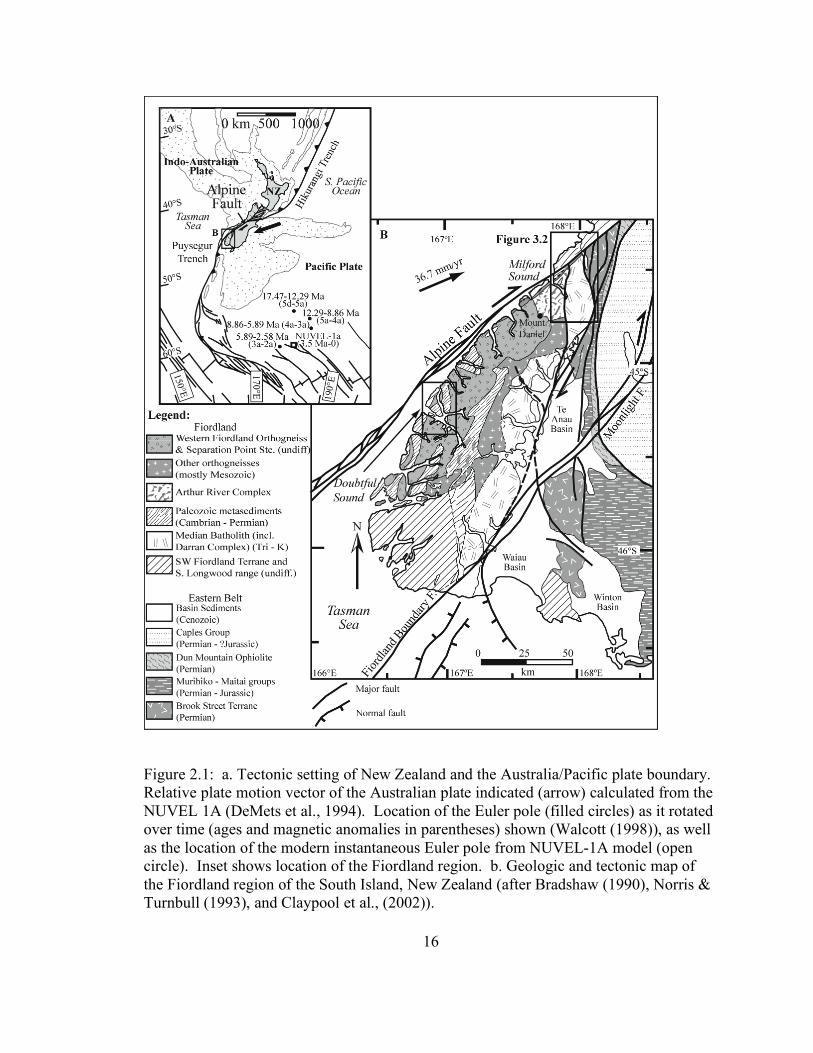
The Fiordland region of New Zealand is located on the southwest coast of the South
Island, and is composed of a variety of accreted terranes that record Paleozoic and
Mesozoic convergence (Fig. 2.1). The terranes in Fiordland are part of two major
provinces, the Western and Eastern Provinces (Bishop et al., 1985), that are on either side
of the Median Batholith (Mortimer et al., 1999a; Mortimer et al., 1999b). In the Eastern
Province, the Brook Street and Caples terranes are composed of metamorphosed
sandstones and mudstones that represent sediments and arc material from the Pacific
margin of Gondwana (Bishop et al., 1985; Mortimer et al., 1999a). The Western
Province terranes contain Early Paleozoic metasedimentary rocks intruded by Devonian-
Carboniferous plutons (Bishop et al., 1985; Mortimer et al., 1999a; Mortimer, 1999b).
In central and northern Fiordland, the Median Batholith includes the Darran Complex
(Mortimer et al., 1999a). The Median Batholith is composed largely of Middle Triassic
to Early Cretaceous intrusive units with calc-alkaline compositions that are consistent
with subduction-related arc magmatism (Mattinson et al., 1986; Gibson, 1990). The
Darran Complex in northern Fiordland has yielded Early Cretaceous ages (142 – 137 Ma)
determined from U-Pb dating of zircon (Kimbrough et al., 1994). The dominant lithology
in the Darran Range is a medium-grained biotite-rich leucogabbro that contains local rafts
of coarse-grained diorite from the Triassic Mistake Suite (Williams & Harper, 1978;
Mortimer et al., 1999a; Turnbull, 2000). The western margin of the Darran Suite is
16
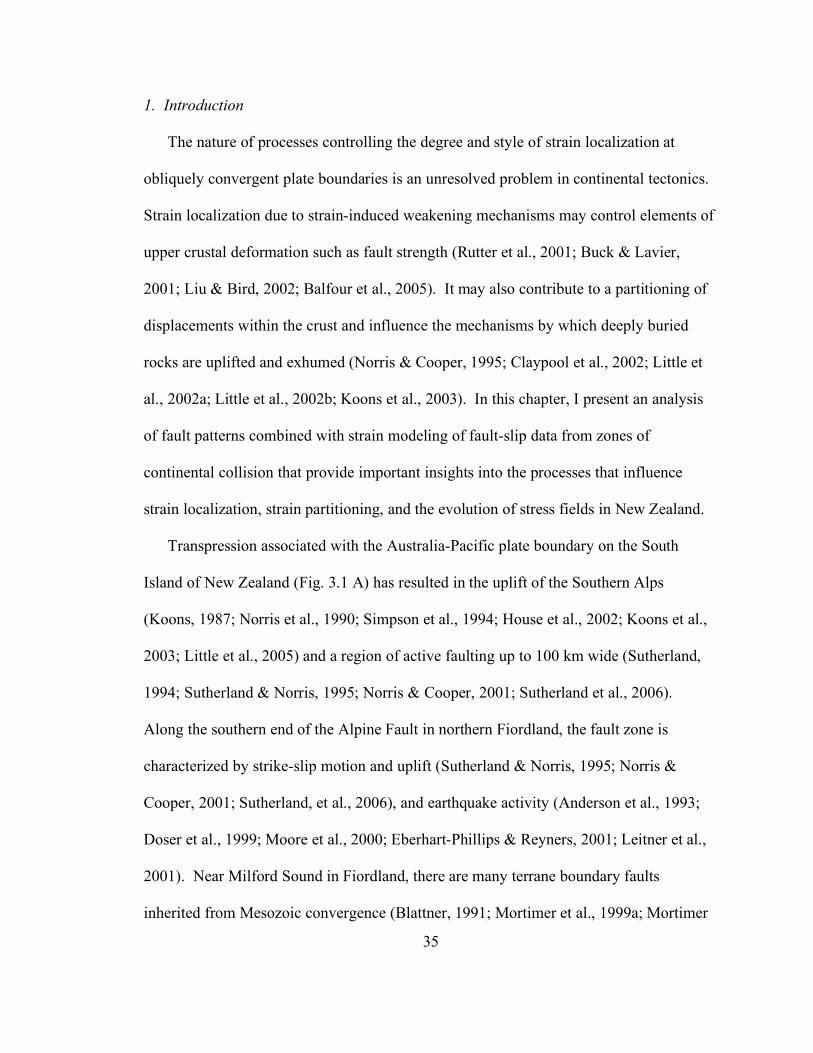
Figure 2.1: a. Tectonic setting of New Zealand and the Australia/Pacific plate boundary. Relative plate motion vector of the Australian plate indicated (arrow) calculated from the NUVEL 1A (DeMets et al., 1994). Location of the Euler pole (filled circles) as it rotated over time (ages and magnetic anomalies in parentheses) shown (Walcott (1998)), as well as the location of the modern instantaneous Euler pole from NUVEL-1A model (open circle). Inset shows location of the Fiordland region. b. Geologic and tectonic map of the Fiordland region of the South Island, New Zealand (after Bradshaw (1990), Norris & Turnbull (1993), and Claypool et al., (2002)).
17
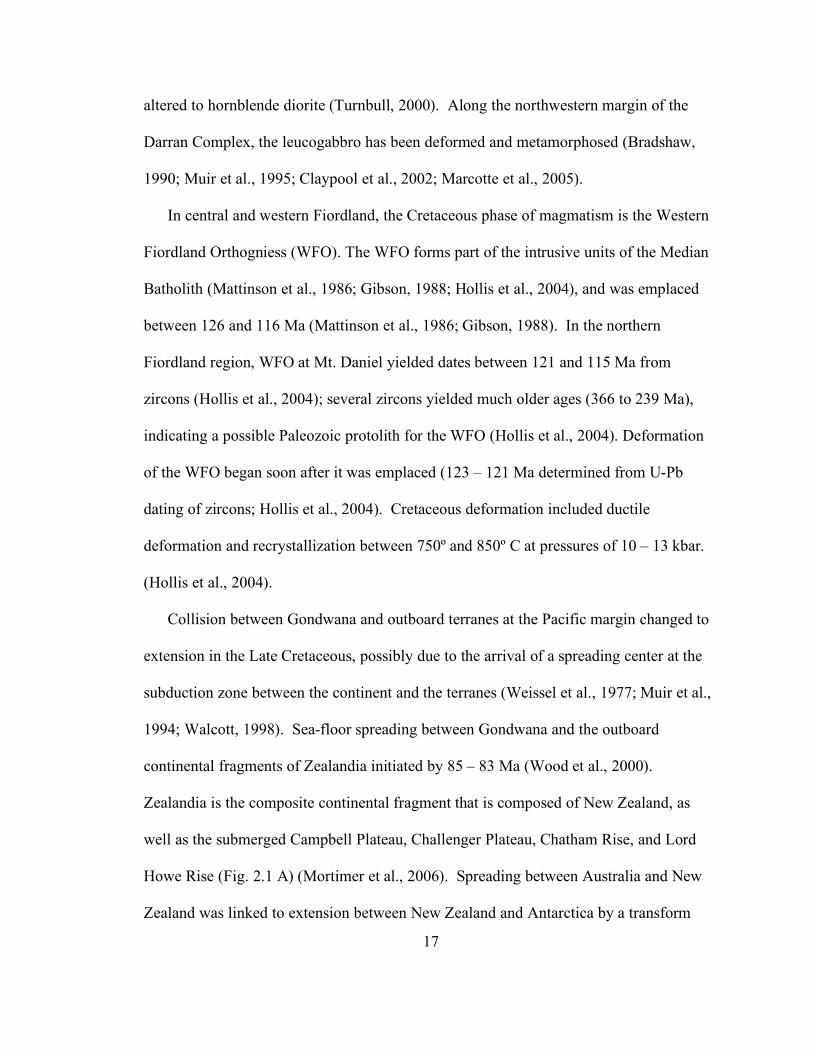
altered to hornblende diorite (Turnbull, 2000). Along the northwestern margin of the
Darran Complex, the leucogabbro has been deformed and metamorphosed (Bradshaw,
1990; Muir et al., 1995; Claypool et al., 2002; Marcotte et al., 2005).
In central and western Fiordland, the Cretaceous phase of magmatism is the Western
Fiordland Orthogniess (WFO). The WFO forms part of the intrusive units of the Median
Batholith (Mattinson et al., 1986; Gibson, 1988; Hollis et al., 2004), and was emplaced
between 126 and 116 Ma (Mattinson et al., 1986; Gibson, 1988). In the northern
Fiordland region, WFO at Mt. Daniel yielded dates between 121 and 115 Ma from
zircons (Hollis et al., 2004); several zircons yielded much older ages (366 to 239 Ma),
indicating a possible Paleozoic protolith for the WFO (Hollis et al., 2004). Deformation
of the WFO began soon after it was emplaced (123 – 121 Ma determined from U-Pb
dating of zircons; Hollis et al., 2004). Cretaceous deformation included ductile
deformation and recrystallization between 750º and 850º C at pressures of 10 – 13 kbar.
(Hollis et al., 2004).
Collision between Gondwana and outboard terranes at the Pacific margin changed to
extension in the Late Cretaceous, possibly due to the arrival of a spreading center at the
subduction zone between the continent and the terranes (Weissel et al., 1977; Muir et al.,
1994; Walcott, 1998). Sea-floor spreading between Gondwana and the outboard
continental fragments of Zealandia initiated by 85 – 83 Ma (Wood et al., 2000).
Zealandia is the composite continental fragment that is composed of New Zealand, as
well as the submerged Campbell Plateau, Challenger Plateau, Chatham Rise, and Lord
Howe Rise (Fig. 2.1 A) (Mortimer et al., 2006). Spreading between Australia and New
Zealand was linked to extension between New Zealand and Antarctica by a transform
18
fault along the margin of the Campbell Plateau (Wood et al., 2000). Extension along the
Tasman Sea ridge initiated the opening of the Tasman Sea by 80 Ma (Wood et al., 2000).
Extension associated with rifting led to wide-spread normal faulting in New Zealand in
the Late Cretaceous, and the creation of large sedimentary basins on the continental
margins and within Zealandia (Bishop & Laird, 1976; Tulloch & Kimbrough, 1989;
Bishop, 1992; Laird, 1993; Norris & Turnbull, 1993; Barnes et al., 2005). Spreading
along the Tasman Sea ridge ceased by ~75 Ma (Walcott, 1998; Wood et al., 2000), and
this termination marked a change in the relative motion between the Australia and Pacific
plates (Gaina et al., 1998). Sea-floor spreading continued along the ridge in the South
Tasman Sea, leading to the separation of New Zealand from Antarctica by 45 – 40 Ma
(Weissel et al., 1977; Wood et al., 2000).
The Euler pole of rotation between the Pacific and Australian plates began to migrate
southward at approximately 30 Ma, leading to oblique right-lateral motion along the
Pacific-Australia plate boundary (Lamarche et al., 1997; Wood et al., 2000). As the
Euler pole continued to migrate, motion across the plate boundary became increasingly
oblique until ~20 Ma, when movement along the plate boundary became entirely right-
lateral (Sutherland, 1995a; Walcott, 1998). Further rotation (Walcott, 1998) of the Euler
pole (Fig. 2.1 A) continued as subduction of the Australian plate initiated beneath the
southern margin of New Zealand by approximately 10 Ma (Lamarche et al., 1997).
Oblique convergence along the Australia-Pacific plate boundary began within the past 5
m.y. due to an increase in the obliquity of motion across the plate boundary (Walcott,
1998). The increase in oblique movement led to the onset of uplift and transpressional

19
deformation along the plate boundary (Walcott, 1998). The Euler pole has not shifted
significantly since transpression stabilized at ~5 Ma (Sutherland, 1995a; Walcott, 1998).
1.2 The modern Australia-Pacific plate boundary
New Zealand is an exposed fragment of Zealandia, which is the micro-continent that
has been sutured together and uplifted by transpressional movement across the Australia-
Pacific plate boundary. In the south and central regions of the South Island, the plate
boundary is represented by the Alpine Fault Zone, where it is a linear feature that strikes
050º - 055º (Fig. 2.1 A). The current relative plate motion velocity vector at Milford
Sound is 36 ± 3 mm/yr toward a bearing of 067 ±2º (for latitude, longitude: 44º 30’ S,
168º E from NUVEL 1A model of DeMets et al., 1994). This motion may be resolved
into 23 ± 2 mm/yr of Alpine Fault-parallel dextral strike-slip motion, 12 ± 4 mm/yr of
horizontal motion accommodated by clockwise rotation of crustal blocks and oblique
motion, and 5 ± 3 mm/yr of throw on reverse faults at the margins of the plate boundary
(Sutherland et al., 2006).
GPS surveys indicate that 65% - 75% of the fault-parallel plate motion is
accommodated on the Alpine Fault, and more than 60% of the strain along the fault is
concentrated within ~20 km of the fault zone (Norris & Cooper, 2001). Metamorphic
mineral assemblages indicate that amphibolite facies deformation occurred at depths of
15 – 25 km (Grapes & Watanbe, 1992). Ages determined from K-Ar dating of micas in
Alpine schists (Adams, 1981) and from fission track dates of zircon (Tippett & Kamp,
1993) are very young (1 – 5 Ma). The very young ages of the Alpine schists combined
with the mid-crustal depths of metamorphism indicate rapid exhumation of Alpine fault-
20
related rocks associated with transpression (Koons et al., 2003). Sutherland et al. (2006)
suggest that uplift on reverse faults may be associated with a crustal detachment fault or
distributed shortening of the lithosphere at depth.
The orientation and sense of motion of the Alpine Fault changes across the South
Island as the geometry of the plate boundary changes. Near Milford Sound on the west
coast, the Alpine Fault is subvertical to very steeply southeast-dipping with strike-slip
striae (Norris & Cooper, 1995; Norris & Cooper, 2001). In the center of the South Island,
the Alpine Fault is composed of dominantly strike-slip faults that are linked by segments
of oblique-thrust movement (Norris et al., 1990; Norris & Cooper, 1995; Little et al.,
2002a). In the northeastern section of the South Island, the surface expression of the
plate boundary is the 100 km wide Marlborough fault zone that contains many fault
traces with predominantly strike-slip motion (Anderson et al., 1993). The Alpine Fault
links the westward-verging subduction of the Pacific plate in the Hikurangi Trench north
of the South Island (Reyners & McGinty, 1999; McGinty et al., 2000; Eberhart-Phillips
& Chadwick, 2002) to the eastward-verging subduction of the Australian plate beneath
southern Fiordland and in the Puysegur Trench off the southwestern coast of the South
Island (Eberhart-Phillips & Reyners, 2001; Reyners et al., 2002).
In the central and southern regions of the South Island, the Alpine Fault is interpreted
to have a narrow and subvertical Benioff zone (Reyners, 1989), and has had little seismic
activity during the past 150 years greater than Mw ≥ 5 (Anderson et al., 1993; Eberhart-
Phillips & Reyners, 2001). The Benioff zone is the region in the Earth’s crust at plate
boundaries that is seismically active and interpreted to represent the geometry of the
boundary region. In the central Fiordland region, ML ≈ 4 have been recorded deeper than
21
~130 km (Reyners et al., 2002). South of Milford Sound, the Alpine Fault continues off-
shore, and seismicity occurs in a broad zone across the branching plate boundary (Moore
et al., 2000; Eberhart-Phillips & Reyners, 2001). Earthquakes along the Australia-Pacific
plate boundary and the Alpine Fault represent the modern stress field in the region (e.g.
Ghisetti, 2000). P-axis azimuths calculated from the focal mechanisms of oblique- and
reverse-sense earthquakes from the region are oriented 50º - 65º from the plate boundary
(Anderson et al., 1993; Moore et al., 2000). These P-axes suggest that the current stress
field in the Fiordland region is relatively homogenous, and that the compressional
component is oriented at a moderately high angle to the Alpine Fault.
1.3 The modern structure of Northern Fiordland
The Milford Sound region of northern Fiordland (Fig. 2.1 B) is composed primarily
of high-grade gneisses, the Median Batholith (shown on Fig. 2.1 B), and
metasedimentary and volcaniclastic rocks within the Brook Street Terrane (Mortimer et
al, 1999b). These units are separated by several large terrane boundary faults and shear
zones (Blattner, 1991; Hill, 1995; Mortimer et al., 1999b; Turnbull, 2000). The Glade-
Darran Fault forms the eastern boundary between the Darran Complex and the Brook
Street Terrane (Blattner, 1991; Sutherland, 1995b; Mortimer, 1999b). The Hollyford
Fault separates the Brook Street Terrane from the Maitai Terrane to the east (Turnbull,
2000). Both of these faults merge in the Hollyford Valley fault zone to the east of the
Darran Complex, and may be active due to aseismic slip (Sutherland, 1995b). The
Harrison-Kaipo Fault zone forms the northwestern margin of the Darran Range to the

22
north of Milford Sound (Fig. 2.1 B), and has Tertiary dextral oblique-reverse motion
(Claypool et al., 2002).
The Harrison-Kaipo Fault zone forms the boundary between the Darran Complex and
the Milford and Harrison gneisses (Claypool et al., 2002). This fault zone contains
several generations of lineations and foliations related to Early Cretaceous shortening
(Daczko et al., 2001) and Tertiary shear zone deformation (Claypool et al., 2002). Upper
greenschist facies Tertiary deformation consists of mylonitic foliations and mineral
lineations, as well as upright isoclinal folds (Claypool et al., 2002).
2. Transpressional tectonics
The term ‘transpression’ describes deformation in zones of oblique convergence
(Harland, 1971). Harland (1971) originally characterized transpression in Norway as a
zone of shearing and stretching between steep, parallel faults that do not show vertical
displacement. Sanderson & Marchini (1984) expanded the definition to include
deformation zones of oblique convergence with lateral confinement and constant volume.
This generalized description allowed Sanderson & Marchini (1984) to model the strain
ellipsoid for both transpression and transtension, as well as make predictions for the
physical effects due to fault bends and terminations. The surface expression of
transpression includes thickening and uplift, and flower structures in the deformation
zone.
Fossen & Tikoff (1993) modified this model to include progressive deformation for
both transtension and transpression. The new model combined pure and simple shearing
to generate different strain paths, as well as a description of the shape of the strain
23
ellipsoid. Fossen & Tikoff (1993) also make predictions for the physical deformation of
passive markers in zones of transpression, which include flattening and the development
of planar fabrics. Tikoff & Teyssier (1994) further refined the transpression model to
consider the role of frictional strength of plate boundary faults and the relative orientation
of the plate motion vector. By applying their model to Sumatra and central California,
Tikoff & Teyssier (1994) were able to test the role of strain partitioning and the
orientation of the principle stress axes. Tikoff & Teyssier (1994) characterized distinct
plate boundary conditions and related the transcurrent and contractional components of
motion to deformation style.
Teyssier et al. (1995) again expanded the previous model to include parameters such
as the degree of kinematic partitioning, the orientation of instantaneous strain axes, and
the relative direction of plate motion along the San Andreas Fault in California and the
Alpine Fault in New Zealand. Teyssier et al. (1995) were able to quantify a relationship
between the degree of strike-slip partitioning and the orientation of the instantaneous
strain axes relative to the direction of plate motion. In transpressional regimes, none of
the instantaneous strain axes is parallel to the direction of plate motion, but the axes are
instead rotated toward the translation component of motion (Sanderson & Marchini,
1984; Teyssier et al., 1995; Fossen & Tikoff, 1998).
Recent expansion of the transpressional model has worked to overcome limitations
due to the original specific boundary conditions (Sanderson & Marchini, 1984).
Transpression has been expanded to include not only vertical extrusion, but also the
lateral extrusion of material (Jones et al., 1997). This expansion accounts transpression
zones that are not strictly wrench- or pure shear-dominated (Fossen & Tikoff, 1993), and
24
also allows for a wider variety of orientations in fabrics in a transpressional zone (Czeck
& Hudleston, 2004). New models also include inclined transpressional zones (Jones et
al., 2004) that describe such features as triclinic strain and asymmetrical structures, the
development of foliation that is not parallel to the transpression boundaries, and the
partitioning of strain into strike-slip and down-dip components (Jones et al., 2004).
Many plate boundaries are now described as transpressional (Bunds, 2001; Paterson
et al., 2002; Malservisi et al., 2003; West & Roden-Tice, 2003; Cunningham, 2005), but
the phrase is commonly used to describe obliquely convergent plate motion rather than
strictly a deformation style. However, the Alpine Fault in New Zealand is an example of
a plate boundary that is used to typify transpression (Norris & Cooper, 1995; Teyssier et
al., 1995; Koons et al., 2003) due to the obliquely convergent plate motion between the
Australian and Pacific plates, the steep plate boundary (Reyners, 1989), and uplift
(Gerbault et al., 2002; Malservisi et al., 2003).
3. The role of fluid in upper crustal faulting
Pore fluid pressure at various levels in the crust is the result of water released
from pore spaces in sediments buried and lithified, or from dehydration during
metamorphism (Hubbert & Rubey, 1959; Stern et al., 2001). As fluids move through the
crust, they tend to weaken the response of the host material to imposed stresses (Hubbert
& Rubey, 1959; Zoback et al., 1987; Byerlee, 1990; Byerlee, 1992; Rutter et al., 2001).
Consequently, fluids play an important role in localizing strain in deformation zones, and
in allowing faults to slip that are otherwise not optimally oriented to accommodate stress
(Hubbert & Rubey, 1959; Sibson, 1985; Byerlee, 1992). In this section, I review of the

25
role of fluids in frictional weakening, and then describe several significant examples of
crustal-scale transform faults weakened due to elevated pore fluid pressure.
3.1 Pore fluid pressure
Elevated pore fluid pressure influences the amount of shear stress required for the
formation and failure of faults in the crust. Coulomb’s (1776) law of failure describes the
relationship between the critical stress required for brittle failure (σc), the cohesive
strength of a material (σo), the angle of internal friction (ϕ), and the normal stress (σN) on
a fault as:
σc = σo + tan ϕ • (σN). (2.1)
Failure occurs according to Coulomb’s rule as long as the normal force is the only
compressive force acting on the material. Hubbert & Rubey (1959) first modified this
equation to quantify the effects of pore fluid pressure in a system by changing the
compressive force to include fluid pressure, (Pf):
σc = σo + tan ϕ • (σN - Pf). (2.2)
Subtracting pore fluid pressure from the normal stress (σN - Pf) yields a new term, σ∗,
which is the effective stress on the fault (Hubbert & Rubey, 1959):
σc = σo + tan ϕ • (σ∗N), (2.3)
where σ∗N is the effective normal stress. The effective stress term allows for significant
variation in the critical stress a particular fault may require for failure. Depending on the
fluid pressure, a fault could experience an effective confining stress as high as lithostatic
(i.e. no fluid pressure) to almost no confining stress (i.e. fluid pressure is close to
lithostatic pressure).

26
Hubbert & Rubey (1959) also introduced the fluid pressure ratio (λ) to describe the
relationship between pore fluid pressure and lithostatic pressure (Pl):
λ = (Pf) / (Pl) = (Pf) / (ρr g h), (2.4)
where ρr is the density of the overlying rock type, g is the acceleration due to gravity, and
h is the height of the column of rock above the fault. The fluid pressure ratio ranges from
λ = 0.37 to 0.47 in hydrostatic conditions with non-elevated pore fluid pressure (Suppe,
1985), up to λ = 0.50 to 0.90 for abnormal or elevated pore fluid pressure (Suppe, 1985).
At abnormal values of pore fluid pressure, the effective confining stress for faults can be
extremely low.
In most intracontinental and nonorogenic upper crustal conditions, pore fluid pressure
is thought to be hydrostatic (Hubbert & Rubey, 1959; Byerlee, 1990). Using the KTB
deep drill hole in Germany, Grawinkel & Stöchkert (1997) measured the expected
hydrostatic pore fluid conditions in the crust up to 9 km in depth in a nonorogenic setting.
However, Simpson (2001) used numerical models to demonstrate that elevated pore fluid
pressure can reduce the strength of rocks in the upper crust by as much as 60% in
compressional environments. Byerlee (1992) showed that the pore fluid pressure may be
as high as 85% of lithostatic pressure on some segments of the San Andreas Fault in
central California. Additionally, Stanislavsky & Garven (2002) modeled the failure of
thrust faults due to pore fluid pressure elevated to near lithostatic values at depths >3 km.
3.2 Fluid infiltration and frictional weakening of crustal-scale faults
Weak crustal-scale strike-slip faults may play an important role in focusing strain in
an otherwise strong upper crust (Byerlee, 1990; Grawinkel & Stöckhert, 1997).
27
Intraplate upper crustal rocks are strong and slip on optimally oriented faults with a
coefficient of friction (µ) of µ = 0.6 – 0.7 (Brudy et al., 1997; Grawinkel & Stöckhert,
1997). The coefficient of friction is equal to the tangent of the angle of internal friction
(ϕ) (Eq. 2.1). If interplate strike-slip faults are weak (µ = 0.1 – 0.2), movement may be
preferentially focused on these large faults (Provost & Chéry, 2006). Weak crustal-scale
faults may facilitate continued slip on interplate transform faults, even if they are not
optimally oriented for slip in a stress field.
The San Andreas Fault in central California is an example of a crustal-scale strike-
slip fault that is described as extremely weak with fluid pressure ratio values of λ = 0.85
or higher (Zoback et al., 1987; Byerlee, 1992; Zoback & Healy, 1992). The orientation
of maximum horizontal compression is at very high angles (~85º) to the main fault
(Mount & Suppe, 1987; Zoback et al., 1987; Provost & Houston, 2001; Townend &
Zoback, 2004), and there is low heat flow associated with the fault (Lachenbruch & Sass,
1980; Lachenbruch & McGarr, 1990; Lachenbruch & Sass, 1992). Both of these features
are interpreted to indicate the weak nature of the fault (Zoback et al., 1987; Byerlee,
1992; Provost & Houston, 2001; Hickman & Zoback, 2004; Townend & Zoback, 2004).
Both frictional weakening due to fault gouge minerals (Townend & Zoback, 2001;
Holdsworth, 2004) and increased pore fluid pressure (Zoback et al., 1987; Byerlee, 1990;
Byerlee, 1992; Rice, 1992) have been invoked to explain the weakness of the fault.
While there has been some reinterpretation of the data used to describe the San Andreas
Fault as weak (Scholz, 2000a; Scholz, 2000b), the fault is still widely interpreted to be
weak at least partially due to elevated pore fluid pressure (Zoback, 2000; Holdsworth,
2004; Provost & Chéry, 2006).
28
There are several other crustal-scale faults that are described as “weakened” due to
elevated pore fluid pressure. The Great Glen fault in Scotland is interpreted as a fluid-
weakened fault (Stewart et al., 2000) due to foliated cataclastic rocks and hydrous
mineral phases in the fault zone. The Castle Mountain strike-slip fault in Alaska is also
an example of a crustal-scale fault that has evidence of progressive weakening due to
elevated pore fluid pressure and the growth of a clay-rich fault gouge (Bunds, 2001).
Additionally, Srivastava & Sahay (2003) recently identified the Great Boundary fault in
northwestern India as a fault that has likely been reactivated as a thrust fault several times
due to elevated pore fluid pressure. The fault zone shows pervasive fluid inclusions,
which Srivastava & Sahay (2003) interpret as fluid-assisted weakening during
reactivation.
Recent work on pore fluids and seismic-wave behavior beneath the Southern Alps in
New Zealand (Koons et al., 1998; Stern et al., 2001) indicates that the Alpine Fault may
be another active weak plate boundary fault. Liu & Bird (2002) used modeling of faults
in central New Zealand to calculate an extremely low coefficient of friction of µ = 0.17.
Paleostress and shear-wave splitting work (Balfour et al., 2005) indicate a fluid pressure
ratio of λ = 0.7 for regions near the Alpine Fault. These values are similar to those from
the central region of the San Andreas Fault, and suggest that pore fluid pressure may have
an effect on the frictional strength of the Alpine Fault Zone.
4. The application of fault-slip data to tectonic settings
The use of fault-slip data to describe a stress tensor circumvents a common problem
in structural geology: it is not possible to directly measure the orientation and magnitude
29
of a stress field acting upon the Earth’s crust (Twiss & Unruh, 1998). Instead, one may
measure deformation features, such as fractures and faults or borehole break-outs created
within a stress field, and then calculate the orientation of the stress axes from the fault
data. Stress inversion of fault-slip data was first proposed by Wallace (1951), and has
since been modified and expanded by numerous workers including, Bott (1959), Angelier
(1979) and many coworkers (see Angelier (1994) for a detailed summary), Michael
(1984), Célérier (1988), Gephart (1990), and Zoback (1989; 1992). Gephart & Forsyth
(1984) and Michael (1987) have also developed stress inversion methods using
earthquake focal mechanisms, and the mechanism of Abers & Gephart (2001) relies on
first motion data from earthquakes. I do not address earthquake data specifically because
the methods do not rely on fault-slip data, and are therefore not directly comparable to the
kinematic analysis of fault-slip data. Focal mechanism inversion is a useful method (e.g.
Balfour, 2005), but is not applicable to this work due to its focus on fault-slip data.
The direct inversion method described by Angelier (1979) is a common technique and
is based on the graphical inversion method of Angelier & Mechler (1977). Graphical
inversion relies on the assumption that all faults in a population moved independently due
to one maximum stress direction. Graphical inversion involves calculating and plotting
the orientation of the maximum and minimum stress axes for each fault and averages
their orientation (Angelier & Mechler, 1977). However, this method does not uniquely
constrain the orientation or magnitude of the stress axes. Angelier & Goguel (1978)
modified the graphical inversion method to calculate the orientation of the stress axes via
direct inversion. Direct inversion relies on a least-squares minimization of the tangential
stress perpendicular to the measured slickenline (Angelier, 1979) to determine the

30
orientation of the principal stress axes. Célérier (1988) used the modified Monte Carlo
search technique of Etchecopar et al. (1981) to further refine the stress inversion method
described by McKenzie (1969) and Angelier (1979). Célérier (1988) also added a
frictional constraint to this technique to restrict possible stress tensors by considering the
effect of sliding friction.
Direct stress inversion methods yield a reduced stress tensor composed of 4 values:
the orientation of the three principle stresses (σ1, σ2, σ3), and the ratio of their
magnitudes, δ (Angelier, 1975). The ratio has values of 0 ≤ δ ≤ 1, and is described by the
following:
δ = (σ1 – σ2) / (σ1 – σ3). (2.5)
For this term, δ = 0 represents an oblate stress ellipsoid, and δ = 1 represents a prolate
stress ellipsoid. It is not possible to calculate the absolute magnitude of the principle
stresses based on direction inversion methods, only their relative ratio. However,
Célérier (1988) indicates that a wide range of fault planes requires a high relative value of
σ1 to activate the variety of orientations than do clustered fault-slip data.
Each stress inversion method relies on independent mathematical techniques, but all
of the inversion methods rely on several similar assumptions about the nature of the
material and the stress tensor being modeled. The first assumption is that the material in
question is homogenous, and that the material responds homogenously to the applied
stress. Secondly, these methods assume that the direction of resolved shear stress on a
fault plane is parallel to the direction of applied stress. Stress inversion methods also
assume that all faults used correspond to a single tectonic event. Finally, stress inversion
methods require the assumption that only faults in a range of optimal angles (βopt) will be
31
activated (βopt = 22.5º - 30º) (Wallace, 1951; Angelier, 1979; Sibson, 1985; Célérier,
1988). The validity of these assumptions is widely invoked, and is not frequently
addressed. Twiss & Unruh (1998) and Gapais et al (2000) summarize and discuss these
assumptions, and express significant concerns about their reliability.
Lisle & Srivastava (2004) attempted to test two assumptions made by stress inversion
methods. The first assumption is that slip occurs parallel to the direction of resolved
shear stress on a plane of preëxisting weakness (Wallace, 1951; Bott, 1959). The second
assumption is that only faults in the range of optimal orientations with respect to the
stress field will be activated. By comparing a survey of published fault-slip data to the
predicted orientations of fault-slip data, Lisle & Srivastava (2004) showed that fault striae
from natural data are consistent with predicted striae for a stress tensor, in good
agreement with the first assumption. The study also showed that the magnitude of
friction on a fault plane controls the activity of a fault, also in good agreement with the
second assumption.
The kinematic analysis of fault-slip data requires several assumptions about strain.
Similar to the assumption made by stress inversion methods, kinematic analysis involves
the assumption that the direction of motion preserved on a fault plane is parallel to the
slip vector. Several kinematic analysis techniques, such as the method used by the
program FaultKin (Allmendinger et al., 1994; modified 2006), also require that the
maximum and minimum instantaneous strain axes lie in a plane that is perpendicular to
the fault plane, and that these axes are both 45º from the fault plane. However, the
second requirement does not involve any interpretation of the data (Marrett &

32
Allmendinger, 1990), and is essentially the calculation of a fault plane solution from the
fault-slip data.
Kinematic analysis uses sense of displacement on a fault surface to calculate the
orientation of instantaneous strain axes (Marrett & Allmendinger, 1990; Twiss & Unruh,
1998). Displacement on a fault surface is one way a material accommodates incremental
deformation. This accommodation represents the straining of a material. Therefore,
kinematic analysis uses incremental strain markers (fault-slip data) to model
instantaneous strain. Using incremental strain to describe instantaneous strain requires
fewer assumptions than using incremental strain to describe stress. For instance, the
assumption of stress inversion methods that a fault will not fail if it is not in the optimal
orientation is only valid for hydrostatic conditions (Byerlee, 1992). This is not a useful
assumption for faults in regions of elevated pore fluid pressure (see Sections 3.1 and 3.2).
The models and solutions provided by stress inversion and kinematic analysis contain
different data, and are useful for describing stress and strain on different scales.
Kinematic analysis of fault-slip data provides strain models that rely on fewer
assumptions than stress inversion methods, but the results also provide simpler models.
Kinematic analysis is best applied to modeling the local strain rate, and is therefore most
useful for describing local features and processes (Twiss & Unruh, 1998). Using fault-
slip data to model stress through direct inversion methods relies on the additional
assumption that the modeled material responds to stress in an isotropic or homogenous
manner. Stress inversion results have the potential to describe regional stress fields, but
are hampered by assumptions about the Earth’s crust (Twiss & Unruh, 1998). While
Lisle & Srivastava (2004) have shown that assumptions about reactivation potential and
33
the orientation of resolved shear stress are robust, they do not test assumptions about the
strength and isotropy of the crust.
For this study, using the stress inversion program, Fault Slip Analysis (FSA) provided
by Célérier (2006) was most useful for describing the frictional conditions required to
activate segments of major faults. These frictional experiments provided results that are
distinct from any results possible using kinematic analysis, and were useful for describing
the relatively weak nature of the crust near the Alpine Fault. Results provided by FSA
experiments using the geometric constraint alone provide models similar to those
generated by the kinematic analysis, but are subject to crustal isotropy assumptions.
Stress inversion results derived from earthquake focal mechanisms such as those of
Gephart & Forsyth (1984) and Michael (1987), or from earthquake first motion data
(Abers & Gephart, 2001), may provide more robust results because they do notrely on the
assumptions related to using fault-slip data.
The results of kinematic analysis using FaultKin v. 4.3.5 (Allmendinger et al., 1994;
modified, 2006) provide a local result, and therefore, a more limited model than those of
stress inversion methods. However, this method of kinematic analysis relies on fewer
assumptions than direct inversion, and uses strain measurements to model average
displacement patterns in the upper crust. Additionally, the technical benefits of this
method include the ability to weight the significance of each fault-slip datum, and grade
the reliability of the fault-slip data. Many direct inversion methods using fault-slip data,
including FSA, do not have this flexibility.
34
Chapter III: Strain localization in the upper crust adjacent to the tectonically active Alpine Fault Zone in Fiordland, New Zealand
Abstract Structural observations and analysis of fault-slip data from a ~800 km2 region of the Darran Range in northern Fiordland, New Zealand, reveal spatial variations in strain localization and the occurrence of strike-slip partitioning adjacent to the Alpine Fault. Geometrical and frictional constraints on the analysis of stress inversion results from fault-slip data indicate that the coefficient of friction is extremely low (µ = 0.10) for major fault segments within ~10 km of the Australia-Pacific plate boundary. Compression axes are oriented ~60º from the dominantly northeasterly strike of the Alpine Fault. The large angle between the compression axes and the plate boundary, combined with the low coefficient of friction, suggest a weakening of the crust around the Alpine Fault Zone. Deformation within 10 km of the plate boundary is characterized by reverse, oblique-reverse, and strike-slip fault populations. Away from the plate boundary, deformation is characterized by oblique-reverse and strike-slip motion on reactivated steep faults; vertical motion is predominantly localized along lithologic boundaries. This deformation results in the extrusion of wedge-shaped blocks that make up the Darran Range. Cross-cutting relationships and kinematic analysis indicate a superposition of distinct stress fields in northern Fiordland, including an older phase of normal faulting from the Late Cretaceous – Early Tertiary. We suggest that the dominant strain localization mechanism in the upper crust in northern Fiordland is elevated pore fluid pressure in the near-boundary deformation zone. Manuscript in preparation for submission to Geophysical Journal International
35
1. Introduction
The nature of processes controlling the degree and style of strain localization at
obliquely convergent plate boundaries is an unresolved problem in continental tectonics.
Strain localization due to strain-induced weakening mechanisms may control elements of
upper crustal deformation such as fault strength (Rutter et al., 2001; Buck & Lavier,
2001; Liu & Bird, 2002; Balfour et al., 2005). It may also contribute to a partitioning of
displacements within the crust and influence the mechanisms by which deeply buried
rocks are uplifted and exhumed (Norris & Cooper, 1995; Claypool et al., 2002; Little et
al., 2002a; Little et al., 2002b; Koons et al., 2003). In this chapter, I present an analysis
of fault patterns combined with strain modeling of fault-slip data from zones of
continental collision that provide important insights into the processes that influence
strain localization, strain partitioning, and the evolution of stress fields in New Zealand.
Transpression associated with the Australia-Pacific plate boundary on the South
Island of New Zealand (Fig. 3.1 A) has resulted in the uplift of the Southern Alps
(Koons, 1987; Norris et al., 1990; Simpson et al., 1994; House et al., 2002; Koons et al.,
2003; Little et al., 2005) and a region of active faulting up to 100 km wide (Sutherland,
1994; Sutherland & Norris, 1995; Norris & Cooper, 2001; Sutherland et al., 2006).
Along the southern end of the Alpine Fault in northern Fiordland, the fault zone is
characterized by strike-slip motion and uplift (Sutherland & Norris, 1995; Norris &
Cooper, 2001; Sutherland, et al., 2006), and earthquake activity (Anderson et al., 1993;
Doser et al., 1999; Moore et al., 2000; Eberhart-Phillips & Reyners, 2001; Leitner et al.,
2001). Near Milford Sound in Fiordland, there are many terrane boundary faults
inherited from Mesozoic convergence (Blattner, 1991; Mortimer et al., 1999a; Mortimer
36
et al., 1999b) that may be reactivated as splays off of the Alpine Fault. The inherited
lithologic boundaries and deformation structures (Norris et al., 1990; Mortimer et al.,
1999b; Sutherland et al., 2000; Claypool et al., 2002; Marcotte et al., 2005) may localize
strain in northern Fiordland.
In this paper, we describe kinematic and field-based structural data that indicate the
extent of strain partitioning in the shallow crust from the ~20 x 40 km Darran Range in
northern Fiordland (Fig. 3.1 B). Fault-slip data from 11 sites in the region, combined
with kinematic data and stress inversions, show different deformation styles at increasing
distance from the plate boundary. We document a near-boundary deformation zone that
is confined with within ~10 km of the plate boundary, and is structurally and
kinematically distinct from regions farther to the southeast of the Alpine Fault. The uplift
and deformation styles that are present in northern Fiordland indicate that the Darran
Range is dissected by numerous strike-slip and oblique-slip faults that result in the
vertical extrusion of fault-bound wedges. Finally, consistent cross-cutting relationships
between fault populations indicate the superposition of paleostress fields in the Darran
Range, including the presence of an early extensional regime that most likely reflects
both Late Cretaceous and early Tertiary normal faulting.
37
Figure 3.1: a. Tectonic setting of New Zealand and the Australia/Pacific plate boundary. Relative plate motion vector of the Australian plate indicated (arrow) calculated from the NUVEL 1A (DeMets et al., 1994). The location of the Euler pole (filled circles) as it migrated over time (ages and magnetic anomalies in parentheses) shown (after Walcott (1998)), as well as the location of the modern instantaneous Euler pole from NUVEL-1A model (open circle). Inset shows location of the Fiordland region. b. Geologic and tectonic map of the Fiordland region of the South Island, New Zealand (after Bradshaw (1990), Norris & Turnbull (1993), and Claypool et al., (2002)).
38
2. Geologic history and evolution of the Australia-Pacific plate boundary
2.1 Geology and tectonic history of Fiordland & the Australia-Pacific plate boundary
The Mesozoic and Tertiary tectonic history of northern Fiordland includes the Early
Cretaceous collision of successive terranes onto the southeastern margin of Gondwana
(Howell, 1980; Mackinnon, 1983; Bradshaw, 1989; Gibson, 1990; Mortimer et al.,
1999b). Associated with terrane accretion was the intrusion of the Median Batholith,
including the Darran complex, with U-Pb determined ages from zircons of 142 – 137 Ma
(Kimbrough et al., 1994; Mortimer et al., 1999a). Collision at the Gondwana margin
changed to extension in the Late Cretaceous, possibly due to the arrival of a spreading
center at the subduction zone between the continent and outboard terranes (Muir et al.,
1994), and sea-floor spreading began 85 – 83 Ma (Weissel et al., 1977; Walcott, 1998).
Extension led to the separation of the continental fragments of Zealandia from Gondwana
by approximately 80 Ma, and to the opening of the Tasman Sea (Wood et al., 2000).
Extension associated with rifting led to wide-spread normal faulting in New Zealand
in the Late Cretaceous (Bishop & Laird, 1976; Tulloch & Kimbrough, 1989; Bishop,
1992; Norris & Turnbull, 1993). Spreading along the Tasman Sea ridge ceased by ~75
Ma, and this termination marked the onset of a change in plate motion (Gaina et al.,
1998). Seafloor spreading led to separation between New Zealand and Antarctica by 45
– 40 Ma (Weissel et al., 1977; Wood et al., 2000). The Euler pole of rotation between the
Pacific and Australian plates began to migrate to the south at approximately 30 Ma,
leading to oblique right-lateral motion across the Pacific-Australia plate boundary
(Lamarche et al., 1997; Wood et al., 2000). As the pole continued to migrate, motion
across the plate boundary became more oblique until ~20 Ma, when motion along the
39
plate boundary became entirely right-lateral (Sutherland, 1995; Walcott, 1998). Further
southward rotation of the Euler pole (Fig. 3.1 A) continued as subduction initiated
beneath the southern margin of New Zealand by approximately 10 Ma (Lamarche et al.,
1997). Oblique convergence initiated along the Australia-Pacific plate boundary within
the past 5 m.y. due to an increase in obliquity of motion across the boundary, leading to
the onset of transpression and uplift (Walcott, 1998); plate motion has not shifted
significantly since transpressional motion stabilized at ~ 5 Ma (Sutherland, 1995a;
Walcott, 1998).
2.2 Modern tectonic setting of the Alpine Fault
The modern relative plate motion velocity vector at Milford Sound is 36 ± 3 mm/yr
toward a bearing of 067 ± 2º (from NUVEL 1A model of DeMets et al., 1994). This
motion may be resolved into 23 ± 2 mm/yr of Alpine Fault-parallel dextral strike-slip
movement, 12 ± 4 mm/yr of horizontal motion accommodated by clockwise rotation of
crustal blocks and oblique motion, and 5 ± 3 mm/yr of throw on reverse faults at the
margins of the plate boundary (Sutherland et al., 2006). The uplift on reverse faults may
be associated with crustal detachment or distributed shortening of the lithosphere
(Sutherland et al., 2006). These motion and uplift data are consistent with rates reported
by Bishop (1991), Sutherland & Norris (1995), and Norris & Cooper (2001).
Metamorphic mineral assemblages indicate that amphibolite facies deformation occurred
at depths of 15 – 25 km (Grapes & Watanbe, 1992). Ages determined from K-Ar dating
of micas in Alpine schists (Adams, 1981) and from fission track dates of zircon (Tippett
& Kamp, 1993) are very young (c. 1 – 5 Ma). The very young ages of the Alpine schists
40
combined with the mid-crustal depths of metamorphism indicate rapid exhumation of
Alpine fault-related rocks associated with transpression (Koons et al., 2003).
The plate boundary comes on shore to the south of Milford Sound where it is the
Alpine Fault. The fault is very linear in this region and strikes 050º - 055º, is subvertical
to very steeply southeastward dipping, and has primarily strike-slip striations (Norris &
Cooper, 1995; Norris & Cooper, 2001). In the center of the South Island, the Alpine
Fault appears to be a linear feature, but is actually composed of dominantly strike-slip
faults linked by segments of oblique thrust motion (Norris et al., 1990; Norris & Cooper,
1995; Little et al., 2002b). The fault links the westward-verging subduction of the Pacific
plate in the Hikurangi Trench to the north to the eastward-verging subduction of the
Australian plate in the Puysegur Trench to the south (Fig. 3.1 A). There have been at
least 460 km of offset along the Alpine Fault in the past 45 m.y. (Wellman, 1953;
Sutherland, 1999), and approximately 70 km of shortening near Milford Sound
(Sutherland et al., 2000). More than 60% of the strain along the Alpine Fault is
concentrated within 20 km of the fault (Norris & Cooper, 2001).
Seismic activity in the South Island of New Zealand reflects the different geometries
of the plate boundary. In the north, the Benioff zone dips to the west, parallel to the
subduction direction of the Pacific plate. The plate boundary is the 100 km wide
Marlborough fault zone at the northern end of the South Island, and has had several large
(Mw ≥ 6) earthquakes in the past 150 years (Gledhill et al., 2000; Leitner et al., 2001).
The central region of the South Island along the Alpine Fault is interpreted to have a
narrow and subvertical Benioff zone (Reyners, 1989), and has had relatively little seismic
activity during the past 150 years greater than Mw ≥ 5 (Anderson et al., 1993; Eberhart-
41
Phillips, 1995). South of Milford Sound, the Alpine Fault continues off-shore and
subduction of the Australian plate begins by the Puysegur Trench. Seismicity occurs in a
broad zone across the branching plate boundary to the south of Milford Sound (Moore et
al., 2000; Eberhart-Phillips et al., 2001).
Recent earthquakes in Fiordland and along the Australia-Pacific plate boundary can
be interpreted to represent the modern stress field (e.g. Ghisetti, 2000). P-axis azimuths
calculated from focal mechanisms of oblique and thrust earthquakes from Fiordland and
the northern Puysegur trench are oriented at approximately 50º - 65º to the plate boundary
(Anderson et al., 1993; Moore et al., 2000). These P-axes suggest that the modern stress
field is relatively homogenous in the region near Milford Sound, and that the contraction
component is at a moderately high angle to the Alpine Fault.
3. Structure of field regions in Fiordland
3.1 Structure of the Darran Range and Northern Fiordland
Northern Fiordland is composed primarily of high-grade gneisses, the Median
Batholith (partially composed of the Mistake and Darran Suite gabbros, diorites, and
granites), and volcaniclastic sediments of the Brook Street Terrane (Mortimer et al.,
1999b). These lithologies are the metasedimentary rocks associated with the collision of
terranes with Gondwana during the Jurassic and Early Cretaceous, and the corresponding
intrusive and volcanic units.
42
3.1a The Hollyford Valley Fault Zone
The Hollyford Valley forms the eastern margin of the Darran Range, and is a major
topographic low with an average elevation of 20 – 40 m (relief is 2500 m between the
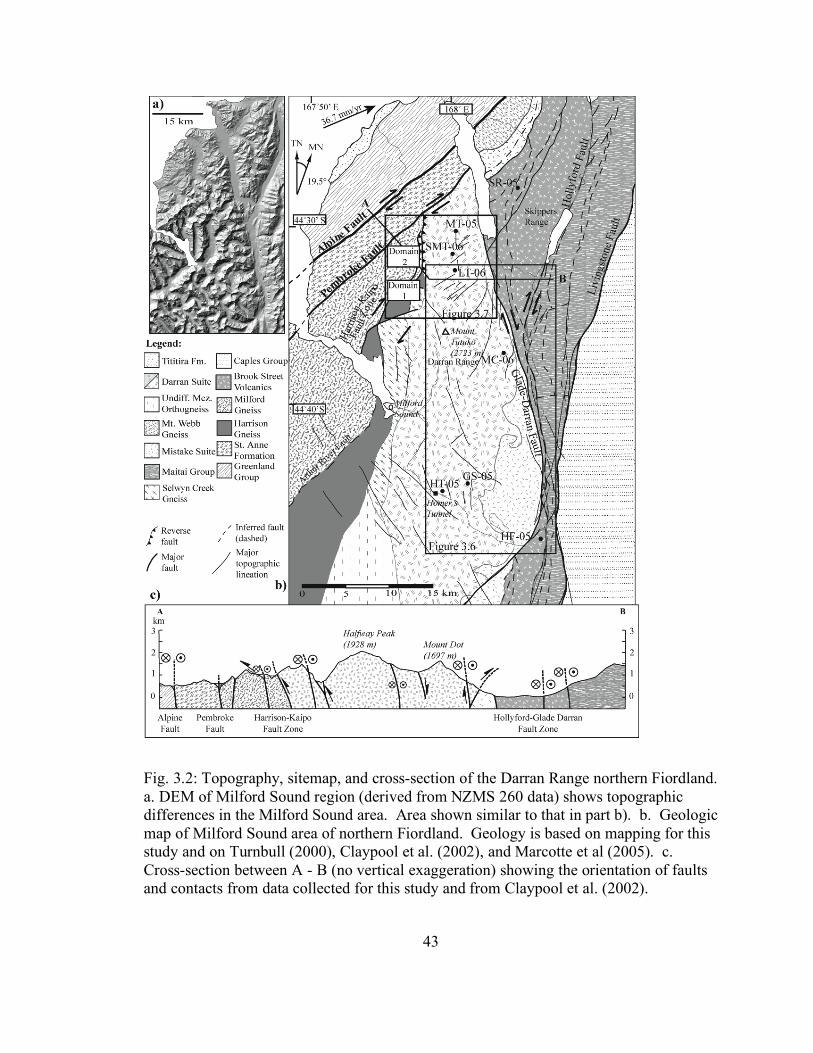
valley floor and Mt. Madeline, 5 km away) that contains three large faults (Fig. 3.2 A).
The Glade-Darran Fault is the western-most fault in the Hollyford Fault Valley, is
approximately 45 km long, and is cut by the Alpine Fault on the northern end, and by the
Hollyford Fault at the southern end (Fig. 3.2 B) (Turnbull, 2000). The Hollyford Fault is
at least ~55 km long, depending on the location of the intersection of the Hollyford Fault
with the Te Anau Fault to its south; the Hollyford Fault and the Glade-Darran Fault are
possibly active due to aseismic slip in northern Fiordland (Sutherland, 1995b).
Geomorphologic evidence such as prominent topographic lineaments and sag ponds in
the Hollyford Valley fault zone suggest Quaternary movement. Finally, the eastern-most
Livingstone Fault is over 100 km long and has evidence for Middle Miocene
displacement along the fault (Turnbull, 2000). Sense of motion on faults in the Hollyford
Valley is uncertain; early work suggested a small sinistral component of motion due to
fault-fold relationships (Sutherland, 1995b), but we present new fault-slip evidence for
dextral and reverse motion on faults within the valley.
Until recently, there has been little exposure of these faults within the Hollyford
Valley. However, there is now excellent exposure of a large splay of the fault zone along
a roadcut on the Milford-Te Anau Road. The Hollyford Fault roadcut (HF-05; Fig. 3.2
B) is within the Eglinton subgroup of the Mesozoic Brook Street Terrane; the outcrop is
in the Consolation Formation, and is composed of bedded volcaniclastic sandstones with
extensive Kaka siltstone horizons (Turnbull, 2000).
43
Fig. 3.2: Topography, sitemap, and cross-section of the Darran Range northern Fiordland. a. DEM of Milford Sound region (derived from NZMS 260 data) shows topographic differences in the Milford Sound area. Area shown similar to that in part b). b. Geologic map of Milford Sound area of northern Fiordland. Geology is based on mapping for this study and on Turnbull (2000), Claypool et al. (2002), and Marcotte et al (2005). c. Cross-section between A - B (no vertical exaggeration) showing the orientation of faults and contacts from data collected for this study and from Claypool et al. (2002).
44
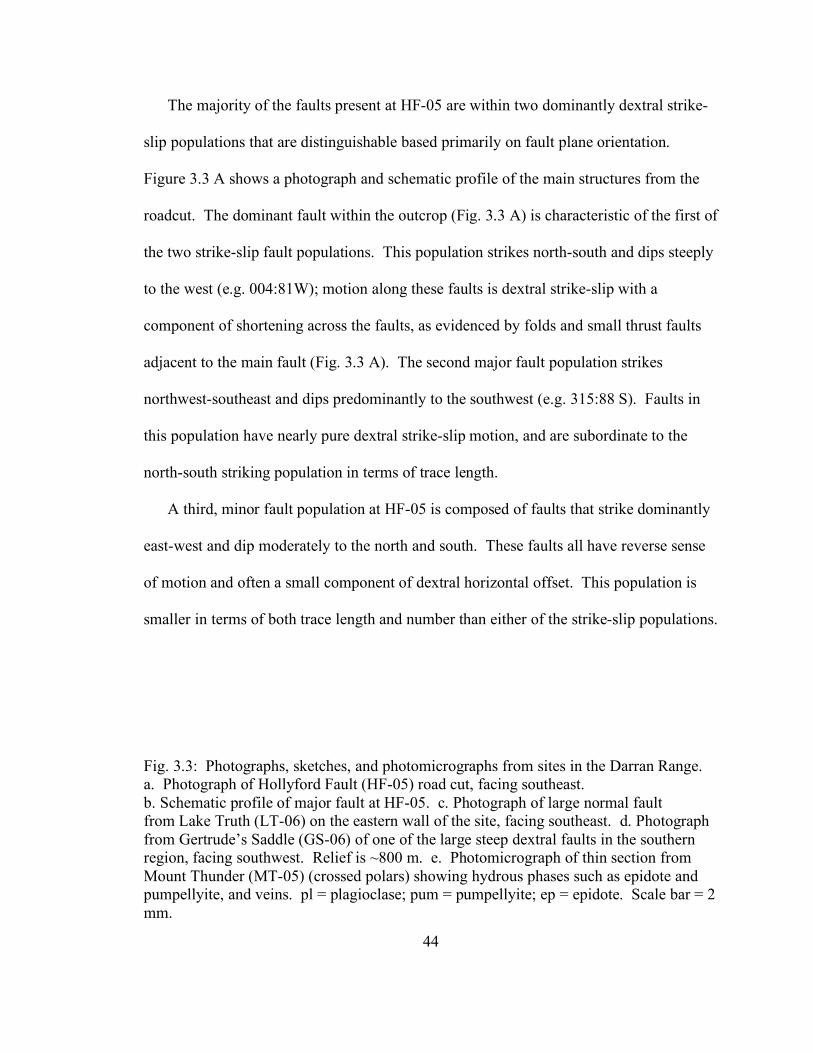
The majority of the faults present at HF-05 are within two dominantly dextral strike-
slip populations that are distinguishable based primarily on fault plane orientation.
Figure 3.3 A shows a photograph and schematic profile of the main structures from the
roadcut. The dominant fault within the outcrop (Fig. 3.3 A) is characteristic of the first of
the two strike-slip fault populations. This population strikes north-south and dips steeply
to the west (e.g. 004:81W); motion along these faults is dextral strike-slip with a
component of shortening across the faults, as evidenced by folds and small thrust faults
adjacent to the main fault (Fig. 3.3 A). The second major fault population strikes
northwest-southeast and dips predominantly to the southwest (e.g. 315:88 S). Faults in
this population have nearly pure dextral strike-slip motion, and are subordinate to the
north-south striking population in terms of trace length.
A third, minor fault population at HF-05 is composed of faults that strike dominantly
east-west and dip moderately to the north and south. These faults all have reverse sense
of motion and often a small component of dextral horizontal offset. This population is
smaller in terms of both trace length and number than either of the strike-slip populations.
Fig. 3.3: Photographs, sketches, and photomicrographs from sites in the Darran Range. a. Photograph of Hollyford Fault (HF-05) road cut, facing southeast. b. Schematic profile of major fault at HF-05. c. Photograph of large normal fault from Lake Truth (LT-06) on the eastern wall of the site, facing southeast. d. Photograph from Gertrude’s Saddle (GS-06) of one of the large steep dextral faults in the southern region, facing southwest. Relief is ~800 m. e. Photomicrograph of thin section from Mount Thunder (MT-05) (crossed polars) showing hydrous phases such as epidote and pumpellyite, and veins. pl = plagioclase; pum = pumpellyite; ep = epidote. Scale bar = 2 mm.
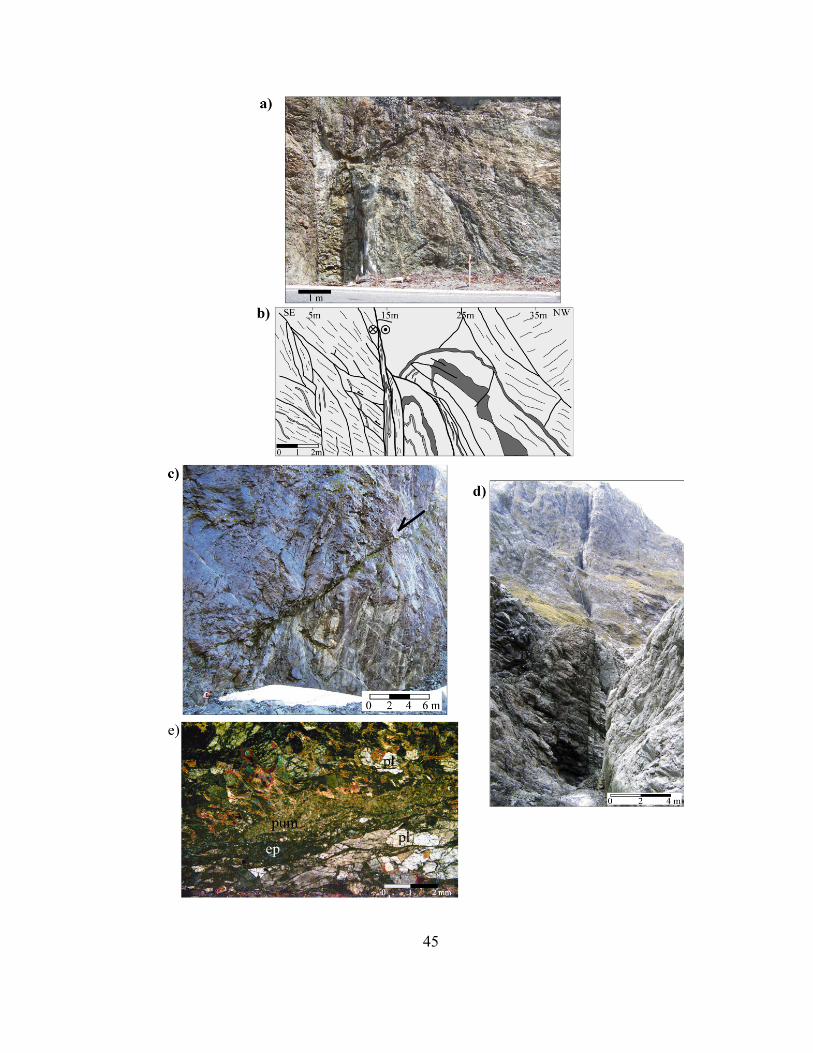
45
46
3.1b The interior of the Darran Range
The interior and eastern margin of the Darran Range are topographically elevated
(Fig. 3.2 A) and have excellent exposure of faults and kinematic indicators. The
dominant lithology in the region is medium-grained biotite-rich leucogabbro within the
Darran Suite in the Mesozoic Median Batholith (Blattner, 1978; Tulloch et al., 1999;
Turnbull, 2000); locally, there are large rafts of coarse-grained Mistake Suite diorite.
Towards the western margin of the Darran Range, the leucogabbro is altered to
hornblende diorite (Turnbull, 2000). There are steep felsic dikes in the interior of the
Darran Range, and several sites, such as Lake Truth (LT-06) and Gertrude’s Saddle (GS-
06), show primary igneous layering.
There are two distinct types of fault populations in the interior of the Darran Range.
The first group of fault populations strikes dominantly northeast and northwest, and dips
both to the northeast and to the southeast (e.g. 055:50S and 320:64N). This population is
composed of normal faults, and there is typically a component of sinistral motion
associated with the down-dip movement on the faults. The normal faults have trace
lengths of up to several hundred meters, and often form in conjugate sets (Fig. 3.3 B),
with most fault surfaces showing epidote staining.
The second type of fault population strikes north-south and dips steeply to the east
and west (e.g. 354:88E); these faults are dextral strike-slip faults, some with a vertical
component of motion. The majority of the major fault surfaces have epidote staining.
These faults are widely spaced (500 – 1000 m apart) and often cut across large valleys in
the interior of the Darran Range (Fig. 3.3 C). The dextral faults consistently cross-cut the
normal fault populations at all the field sites in the interior and at the margins. Several of
47
the steep faults utilize the margins of felsic dikes in the region. The dikes are typically
between 5 and 10 cm wide, and strike north-south and dip moderately to the west.
At the eastern margin of the Darran Range, the site between Madeline Creek and
Catch Creek (MC-06; Fig. 3.2 B) contains an additional, small fault population that is
likely synchronous with the dextral strike-slip faults at the site. The subordinate faults
are part of a population of thrust faults that strike northeast-southwest and dip both
northwest and southeast (e.g. 313:64N). All fault populations cut the primary igneous
layering.
3.1c The northern margin of the Darran Range
Within ~10 km of the Alpine Fault zone, the leucogabbros of the Darran Suite have
been altered, and the orientation and type of fault population differs from those in the
interior and along the eastern margin. The rocks within this zone are highly fractured,
sheared, have pervasive ductile and brittle faults, and there are many pegmatitic felsic
dikes. Mylonitic ductile fabrics are over-printed and reactivated by brittle deformation.
The rocks in the northern region show evidence of pervasive fluid infiltration, and
minerals at these sites include epidote and pumpellyite in the host rock (Fig. 3.3 D).
The dominant fault populations in this region are reverse and dextral oblique-reverse
faults that strike north and northeast and dip moderately to the northwest and southeast
(e.g. 058:57SE). These faults have long traces (50 – 100 m), and well-developed fault
gouge and epidote staining. The secondary fault population present at Mount Thunder
(MT-05; Fig. 3.2 B) is northeast striking and dips steeply in both directions, with a
primarily dextral strike-slip sense of motion.
48
3.1d The Harrison-Kaipo Fault Zone
The Harrison-Kaipo Fault zone forms part of the western margin of the Darran
Complex and the contact zone with Milford and Harrison Gneisses. The region was first
described by Claypool et al. (2002). Field sites within the Harrison-Kaipo Fault zone are
within 10 km of the Alpine Fault, primarily from west of the Darran Range, and within
the Milford and Harrison gneisses in the Arthur River Complex (ARC) (Domain 2; Fig.
3.2 B). There are several generations of lineations and foliations related to Early
Cretaceous shortening (Daczko et al., 2001) and Tertiary deformation in the Milford and
Harrison gneisses (Claypool et al., 2002). Upper greenschist facies Tertiary shear zone
deformation consists of mylonitic foliations and mineral lineations, as well as upright
isoclinal folds. Data from outside of the ARC are from the northwestern part of the
Darran Suite that has been deformed and metamorphosed (Muir et al., 1995) or from part
of the Indecision Creek Complex of Bradshaw (1990) (Domain 1; Fig. 3.2 B). This unit
has also been described as the Selwyn Creek gneiss (Marcotte et al., 2005) due to its
highly deformed nature, distinguishing it from the Darran Suite.
We are reinterpreting some of the structural and kinematic data from the Harrison-
Kaipo Fault zone originally described by Claypool et al. (2002); data from this region are
part of two structural domains within the fault zone. Domain 1 is between the Darran
Complex and Pembroke Fault (Fig. 3.2 B), and is characterized by two steep fault
populations that have compatible, primarily horizontal dextral (e.g. 058:71S) and sinistral
(e.g. 000:80W) strike-slip motion. Domain 2 is located within the ARC and contains
faults that strike north-south and dip variably to the east with dextral oblique-thrust
motion.

49
Mount Daniel is to the south and west of the Harrison-Kaipo Fault zone (Fig. 3.1 B),
and exposes the contact between the Milford Gneiss and the Western Fiordland
Orthogneiss (see section 3.3). There are several normal faults that strike to the northeast
and dip moderately to the west. This population is similar in orientation and sense of
motion to the normal fault populations in the Darran Range and in Doubtful Sound.
3.2 Structure of the Skippers Range
The Skippers Range is located between the Glade-Darran Fault and the Hollyford
Fault (Fig. 3.2 B) at the northeastern margin of the Fiordland region. The dominant
lithology in the central Skippers Range (SR-05; Fig. 3.2 B) is part of the Lone Stag
Formation, composed of serpentinized pyroxenites and gabbros, with remnants of
primary igneous layering (S0). The lithology widely is sheared and altered to greenschist
facies. The igneous layering has been folded into several large, open folds with axes
plunging to the northeast (Fig. 3.4 B, E). In addition to igneous layering, there is a strong
ductile fabric composed of foliation planes, regions of localized shear, and large-scale
folds (Fig. 3.4 B). F1 is a crenulation foliation that contains pressure shadows of chlorite
and epidote surrounding tapered feldspar clasts. F1 is folded (Fig. 3.4 E) and creates an
intersection lineation (L1) with S0. Major shear zones have been mapped by Ballard
(1988) and Turnbull (2000), and represent boundaries with adjoining intrusive units, but
there are smaller shear zones, 30 – 60 m in width, that are within one lithology. Shear
zones strike northeast and dip steeply in both directions (e.g. 050:85S) (Fig. 3.4 B, C).
Shear planes in these zones have pervasive epidote staining, and kinematic indicators
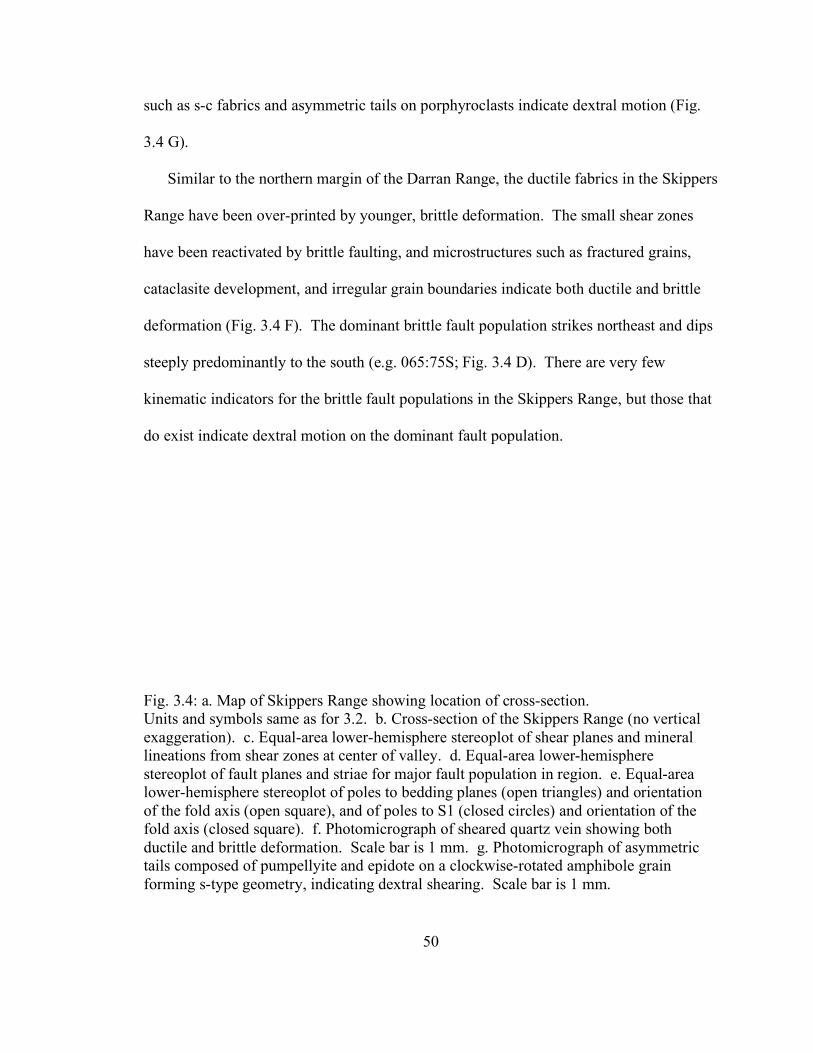
50
such as s-c fabrics and asymmetric tails on porphyroclasts indicate dextral motion (Fig.
3.4 G).
Similar to the northern margin of the Darran Range, the ductile fabrics in the Skippers
Range have been over-printed by younger, brittle deformation. The small shear zones
have been reactivated by brittle faulting, and microstructures such as fractured grains,
cataclasite development, and irregular grain boundaries indicate both ductile and brittle
deformation (Fig. 3.4 F). The dominant brittle fault population strikes northeast and dips
steeply predominantly to the south (e.g. 065:75S; Fig. 3.4 D). There are very few
kinematic indicators for the brittle fault populations in the Skippers Range, but those that
do exist indicate dextral motion on the dominant fault population.
Fig. 3.4: a. Map of Skippers Range showing location of cross-section. Units and symbols same as for 3.2. b. Cross-section of the Skippers Range (no vertical exaggeration). c. Equal-area lower-hemisphere stereoplot of shear planes and mineral lineations from shear zones at center of valley. d. Equal-area lower-hemisphere stereoplot of fault planes and striae for major fault population in region. e. Equal-area lower-hemisphere stereoplot of poles to bedding planes (open triangles) and orientation of the fold axis (open square), and of poles to S1 (closed circles) and orientation of the fold axis (closed square). f. Photomicrograph of sheared quartz vein showing both ductile and brittle deformation. Scale bar is 1 mm. g. Photomicrograph of asymmetric tails composed of pumpellyite and epidote on a clockwise-rotated amphibole grain forming s-type geometry, indicating dextral shearing. Scale bar is 1 mm.
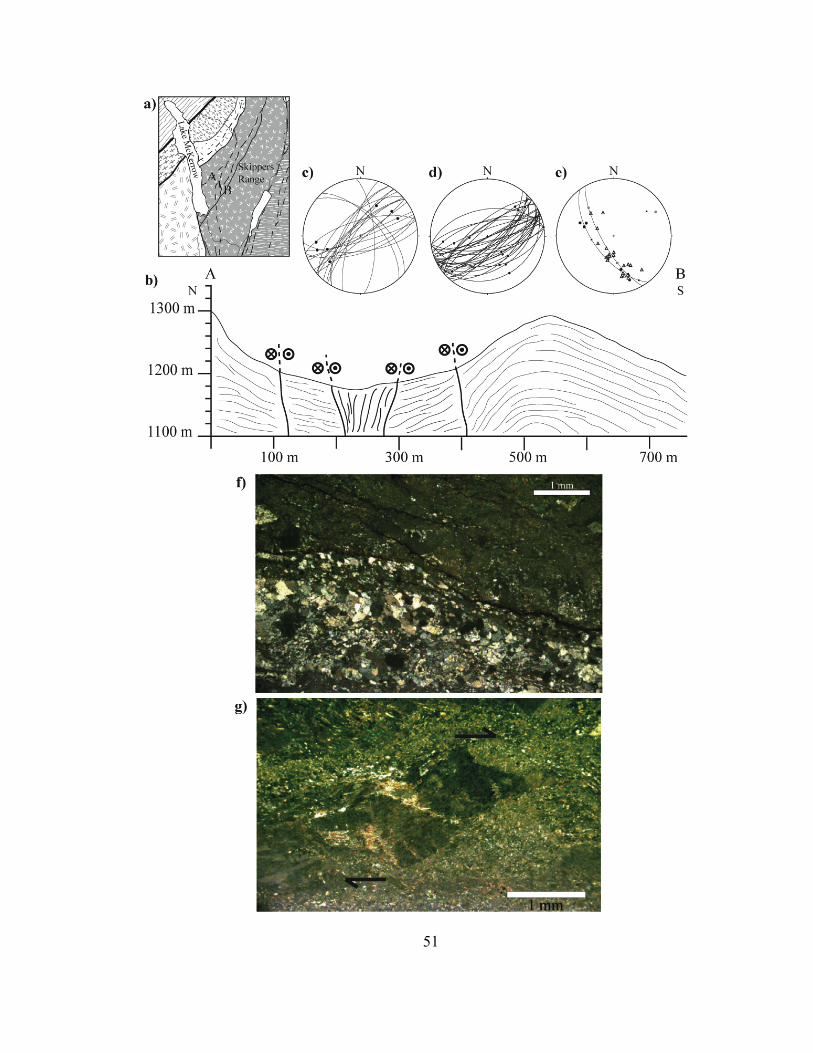
51
52
3.3 Structure of Doubtful Sound
The dominant lithology in Doubtful Sound is the Western Fiordland Orthogneiss
(WFO), which is associated with intrusive units in the Median Batholith (Fig. 3.2 B)
(Gibson, 1988; Hollis et al., 2004). The WFO was emplaced within the Median Batholith
between 126 and 116 Ma (Mattinson et al., 1986; Gibson, 1988). Deformation of the
WFO began soon after emplacement (123 – 121 Ma), determined from U-Pb dating of
zircons (Hollis et al., 2004). Cretaceous deformation of the WFO included ductile
deformation and recrystallization at 750º - 850º C at pressures of 10 – 13 kbar (Hollis et
al., 2004). WFO is in fault contact with ortho- and paragneisses in Doubtful Sound that
also show ductile deformation and recrystallization (Fig. 3.1 B). Brittle fault populations
in Doubtful Sound are primarily normal faults measured along the shoreline of the sound.
The normal faults are moderately dipping and strike to the northeast and the northwest.
4. Kinematics of the Darran Range
4.1 Kinematic methods
The kinematic data that we present in this section are the average fault plane solution
and instantaneous strain axes calculated from fault-slip data collected from the Darran
Range. The fault-slip data consist of fault plane orientation, slip direction, sense of
motion, and, ideally, trace length, and the quality of the sense of motion and striation.
The kinematic technique we use is based on incremental strain summations, similar to the
technique used to calculate infinitesimal strain on fault planes ruptured during seismic
activity. This approach relies on several assumptions about motion on the fault planes.
The first assumption is that the direction of motion on the fault is parallel to the slip
53
vector, represented by the slickenline or other striation; similarly, the technique assumes
that the striae record only the most recent phase of movement. The second principle
assumption is that the instantaneous strain axes lie in a plane parallel to the slip direction
and perpendicular to the fault plane. This requirement also confines the two principle
strain axes to be oriented 45º from the fault plane. Finally, this method assumes that the
strain due to faulting is less than ~60% of the total strain, allowing for the calculation of
the instantaneous strain axes to have error limits consistent with other field data
(Cladouhos & Allmendinger, 1993). This final requirement is reasonable considering
faults used for this work are typically between 1-100 m in trace-length, which is minor
compared to ~70 km of shortening across the Alpine Fault and 460 km of fault-parallel
displacement along the Alpine Fault (Walcott, 1998; Norris & Cooper, 2001).
We calculate instantaneous strain axes, including the principle axes of contraction (Z)
and extension (X), and the average fault plane solution for each fault population at each
field site from the collected fault slip data using the program FaultKin v. 4.3.5 created by
R. W. Allmendinger, R. A. Marrett, & T. Cladouhos (1994; modified 2006). We
determine sense of motion using offset markers, s-c fabric, and chattermarks when
necessary, and we group faults into populations based on fault plane orientation, trend
and plunge of mineral striae (typically epidote in the Darran Range), and sense of motion.
Consistent cross-cutting relationships from observed field data allow us to separate faults
into distinct fault populations that we infer to be related to distinct events. We attempted
to use all fault data collected at each site in order to incorporate the maximum orientation
of faults and therefore justify our assumption that all fault populations are represented.
Faults were only excluded from solutions if the instantaneous strain axes did not group

54
well with any of the fault populations at a site, and were small, had poor control on sense
of motion, or were graded “poor” in terms of certainty of orientation of striation.
Average kinematic solutions from individual instantaneous strain axes are determined
using linked Bingham distribution statistics to calculate the directional maxima of the X
and Z axes (Marrett & Allmendinger, 1990).
The average fault plane solution shows the bulk orientation of fault planes and striae
measured for each fault population (Fig. 3.5). Figure 3.5 C shows the average fault plane
solution for each fault population, and the average instantaneous strain axes provide a
bulk representation for each kinematic solution. These figures show the clustering of the
instantaneous strain axes even though there is heterogeneity in the orientation of the fault
slip data for each population.
4.2 Kinematic results
4.2a The Hollyford Fault Valley and the interior of the Darran Range
The southern region has two distinct fault populations. The first type of fault
population shows dominantly normal motion with a small component of sinistral
movement on moderately dipping fault planes (Fig. 3.5). These fault populations are cut
by dextral and reverse faults. The major fault populations strike northeast and northwest
and form conjugate fault sets that dip to the northeast and the southeast; smaller
populations strike east-west and dip to the north and south. Instantaneous axes of
contraction (Z-axes) are oriented vertically in these populations, and the instantaneous
axes of extension (X-axes) plunge gently towards the west-northwest for the major
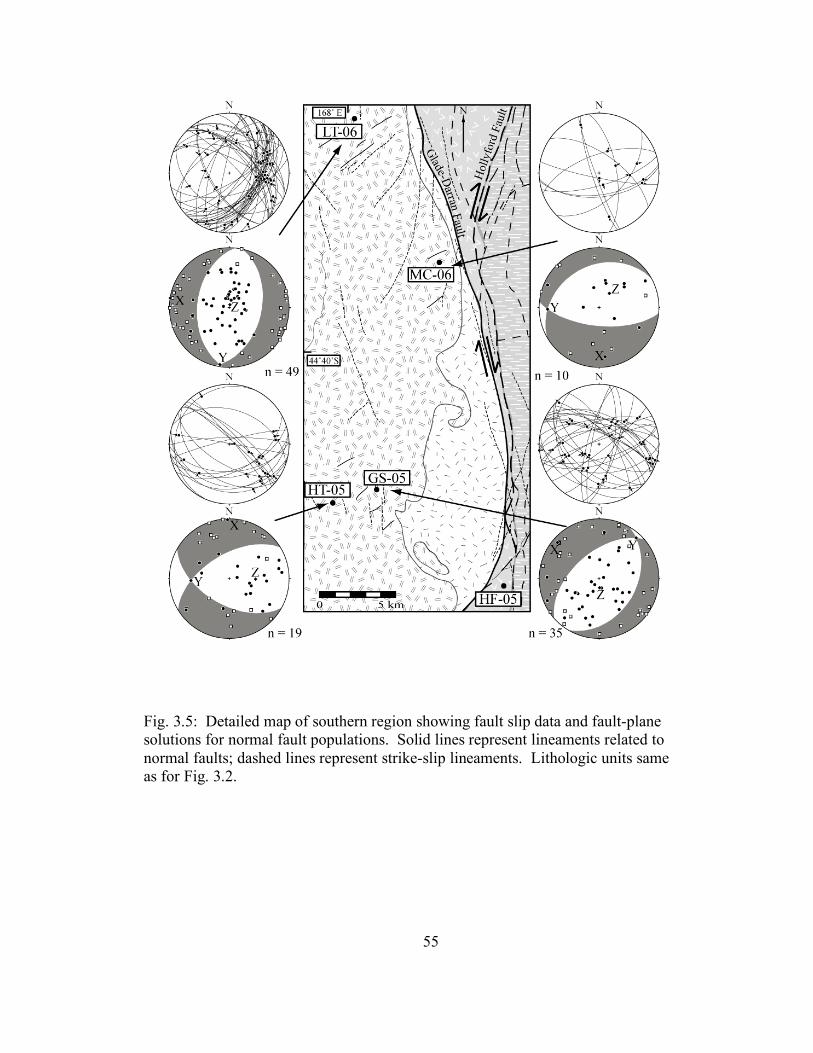
55
Fig. 3.5: Detailed map of southern region showing fault slip data and fault-plane solutions for normal fault populations. Solid lines represent lineaments related to normal faults; dashed lines represent strike-slip lineaments. Lithologic units same as for Fig. 3.2.
56
populations, and to the north and south for the smaller populations. Normal faults from
Mount Daniel are north-east striking, northwest-dipping faults, and has an eastern-
trending extension direction, consistent with the large fault populations from the Darran
Range. Normal fault are not present at the Hollyford Fault site (HF-05).
The second variety of fault populations are mutually cross-cutting reverse and steep
dextral strike-slip populations. The dextral strike-slip faults show horizontal motion on
steep faults that generally strike north-south (Fig. 3.6). Some populations show vertical
motion on steep dextral faults (e.g. MC-06 & GS-06; Fig. 3.6). Several steep faults that
show vertical motion have multiple sets of slickenlines or other striae; one orientation is
typically sub-horizontal, whereas the other shows down-dip motion. With the exception
of two subordinate populations at HF-05 (Fig. 3.6), the Z-axes of these fault populations
plunge gently toward the northeast or southwest. The X-axes plunge gently toward the
northwest or southeast for dextral strike-slip populations, with the same exceptions at
HF-05 (Fig. 3.6). It is possible that these subordinate fault populations are related to
interaction between the Glade-Darran and the Hollyford fault, both of which are located
in the Hollyford Fault valley within 500-1000m of each other (Fig. 3.2).
Thrust populations in the Darran Range also show variation in the orientations of the
their contraction axes. The reverse faults from HF-05 show Z-axes in a similar
orientation to those of the subordinate dextral population, possible for the same reason.
The reverse fault populations are from the eastern margin of the Darran Range and
indicate that the Darran Complex may be uplifted.
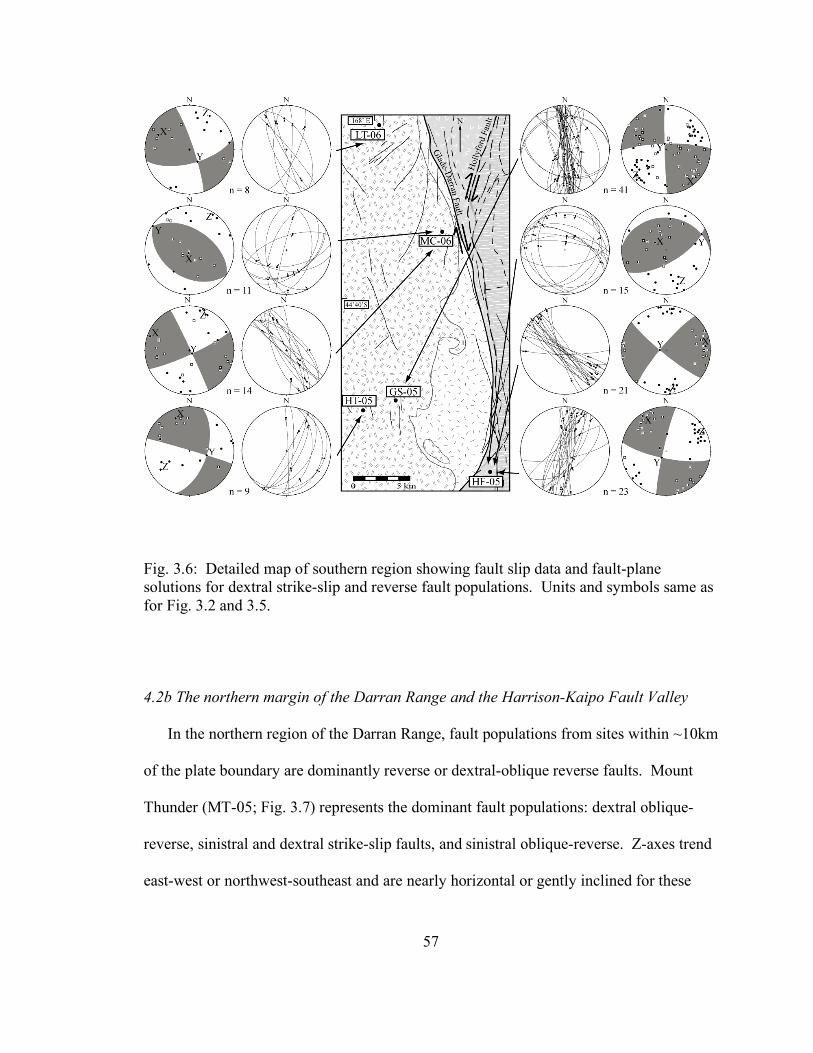
57
Fig. 3.6: Detailed map of southern region showing fault slip data and fault-plane solutions for dextral strike-slip and reverse fault populations. Units and symbols same as for Fig. 3.2 and 3.5.
4.2b The northern margin of the Darran Range and the Harrison-Kaipo Fault Valley
In the northern region of the Darran Range, fault populations from sites within ~10km
of the plate boundary are dominantly reverse or dextral-oblique reverse faults. Mount
Thunder (MT-05; Fig. 3.7) represents the dominant fault populations: dextral oblique-
reverse, sinistral and dextral strike-slip faults, and sinistral oblique-reverse. Z-axes trend
east-west or northwest-southeast and are nearly horizontal or gently inclined for these
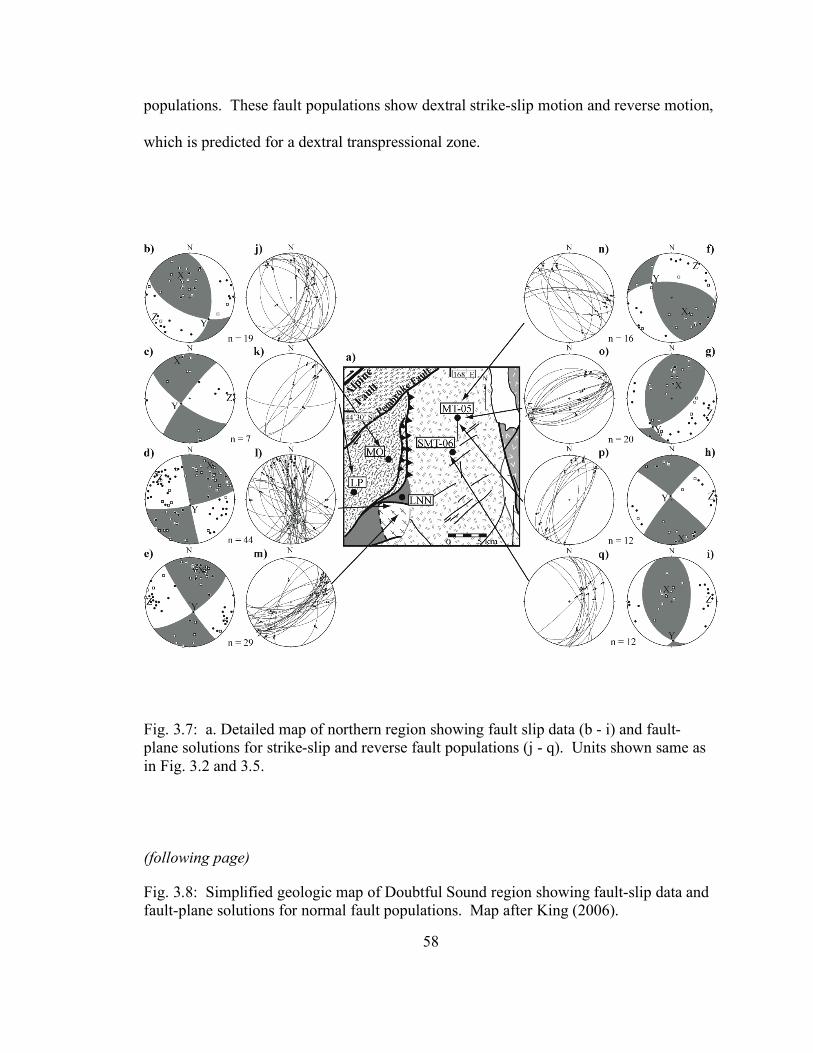
58
populations. These fault populations show dextral strike-slip motion and reverse motion,
which is predicted for a dextral transpressional zone.
Fig. 3.7: a. Detailed map of northern region showing fault slip data (b - i) and fault- plane solutions for strike-slip and reverse fault populations (j - q). Units shown same as in Fig. 3.2 and 3.5.
(following page)
Fig. 3.8: Simplified geologic map of Doubtful Sound region showing fault-slip data and fault-plane solutions for normal fault populations. Map after King (2006).
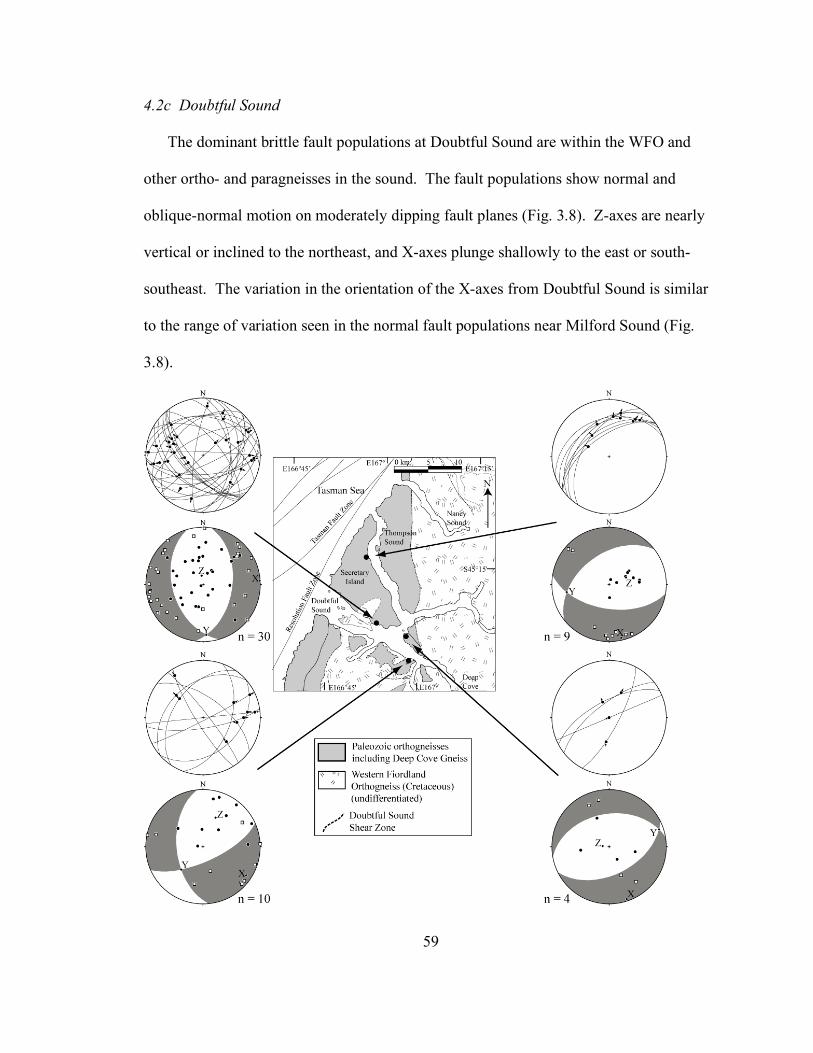
59
4.2c Doubtful Sound
The dominant brittle fault populations at Doubtful Sound are within the WFO and
other ortho- and paragneisses in the sound. The fault populations show normal and
oblique-normal motion on moderately dipping fault planes (Fig. 3.8). Z-axes are nearly
vertical or inclined to the northeast, and X-axes plunge shallowly to the east or south-
southeast. The variation in the orientation of the X-axes from Doubtful Sound is similar
to the range of variation seen in the normal fault populations near Milford Sound (Fig.
3.8).
60
5. Stress inversion
5.1 Methods
We model paleostress fields in the Darran Range using the Fault Slip Analysis (FSA)
program (v. 28.5), developed by Célérier (1988; 2006) after the Monte Carlo search
technique, modified by Etchecopar et al. (1981). The FSA technique, like the majority of
stress inversion programs (e.g. Michael, 1984; Angelier, 1990; Gephart, 1990) relies on
several assumptions. First, that the stress tensor is homogenous for the entire body of
modeled material and that the modeled material behaves isotropically. The second
assumption is that all of the slip on a fault occurs in the same direction as the resolved
shear stress on the fault plane; this direction is given by the orientation of the striation.
Finally, the orientation of the fault planes in each modeled population must be diverse
enough to constrain the stress tensor. Célérier (1988) indicates that the minimum number
of fault slip data per population needed to constrain the stress tensor is 4 faults. In this
study, we use between 5 and 28 faults in each population to constrain the stress tensor.
We use stress inversion solutions in this study to model paleostress fields for
idealized fault populations in each region using geometrical and frictional constraints to
analyze the stress tensors. The geometrical constraint relies on the compatibility between
the orientation of the observed slip on a fault plane and the orientation of the predicted
slip direction for a given generated stress tensor (Angelier, 1979; Etchecopar et al., 1981;
Angelier, 1984; Michael, 1984; Célérier, 1988). The frictional constraint analyses the
ability for a fault population to be activated at given values of the coefficient of friction
(Célérier, 1988; Burg et al., 2005). We use the results of the geometric constraint
analysis to compare to the orientation of the instantaneous strain axes generated by

61
kinematic analysis. Because the kinematic analysis and geometrically constrained
inversion rely on different assumptions, comparing the orientation of the results also
serves as a test of the techniques. The frictional constraint experiment is useful to
compare the relative role of pore fluid pressure, or other strain-induced weakening
mechanisms, between different fault populations, as described below.
FSA generates a reduced stress tensor composed of the orientations of the principle
stresses, and of the relative ratio of the stresses, δ (Angelier, 1975). This ratio has values
of 0 ≤ δ ≤ 1, and represents the shape of the stress ellipsoid; it is defined using the
following relationship:
δ = (σ1-σ2)/( σ1-σ3) (3.1)
where δ=1 represents a prolate stress ellipsoid, and δ=0 represents an oblate stress
ellipsoid (Célérier, 1988). FSA then uses the geometric constraint technique to analyze
the compatibility between generated stress tensors and the fault population. Analysis of
the generated tensors yields an angular misfit value between the orientation of the
observed slip on the fault and the orientation of the predicted slip for each stress tensor
(Etchecopar et al., 1981; Célérier, 1988). The misfit angle between the observations and
the model serves as a measure of quality of the stress tensor with regard to its
compatibility with the measured fault-slip data.
Fault populations used with the geometric constraint in FSA are composed of faults
with the smallest angular misfit values. We have artificially improved the fault
populations by requiring that all modeled faults have angular misfit values of less than
15º (Table 1) and removing outliers from the populations. These misfit angles are larger
than the maximum suggested by Gillard & Wyss (1995) (6º), but are generally 4º - 6º
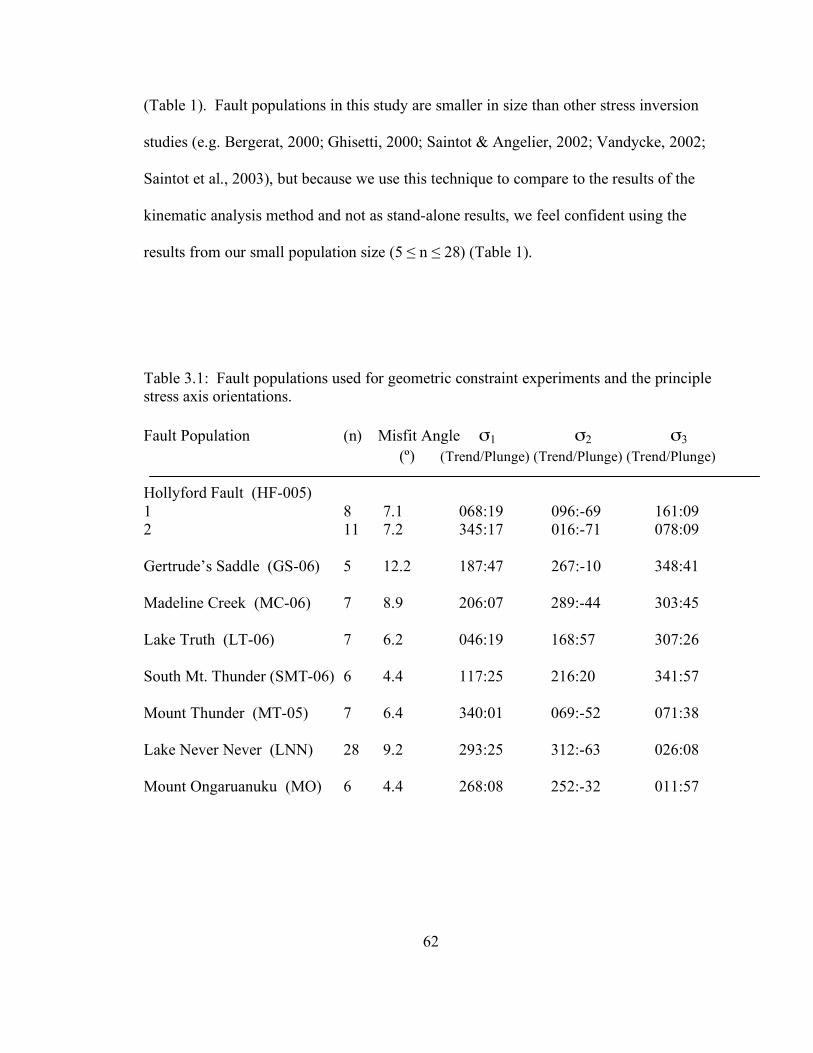
62
(Table 1). Fault populations in this study are smaller in size than other stress inversion
studies (e.g. Bergerat, 2000; Ghisetti, 2000; Saintot & Angelier, 2002; Vandycke, 2002;
Saintot et al., 2003), but because we use this technique to compare to the results of the
kinematic analysis method and not as stand-alone results, we feel confident using the
results from our small population size (5 ≤ n ≤ 28) (Table 1).
Table 3.1: Fault populations used for geometric constraint experiments and the principle stress axis orientations. Fault Population (n) Misfit Angle σ1 σ2 σ3 (º) (Trend/Plunge) (Trend/Plunge) (Trend/Plunge) Hollyford Fault (HF-005) 1 8 7.1 068:19 096:-69 161:09 2 11 7.2 345:17 016:-71 078:09 Gertrude’s Saddle (GS-06) 5 12.2 187:47 267:-10 348:41 Madeline Creek (MC-06) 7 8.9 206:07 289:-44 303:45 Lake Truth (LT-06) 7 6.2 046:19 168:57 307:26 South Mt. Thunder (SMT-06) 6 4.4 117:25 216:20 341:57 Mount Thunder (MT-05) 7 6.4 340:01 069:-52 071:38 Lake Never Never (LNN) 28 9.2 293:25 312:-63 026:08 Mount Ongaruanuku (MO) 6 4.4 268:08 252:-32 011:57

63
The frictional constraint method in FSA uses, in addition to the geometric analysis, an
algorithm to investigate the effect of varying the value of the coefficient of friction (µ).
This method determines whether the reduced stress tensor enables an idealized fault
population to be activated at specific values of µ. Frictional analysis of fault populations
depends on several established friction and failure relationships for rocks. The first is
that Coulomb’s law of brittle failure (1776) for compressive stress states:
σc = σo + µ • (σN) (3.2)
where σc is the critical shear stress required for failure, σo is the cohesive strength of the
rock, and σN is the lithostatic normal stress. Additionally, frictional analysis assumes that
the cohesive strength of the rock and the internal friction angle (ϕ = arctan(µ)) are
independent of rock type (Byerlee, 1978). This assumption holds for undeformed
materials, but processes involved in faulting, such as the formation of fault gouge, the
infiltration of fluids, and mineral alteration are likely to change the value of the
coefficient of friction (Byerlee, 1978; Rice, 1992; Zoback & Healy, 1992; Lavier et al.,
2000; Townend & Zoback, 2001).
The frictional analysis by FSA provides a graphical estimate of the relationship
between the critical stress differences (sc'), the value of δ, and the location of each fault in
the fault population based on its shear stress (σs) and normal stress (σN) components.
The shear and normal stress components for each fault are calculated from eigenvalues of
the reduced stress tensor. The modified stress difference, s′, is defined as:
s′ = (σ1 - σ3)/(σ1 + τ0/tanϕ 0), (3.3)
64
and has critical values of sc′ = 0.68 (for µ = 0.6, the standard frictional coefficient for
most rocks (Byerlee, 1978)), which is the stress difference required to initiate slip on a
plane; sc′ = 0.8, which is the stress difference when new faults are created; sc′ = 1.00, the
maximum value of the normalized stress difference (Célérier, 1988). The values of sc′
are given values against which the calculated modified stress difference (s′) are
compared. Sliding on a plane of weakness is likely to occur before enough stress is
accumulated to create new faults (Wallace, 1951; Jaeger, 1960; Donath, 1964; Handin,
1969; Célérier, 1988), and faults that are favorably oriented require a normalized stress
difference above a critical value to initiate sliding. Therefore, faults that, when plotted in
Mohr space and normalized in terms of the shape parameter (δ), plot between sc′ = 0.68
and sc′ = 0.80 are faults that can be activated by the stress tensor being tested (Fig. 3.9 C).
Faults that plot below sc = 1.00 may be considered over-pressured (Célérier, personal
communication, 2006), and do not fit with the assumed value of the coefficient of
friction, µ.
By modifying µ, it is possible to test the importance of pore fluid pressure, or other
strain-induced weakening mechanisms, during movement on the faults (Célérier, 1988;
Burg et al., 2005). FSA relies on equation (3.2) to model the effects of the normal stress
and the coefficient of friction. Because the coefficient of friction and the normal stress
are related through multiplication, the mathematical effect of changing one parameter
cannot be distinguished from the results of changing the other parameter. Decreasing the
input value of µ has the effect of lowering the value of the normal stress (equation (3.2));
this same effect can also be achieved by increasing the amount of pore fluid pressure (Pf).

65
Hubbert and Rubey (1959) modified equation (3.2) to illustrate this effect by including
Pf:
σc = σ0 + µ • (σN- Pf). (3.4)
Changing the value of µ allows us to test the relative value of pore fluid pressure for
different fault populations and different regions. Idealized fault populations for the
frictional constraint analysis contain the 5 largest faults from each region that have the
best constraint on slip direction and sense of motion.
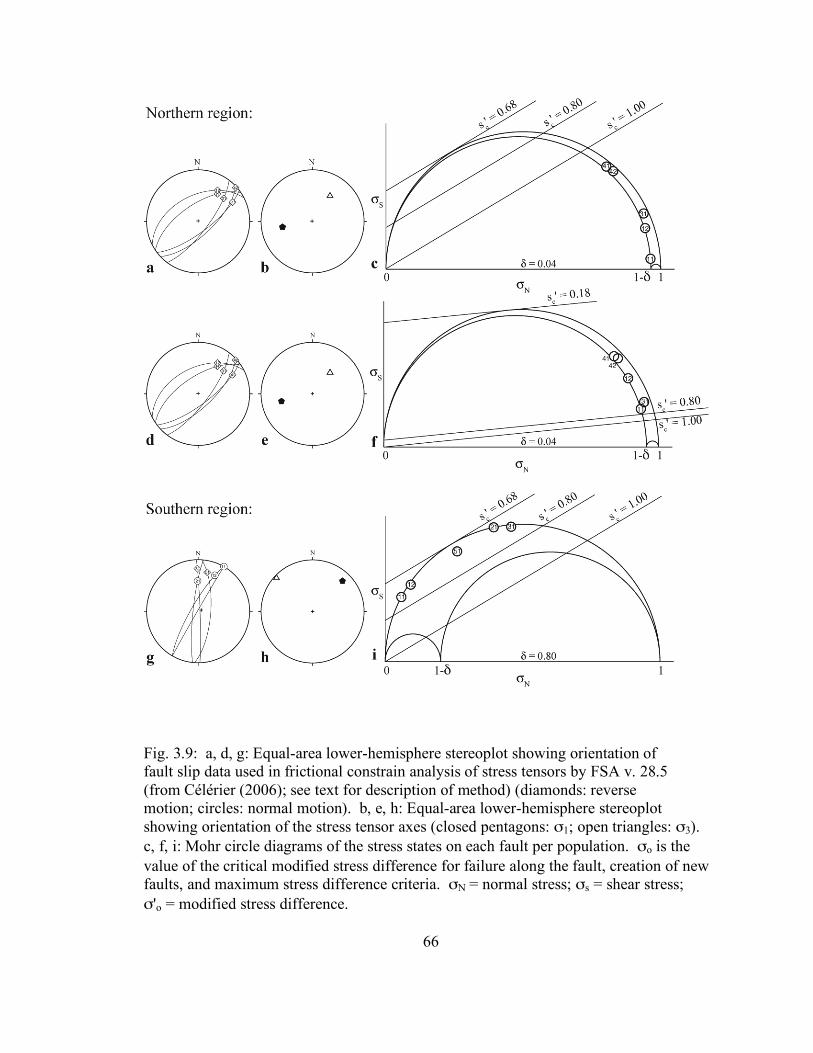
66
Fig. 3.9: a, d, g: Equal-area lower-hemisphere stereoplot showing orientation of fault slip data used in frictional constrain analysis of stress tensors by FSA v. 28.5 (from Célérier (2006); see text for description of method) (diamonds: reverse motion; circles: normal motion). b, e, h: Equal-area lower-hemisphere stereoplot showing orientation of the stress tensor axes (closed pentagons: σ1; open triangles: σ3). c, f, i: Mohr circle diagrams of the stress states on each fault per population. σo is the value of the critical modified stress difference for failure along the fault, creation of new faults, and maximum stress difference criteria. σN = normal stress; σs = shear stress; σ'o = modified stress difference.
67
5.2 Results using the geometric constraint
Stress solutions analyzed using the geometric constraint alone are shown in Figure
3.10. Stress solutions from the southern region show the maximum principle stress, σ1,
plots an average of 28º from the orientation of the Alpine Fault (stereoplot c; Fig. 3.10).
The exception to this pattern is the northwest striking fault population from HF-05 (Fig.
3.6), for which σ1 trends to the north. The instantaneous axis of shortening for this
population also trends towards the north. The minimum principle stress, σ3, plots an
average of 50º from the orientation of the Alpine Fault, and HF-05 presents the same
exceptions.
Stress solutions from the northern region show σ1 at much higher angles to the Alpine
Fault (stereoplot a; Fig. 3.10) compared to the stress solutions for the southern region.
The average angular distance from the Alpine Fault to σ1 is 53º in the northern region; σ3
trends at low angles to the Alpine Fault (average angle = 26º).
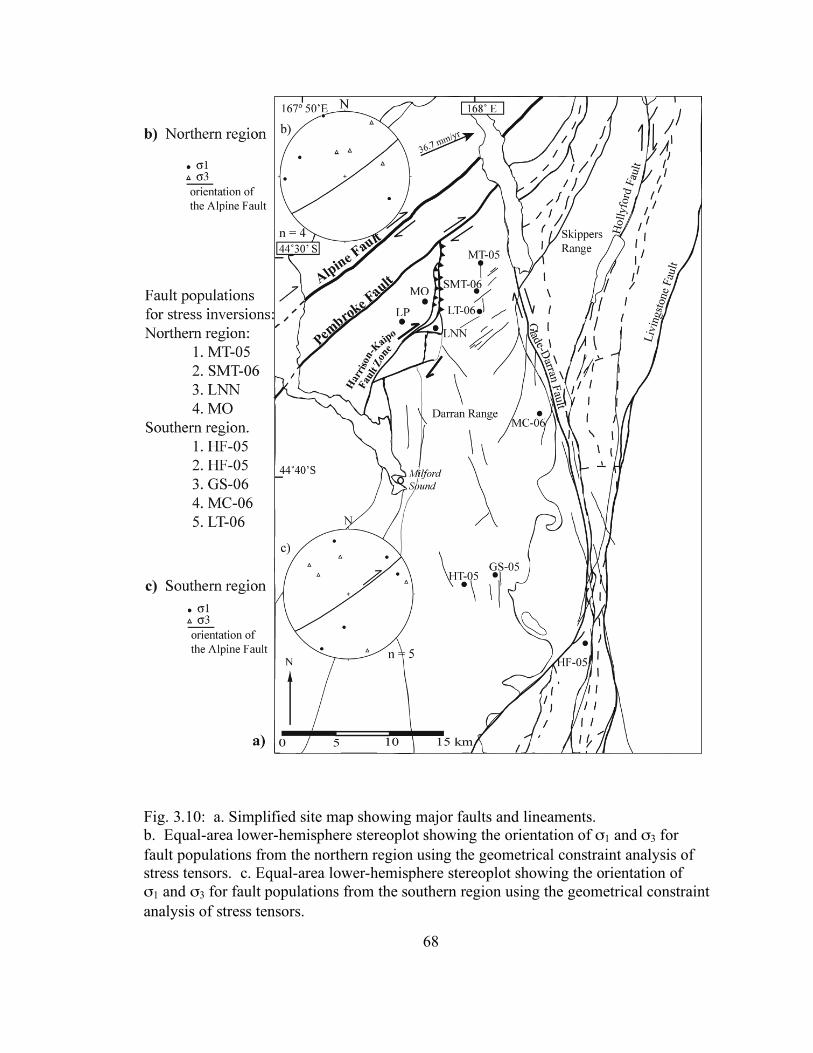
68
Fig. 3.10: a. Simplified site map showing major faults and lineaments. b. Equal-area lower-hemisphere stereoplot showing the orientation of σ1 and σ3 for fault populations from the northern region using the geometrical constraint analysis of stress tensors. c. Equal-area lower-hemisphere stereoplot showing the orientation of σ1 and σ3 for fault populations from the southern region using the geometrical constraint analysis of stress tensors.

69
5.3 Results using the friction constraint
Stress tensors analyzed using the frictional constraint are shown in Figure 3.9.
Results of the frictional constraint experiment for the fault population from the northern
region (Fig. 3.9 A) show σ1 plunging moderately to the west, and σ3 plunging moderately
to the northeast (Fig. 3.9 B). The orientation of the principle stresses is consistent with
the results from the geometric constraint analysis. However, results from the northern
region indicate that the frictional settings used for the southern region are not adequate to
activate faults in the northern population. The results shown in Figure 3.9 C are from
analysis using µ = 0.60, which is the same friction coefficient used for the southern
region. However, because all of the faults plot below sc′ = 1.00 on Figure 3.9 C, these
faults cannot be reactivated by the stress tensor at µ = 0.60. However, reducing the
friction coefficient to an extremely low value of µ = 0.10 allows all faults to be
reactivated by the stress tensor (Fig. 3.9 F). Using a lower coefficient of friction does not
significantly change the resulting orientation of the principle stresses (Fig. 3.9 B, E), and
suggests that the primary differences are in the deformation conditions in the northern
region, and not in the orientation of the stress fields.
The stress solution for the fault population (Fig. 3.9 G) for the southern region has σ1
in the northeast (Fig. 3.9 H), which is in good agreement with the majority of the stress
solutions determined from the geometric constraint analysis. The σ3 axis plunges gently
toward the northwest for the southern fault population, also in good agreement with
geometric results. All of the faults for the southern stress solution plot between sc′ = 0.68
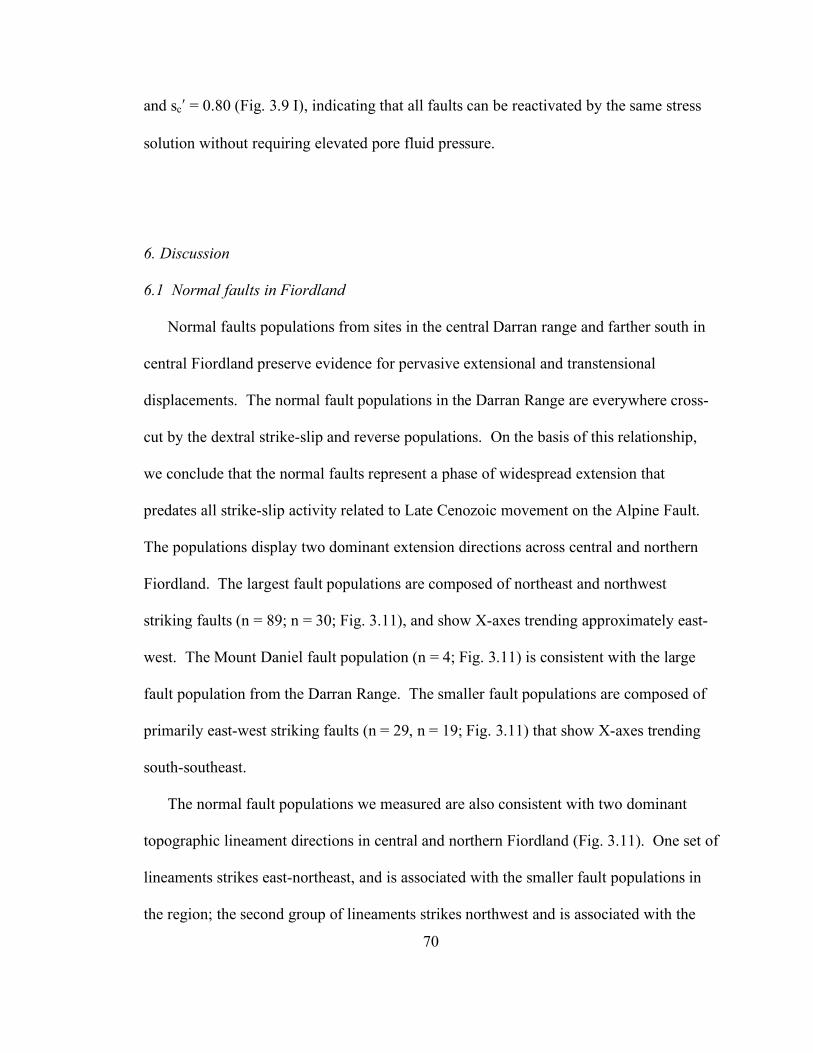
70
and sc′ = 0.80 (Fig. 3.9 I), indicating that all faults can be reactivated by the same stress
solution without requiring elevated pore fluid pressure.
6. Discussion
6.1 Normal faults in Fiordland
Normal faults populations from sites in the central Darran range and farther south in
central Fiordland preserve evidence for pervasive extensional and transtensional
displacements. The normal fault populations in the Darran Range are everywhere cross-
cut by the dextral strike-slip and reverse populations. On the basis of this relationship,
we conclude that the normal faults represent a phase of widespread extension that
predates all strike-slip activity related to Late Cenozoic movement on the Alpine Fault.
The populations display two dominant extension directions across central and northern
Fiordland. The largest fault populations are composed of northeast and northwest
striking faults (n = 89; n = 30; Fig. 3.11), and show X-axes trending approximately east-
west. The Mount Daniel fault population (n = 4; Fig. 3.11) is consistent with the large
fault population from the Darran Range. The smaller fault populations are composed of
primarily east-west striking faults (n = 29, n = 19; Fig. 3.11) that show X-axes trending
south-southeast.
The normal fault populations we measured are also consistent with two dominant
topographic lineament directions in central and northern Fiordland (Fig. 3.11). One set of
lineaments strikes east-northeast, and is associated with the smaller fault populations in
the region; the second group of lineaments strikes northwest and is associated with the
71
larger fault populations. There is no obvious cross-cutting relationship between the two
lineament groups, but it is unlikely that the two populations developed simultaneously
due to the poor agreement between extension axes of the associated fault populations. It
may be possible to distinguish the timing of the two populations with further mapping
and an analysis of fault populations at the outcrop-scale.
Fig. 3.11: A DEM (derived from NZMS 260 data) showing the central and northern Fiordland region with fault-plane solutions for normal fault populations. Solid lines are measured or known fault traces; dashed lines show major topographic lineaments.
72
A comparison of extensional directions indicated by the normal faults we measured
with pre-Late Cenozoic strain patterns suggest that the faults may be associated with
periods of Cretaceous and early Tertiary faulting. The south-southeast extension direction
indicated by the smaller group of faults is relatively consistent with north-south opening
directions of the Te Anau and Waiau basins (Fig. 3.1 B) during the Early Oligocene
(Norris & Turnbull, 1993). This phase of basin creation was the final stage of pure
extension in Fiordland, which would suggest that the east-northeast striking fault
population is the younger of the two groups. The northwest-striking fault populations
show east-west trending extension axes. These populations may be associated with latest
Cretaceous extension (Walcott, 1998; Wood et al., 2000). The clockwise rotation of the
plate motion vector after the Cretaceous (Walcott, 1998) may have led to a similar
clockwise rotation in the extension directions for preserved normal fault populations in
Fiordland from east-west to south-southeast.
6.2 The evolution of the stress field in the Darran Range
The average kinematic solutions we obtain from the Darran range show several
distinctive styles of displacements within northern Fiordland. Predominantly reverse and
oblique-slip fault populations occur within ~10 km of the plate boundary in the Darran
leucogabbro. The Z-axes associated with these faults plunge shallowly to the northwest
at high angles to the general northeasterly strike of the Alpine and Pembroke faults.
These Z-axes are in relatively good agreement with the orientation of both σ1 axes from
stress inversions and P-axes determined for local earthquakes (Fig. 3.12 A). All data sets
show reverse and oblique senses of slip (Moore et al., 2000). This compatibility does not
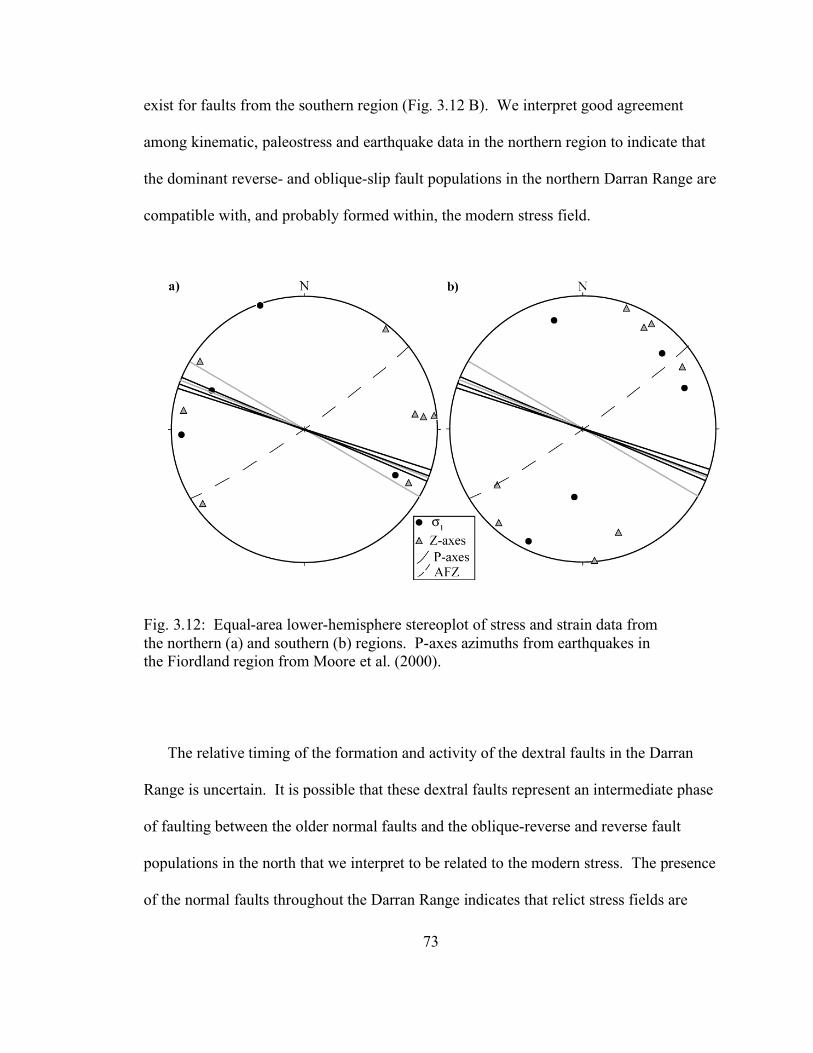
73
exist for faults from the southern region (Fig. 3.12 B). We interpret good agreement
among kinematic, paleostress and earthquake data in the northern region to indicate that
the dominant reverse- and oblique-slip fault populations in the northern Darran Range are
compatible with, and probably formed within, the modern stress field.
Fig. 3.12: Equal-area lower-hemisphere stereoplot of stress and strain data from the northern (a) and southern (b) regions. P-axes azimuths from earthquakes in the Fiordland region from Moore et al. (2000).
The relative timing of the formation and activity of the dextral faults in the Darran
Range is uncertain. It is possible that these dextral faults represent an intermediate phase
of faulting between the older normal faults and the oblique-reverse and reverse fault
populations in the north that we interpret to be related to the modern stress. The presence
of the normal faults throughout the Darran Range indicates that relict stress fields are
74
preserved in northern Fiordland, suggesting that the preservation of an intermediate stress
field is also possible. There was a phase of purely dextral strike-slip motion along the
plate boundary between ~20 and 10 Ma (Sutherland, 1995; Lamarche et al., 1997;
Walcott, 1998), and it is possible that these strike-slip faults are related to this phase of
motion. Additionally, Z-axes from strike-slip fault populations show clockwise rotation
from the south to the north, recording a rotation of the stress field, which is consistent
with a clockwise rotation of the plate motion vector (Walcott, 1998).
An alternative interpretation is that the dextral faults are concurrently active with the
oblique and reverse faults in the northern region, and that they represent further
partitioning of the stress field away from the Alpine Fault. There is deformation
partitioning within the northern region, which indicates that additional partitioning may
occur in the response to the modern stress field away from the plate boundary. P-axes
from earthquakes along the plate boundary show clockwise rotation from the Puysegur
Trench north to Fiordland (Moore et al., 2000), indicating that that modern stress field is
not homogeneous at all locations along the plate boundary.
Our preferred interpretation is that the formation of the steep dextral faults reflects an
intermediate stress field associated with transform motion along the plate boundary. We
also suggest that vertical motion on these steep faults is related to reactivation due to the
modern stress field. The clockwise rotation of Z-axes determined from the dextral fault
populations is consistent with the direction of rotation of the plate motion, which we
interpret to signify that the dextral faults formed in an older stress field. Several faults
that show vertical motion have more than one set of striae, suggesting reactivation of
these faults. Restricting the presence of the modern stress field to within ~10 km of the
75
plate boundary does not agree well with previous work documenting uplift and
shortening across the South Island (Norris et al., 1990; Pearson, 1998; Markley & Norris,
1999; Moore et al., 2000; Little et al., 2002a). Therefore we do not suggest that the
modern stress field is restricted to this zone in northern Fiordland. We propose that the
majority of strain due to the modern stress field is concentrated within ~10 km of the
plate boundary, but that the older dextral faults have been locally reactivated to
accommodate uplift related to transpression along the plate boundary. This is consistent
with the model suggested by Sutherland et al. (2006), who suggest that strain is contained
within several kilometers of the plate boundary, and that remaining strain and uplift may
be due to distributed shortening within the lithosphere.
6.3 Fluid infiltration and strain-induced weakening of the crust
There is evidence for fluid-assisted faulting in the northern deformation zone of the
Darran Range. Our analyses show that fault populations from the northern region cannot
be activated under the conditions characteristic for most rocks in the upper crust, which
include an internal friction angle of 31º and a coefficient of friction of µ = 0.60 (Byerlee,
1978; Burg et al., 2005; Célérier, personal communication, 2006). This result contrasts
with the fault populations in the southern region where hydrostatic values of these
parameters allow faulting to occur in the observed patterns. By changing the coefficient
of friction to µ = 0.10, we effectively increase the pore fluid pressure for the populations
(Eq. (3.4)). Increasing the role of pore fluid pressure in the northern region allows the
fault populations to move simultaneously, and suggests that fluid infiltration played a
76
significant role in deformation. This interpretation is supported by the presence of fluid
in veins and hydrous mineral phases in thin section from Mount Thunder (MT-05).
We interpret this difference in activity to indicate that the fault populations in the
northern region experienced different deformation conditions than populations farther
south. Conditions in the northern region include alteration to greenschist facies, the
presence of earlier deformation fabrics, and fluid infiltration. Fluid infiltration in the
northern region is supported by evidence of elevated pore fluid pressure due to water
migration from metamorphism in the lower crust, which Stern et al. (2001) interpret from
a low seismic velocity zone under the Southern Alps. Although these results are on a
different spatial and temporal scale than this study, they support the evidence from this
work for elevated pore fluid pressure. Elevated fluid pressure in the region acts to reduce
the amount of work required to deform the crust near the Alpine Fault Zone. Because the
fault patterns present in the northern deformation zone are consistent with fault
populations predicted for dextral transpression, the faults do not require fluid-induced
weakening to explain their orientation. However, the fault populations do require a
weakening mechanism to induce movement on the dominant faults (Fig. 3.9 C).
The presence of fluid and the probability of high pore fluid pressure near the Alpine
Fault serves to localize strain due to the modern stress field to within ~10 km of the plate
boundary. This localization of strain due to fluid pressure weakens the strength of the
faults in the northern deformation zone, and suggests that the Alpine Fault near Milford
Sound is frictionally weak. Balfour et al. (2005) indicate that the Marlborough section of
the Australia-Pacific plate boundary is frictionally weak, with a coefficient of friction µ =
0.35, based on the orientation of calculated stress axes. This is consistent with the low
77
frictional strength indicated by the fault populations in the northern region of this study,
and is also consistent with low frictional strength of other New Zealand faults (µ = 0.17)
described by Liu & Bird (2002).
6.4 Strain localization and deformation partitioning
The Darran Range contains large-scale fault patterns that are characteristic of a
northern and a southern region. The northern zone is dominated by reverse, dextral
oblique-reverse, and dextral strike-slip fault populations that are compatible with the
modern stress field. Northeast striking fault populations shows mostly horizontal motion
and dextral strike-slip kinematics (e.g. Fig. 3.7 H), whereas north-south striking faults
show dominantly down-dip motion with reverse offset (e.g. Fig. 3.7 I) within ~8 km2
around Mount Thunder (MT-05). Z-axes for these two fault populations plot ~8º from
each other, and indicate that the kinematic response to similar compression directions is
being partitioned between fault populations of different orientations and different
kinematics in the northern region.
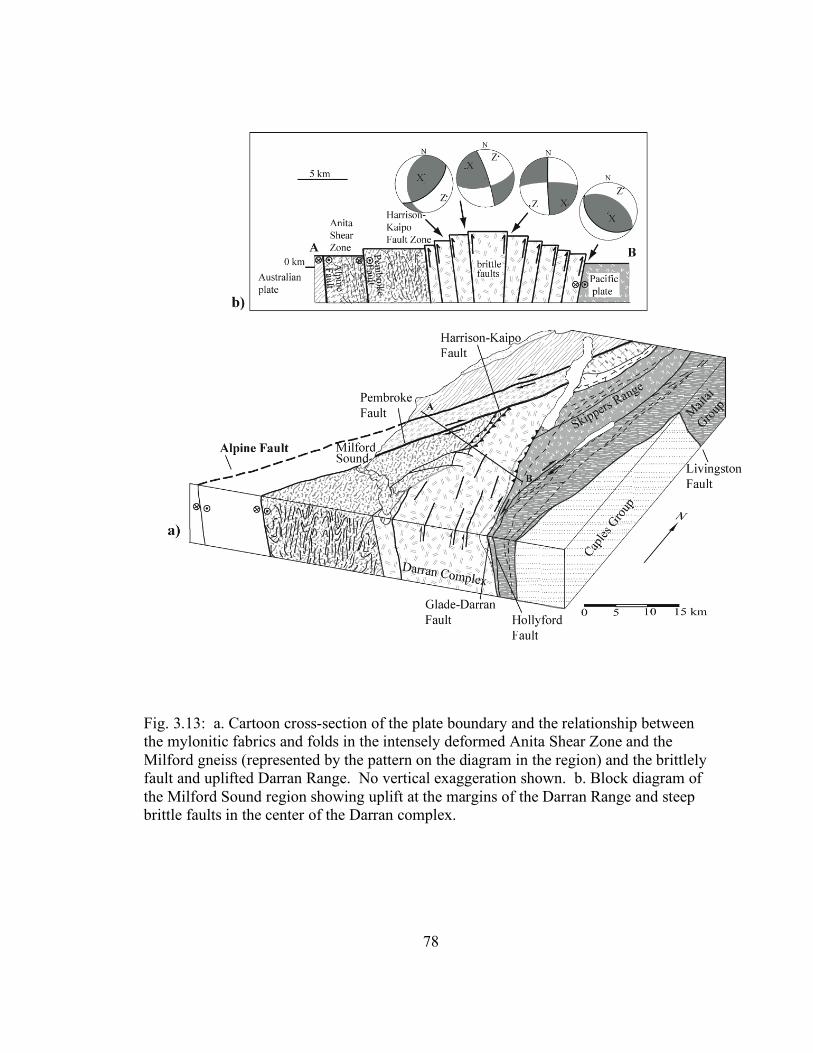
78
Fig. 3.13: a. Cartoon cross-section of the plate boundary and the relationship between the mylonitic fabrics and folds in the intensely deformed Anita Shear Zone and the Milford gneiss (represented by the pattern on the diagram in the region) and the brittlely fault and uplifted Darran Range. No vertical exaggeration shown. b. Block diagram of the Milford Sound region showing uplift at the margins of the Darran Range and steep brittle faults in the center of the Darran complex.
79
The near-boundary deformation zone is consistent with GPS surveys that indicate that
approximately 65% - 75% of the fault parallel motion and a variable proportion of
reverse motion is accommodated on the Alpine Fault, and that ~60% of the strain within
the South Island is concentrated within 20 km of the plate boundary (Norris & Cooper,
2001). Within Fiordland, approximately half of the relative plate motion is
accommodated between the west coast and the Waiau basin (Fig. 3.1 B) (Pearson, 1998).
A significant proportion of the remaining plate motion remains unaccounted for (~25% -
35%), and it is possible that a large portion of this motion is accommodated on strike-slip
features away from the Alpine Fault. Sutherland et al. (2006) suggest that reverse motion
is most significant near the plate boundary, which is consistent with our findings that the
majority of reverse faults are within the near-boundary deformation zone, and that the
large faults away from the Alpine Fault Zone record mostly strike-slip motion. We
suggest that strain is localized in this deformation zone partially due to weakening related
to the presence of enhanced fluid pressure, as discussed in the previous section.
The central and southern region of the Darran Range, outside of the near-boundary
deformation zone, preserve predominantly dextral-strike slip faults of uncertain age, and
subordinate thrust fault populations. The thrust populations are present at sites on the
eastern margin of the Darran Complex, and we interpret these reverse faults to indicate
that the Darran Range may be uplifted at the margins. The eastern margin of the range is
the Glade-Darran Fault, which is also a lithologic contact between the Darran Complex
and the Mistake Suite with the Brook Street Terrane to the east. A significant proportion
of reverse motion is accommodated on the Alpine Fault, but approximately 25 – 30% of
the motion remains unaccounted for (Norris & Cooper, 2001). We interpret that a
80
proportion of the remaining reverse motion may be localized as uplift at lithologic
contacts or rheological boundaries.
The style and geometry of deformation in the Darran Range contains elements that
are similar to styles described by Little et al. (2002a; Little et al., 2002b) in the central
region of the Alpine Fault Zone near the Franz Josef Glacier. Deformation near Milford
Sound is characterized by a steeply-dipping Alpine Fault, a zone of intense deformation
to the southeast of the plate boundary, and vertical motion and uplift on steep brittle
faults farther southeast (Fig. 3.13 A). The Alpine Fault is almost vertical near Milford
Sound, dipping between ~85 – 90º to the southeast (Moore et al., 2000, Eberhart-Phillips
& Reyners, 2001). The Anita Shear Zone and the Milford and Harrison gneisses,
between the Alpine Fault Zone and the Harrison-Kaipo Fault zone, form the 10 km-wide
zone near-boundary deformation zone (Blattner, 1991; Hill, 1995; Claypool et al., 2002).
The uplifted and exhumed rocks in this zone show mylonitization, foliation, and large-
scale folding, consistent with deformation farther north on the Alpine Fault (Little et al.,
2002a; Little et al., 2002b). Kinematic solutions and fault slip data indicate vertical
motion on steep faults in the central Darran Range, and uplift along the margins (Fig.
3.13 A). These features are similar to those described by Little et al. (2002a) within the
brittlely faulted region of the Alpine Fault in the center of the South Island.
Whereas schists in the center of the South Island are being uplifted by an “escalator-
like” motion along a fault ramp (Little et al, 2002a), the uplift in northern Fiordland is
accommodated through processes related to lithologic boundaries and the splay-like
geometry of the terrane boundary faults, such as the Glade-Darran and Hollyford faults
(Fig. 3.13 B). Reverse motion is localized at the eastern margin of the Darran Complex,
81
which is partially bounded by the Glade-Darran Fault, and results in the uplift of the
rheologically strong gabbros and diorites in the Darran Range. Additionally, the center
and southern Darran Range may be uplifted by vertical displacement on reactivated steep
faults that is kinematically linked to strike-slip motion due to the modern stress field. We
interpret the elevated topography of northern Fiordland and reverse motion to be related
to the extrusion and brittle wedge-like uplift of the Darran Range.
7. Conclusions
The majority of Tertiary reverse and oblique-reverse displacements in northern
Fiordland are localized with a ~10 km-wide near-boundary deformation zone to the
southeast of the Alpine Fault. This zone of proximal deformation is characterized by
fault populations of widely varying orientations, and there is evidence of fluid infiltration
and elevated pore fluid pressure. Outside of this zone, to within ~20 km, strike-slip and
vertical displacements are localized along lithologic boundaries and on reactivated steep
faults, leading to the uplift of the Darran Range. The majority of Tertiary fault
populations in northern Fiordland have dextral, dextral-oblique, and reverse sense of
motion, which is consistent with dextral transpression along the Alpine Fault.
Within the near-boundary deformation zone, contraction axes and σ1 axes trend
approximately 60º from the plate boundary, in relatively good agreement with P-axes
from earthquakes in the region. Fault populations in the deformation zone can only be
activated at a very low coefficient of friction (µ = 0.10), suggesting frictional weakening
due to elevated pore pressure. We interpret the elevated fluid pressure, combined with
the high angle between maximum compression directions and the northeasterly strike of

82
the plate boundary, to indicate that the Alpine Fault is relatively weak in the Milford
Sound region. This weakening is consistent with other studies of the Alpine Fault and
New Zealand that describe low frictional strength of faults. A relatively weak Alpine
Fault would indicate that the San Andreas Fault is not unique in its status as a weak plate
boundary fault, and further work on the frictional strength of large transpressional and
transtensional plate boundary faults would help to determine which processes control the
strength of crustal scale strike-slip faults.
Finally, fault patterns and cross-cutting relationships indicate the superposition of
several stress states preserved in Fiordland. These phases include an older extensional
regime, an intermediate or modern dextral phase of faulting, and reverse faults that are
compatible with the modern stress field.
83
Chapter IV: Discussion
1. Overview and conclusions
The results of this thesis address strain localization and fault-zone weakening
processes in the upper crust in northern Fiordland. This thesis contributes to the study of
transpression along the Alpine Fault, and to the growing literature on the frictional
strength of crustal-scale and plate boundary faults. I use field-based structural
observations and fault-slip data to characterize deformation patterns in the Darran Range
in northern Fiordland. Kinematic analysis and stress inversion of fault-slip data allowed
me to determine spatial patterns and the compatibility of stress fields and slip on
dominant fault populations in different regions. By combining field and modeling
techniques, I determined the mechanisms and processes that governed the structural
evolution of the upper crust in northern Fiordland.
The main result of this thesis is the description of a partitioning of deformation into
different zones with increasing distance from the plate boundary. These zones are
characterized by their dominant fault populations, and by the relative frictional strength
of the faults themselves. In the near-boundary zone, motion is partitioned between
distinct fault populations, whereas reactivated brittle faults in the southern zone
accommodate both oblique-reverse and strike-slip motion. In addition to the
documentation of deformation zones, this thesis also presents evidence for the
superposition of several distinctive stress fields in central and northern Fiordland that
correlate to different phases of motion.
Brittle fault populations in the near-boundary deformation zone are compatible with
the modern stress field, and consist of dominantly reverse, oblique-reverse, and dextral

84
strike-slip populations. These fault populations are also consistent with patterns
predicted for transpression. I interpret the variety of orientations and slip on fault planes
to indicate that the kinematic response to compression is partitioned among different fault
populations. Fault patterns and the frictional strength of the faults indicate that strike-slip
partitioning and fluid-induced weakening is more pronounced in the near-boundary
deformation zone. The variety and the frictional weakness of fault populations in this
zone is not widely recognized more than ~10 km to the southeast of the plate boundary. I
suggest that the near-boundary deformation zone is partially due to strain-induced
weakening from the presence of elevated pore fluid pressure in the region. The enhanced
fluid pressure significantly reduces the frictional strength of the dominant faults in the
upper crust, and may reduce the bulk strength of the crust near the Alpine Fault. Away
from the plate boundary, vertical and oblique-reverse motion is localized on lithologic
boundaries, and strike-slip, oblique-reverse, and vertical motion reactivates steep, brittle
faults.
In addition to the results of this work that describe strain partitioning and crustal
strength, brittle faults in central and northern Fiordland preserve evidence for the
superposition of several stress fields. Large normal faults are everywhere cut by steep
dextral and reverse faults, and these normal faults correlate well with two major
topographic lineament orientations in the region. The two normal fault populations
predate recent Tertiary movement, and may be associated with faulting related to Late
Cretaceous and Early Tertiary extension.
The results of this work are consistent with other studies that describe distinct
deformation zones at regions farther north on the Alpine Fault. Additionally, several
85
other studies suggest that the crust around the Alpine Fault is relatively weak on the basis
of focal mechanism inversion and shear-wave splitting. The findings of this thesis
support these studies, and suggest that elevated pore fluid pressure may be partially
responsible for crustal weakening, in addition to inherited geologic structures.
This work suggests that elevated pore fluid pressure and frictional weakening of the
crust near the plate boundary are the dominant processes for strain localization in the
upper crust in northern Fiordland. The inherited sutured terrane structure of the plate
boundary region assists in the localization of strain along rheological and lithologic
boundaries, but it is not the most significant mechanism for deformation partitioning in
the upper crust. Inherited fabrics, such as the foliation and mylonitization seen in the
Anita Shear Zone and Harrison-Kaipo fault zone, may assist in localizing strain near the
plate boundary.
2. Future work
Future work on strain localization and crustal weakening in New Zealand should
focus on the relative extent of elevated pore fluid pressure, and on the influence of
inherited structures on strain partitioning. By comparing structures and deformation
mechanisms in Fiordland to those present at the northern end of the South Island, it may
be possible to test the relative importance of fluid infiltration. Because the Alpine Fault
off-sets the northern end of the Median Batholith and the sutured terranes, structural
analysis of the Nelson and Greymouth area of the South Island should produce similar
results to those of this study. Differences that may arise from such a study could have
86
significance regarding the important of fluid pressure, lithology, or the geometry of the
plate boundary.
Future work may also focus on the nature of the hydrous mineralogy in the near-
boundary deformation zone. Understanding the source of pore fluids in fault gouge,
veins, and in the host rock, and clarifying the deformation conditions of faulting may help
to describe the flow pattern of pore fluids through fault rocks. A better understanding of
the upper crustal flow paths of pore fluids could help us better understand the exhumation
of deep crustal rocks, as well as better understand the regional extent of elevated pore
fluid pressure.
Finally, a study of the frictional strength of other obliquely convergent continental
plate boundary faults such as the North Anatolian Fault or the Altyn Tagh Fault in the
Himalaya may help to determine the prevalence of weak plate boundary faults. If the
Alpine Fault and the San Andreas Faults are relatively weak, it is possible that the
majority of large continental plate boundary faults are weak due elevated pore fluid
pressure. The presence of relatively weak plate boundary faults may explain the
continued reactivation of crustal-scale faults, even if they are not optimally oriented for
slip due to plate motion relative to the stress field.
87
Bibliography Abers, G., and Gephart, J., 2001. Direct inversion of earthquake first motions for both
the stress tensor and focal mechanisms and application to southern California, J. Geophys. Res., 106, n. B11, 26523-26540.
Adams, C. J., 1981. Uplift rates and thermal structure in the Alpine Fault Zone and
Alpine Schists, Southern Alps, New Zealand, from Thrust and Nappe Tectonics, eds. K. McClay & N. J. Price, Geol. Soc. London, Special Publication 9, pp. 221-222.
Allmendinger, R. W., Marrett, R. A., and Cladouhos, T., 1994. FaultKin v. 4.3.5. A
program for analyzing fault-slip data on a Macintosh computer. © Absoft Corp., 1988-2004.
Anderson, H., Webb, T., and Jackson, J., 1993. Focal mechanisms of large earthquakes
in the South Island of New Zealand: implications for the accommodation of Pacific-Australia plate motion, Geophys. J. Int., 115, 1032-1054.
Angelier, J., 1975. Sur l’analyse de mesures recueillies dans des sites faillés: l’utilité
d’une confrontation entre les méthodes dynamiques et cinématiques, C. R. Acad. Sci., Ser. D, 281, 1805-1808.
Angelier, J., 1979. Determination of the mean principal directions of stresses for a given
fault population, Tectonophysics, 55, T17-T26. Angelier, J., 1984. Tectonic analysis of fault slip data sets, J. Geophys. Res., 89, n. B7,
5835-5848. Angelier, J., 1994. Fault slip analysis and palaeostress reconstruction, in Continental
Deformation, ed. P. L. Hancock, pp. 53-100, Pergamon, Tarrytown, N.Y. Angelier, J., and Goguel, J., 1978. Sur une méthode simple de détermination des axes
principaux des contraintes pour une population de failles, C. R. Acad. Sci., Paris, Sér. D., 307-310.
Angelier, J., and Mechler, P., 1977. Sur une méthode graphique de recherché des
contraintes principales égalment utilisable en tectonique et en séismologie: la méthode des dièdres droits, Bull. Soc. Géol. France, 7, XIX, 6:1309-1318.
Balfour, N. J., Savage, M. K., and Townend, J., 2005. Stress and crustal anisotropy in
Marlborough, New Zealand: evidence for low fault strength and structure-controlled anisotropy, Geophys. J. Int., 163, 1073-1086.
88
Ballard, H. R., 1988. Permian arc volcanism and aspects of the general geology of the Skippers Range, NW Otago. Unpublished Ph.D. thesis, Geology Department, University of Otago, Dunedin, New Zealand
Barnes, P. M., Sutherland, R., and Delteil, J., 2005. Strike-slip structure and sedimentary
basins of the southern Alpine Fault, Fiordland, New Zealand, Geol. Soc. Am. Bulletin, 117, n. 3/4, 411-435.
Bergerat, F., Angelier, J., and Homberg, C., 2000. Tectonic analysis of the Husavik-
Flatey Fault (northern Iceland) and mechanisms of an oceanic transform zone, the Tjörnes Fracture Zone, Tectonics, 19, n. 6, 1161-1177.
Bishop, D. G., 1991. High-level marine terraces in western and southern New Zealand:
indicators of the tectonic tempo of an active continental margin, Soc. of Econ. Paleontologists and Mineralogists, Special Pub., 12, 69-78.
Bishop, D. G., 1992. Extensional tectonism and magmatism during the middle
Cretaceous to Paleocene, North Westland, New Zealand, N. Z. J. Geol. & Geophys., 35, 81-91.
Bishop, D. G., Blattner, P., and Landis, C. A., 1985. Provisional terrane map of South
Island, New Zealand, from Tectonostratigraphic Terranes of the Circum-Pacific Region, ed. D. G. Howell, AAPG Circum-Pacific Council for Energy and Mineral Resources Earth Science Series, no. 1, 515-521.
Bishop, D. G., and Laird, M. G., 1976. Stratigraphy and depositional environment of the
Kyeburn Formation (Cretaceous), a wedge of coarse terrestrial sediments in Central Otago, J. R. Soc. N. Z., 6, 55-71.
Blattner, P., 1978. Geology of the crystalline basement between Milford Sound and the
Hollyford valley, New Zealand, N. Z. J. Geol &. Geophys., 21, 33-47. Blattner, P., 1991. The North Fiordland transcurrent convergence, N. Z. J. Geol. &
Geophys., 34, 533-542. Bott, M. H. P., 1959. The mechanics of oblique slip faulting, Geol. Mag., 96, n. 2., 109-
117. Bradshaw, J. Y., 1989. Origin and metamorphic history of an Early Cretaceous polybaric
granulite terrain, Fiordland, southwest New Zealand, Contrib. Mineral. Petrol., 103, 346-360.
Bradshaw, J. Y., 1990. Geology of crystalline rocks of northern Fiordland: details of the
granulite facies Western Fiordland Orthogneiss and associated rock units, N. Z. J. Geol. & Geophys., 33, 465-484.
89
Brudy, M., Zoback, M. D., Fuchs, K., Rummel, F., and Baumgärtner, J., 1997.
Estimation of the complete stress tensor to 8 km depth in the KTB scientific drill holes: Implications for crustal strength, J. Geophys. Res., 102, n. B8, 18453-18475.
Buck, W. R., and Lavier, L. L., 2001. A tale of two kinds of normal faults: the
importance of strain weakening in fault development, from Non-Volcanic Rifting of Continental Margins: A Comparison of Evidence from Land and Sea, eds. R. C. L. Wilson, R. B. Whitmarsh, B. Taylor and N. Froitzheim, Geol. Soc. London, Special Publications, 187, pp. 289-303.
Bunds, M., 2001. Fault strength and transpressional tectonics along the Castle Mountain
strike-slip fault, southern Alaska, Geol. Soc. Am. Bulletin, 113, n. 7, 7908-919. Burg, J.-P., Célérier, B., Chaudhry, N. M., Ghazanfar, M., Gnehm, F., Schnellmann, M.,
2006. Fault analysis and paleostress evolution in large strain regions: methodological and geological discussion of the southeastern Himalayan fold-and-thrust belt in Pakistan, J. Asian Earth Sci., 24, 445-467.
Byerlee, J. D., 1978. Friction of rocks, Pure Appl. Geophys., 116, 615-626. Byerlee, J., 1990. Friction, overpressure and fault normal compression, Geophys. Res.
Lett., 17, n. 12., 2109-2112. Byerlee, J., 1992. The change in orientation of subsidiary shears near faults containing
pore fluid under high pressure, Tectonophysics, 211, 295-303. Célérier, B., 1988. How much does slip on a reactivated fault plane constrain the stress
tensor?, Tectonics, 7, no. 6, 1257-1278. Célérier, B., 2006. Fault slip and stress anaylsis (FSA), v. 28.5. Available through:
http://www.isteem.univ-mont2.fr/PERSO/celerier/software/fsa.html. Célérier, B., 2006. Personal communication, April – May. Cladouhos, T. T., and Allmendinger, R. W., 1993. Finite strain and rotation from fault
slip data, J. Struct. Geol., 15, 771-784. Claypool, A. L., Klepeis, K. A., Dockrill, B., Clarke, G. L., Zwingmann, H., and Tulloch,
A., 2002. Structure and kinematics of oblique convergence in northern Fiordland, New Zealand, Tectonophysics, 359, 329-358.
Coulomb, C. A., 1776. Sur une application des règles maximis et minimis à quelques
problèmes de statique relatifs à l’architecture, Acad. Sci. Paris Mém. Math. Phys., 7, 343-382.
90
Cunningham, D., 2005. Active intracontinental transpressional mountain building in the
Mongolian Altai: Defining a new class of orogen, Earth Plan. Sci. Lett., 240, n. 2, 436-444.
Czeck, D. M., and Hudleston, P. J., 2004. Physical experiments of vertical transpression
with localized nonvertical extrusion, J. Struct. Geol., 26, 573-581. Daczko, N. R., Klepeis, K. A., and Clarke, G. L., 2001. Evidence of Early Cretaceous
collisional-style orogenesis in northern Fiordland, New Zealand and its effects on the evolution of the lower crust, J. Struct. Geol., 23, 693-713.
DeMets, C., Gordon, R. G., Argus, D. F., and Stein, S., 1994. Effect of recent revisions
to the geomagnetic time scale on estimates of current plate motions, Geophys. Res. Lett., 21, n. 20, 2191-2194.
Donath, F. A., 1964. Strength variation and deformational behaviour in anisotropic rock,
in State of Stress in the Earth’s crust, ed. W. R. Rudd, pp. 280-298, American Elsevier, New York.
Doser, D. I., Webb, T. H., and Maunder, D. E., 1999. Source parameters of large
historical (1918-1962) earthquakes, South Island, New Zealand, Geophys. J. Int., 139, 769-794.
Eberhart-Phillips, D., 1995. Examination of seismicity in the central Alpine Fault region,
South Island, New Zealand, N. Z. J. Geol. & Geophys., 38, 571-578. Eberhart-Phillips, D., and Chadwick, M., 2002. Three-dimensional attenuation model of
the shallow Hikurangi subduction zone in the Raukumara Peninsula, New Zealand., J. Geophys. Res., 107, n. B2, 10.1029.
Eberhart-Phillips, D., and Reyners, M., 2001. A complex, young subduction zone
imaged by three-dimensional seismic velocity, Fiordland, New Zealand, Geophys. J. Int., 146, 731-746.
Etchecopar, A., Vasseur, G., and Daignieres, M., 1981. An inversion problem in
microtectonics for the determination of stress tensors from fault striation analysis, J. Struct. Geol., 3, n. 1, 51-65.
Fossen, H., and Tikoff, B., 1993. The deformation matrix for simultaneous simple
shearing, pure shearing and volume change, and its application to transpression-transtension tectonics, J. Struct. Geol., 15, 413-422.

91
Fossen, H., and Tikoff, B., 1998. Extended models of transpression and transtension, and application to tectonic settings, from Continental Transpressional and Transtensional Tectonic, eds. R. E. Holdsworth, R. A. Strachan, and J. F. Dewey, Geol. Soc. London, Special Publications, 135, pp. 15 – 33,
Gaina, C., Müller, D. R., Royer, J.-Y., Stock, J., Hardebeck, and Symonds, P., 1998. The
tectonic history of the Tasman Sea: a puzzle with 13 pieces, J. Geophys. Res., 103, n. B6, 12413-12433.
Gapais, D., Cobbold., P. R., Bourgeois, O., Rouby, D., and Urreiztieta, M. d., 2000.
Tectonic significance of fault-slip data, J. Struct. Geol., 22, 881-888. Gephart, J. W., 1990. Stress and the direction of slip on fault planes, Tectonics, 9, 845-
858. Gephart, J. W., and Forsyth, D. W., 1984. An improved method for determining the
regional stress tensor using earthquake focal mechanism data: Application to the San Fernando earthquake sequence, J. Geophys. Res., 89, n. B11, 9305-9320.
Gerbault, M., Davey, F., and Henrys, S., 2002. Three-dimensional lateral crustal
thickening in continental oblique collision: an example from the Southern Alps, New Zealand, Geophys. J. Int., 150, 770-779.
Ghisetti, F., 2000. Slip partitioning and deformation cycles close to major faults in
southern California: evidence from small-scale faults, Tectonics, 19, n. 1, 25-43. Gibson, G. M., 1990. Uplift and exhumation of middle and lower crustal rocks in an
extensional tectonic setting, Fiordland, New Zealand, from Exposed Cross-Sections of the Continental Crust, eds. M. H. Salisbury & D. M. Fountain, pp. 71 – 101, Kluwer, the Netherlands.
Gillard, D., and Wyss, M., 1995. Comparison of strain and stress tensor orientation:
Application to Iran and southern California, J. Geophys. Res., 100, n. B11, 22197-22213.
Gledhill, K., Robinson, R., Webb, T., Abercrombie, R., Beavan, J., Cousins, J., and
Eberhart-Phillips, D., 2000. The Mw 6.2 Cass, New Zealand earthquake of 24 November, 1995: Reverse faulting in a strike-slip region, N. Z. J. Geol. & Geophys., 43, 255-269.
Grapes, R., and Watanbe, T., 1992. Metamorphism and uplift of Alpine schist in the
Franz Josef-Fox Glacier area of the Southern Alps, New Zealand, J. Metam. Geol., 10, 171-180.
92
Grawinkel, A., and Stöckhert, B., 1997. Hydrostatic pore fluid pressure to 9 km depth – Fluid inclusion evidence from the KTB deep drill hole, Geophys. Res. Lett., 24, n. 24, 3273-3276.
Handin, J., 1966. On the Coulomb-Mohr failure criterion, J. Geophys. Res., 74, 5343-
5348. Harland, W. B., 1971. Tectonic transpression in Caledonian Spitsbergen, Geol. Mag.,
108, 27-42. Hickman, S. and Zoback, M., 2004. Stress orientations and magnitudes in the SAFOD
pilot hole, Geophys. Res. Lett., 31, L15S12. Hill, E. J., 1995. The Anita Shear Zone: a major, middle Cretaceous tectonic boundary in
northwestern Fiordland, N. Z. J. Geol. & Geophys., 38, 93-103. Holdsworth, R. E., 2004. Weak faults—rotten cores, Science, 303, 181-182. Hollis, J. A., Clarke, G. L., Klepeis, K. A., Daczko, N. R., and Ireland, T. R., 2004. The
regional significance of Cretaceous magmatism and metamorphism in Fiordland, New Zealand, from U-Pb zircon geochronology, J. Metam. Geol., 22, 607-627.
House, M. A., Gurnis, M., Kamp, P. J. J., and Sutherland, R., 2002. Uplift in the
Fiordland region, New Zealand: implications for incipient subduction, Science, 297, 2038-2041.
Howell, D. G., 1980. Mesozoic accretion of exotic terranes along the New Zealand
segment of Gondwana, Geology, 8, 487-491. Hubbert, M. K., and Rubey, W. W., 1959. Role of fluid pressure in mechanics of
overthrust faulting, Part 1, Geol. Soc. Am. Bulletin, 70, 115-166. Jaeger, J. C., 1960. Shear fracture of anisotropic rocks, Geol. Mag., 97, 65-72. Jones, R. R., Holdsworth, R. E., Bailey, W., 1997. Lateral extrusion in transpression
zones: the importance of boundary conditions, J. Struct. Geol., 19, 1201-1217. Jones, R. R., Holdsworth, R. E., Clegg, P., McCaffrey, K., and Tavarnelli, E., 2004.
Inclined transpression, J. Struct. Geol., 26, 1531-1548. Kimbrough, D. L., Tulloch, A. J., Coombs, D. S., Landis, C. A., Johnston, M. R., and
Mattinson, J. M., 1994. Uranium-lead zircon ages from the Median Tectonic Zone, New Zealand, N. Z. J. Geol. & Geophys., 37, 393-419.
93
King, D. S., 2006. Shear zone processes in the mid to lower crust and the structural evolution of central Fiordland, New Zealand. Unpublished M. Sc. thesis, Geology Department, University of Vermont, Burlington, Vermont.
Klepeis, K. A., Daczko, N. R., and Clarke, G. L., 1999. Kinematic vorticity and tectonic
significance of superposed mylonites in a major lower crustal shear zone, northern Fiordland, New Zealand, J. Struct. Geol., 21, 1385-1405.
Koons, P. O., 1987. Some thermal and mechanical consequences of rapid uplift: an
example from the Southern Alps, New Zealand, Earth and Plan. Sci. Lett., 86, 307-319.
Koons, P. O., Craw, D., Cox, S. C., Upton, P., Templeton, A. S., and Chamberlain, C. P.,
1998. Fluid flow during active oblique convergence: A Southern Alps model from mechanical and geochemical observation, Geology, 26, 159-162.
Koons, P. O., Norris, R. J., Craw, D., and Cooper, A. F., 2003. Influence of exhumation
on the structural evolution of transpressional plate boundaries: an example from the Southern Alps, New Zealand, Geology, 31, n. 1, 3-6.
Lachenbruch, A. H., and McGarr, A., 1990. Stress and heat flow, U.S. Geological Survey
Professional Paper, 1515, 261-277. Lachenbruch, A. H., and Sass, J. H., 1980. Heat flow and energetics of the San Andreas
fault zone, J. Geophys. Res., 85, n. B4, 6185-6223. Lachenbruch, A. H., and Sass, J. H., 1992. Heat flow from Cajon Pass, fault strength,
and tectonic implications, J. Geophys. Res., 97, 4995-5015. Laird, M. G., 1993. Cretaceous continental rifts: New Zealand region, in South Pacific
Sedimentary Basins. Sedimentary Basins of the World, 2, ed. P. F. Balance, pp. 37-49, Elsevier, Amsterdam.
Lamarche, G., Collot, J.-Y., Wood, R. A., Sosson, M., Sutherland, R., and Delteil, J.,
1997. The Oligocene-Miocene Pacific-Australian plate boundary, south of New Zealand: evolution from oceanic spreading to strike-slip faulting, Earth Planet. Sci. Lett., 148, 129-139.
Leitner, B., Eberhart-Phillips, D., Anderson, H., and Nabelek, J. L., 2001. A focused
look at the Alpine fault, New Zealand: seismicity, focal mechanisms, and stress observations, J. Geophys. Res., 106, n. B2, 2193-2220.
Lisle, R. J., and Srivastava, D. C., 2004. Test of frictional reactivation theory for faults
and validity of fault-slip analysis, Geology, 32, n. 7, 569-572.
94
Little, T. A., Holcombe, R. J., and Ilg, B. R., 2002a. Ductile fabrics in the zone of active oblique convergence near the Alpine Fault, New Zealand: identifying the neotectonic overprint, J. Struct. Geology, 24, 193-217.
Little, T. A., Holcombe, R. J., and Ilg, B. R., 2002b. Kinematics of oblique collision and
ramping inferred from microstructures and strain in middle crustal rocks, central Southern Alps, New Zealand, J. Struct. Geol., 24, 219-239.
Little, T. A., Savage, M. K., and Tikoff, B., 2005. Relationship between crustal finite
strain and seismic anisotropy in the mantle, Pacific-Australia plate boundary zone, South Island, New Zealand, Geophys. J. Int., 151, 106-116.
Liu, Z. and Bird, P., 2002. Finite element modeling of neotectonics in New Zealand, J.
Geophys. Res., 107, B12, 2328. Mackinnon, T. C., 1983. Origin of the Torlesse terrane and coeval rocks South Island,
New Zealand, Geol. Soc. Am. Bulletin, 94, 967-985. Malservisi, R., Furlong, K. P., and Anderson, H., 2003. Dynamic uplift in a
transpressional regime: numerical model of the subduction area of Fiordland, New Zealand, Earth Plan. Sci. Lett., 206, 349-364.
Marcotte, S. B., Klepeis, K. A., Clarke, G. L., Gehrels, G., and Hollis, J. A., 2005. Intra-
arc transpression in the lower crust and its relationship to magmatism in a Mesozoic magmatic arc, Tectonophysics, 407, 135-163.
Markley, M., and Norris, R. J., 1999. Structure and neotectonics of the Blackstone Hill
Antiform, central Otago, New Zealand, N. Z. J. Geol &. Geophys., 42, 205-218. Marrett, R., and Allmendinger, R. W., 1990. Kinematic analysis of fault-slip data, J.
Struct. Geol., 12, 973-986. Mattinson, J. M., Kimbrough, D. L., and Bradshaw, J. Y., 1986. Western Fiordland
orthogneiss: Early Cretaceous arc magmatism and granulite-facies metamorphism, New Zealand, Contrib. Mineral. Petrol., 92, 383-392.
McGinty, P., Reyners, M., and Robinson, R., 2000. Stress directions in the shallow part
of the Hikurangi subduction zone, New Zealand, from the inversion of earthquake first motions, Geophys. J. Int., 142, 339-350.
McKenzie, D. P., 1969. The relation between fault plane solutions for earthquakes and
the directions of the principal stresses, Bull. Seismol. Soc. Am., 59, 591-601. Michael, A. J., 1984. Determination of stress from slip data: faults and folds, J. Geophys.
Res., 89, 11517-11526.
95
Michael, A. J., 1987. The use of focal mechanisms to determine stress: a control study, J.
Geophys. Res., 92, n. B1, 357-368. Molnar, P., 1988. Continental tectonics in the aftermath of plate tectonics, Nature, 335,
131-137. Molnar, P., and Tapponnier, P., 1975. Cenozoic tectonics of Asia; Effects of a
continental collision, Science, 189, 419-426. Moore, M. A., Anderson, H. J., and Pearson, C., 2000. Seismic and geodetic constraints
on plate boundary deformation across the northern Macquarie Ridge and southern South Island of New Zealand, Geophys. J. Int., 143, 847-880.
Mortimer, N., Gans, P., Calvert, A., and Walker, N., 1999a. Geology and
thermochronometry of the east edge of the Median Batholith (Median Tectonic Zone): a new perspective on Permian to Cretaceous crustal growth of New Zealand, The Island Arc, 8, 404-425.
Mortimer, N., Hoernle, K., Hauff, F., Palin, J. M., Dunlap, W. J., Werner, R., and Faure,
K., 2006. New constraints on the age and evolution of the Wishbone Ridge, southwest Pacific Cretaceous microplates, and Zealandia-Antarctica breakup, Geology, 34, n. 3, 185-188.
Mortimer, N., Tulloch, A. J., Spark, R. N., Walker, N. W., Ladley, E., Allibone, A., and
Kimbrough, D. L., 1999b. Overview of the Median Batholith, New Zealand: a new interpretation of the geology of the Median Tectonic Zone and adjacent rocks, J. of African Earth Sci., 29, n.1, 257-268.
Mount, V., and Suppe, J., 1987. State of stress near the San Andreas fault: Implications
for wrench tectonics, Geology, 115, 1143-1146. Muir, R. J., Bradshaw, J. D., Weaver, S. D, and Ireland, T. R., 1994. Crustal extension
prior to the opening of the Tasman Sea Basin: evidence from New Zealand granites, from Evolution of the Tasman Sea: proceedings of a conference, Christchurch, Nov., eds. G. J. van der Lingen, K. M. Swanson & R. J. Muir, pp. 55 – 64, Balkema.
Muir, R. J., Weaver, S. D., Bradshaw, J. D., Eby, G. N., and Evans, J. A., 1995. The
Cretaceous Separation Point Batholith, New Zealand; granitoid magmas formed by melting of mafic lithosphere, J. Geol. Soc. Lond., 152, 689-701.
Norris, R. J., and Cooper, A. F., 1995. Origin of small-scale segmentation and
transpressional thrusting along the Alpine Fault, New Zealand, GSA Bulletin, 107, n. 2, 231-240.
96
Norris, R. J., and Cooper, A. F., 2001. Late Quaternary slip rates and slip partitioning on the Alpine Fault, New Zealand, J. Struct. Geol., 23, n. 2/3, 507-520.
Norris, R. J., Koons, P. O., and Cooper, A. F., 1990. The obliquely-convergent plate
boundary in the South Island of New Zealand: implications for ancient collisional zones, J. of Struct. Geol., 12, n. 5/6, 715-725.
Norris, R. J., and Turnbull, I. M., 1993. Cenozoic basins adjacent to an evolving
transform plate boundary, southwest New Zealand, from South Pacific Sedimentary Basins. Sedimentary Basins of the World, 2, ed. P. F. Ballance, pp. 251-270, Elsevier, Amsterdam.
Paterson, S. R., Miller, R. B., Alsleben, H., Whitney, D. L., Valley, P. M., and Hurlow,
H., 2004. Driving mechanisms for >40 km of exhumation during contraction and extension in a continental arc, Cascades core, Washington, Tectonics, 23, TC3005.
Pearson, C., 1998. Preliminary geodetic strain measurement from the south Fiordland
region of New Zealand using repeat GPS surveys: implications for subduction on the Puysegur Trench, J. Struct. Geol., 25, n. 16, 3185-3188.
Provost, A.-S., and Chéry, J., 2006. Relation between effective friction and fault slip rate
across the Northern San Andreas fault system, from Analogue and Numerical Modeling of Crustal-Scale Processes, eds. S. J. H. Buiter and G. Schreurs, Geol. Soc. London, Special Publications, 253, pp. 429-436.
Provost, A.-S., and Houston, H., 2001. Orientation of the stress field surrounding the
creeping section of the San Andreas Fault: evidence for a narrow mechanically-weak fault zone, J. of Geophys. Res., 106, n. B6, 11373-11386.
Reyners, M., 1989. New Zealand seismicity 1964–87: an interpretation, N. Z. J. Geol. &
Geophys., 32, 307-315. Reyners, M., and McGinty, P., 1999. Shallow subduction tectonics in the Raukumara
Peninsula, New Zealand, as illuminated by earthquake focal mechanisms, J. Geophys. Res., 104, n. B2, 3025-3034.
Reyners, M., Robinson, R., Pancha, A., and McGinty, P., 2002. Stresses and strains in a
twisted subduction zone—Fiordland, New Zealand, Geophys. J. Int., 148, 637-648. Rice, J. R., 1992. Fault stress states, pore pressure distributions, and the weakness of the
San Andreas fault, from Fault Mechanics and Transport Properties of Rocks, eds. B. Evans, T. F. Wong, pp. 475-504, Academic Press, New York.
Rutter, E. H., Holdsworth, R. E., and Knipe, R. J., 2001. The nature and tectonic
significance of fault-zone weakening: an introduction, from The Nature and Tectonic
97
Significance of Fault-Zone Weakening, eds. R. E. Holdsworth, R. A. Strachan, J. F. Magloughlin and R. J. Knipe, Geol. Soc. London, Special Publications, 186, pp. 1 – 11.
Saintot, A., and Angelier, J., 2002. Tectonic paleostress fields and structural evolution of
the NW-Caucasus fold-and-thrust belt from Late Cretaceous to Quaternary, Tectonophysics, 357, 1-31.
Saintot, A., Stephenson, R., Brem, A., Stovba, S., Privalov, V., 2003. Paleostress fields
reconstruction and revised tectonic history of the Donbas fold and thrust belt (Ukraine and Russia), Tectonics, 22, n. 5, 13-1 – 13-25.
Sanderson, D. J., and Marchini, W. R. D., 1984. Transpression, J. Struct. Geol., 6, 449-
458. Scholz, C. H., 2000a. Evidence for a strong San Andreas fault, Geology, 28, n. 2, 163-
166. Scholz, C. H., 2000b. A fault in the ‘weak San Andreas’ theory, Nature, 406, 234. Sibson, R., 1985. A note on fault reactivation, J. Struct. Geol., 7, 751-754. Simpson, G., 2001. Influence of compression-induced fluid pressure on rock strength in
the brittle crust, J. Geophys. Res., 106, n. B9, 19465-19478. Simpson, G. D., Cooper, A. F., Norris, R. J., and Turnbull, I. M., 1994. Late Quaternary
evolution of the Alpine Fault Zone at Paringa, South Westland, New Zealand, New Zealand J. of Geol. and Geophys., 37, 49-58.
Srivastava, D. C., and Sahay, A., 2003. Brittle tectonics and pore-fluid conditions in the
evolution of the Great Boundary Fault around Chittaugarh, northwestern India, J. Struct. Geol., 25, 1713-1733.
Stanislavksy, E., and Garven, G., 2002. The minimum depth of fault failure in
compressional environments, Geophys. Res. Lett., 29, n. 24, 2155. Stern, T., Kleffmann, S., Okaya, D., Scherwath, M., and Bannister, S., 2001. Low
seismic-wave speeds and enhanced fluid pressure beneath the Southern Alps of New Zealand, Geology, 29, n. 8, 679-682.
Stewart, M., Holdsworth, R. E., and Strachan, R. A., 2000. Deformation processes and
weakening mechanisms within the frictional-viscous transition zone of major crustal-scale faults: insights from the Great Glen Fault Zone, Scotland, J. Struct. Geol., 22, 543-560.
98
Suppe, J., 1985. Principles of structural geology, Prentice Hall, Englewood Cliffs, NJ. Sutherland, R., 1994. Displacement since the Pliocene along the southern section of the
Alpine fault, New Zealand, Geology, 22, 327-330. Sutherland, R., 1995a. The Australia-Pacific boundary and Cenozoic plate motions in the
SW Pacific: some constraints from Geosat data, Tectonics, 14, n. 4, 819-831. Sutherland, R., 1995b. Late Cenozoic tectonics in the SW Pacific, and development of
the Alpine Fault through the southern South Island, New Zealand. Unpublished Ph.D. thesis, Geology Department, University of Otago, Dunedin, New Zealand.
Sutherland, R., 1999. Cenozoic bending of the New Zealand basement terranes and
Alpine Fault displacement: a brief review, N. Z. J. Geol. & Geophys., 42, 295-301. Sutherland, R., Berryman, K., and Norris, R., 2006. Quaternary slip rate and
geomorphology of the Alpine Fault: implications for kinematics and seismic hazard in southwest New Zealand, GSA Bulletin, 118, n. 3/4, 464-474.
Sutherland, R., Davey, F., Beavan, J., 2000. Plate boundary deformation in South Island,
New Zealand, is related to inherited lithospheric structure, Earth Plan. Sci. Lett., 177, 141-151.
Sutherland, R., and Norris, R. J., 1995. Late Quaternary displacement rate,
paleoseismicity, and geomorphic evolution of the Alpine Fault: evidence from Hokuri Creek, South Westland, New Zealand, N. Z. J. Geol. & Geophys., 38, 419-430.
Teyssier, C., Tikoff, B., and Markley, M., 1995. Oblique plate motion and continental
tectonics, Geology, 23, n. 5, 447-450. Tikoff, B., and Teyssier, C., 1994. Strain modeling of displacement-field partitioning in
transpressional orogens, J. Struct. Geol., 16, 1575-1588. Tippett, J. M., and Kamp, P. J. J., 1993. Fission track analysis of the late Cenozoic
vertical kinematics of continental Pacific crust, South Island, New Zealand, J. Geophys. Res., 98, 16119-16148.
Townend, J., and Zoback, M. D., 2001. Implications of earthquake focal mechanisms for
the frictional strength of the San Andreas fault system, from The Nature and Tectonic Significance of Fault Zone Weakening, eds. R. E. Holdsworth, R. A. Strachan, J. F. Magloughlin, and R. J. Knipe, Geol. Soc. London, Special Publications, 186, pp. 13-21.
Townend, J., and Zoback, M. D., 2004. Regional tectonic stress near the San Andreas
fault in central and southern California, Geophys. Res. Lett., 31, L15S11.
99
Tulloch, A. J., and Kimbrough, D. L., 1989. The Paparoa metamorphic core complex,
New Zealand: Cretaceous extension associated with fragmentation of the Pacific margin of Gondwanaland, Tectonics, 8, 1217-1234.
Tulloch, A., J., Kimbrough, D. L., Landis, C. A., Mortimer, N., and Johnston, M. R.,
1999. Relationships between the Brook Street Terrance and Median Tectonic Zone (Median Batholith): evidence from Jurassic conglomerates, N. Z. J. Geol. & Geophys., 42, 279-293.
Turnbull, I. M., 2000. Geology of the Wakatipu Area, Institute of Geological & Nuclear
Sciences, Lower Hutt, NZ, 1:250000 geological map 18. Twiss, R. J., and Unruh, J. R., 1998. Analysis of fault slip inversion: do they constrain
stress or strain rate?, J. Geophys. Res., 103., n. B6, 12205-12222. Vandycke, S., 2002. Palaeostress records in Cretaceous formations in NW Europe:
extensional and strike-slip events in relationships with Cretaceous-Tertiary inversion tectonics, Tectonophysics, 357, 119-136.
Walcott, R. I., 1998. Modes of oblique compression: Late Cenozoic tectonics of the
South Island of New Zealand, Rev. Geophys., 36, 1-26. Wallace, R. E., 1951. Geometry of shearing stress and relation to faulting, J. Geol., 59,
118-130. Weissel, J. K., Hayes, D. E., and Herron, E. M., 1977. Plate tectonics synthesis: the
displacements between Australia, New Zealand, and Antarctica since the Late Cretaceous, Marine Geology, 25, 231-277.
Wellman, H. W., 1953. Data for the study of recent and late Pleistocene faulting in the
South Island of New Zealand, N. Z. J. Sci. Tech., 34, 270-288. West Jr., D. P., and Roden-Tice, M. K., 2003. Late Cretaceous reactivation of the
Norumbega Fault Zone, Maine: Evidence from apatite fission track ages, Geology, 31, n. 7, 649-652.
Williams, J. G., and Harper, C. T., 1978. Age and status of the Mackay Intrusives in the
Eglinton-upper Hollyford area, N. Z. J. Geol. & Geophys., 21, 733-742. Wilson, T., 1965. A new class of faults and their bearing on continental drift, Nature,
207, 343-347.
100
Wood, R., Herzer, R., Sutherland, R., and Melhuish, A., 2000. Cretaceous-Tertiary tectonic history of the Fiordland margin, New Zealand, N. Z. J. Geol. & Geophys., 43, 289-302.
Zoback, M. D., 2000. Strength of the San Andreas, Nature, 405, 31-32. Zoback, M. D., and Healy, J. H., 1992. In situ stress measurements to 3.5 km depth in
the Cajon Pass scientific research borehole: Implications for the mechanics of crustal faulting, J. Geophys. Res., 97, 5039-5057.
Zoback, M. D., Zoback, M. L., Mount, V., Eaton, J., Healy, J., Oppenheimer, D.,
Reasonberg, P., Jones, L., Raleigh, B., Wong, I., Scotti, O., and Wentworth, C., 1987. New evidence on the state of stress of the San Andreas fault system, Science, 238, 1105-1111.
Zoback, M. L., 1989. State of stress and modern deformation of the northern Basin and
Range province, J. Geophys. Res., 94, 7105-7128. Zoback, M. L., 1992. Stress field constraints on intraplate seismicity in eastern North
America, J. Geophys. Res., 97, 11761-11782.

101
Appendices:
Appendix A: Fault-slip data used for kinematic analysis Appendix B: Fault-slip data used for stress inversion with only geometric constraint
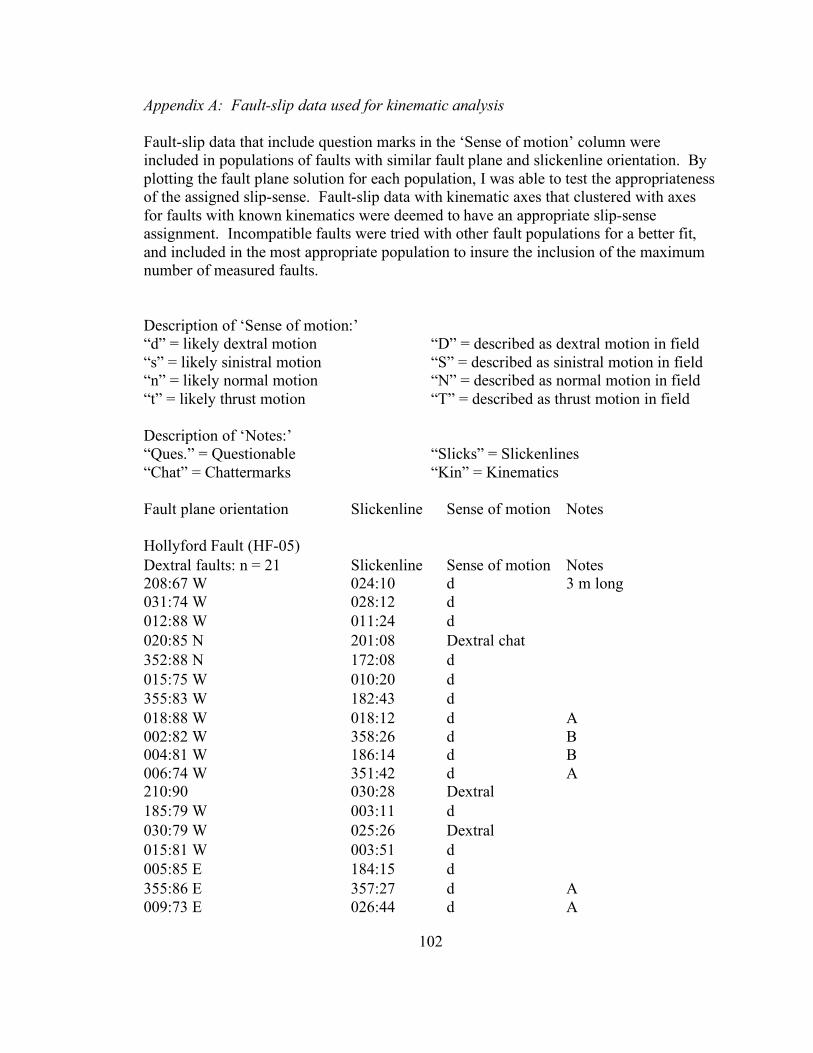
102
Appendix A: Fault-slip data used for kinematic analysis Fault-slip data that include question marks in the ‘Sense of motion’ column were included in populations of faults with similar fault plane and slickenline orientation. By plotting the fault plane solution for each population, I was able to test the appropriateness of the assigned slip-sense. Fault-slip data with kinematic axes that clustered with axes for faults with known kinematics were deemed to have an appropriate slip-sense assignment. Incompatible faults were tried with other fault populations for a better fit, and included in the most appropriate population to insure the inclusion of the maximum number of measured faults. Description of ‘Sense of motion:’ “d” = likely dextral motion “D” = described as dextral motion in field “s” = likely sinistral motion “S” = described as sinistral motion in field “n” = likely normal motion “N” = described as normal motion in field “t” = likely thrust motion “T” = described as thrust motion in field Description of ‘Notes:’ “Ques.” = Questionable “Slicks” = Slickenlines “Chat” = Chattermarks “Kin” = Kinematics Fault plane orientation Slickenline Sense of motion Notes Hollyford Fault (HF-05) Dextral faults: n = 21 Slickenline Sense of motion Notes 208:67 W 024:10 d 3 m long 031:74 W 028:12 d 012:88 W 011:24 d 020:85 N 201:08 Dextral chat 352:88 N 172:08 d 015:75 W 010:20 d 355:83 W 182:43 d 018:88 W 018:12 d A 002:82 W 358:26 d B 004:81 W 186:14 d B 006:74 W 351:42 d A 210:90 030:28 Dextral 185:79 W 003:11 d 030:79 W 025:26 Dextral 015:81 W 003:51 d 005:85 E 184:15 d 355:86 E 357:27 d A 009:73 E 026:44 d A
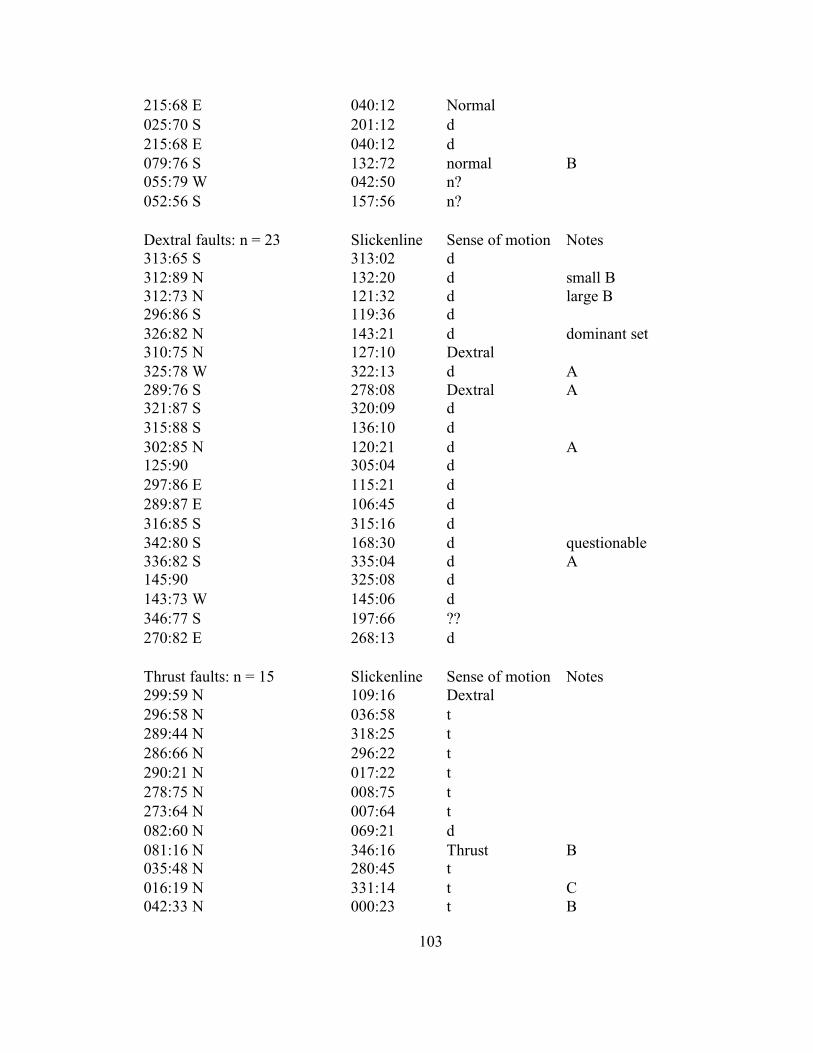
103
215:68 E 040:12 Normal 025:70 S 201:12 d 215:68 E 040:12 d 079:76 S 132:72 normal B 055:79 W 042:50 n? 052:56 S 157:56 n? Dextral faults: n = 23 Slickenline Sense of motion Notes 313:65 S 313:02 d 312:89 N 132:20 d small B 312:73 N 121:32 d large B 296:86 S 119:36 d 326:82 N 143:21 d dominant set 310:75 N 127:10 Dextral 325:78 W 322:13 d A 289:76 S 278:08 Dextral A 321:87 S 320:09 d 315:88 S 136:10 d 302:85 N 120:21 d A 125:90 305:04 d 297:86 E 115:21 d 289:87 E 106:45 d 316:85 S 315:16 d 342:80 S 168:30 d questionable 336:82 S 335:04 d A 145:90 325:08 d 143:73 W 145:06 d 346:77 S 197:66 ?? 270:82 E 268:13 d Thrust faults: n = 15 Slickenline Sense of motion Notes 299:59 N 109:16 Dextral 296:58 N 036:58 t 289:44 N 318:25 t 286:66 N 296:22 t 290:21 N 017:22 t 278:75 N 008:75 t 273:64 N 007:64 t 082:60 N 069:21 d 081:16 N 346:16 Thrust B 035:48 N 280:45 t 016:19 N 331:14 t C 042:33 N 000:23 t B
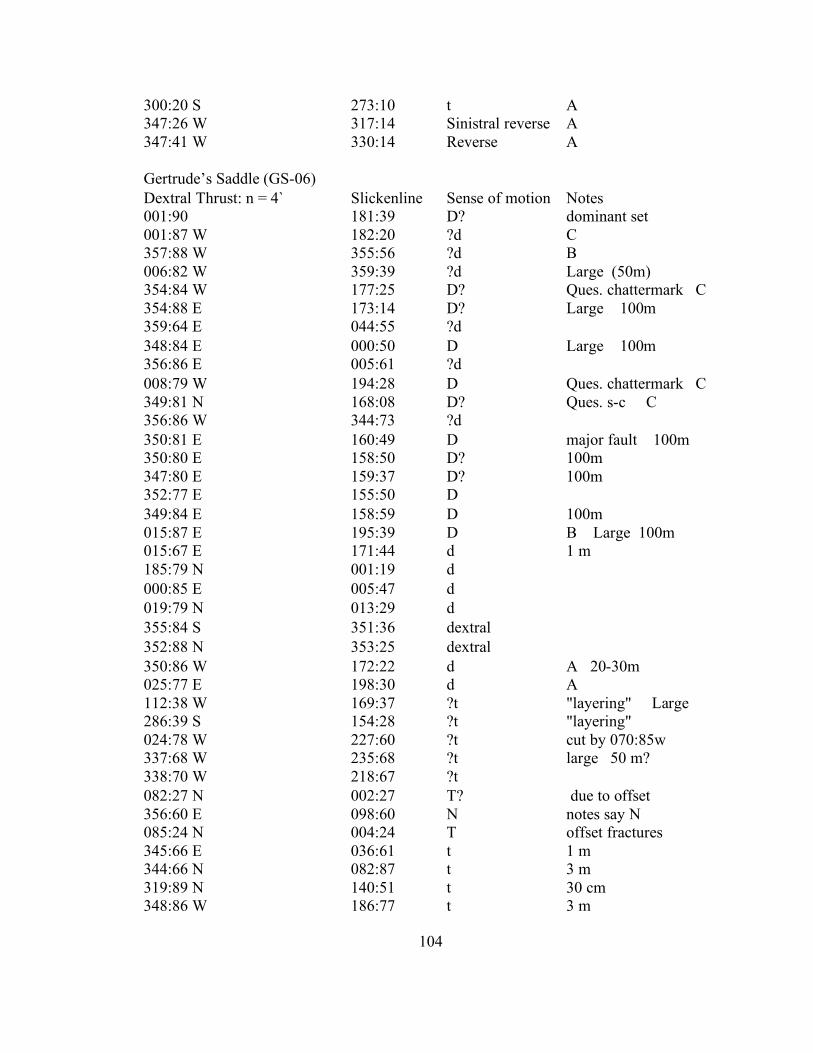
104
300:20 S 273:10 t A 347:26 W 317:14 Sinistral reverse A 347:41 W 330:14 Reverse A Gertrude’s Saddle (GS-06) Dextral Thrust: n = 4` Slickenline Sense of motion Notes 001:90 181:39 D? dominant set 001:87 W 182:20 ?d C 357:88 W 355:56 ?d B 006:82 W 359:39 ?d Large (50m) 354:84 W 177:25 D? Ques. chattermark C 354:88 E 173:14 D? Large 100m 359:64 E 044:55 ?d 348:84 E 000:50 D Large 100m 356:86 E 005:61 ?d 008:79 W 194:28 D Ques. chattermark C 349:81 N 168:08 D? Ques. s-c C 356:86 W 344:73 ?d 350:81 E 160:49 D major fault 100m 350:80 E 158:50 D? 100m 347:80 E 159:37 D? 100m 352:77 E 155:50 D 349:84 E 158:59 D 100m 015:87 E 195:39 D B Large 100m 015:67 E 171:44 d 1 m 185:79 N 001:19 d 000:85 E 005:47 d 019:79 N 013:29 d 355:84 S 351:36 dextral 352:88 N 353:25 dextral 350:86 W 172:22 d A 20-30m 025:77 E 198:30 d A 112:38 W 169:37 ?t "layering" Large 286:39 S 154:28 ?t "layering" 024:78 W 227:60 ?t cut by 070:85w 337:68 W 235:68 ?t large 50 m? 338:70 W 218:67 ?t 082:27 N 002:27 T? due to offset 356:60 E 098:60 N notes say N 085:24 N 004:24 T offset fractures 345:66 E 036:61 t 1 m 344:66 N 082:87 t 3 m 319:89 N 140:51 t 30 cm 348:86 W 186:77 t 3 m
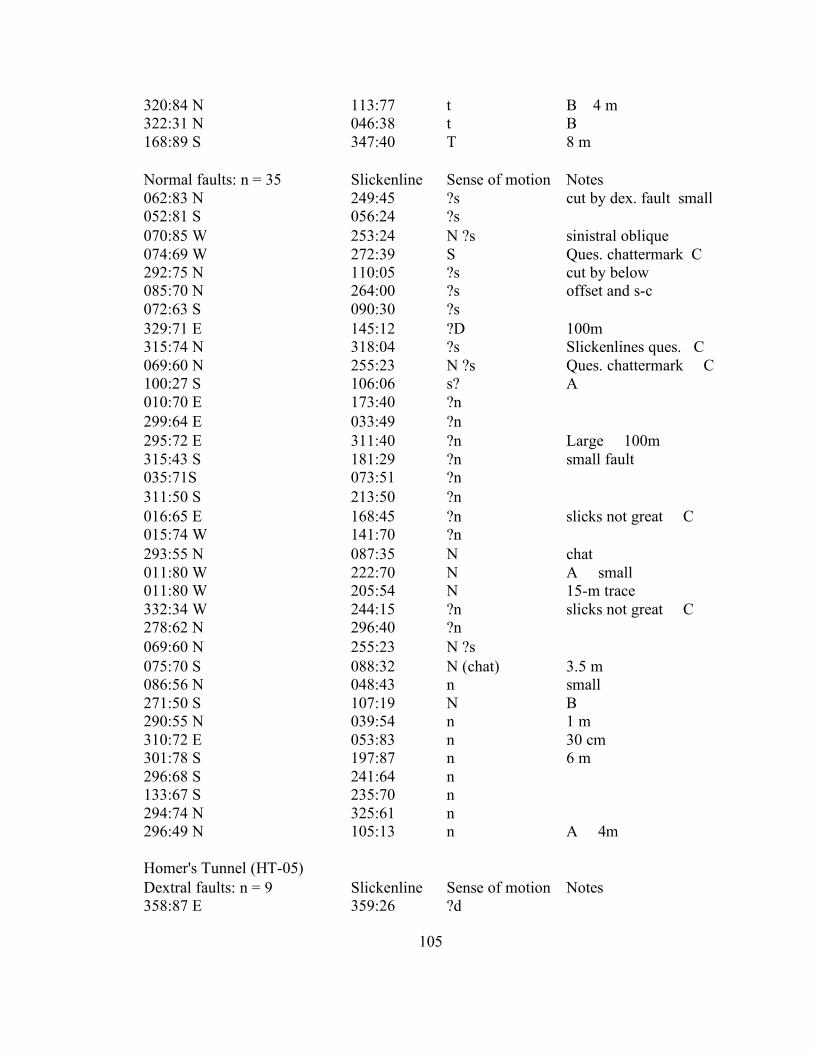
105
320:84 N 113:77 t B 4 m 322:31 N 046:38 t B 168:89 S 347:40 T 8 m Normal faults: n = 35 Slickenline Sense of motion Notes 062:83 N 249:45 ?s cut by dex. fault small 052:81 S 056:24 ?s 070:85 W 253:24 N ?s sinistral oblique 074:69 W 272:39 S Ques. chattermark C 292:75 N 110:05 ?s cut by below 085:70 N 264:00 ?s offset and s-c 072:63 S 090:30 ?s 329:71 E 145:12 ?D 100m 315:74 N 318:04 ?s Slickenlines ques. C 069:60 N 255:23 N ?s Ques. chattermark C 100:27 S 106:06 s? A 010:70 E 173:40 ?n 299:64 E 033:49 ?n 295:72 E 311:40 ?n Large 100m 315:43 S 181:29 ?n small fault 035:71S 073:51 ?n 311:50 S 213:50 ?n 016:65 E 168:45 ?n slicks not great C 015:74 W 141:70 ?n 293:55 N 087:35 N chat 011:80 W 222:70 N A small 011:80 W 205:54 N 15-m trace 332:34 W 244:15 ?n slicks not great C 278:62 N 296:40 ?n 069:60 N 255:23 N ?s 075:70 S 088:32 N (chat) 3.5 m 086:56 N 048:43 n small 271:50 S 107:19 N B 290:55 N 039:54 n 1 m 310:72 E 053:83 n 30 cm 301:78 S 197:87 n 6 m 296:68 S 241:64 n 133:67 S 235:70 n 294:74 N 325:61 n 296:49 N 105:13 n A 4m Homer's Tunnel (HT-05) Dextral faults: n = 9 Slickenline Sense of motion Notes 358:87 E 359:26 ?d

106
005:78 E 166:57 ?d 013:43 S 155:31 ?d Questionable C 014:20 S 122:19 ?d C 028:75 E 034:20 ?d 029:65 S 041:25 ?d 030:88 S 032:46 ?d 035:46 E 211:04 ?d 204:10 N 330:09 ?d Normal faults: n = 19 Slickenline Sense of motion Notes 056:19 S 101:14 T? kin via chattermarks 062:52 S 114:45 n? 072:54 S 226:31 n? 076:84 N 074:24 n? 079:26 S 026:20 n kin via chat. B 081:44 S 150:42 n? Questionable C 088:52 S 251:21 n? 102:30 S 140:20 n kin via chattermarks 269:81 N 085:23 n? 280:90 280:16 n? 25 m 284:21 S 152:16 n? B 289:42 N 080:24 n? B 121:62 S 137:27 n? 128:70 N 110:40 sin? Questionable C 132:84 N 129:24 n? 135:76 N 123:40 n? 308:40 S 126:09 n? 310:80 N 112:61 n kin via offset 320:84 E 085:83 n? Madeleine creek (MC-06) Dextral faults: n = 14 Slickenlines Sense of motion Notes 324:81 W 147:17 d? 330:76 W 151:02 D s-c B 336:79 E 342:29 d? D/t 329:71 E 337:22 d? 313:64 E 319:12 d? C 312:83 E 319:45 D/t 305:83 E 309:30 d? 339:68 N 147:26 D Questionable C 340:66 W 163:06 d? Questionable C 176:83 E 171:35 D 130:84 S 138:53 D A 315:85 E 126:59 t?
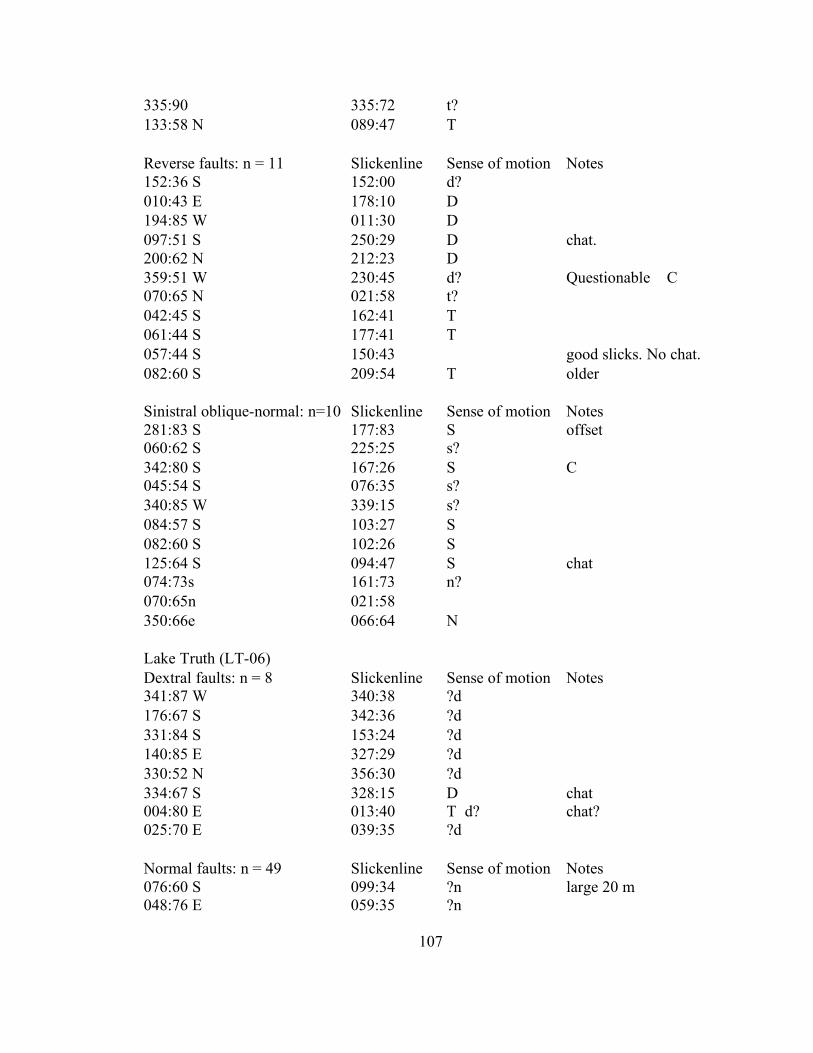
107
335:90 335:72 t? 133:58 N 089:47 T Reverse faults: n = 11 Slickenline Sense of motion Notes 152:36 S 152:00 d? 010:43 E 178:10 D 194:85 W 011:30 D 097:51 S 250:29 D chat. 200:62 N 212:23 D 359:51 W 230:45 d? Questionable C 070:65 N 021:58 t? 042:45 S 162:41 T 061:44 S 177:41 T 057:44 S 150:43 good slicks. No chat. 082:60 S 209:54 T older Sinistral oblique-normal: n=10 Slickenline Sense of motion Notes 281:83 S 177:83 S offset 060:62 S 225:25 s? 342:80 S 167:26 S C 045:54 S 076:35 s? 340:85 W 339:15 s? 084:57 S 103:27 S 082:60 S 102:26 S 125:64 S 094:47 S chat 074:73s 161:73 n? 070:65n 021:58 350:66e 066:64 N Lake Truth (LT-06) Dextral faults: n = 8 Slickenline Sense of motion Notes 341:87 W 340:38 ?d 176:67 S 342:36 ?d 331:84 S 153:24 ?d 140:85 E 327:29 ?d 330:52 N 356:30 ?d 334:67 S 328:15 D chat 004:80 E 013:40 T d? chat? 025:70 E 039:35 ?d Normal faults: n = 49 Slickenline Sense of motion Notes 076:60 S 099:34 ?n large 20 m 048:76 E 059:35 ?n
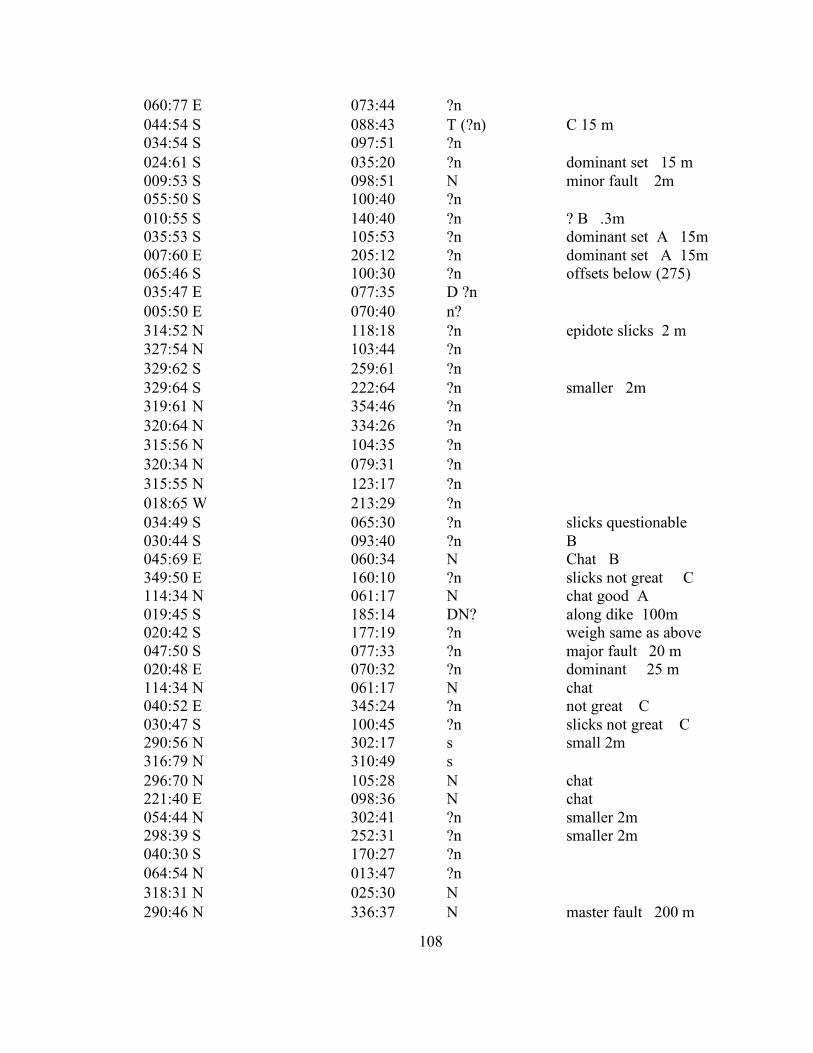
108
060:77 E 073:44 ?n 044:54 S 088:43 T (?n) C 15 m 034:54 S 097:51 ?n 024:61 S 035:20 ?n dominant set 15 m 009:53 S 098:51 N minor fault 2m 055:50 S 100:40 ?n 010:55 S 140:40 ?n ? B .3m 035:53 S 105:53 ?n dominant set A 15m 007:60 E 205:12 ?n dominant set A 15m 065:46 S 100:30 ?n offsets below (275) 035:47 E 077:35 D ?n 005:50 E 070:40 n? 314:52 N 118:18 ?n epidote slicks 2 m 327:54 N 103:44 ?n 329:62 S 259:61 ?n 329:64 S 222:64 ?n smaller 2m 319:61 N 354:46 ?n 320:64 N 334:26 ?n 315:56 N 104:35 ?n 320:34 N 079:31 ?n 315:55 N 123:17 ?n 018:65 W 213:29 ?n 034:49 S 065:30 ?n slicks questionable 030:44 S 093:40 ?n B 045:69 E 060:34 N Chat B 349:50 E 160:10 ?n slicks not great C 114:34 N 061:17 N chat good A 019:45 S 185:14 DN? along dike 100m 020:42 S 177:19 ?n weigh same as above 047:50 S 077:33 ?n major fault 20 m 020:48 E 070:32 ?n dominant 25 m 114:34 N 061:17 N chat 040:52 E 345:24 ?n not great C 030:47 S 100:45 ?n slicks not great C 290:56 N 302:17 s small 2m 316:79 N 310:49 s 296:70 N 105:28 N chat 221:40 E 098:36 N chat 054:44 N 302:41 ?n smaller 2m 298:39 S 252:31 ?n smaller 2m 040:30 S 170:27 ?n 064:54 N 013:47 ?n 318:31 N 025:30 N 290:46 N 336:37 N master fault 200 m
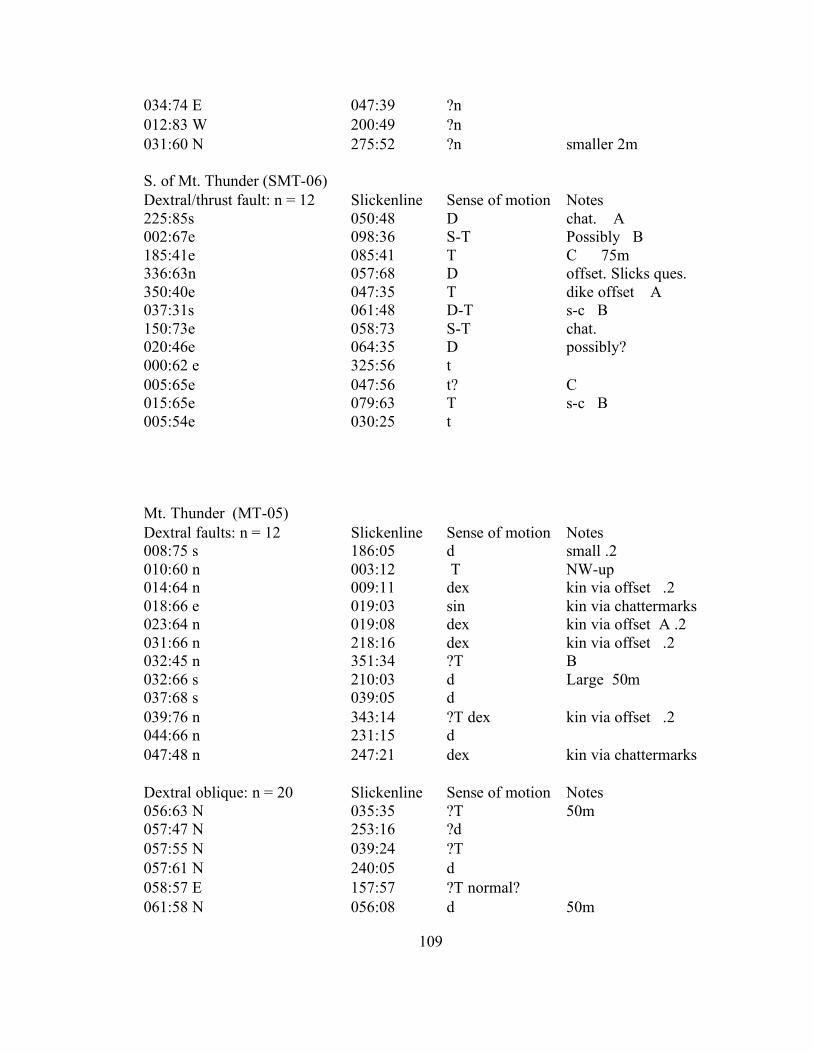
109
034:74 E 047:39 ?n 012:83 W 200:49 ?n 031:60 N 275:52 ?n smaller 2m S. of Mt. Thunder (SMT-06) Dextral/thrust fault: n = 12 Slickenline Sense of motion Notes 225:85s 050:48 D chat. A 002:67e 098:36 S-T Possibly B 185:41e 085:41 T C 75m 336:63n 057:68 D offset. Slicks ques. 350:40e 047:35 T dike offset A 037:31s 061:48 D-T s-c B 150:73e 058:73 S-T chat. 020:46e 064:35 D possibly? 000:62 e 325:56 t 005:65e 047:56 t? C 015:65e 079:63 T s-c B 005:54e 030:25 t Mt. Thunder (MT-05) Dextral faults: n = 12 Slickenline Sense of motion Notes 008:75 s 186:05 d small .2 010:60 n 003:12 T NW-up 014:64 n 009:11 dex kin via offset .2 018:66 e 019:03 sin kin via chattermarks 023:64 n 019:08 dex kin via offset A .2 031:66 n 218:16 dex kin via offset .2 032:45 n 351:34 ?T B 032:66 s 210:03 d Large 50m 037:68 s 039:05 d 039:76 n 343:14 ?T dex kin via offset .2 044:66 n 231:15 d 047:48 n 247:21 dex kin via chattermarks Dextral oblique: n = 20 Slickenline Sense of motion Notes 056:63 N 035:35 ?T 50m 057:47 N 253:16 ?d 057:55 N 039:24 ?T 057:61 N 240:05 d 058:57 E 157:57 ?T normal? 061:58 N 056:08 d 50m
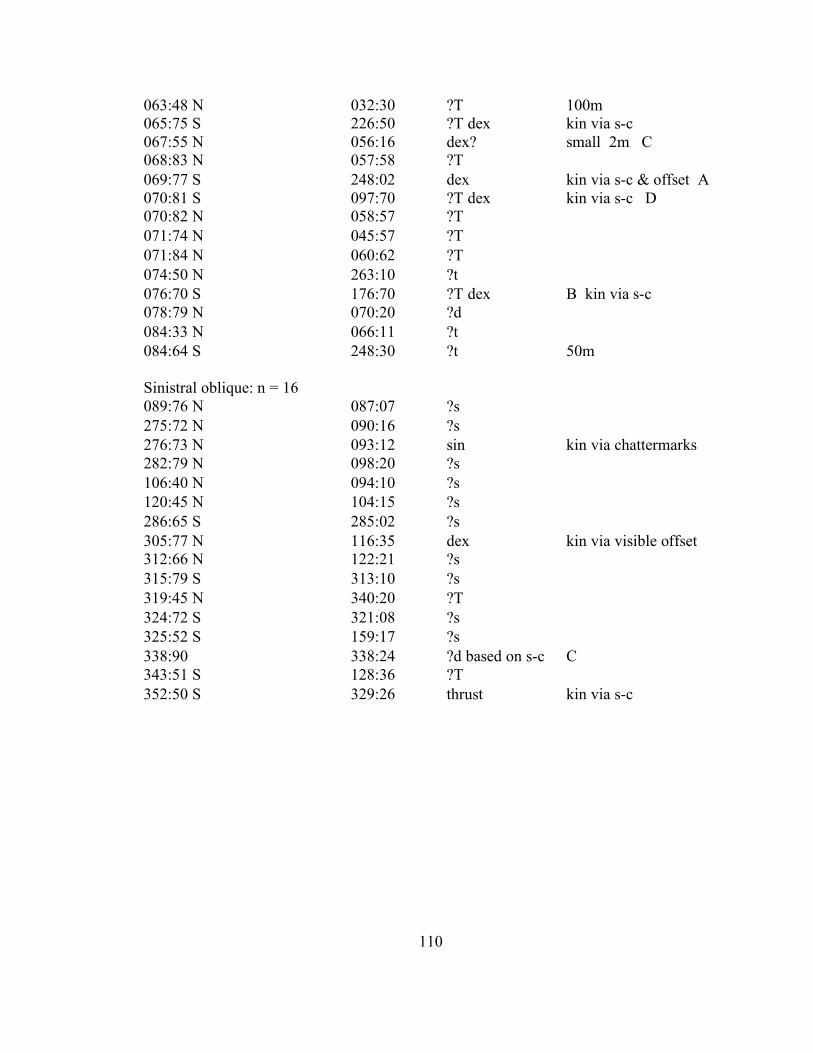
110
063:48 N 032:30 ?T 100m 065:75 S 226:50 ?T dex kin via s-c 067:55 N 056:16 dex? small 2m C 068:83 N 057:58 ?T 069:77 S 248:02 dex kin via s-c & offset A 070:81 S 097:70 ?T dex kin via s-c D 070:82 N 058:57 ?T 071:74 N 045:57 ?T 071:84 N 060:62 ?T 074:50 N 263:10 ?t 076:70 S 176:70 ?T dex B kin via s-c 078:79 N 070:20 ?d 084:33 N 066:11 ?t 084:64 S 248:30 ?t 50m Sinistral oblique: n = 16 089:76 N 087:07 ?s 275:72 N 090:16 ?s 276:73 N 093:12 sin kin via chattermarks 282:79 N 098:20 ?s 106:40 N 094:10 ?s 120:45 N 104:15 ?s 286:65 S 285:02 ?s 305:77 N 116:35 dex kin via visible offset 312:66 N 122:21 ?s 315:79 S 313:10 ?s 319:45 N 340:20 ?T 324:72 S 321:08 ?s 325:52 S 159:17 ?s 338:90 338:24 ?d based on s-c C 343:51 S 128:36 ?T 352:50 S 329:26 thrust kin via s-c

111
Appendix B: Fault-slip data used for stress inversion with only geometric constraint Hollyford Fault (HF-05) dextral population: 'HF 000 dextral' n = 8 'az' 'dip' 'dd' 'trend' 'quad' 'type' 'id'
208 67 'W' 24 'A' 'D' 1 31 74 'W' 28 'A' 'D' 2 15 75 'W' 10 'A' 'D' 6 18 88 'W' 18 'A' 'D' 8 4 81 'W' 186 'A' 'D' 10
185 79 'W' 3 'A' 'D' 13 355 86 'E' 357 'A' 'D' 18 25 70 'S' 201 'A' 'D' 20
Hollyford Fault (HF-05) dextral population: 'HF 100 dextral' n = 11 'az' 'dip' 'dd' 'trend' 'quad' 'type' 'id'
313 65 'S' 313 'A' 'D' 1 312 89 'N' 132 'A' 'D' 2 312 73 'N' 121 'A' 'D' 3 326 82 'N' 143 'A' 'D' 5 310 75 'N' 127 'A' 'D' 6 325 78 'W' 322 'A' 'D' 7 125 89 'N' 305 'A' 'D' 11 336 82 'S' 335 'A' 'D' 15 145 89 'W' 325 'A' 'D' 16 302 85 'N' 120 'A' 'D' 18 90 82 'S' 268 'A' 'D' 21
Gertrude’s Saddle (GS-06) dextral population: 'GS dextral’ n = 5 'az' 'dip' 'dd' 'trend' 'quad' 'type' 'id'
357 88 'W' 355 'A' 'D' 3 6 82 'W' 359 'A' 'D' 4 0 85 'E' 5 'A' 'D' 19
355 84 'S' 351 'A' 'D' 25 348 89 'S' 347 'A' 'I' 41
Homer’s Tunnel (HT-05) dextral population: 'HT dextral' n = 7 'az' 'dip' 'dd' 'trend' 'quad' 'type' 'id'
358 87 'E' 359 'A' 'D' 1 13 43 'S' 155 'A' 'D' 2 28 75 'E' 34 'A' 'D' 4 29 65 'S' 41 'A' 'D' 5
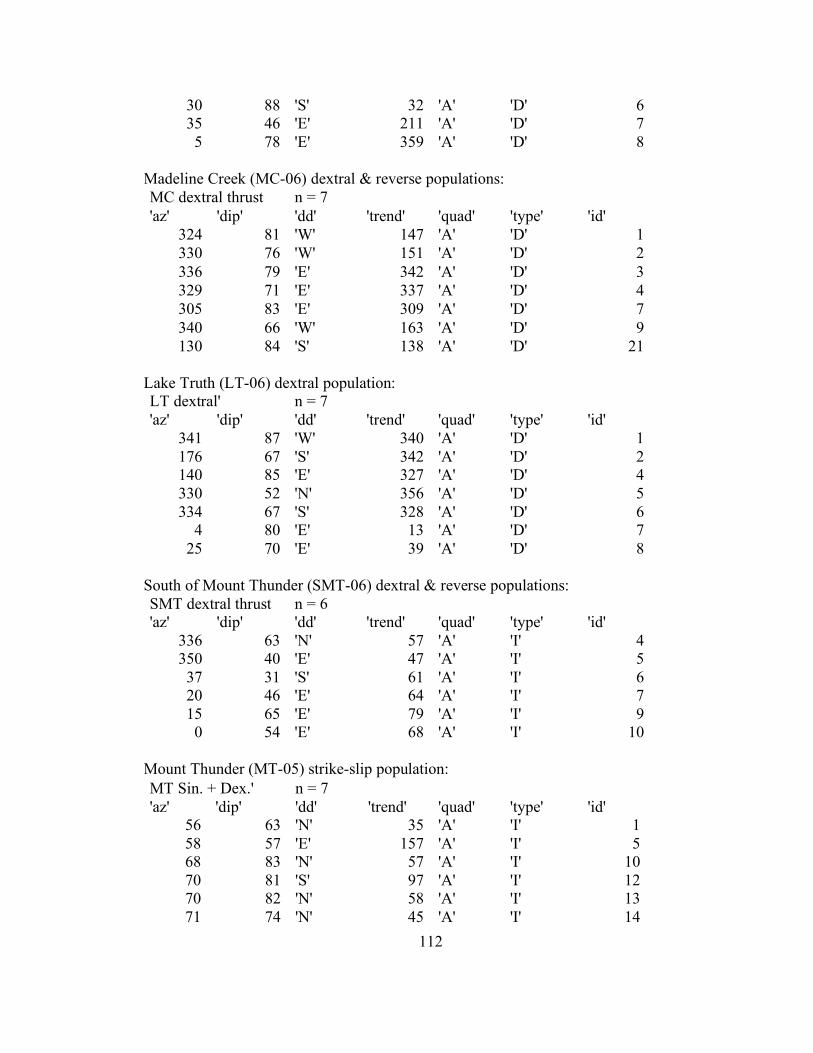
112
30 88 'S' 32 'A' 'D' 6 35 46 'E' 211 'A' 'D' 7 5 78 'E' 359 'A' 'D' 8
Madeline Creek (MC-06) dextral & reverse populations: MC dextral thrust n = 7 'az' 'dip' 'dd' 'trend' 'quad' 'type' 'id'
324 81 'W' 147 'A' 'D' 1 330 76 'W' 151 'A' 'D' 2 336 79 'E' 342 'A' 'D' 3 329 71 'E' 337 'A' 'D' 4 305 83 'E' 309 'A' 'D' 7 340 66 'W' 163 'A' 'D' 9 130 84 'S' 138 'A' 'D' 21
Lake Truth (LT-06) dextral population: LT dextral' n = 7 'az' 'dip' 'dd' 'trend' 'quad' 'type' 'id'
341 87 'W' 340 'A' 'D' 1 176 67 'S' 342 'A' 'D' 2 140 85 'E' 327 'A' 'D' 4 330 52 'N' 356 'A' 'D' 5 334 67 'S' 328 'A' 'D' 6
4 80 'E' 13 'A' 'D' 7 25 70 'E' 39 'A' 'D' 8
South of Mount Thunder (SMT-06) dextral & reverse populations: SMT dextral thrust n = 6 'az' 'dip' 'dd' 'trend' 'quad' 'type' 'id'
336 63 'N' 57 'A' 'I' 4 350 40 'E' 47 'A' 'I' 5 37 31 'S' 61 'A' 'I' 6 20 46 'E' 64 'A' 'I' 7 15 65 'E' 79 'A' 'I' 9 0 54 'E' 68 'A' 'I' 10
Mount Thunder (MT-05) strike-slip population: MT Sin. + Dex.' n = 7 'az' 'dip' 'dd' 'trend' 'quad' 'type' 'id'
56 63 'N' 35 'A' 'I' 1 58 57 'E' 157 'A' 'I' 5 68 83 'N' 57 'A' 'I' 10 70 81 'S' 97 'A' 'I' 12 70 82 'N' 58 'A' 'I' 13 71 74 'N' 45 'A' 'I' 14
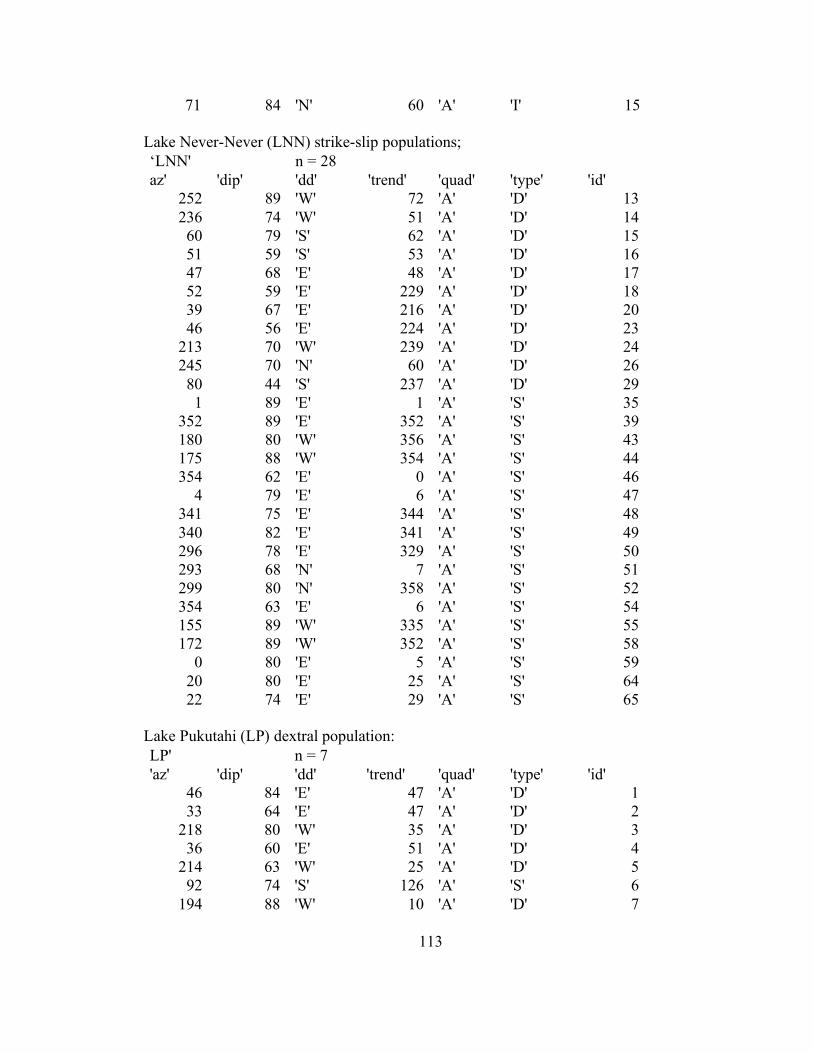
113
71 84 'N' 60 'A' 'I' 15 Lake Never-Never (LNN) strike-slip populations; ‘LNN' n = 28 az' 'dip' 'dd' 'trend' 'quad' 'type' 'id'
252 89 'W' 72 'A' 'D' 13 236 74 'W' 51 'A' 'D' 14 60 79 'S' 62 'A' 'D' 15 51 59 'S' 53 'A' 'D' 16 47 68 'E' 48 'A' 'D' 17 52 59 'E' 229 'A' 'D' 18 39 67 'E' 216 'A' 'D' 20 46 56 'E' 224 'A' 'D' 23
213 70 'W' 239 'A' 'D' 24 245 70 'N' 60 'A' 'D' 26 80 44 'S' 237 'A' 'D' 29 1 89 'E' 1 'A' 'S' 35
352 89 'E' 352 'A' 'S' 39 180 80 'W' 356 'A' 'S' 43 175 88 'W' 354 'A' 'S' 44 354 62 'E' 0 'A' 'S' 46
4 79 'E' 6 'A' 'S' 47 341 75 'E' 344 'A' 'S' 48 340 82 'E' 341 'A' 'S' 49 296 78 'E' 329 'A' 'S' 50 293 68 'N' 7 'A' 'S' 51 299 80 'N' 358 'A' 'S' 52 354 63 'E' 6 'A' 'S' 54 155 89 'W' 335 'A' 'S' 55 172 89 'W' 352 'A' 'S' 58
0 80 'E' 5 'A' 'S' 59 20 80 'E' 25 'A' 'S' 64 22 74 'E' 29 'A' 'S' 65
Lake Pukutahi (LP) dextral population: LP' n = 7 'az' 'dip' 'dd' 'trend' 'quad' 'type' 'id'
46 84 'E' 47 'A' 'D' 1 33 64 'E' 47 'A' 'D' 2
218 80 'W' 35 'A' 'D' 3 36 60 'E' 51 'A' 'D' 4
214 63 'W' 25 'A' 'D' 5 92 74 'S' 126 'A' 'S' 6
194 88 'W' 10 'A' 'D' 7
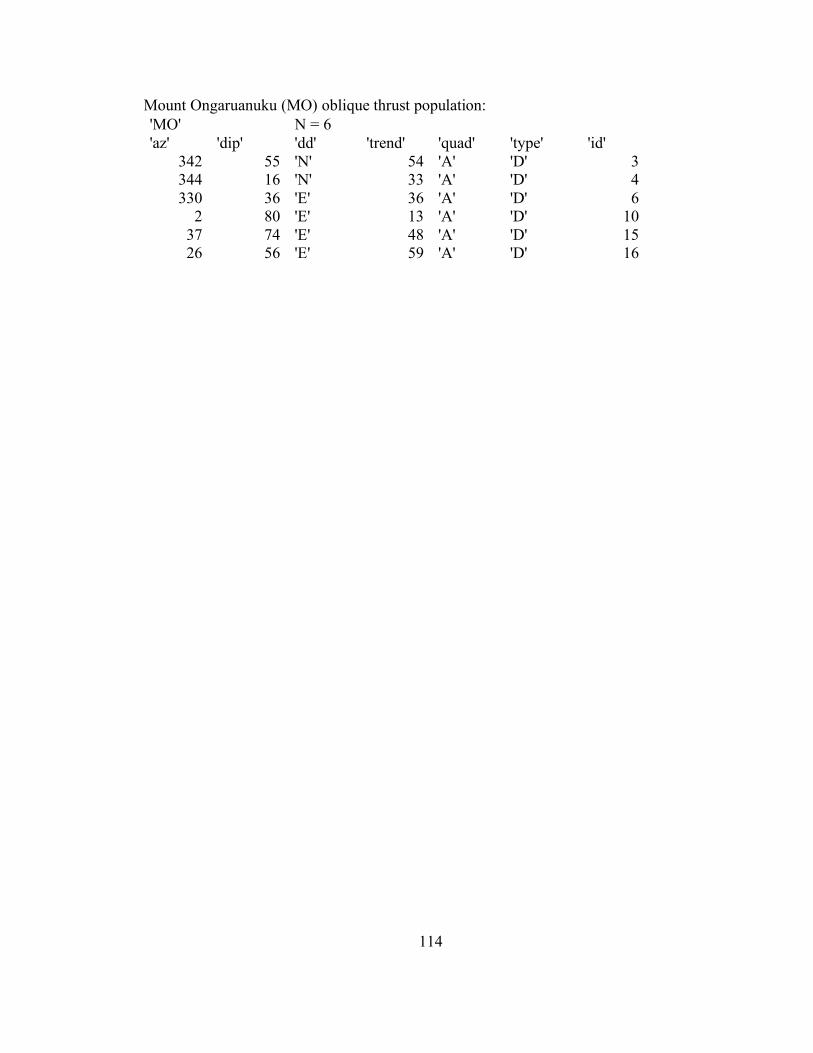
114
Mount Ongaruanuku (MO) oblique thrust population: 'MO' N = 6 'az' 'dip' 'dd' 'trend' 'quad' 'type' 'id'
342 55 'N' 54 'A' 'D' 3 344 16 'N' 33 'A' 'D' 4 330 36 'E' 36 'A' 'D' 6
2 80 'E' 13 'A' 'D' 10 37 74 'E' 48 'A' 'D' 15 26 56 'E' 59 'A' 'D' 16


![Effect of strain localization on frictional behavior of ...cjm38/papers_talks/RathbunMaroneJGR2010.pdf1. Introduction [2] The localization of strain in brittle shear zones has broad](https://static.fdocuments.in/doc/165x107/5f0f1e097e708231d442935e/effect-of-strain-localization-on-frictional-behavior-of-cjm38paperstalks.jpg)