Strain Concentrations at the Crack Tip of MDF Specimens Tested by the Wedge Sp
13
Materials 2012, 5, 1495-1507; doi:10.3390/ma5081495 materials ISSN 1996-1944 www.mdpi.com/journal/materials Article Strain Measurements within Fibre Boards. Part II: Strain Concentrations at the Crack Tip of MDF Specimens Tested by the Wedge Splitting Method Gerhard Sinn 1, *, Ulrich Müller 2 , Johannes Konnerth 3 and Jörn Rathke 2 1 Department of Material Sciences and Process Engineering, Institute of Physics and Material Sciences, BOKU–University of Natural Resources and Life Sciences, Peter Jordan Straße 82, Vienna AT-1190, Austria 2 Wood K plus–Competence Centre for Wood Composites and Wood Chemistry, Altenberger Straße 69, Linz 4040, Austria; E-Mails: [email protected] (J.R.); [email protected] (U.M.) 3 Department of Material Sciences and Process Engineering, Institute of Wood Technology and Renewable Resources, BOKU–University of Natural Resources and Life Sciences, Konrad Lorenzstraße 24, Tulln an der Donau 3430, Austria; E-Mail: [email protected] * Author to whom correspondence should be addressed; E-Mail: [email protected]; Tel.: +43-1-47654-5167; Fax: +43-1-47654-5159. Received: 27 June 2012; in revised form: 17 August 2012 / Accepted: 21 August 2012 / Published: 23 August 2012 Abstract: This is the second part of an article series where the mechanical and fracture mechanical properties of medium density fiberboard (MDF) were studied. While the first part of the series focused on internal bond strength and density profiles, this article discusses the fracture mechanical properties of the core layer. Fracture properties were studied with a wedge splitting setup. The critical stress intensity factors as well as the specific fracture energies were determined. Critical stress intensity factors were calculated from maximum splitting force and two-dimensional isotropic finite elements simulations of the specimen geometry. Size and shape of micro crack zone were measured with electronic laser speckle interferometry. The process zone length was approx. 5 mm. The specific fracture energy was determined to be 45.2 ± 14.4 J/m 2 and the critical stress intensity factor was 0.11 ± 0.02 MPa. Keywords: electronic laser speckle interferometry; wedge splitting; medium density fiber board; fracture mechanics; process zone OPEN ACCESS
Transcript of Strain Concentrations at the Crack Tip of MDF Specimens Tested by the Wedge Sp

Materials 2012, 5, 1495-1507; doi:10.3390/ma5081495
materials ISSN 1996-1944
www.mdpi.com/journal/materials
Article
Strain Measurements within Fibre Boards. Part II: Strain Concentrations at the Crack Tip of MDF Specimens Tested by the Wedge Splitting Method
Gerhard Sinn 1,*, Ulrich Müller 2, Johannes Konnerth 3 and Jörn Rathke 2
1 Department of Material Sciences and Process Engineering, Institute of Physics and Material Sciences,
BOKU–University of Natural Resources and Life Sciences, Peter Jordan Straße 82,
Vienna AT-1190, Austria 2 Wood K plus–Competence Centre for Wood Composites and Wood Chemistry, Altenberger Straße 69,
Linz 4040, Austria; E-Mails: [email protected] (J.R.); [email protected] (U.M.) 3 Department of Material Sciences and Process Engineering, Institute of Wood Technology and
Renewable Resources, BOKU–University of Natural Resources and Life Sciences, Konrad
Lorenzstraße 24, Tulln an der Donau 3430, Austria; E-Mail: [email protected]
* Author to whom correspondence should be addressed; E-Mail: [email protected];
Tel.: +43-1-47654-5167; Fax: +43-1-47654-5159.
Received: 27 June 2012; in revised form: 17 August 2012 / Accepted: 21 August 2012 /
Published: 23 August 2012
Abstract: This is the second part of an article series where the mechanical and fracture
mechanical properties of medium density fiberboard (MDF) were studied. While the first
part of the series focused on internal bond strength and density profiles, this article
discusses the fracture mechanical properties of the core layer. Fracture properties were
studied with a wedge splitting setup. The critical stress intensity factors as well as the
specific fracture energies were determined. Critical stress intensity factors were calculated
from maximum splitting force and two-dimensional isotropic finite elements simulations of
the specimen geometry. Size and shape of micro crack zone were measured with electronic
laser speckle interferometry. The process zone length was approx. 5 mm. The specific
fracture energy was determined to be 45.2 ± 14.4 J/m2 and the critical stress intensity factor
was 0.11 ± 0.02 MPa.
Keywords: electronic laser speckle interferometry; wedge splitting; medium density fiber
board; fracture mechanics; process zone
OPEN ACCESS

Materials 2012, 5 1496
1. Introduction
Wood based panels consist of wood particles, fibres, flakes or veneer sheets which are usually
processed with a resin and treated with pressure and heat. This procedure allows the manufacturing of
products which can have dimensions and characteristics beyond those of natural wood. In the group of
wood based panels, medium density fiber board (MDF) performs with the highest degree of
homogeneity, due to the fibrous particle structure. The different performance of wood based panels
mainly depends on the exclusion of naturally grown strength failure zones, such as for instance knots
or any other type of fibre deviation. The design of such new products requires a high yield of
information and a precise quality control system.
Standard testing procedures are well established in the wood based panel industry and yield
valuable data for the optimization of existing products. One of these tests is the internal bond strength
test [1]. The optimization of the wood based panel production process, especially the resin curing in a
hot press, has to be described by analysing the core layer. The standard testing procedure of internal
bond strength [1] yields only a peak value as output data, but neglects the origin of the failure. The
failure onset takes place at localized flaws of the material and is therefore better described by fracture
mechanics than classical strength theory.
Another standardized testing method is the measurement of bending strength according to EN 319 [2].
Bending experiments lead to pressure in the top layered face layer and tension in the bottom face layer.
The specimens generally fail in the tensioned face layer and the transition zone between core layer and
face layer, according to our own experiments. The bending strength describes the failure of the entire
specimen, but is not able to isolate the behaviour of the core layer.
One approach, which allows a direct load transmission into the core layer of wood based panels, is
the wedge splitting experiment, developed and patented by Tschegg [3]. The methodology has been
successfully applied for materials like concrete [4], wood [5], laminated veneer lumber [6] and particle
boards [7–9]. The wood panels studied were mainly loaded in plane, which yielded a failure
combination of face and core layer. Instead, the core layers of MDF were tested by Matsumoto and
Nairn [10] and Yoshihara [11] using DCB (Double Cantilever Beam) specimen geometry.
For the analysis of the core layer of MDF, loading must be carried out perpendicularly to the plane
of the board. This required some modifications to the traditional wedge splitting configuration used by
Tschegg [3], where the recess for the load transmission pieces is cut into the specimen. This procedure
weakens the relatively thin in-plane specimen too much; therefore, 3 mm thick steel reinforcements
were glued to the MDF-specimens as reinforcement (see Figure 1). The steel reinforcements were
glued to the face layer of the medium density fiberboard with a fast curing cyanoacrylate resin,
yielding a stiff bonding of the steel element and the MDF. A similar modification of the wedge
splitting specimens was made by Ehart et al. [7] for testing the core layer of particleboard: specimens
were built up by three layers of the board material glued together.
An advantage of the wedge splitting experiments is that the use of the wedge increases the stiffness
of the setup. The higher stiffness is favourable to the stability of the experiments [12] and an advantage
over direct loading setups like CT-fracture tests or double cantilever beam experiments. According to
Ehart et al., [7], this test setup in combination with a precise specimen preparation and geometry
allows testing under conditions of steady state crack propagation. This stable loading allows the

Materials 2012, 5 1497
recording of the entire load displacement curve as well as the calculation of the specific fracture
energy and stress intensity factor.
Figure 1. Wedge splitting test setup for the core layer testing of medium density fiber
board (MDF). Specimen is reinforced by steel plates glued to the face layers of MDF.
A standard value for the characterization of fracture behaviour in the field of material science is the
critical stress intensity factor KIC. This is a parameter used in linear elastic fracture mechanics (LEFM).
Prerequisites of LEFM are linear elastic material properties and a self-similar crack growth–properties
which are only approximately satisfied for MDF since fibre bridging and micro cracking takes place [10].
Moreover, the formation of micro cracks and fibre bridging around the crack tip makes crack length
measurement almost impossible [8].
To deal with the problems of micro cracking and fibre bridging, nonlinear elastic fracture
mechanics (NLEFM) has to be applied. The concept of the total fracture energy is especially suitable.
The specific fracture energy Gf is described as the total fracture energy normalized by the broken area
and describes an average crack resistance for the analysed material and specimen size [10].
Additional information on the cracking behaviour can be gained from finite element models. In this
paper, finite element modelling is used to calculate the stress intensity factor. A two-dimensional,
linear elastic, plane strain model of the specimen geometry was built in order to determine the critical
stress intensity factor from the maximum load and the specimen stiffness. The model depends on the
stiffness because the reinforcements are made of a different material (i.e., steel) than the specimen.
This paper presents electronic speckle pattern interferometry (ESPI) measurements in order to
determine the crack length and to verify the FE modelling. ESPI measurements were performed
additionally to the wedge splitting experiments. Medium density fibre boards with a thickness of
38 mm and a mean density of 710 kg/m3 were used. According to Müller et al., [13], ESPI
measurements are a suitable tool for the validation of numerical material analysis by means of FE
modelling. For a comparison with data from the literature, the stress intensity factor and the specific
fracture energy were calculated. The results gained are used to analyse the appropriateness of the

Materials 2012, 5 1498
calculated models and to determine the applicability of the adopted wedge splitting experiment for the
analysis of the core layer in wood based panels.
2. Experimental Section
As described, the wedge splitting methodology has been applied to various types of materials such
as concrete [4], wood [5,14–19], particleboards [7–9] and various others [20–22]. The vertical load of
the universal testing machine is transferred into the specimen by a wedge of 30° and two load
transmission pieces. Roller bearings are used to keep friction low. The test setup with the wedge stores
less elastic energy in the machine compared to a direct loading setup and allows the transformation of
vertical load into horizontal load under steady state crack development.
The specimens were cut to dimensions of 125 mm × 24.5 mm and stored in standard climate
(20°/65% RH) until the equilibrium moisture content was gained. Subsequently, a groove was sawn
into the specimen’s core layer to allow the placement of the wedge and the load transmission pieces.
The groove was sawn to a depth of 20 mm; then, a 10 mm long notch was sawn into the core layer for
crack initiation. Ultimately, the notch was sharpened by a razor blade before testing.
2.1. Specific Fracture Energy
Analyzing the load displacement curve permits characterizing the entire fracture process. The
fracture energy can be calculated directly from the diagram if the crack propagation takes place under
stable conditions until final fracturing of the sample occurs. The specific fracture energy Gf is a
material characteristic and characterizes the specimen’s resistance to crack growth. Gf was calculated
by dividing the integral of the load displacement curve by the fracture surface area (see Equation 1).
aL
f FdzBaL
G0)(
1
(1)
B…specimen thickness; L… specimen length; a… distance from top of the specimen to the root of
the notch.
2.2. Stress Intensity Factor
Although it is reported that wood [5] and wood based panels [6,7] show non-linear characteristics,
which is due to the large process zone and fiber bridging, nevertheless the concept of linear fracture
mechanics for measuring toughness is widely accepted [5,15,23,24].
For a better understanding of the deformation and fracture process as well as to determine the
critical stress intensity factor KIC, a FE simulation was performed to describe the basic mechanisms of
fracture. In this calculation, the special case of the sandwich construction of the specimen, consisting
of wood based panel and metal, was taken into account. The calculations were carried out with the
commercial FE program ABAQUS®. The specimen was simulated as a two dimensional plane strain
model. Isotropic and linear material properties were assumed. The crack tip was simulated with 36
collapsed 8-node biquadratic plane strain elements with mid-side nodes placed at ¼ of the distance
along the element side to create quarter-point elements representing r1 stress singularity [25,26].

Materials 2012, 5 1499
The ABAQUS® routine for the fracture toughness KI was used to compute the critical values. The
whole model consisted of 754 elements. Several simulations with varying moduli of elasticity (Poisson
ratio was fixed to 0.1) were performed in order reproduce the experimental initial slope and determine
the modulus of elasticity representing the experiment. Found the modulus of elasticity, the fracture
toughness was calculated by the ABAQUS® routine with the maximum load from experimental load
displacement curves.
2.3. Speckle Measurement
The basic principle of the ESPI technique for in-plane measurements can easily be explained on the
basis of the experimental setup, presented by Müller et al. [13]: the specimen is illuminated by two
expanded laser beams. Based on the interference between the two laser beams, the laser light forms a
speckle pattern which is recorded by means of a CCD camera (Figure 2a,b). Deformations on the
sample surface cause a new phase difference and therefore a new speckle pattern. The calculation of
changes in the image pattern is performed by subtracting the pattern from the previous image; this
results in an image with typical fringe pattern [13,27]. More detailed information in terms of the ESPI
technique is given by several authors such as for instance Rastogi [28], Eberhardsteiner [29], Mohan
and Rastogi [30].
Figure 2. Schematic drawing of the Michelson interferometer (a) and electronic speckle
pattern interferometry (ESPI) optics set-up for wedge splitting in-plane measurements (b).
Materials 2012, 5 1500
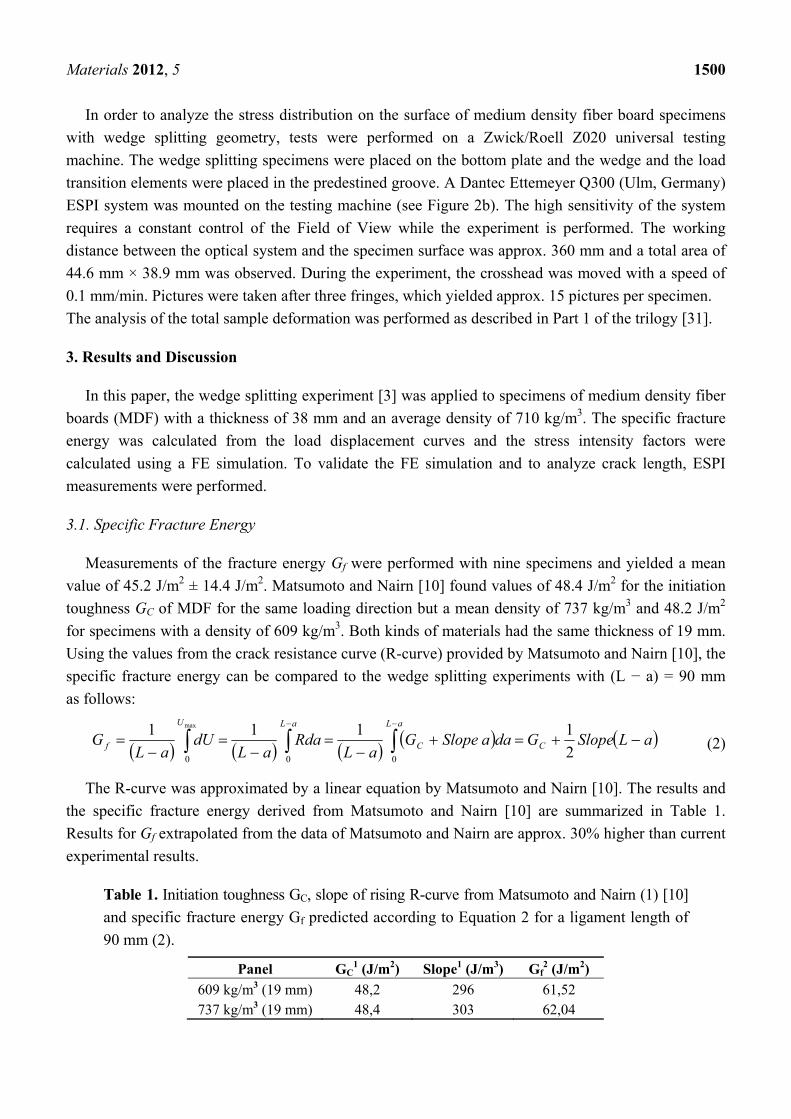
In order to analyze the stress distribution on the surface of medium density fiber board specimens
with wedge splitting geometry, tests were performed on a Zwick/Roell Z020 universal testing
machine. The wedge splitting specimens were placed on the bottom plate and the wedge and the load
transition elements were placed in the predestined groove. A Dantec Ettemeyer Q300 (Ulm, Germany)
ESPI system was mounted on the testing machine (see Figure 2b). The high sensitivity of the system
requires a constant control of the Field of View while the experiment is performed. The working
distance between the optical system and the specimen surface was approx. 360 mm and a total area of
44.6 mm × 38.9 mm was observed. During the experiment, the crosshead was moved with a speed of
0.1 mm/min. Pictures were taken after three fringes, which yielded approx. 15 pictures per specimen.
The analysis of the total sample deformation was performed as described in Part 1 of the trilogy [31].
3. Results and Discussion
In this paper, the wedge splitting experiment [3] was applied to specimens of medium density fiber
boards (MDF) with a thickness of 38 mm and an average density of 710 kg/m3. The specific fracture
energy was calculated from the load displacement curves and the stress intensity factors were
calculated using a FE simulation. To validate the FE simulation and to analyze crack length, ESPI
measurements were performed.
3.1. Specific Fracture Energy
Measurements of the fracture energy Gf were performed with nine specimens and yielded a mean
value of 45.2 J/m2 ± 14.4 J/m2. Matsumoto and Nairn [10] found values of 48.4 J/m2 for the initiation
toughness GC of MDF for the same loading direction but a mean density of 737 kg/m3 and 48.2 J/m2
for specimens with a density of 609 kg/m3. Both kinds of materials had the same thickness of 19 mm.
Using the values from the crack resistance curve (R-curve) provided by Matsumoto and Nairn [10], the
specific fracture energy can be compared to the wedge splitting experiments with (L − a) = 90 mm
as follows:
aLSlopeGdaaSlopeGaL
RdaaL
dUaL
G C
aL
C
aLU
f
2
1111
000
max
(2)
The R-curve was approximated by a linear equation by Matsumoto and Nairn [10]. The results and
the specific fracture energy derived from Matsumoto and Nairn [10] are summarized in Table 1.
Results for Gf extrapolated from the data of Matsumoto and Nairn are approx. 30% higher than current
experimental results.
Table 1. Initiation toughness GC, slope of rising R-curve from Matsumoto and Nairn (1) [10]
and specific fracture energy Gf predicted according to Equation 2 for a ligament length of
90 mm (2).
Panel GC1 (J/m2) Slope1 (J/m3) Gf
2 (J/m2) 609 kg/m3 (19 mm) 48,2 296 61,52 737 kg/m3 (19 mm) 48,4 303 62,04

Materials 2012, 5 1501
3.2. Stress Intensity Factor
The stress intensity factors were calculated using the described finite element simulation. The mean
value for the critical stress intensity factor for the tested medium density fiberboard was
KIC = 0.111 ± 0.015 Mpam0.5. Only a few experiments analyzing the fracture toughness of MDF were
found in the literature. Niemz et al., [23,24] used CT specimens according to ASTM 399 to analyze
the stress intensity factor. The specimens were oriented parallel to the board plane and yielded KIC
values of 1.81 ± 0.33 MPam0.5 (CV 18.2%) for a density of 710 kg/m3 (20 °C/65% RH) and numbers
in a range of 0.36 ± 0.03 MPam0.5 (8.3% CV) to 1.29 ± 0.06 MPam0.5 (CV 4.7%) with a density of
500 kg/m3, depending on the equilibrium moisture content, which varied from 21.4% to 3.5%. The
differences between our data and the data from Niemz et al., [23,24] can be traced back to the fact that
the specimens were tested perpendicularly to experiments presented here and that these literature
values reflect a combination of face layer and core layer. Matsumoto and Nairn [32] used modified CT
specimens for testing the middle layer of MDF. They provided experimental results for the initiation
toughness Gc and the modulus of elasticity E from simulations of 19 mm thick MDF boards. To
compare their results with the results presented here, the well-known equation from linear elastic
fracture mechanics was used:
21
EGK IcIc (3)
The results for MDF 46, given in Table 2, are in good agreement with our own results of
KIC = 0.111 ± 0.015 Mpam0.5. The labeling “MDF 38” and “MDF 46” reflects the density of the
specimens in 38 lbs/ft3 and 46 lbs/ft3.
Table 2. Initiation toughness, modulus of elasticity and Poisson’s ratio from [32]; KIC
calculated according to Equation 2.
Density, (kg/m3) Gc, (J/m2) E, (MPa) , (-) KIC, (MPam0.5) MDF 38 609 59 90 0.33 0.077 MDF 46 737 48 200 0.33 0.104
3.3. ESPI Measurement
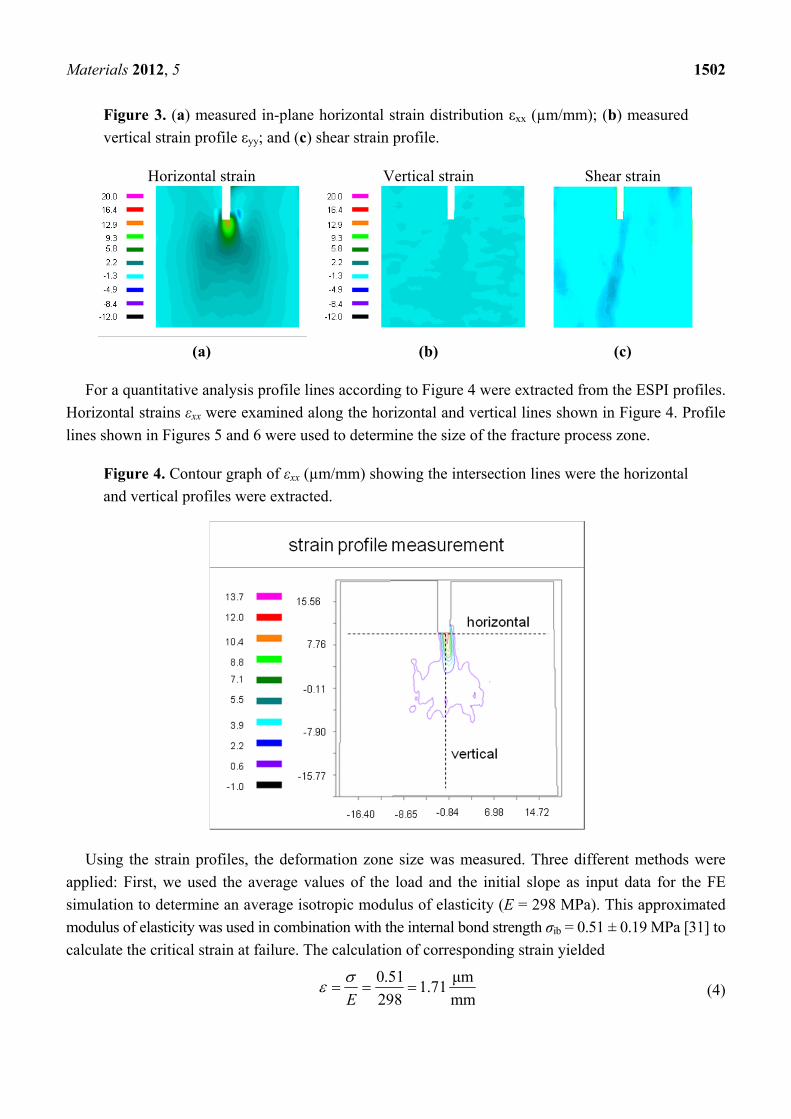
In Figure 3 the ESPI strain results for one representative specimen are shown. The predominantly
mode I horizontal strain is visible in the left image of Figure 3; the vertical and the shear strain are of
minor magnitude.
Materials 2012, 5 1502
Figure 3. (a) measured in-plane horizontal strain distribution εxx (µm/mm); (b) measured
vertical strain profile εyy; and (c) shear strain profile.
Horizontal strain Vertical strain Shear strain
(a) (b) (c)
For a quantitative analysis profile lines according to Figure 4 were extracted from the ESPI profiles.
Horizontal strains εxx were examined along the horizontal and vertical lines shown in Figure 4. Profile
lines shown in Figures 5 and 6 were used to determine the size of the fracture process zone.
Figure 4. Contour graph of εxx (µm/mm) showing the intersection lines were the horizontal
and vertical profiles were extracted.
Using the strain profiles, the deformation zone size was measured. Three different methods were
applied: First, we used the average values of the load and the initial slope as input data for the FE
simulation to determine an average isotropic modulus of elasticity (E = 298 MPa). This approximated
modulus of elasticity was used in combination with the internal bond strength σib = 0.51 ± 0.19 MPa [31] to
calculate the critical strain at failure. The calculation of corresponding strain yielded
mm
μm71.1
298
51.0
E
(4)

Materials 2012, 5 1503
Figure 5. Vertical profile lines of exx in crack growth direction from ESPI measurements
and from simulation. Dashed horizontal line shows critical strain at failure onset. Fracture
process zone length can be determined within 5 to 10 mm.
Figure 6. Horizontal profile lines of exx experimental and simulated. Dashed line represent
strain at yielding providing a process zone with of 2.4 mm (acc. to method 1), whereas
solid horizontal line touches the first maxima at left and right side of the center peak
leading to a process zone width of 6.3 mm (acc. to method 2).
0 5 10 15 20 25 30
0
5
10
15
20
0 5 10 15 20 25 30
0
5
10
15
20 KS 3 vertical profile KS 7 vertical profile KS 12 vertical profile
xx, (m
/mm
)
distance from notch root, (mm)
B
FE-simulation
-20 -15 -10 -5 0 5 10 15 20-2
0
2
4
6
8
10
12
14
16
18
-20 -15 -10 -5 0 5 10 15 20
-2
0
2
4
6
8
10
12
14
16
18 KS 3 horizontal profile KS 7 horizontal profile KS 12 horizontal profile
xx, (m
/mm
)
distance from notch root, (mm)
FE-simulation

Materials 2012, 5 1504
The width the process zone determined using Method 1 provided only half of the value achieved for
the vertical profile (see Figure 6). A closer look at the horizontal profile lines shows that approaching
the center of the specimen, the profile runs through local maxima. These maxima might be caused by
the initiation of micro-crack-formation beyond this point and therefore be classified as the border of
the process zone (Method 2). This assumption can be justified by the solution of the theoretical stress
field surrounding a crack tip, which is proportional to the inverse of the square root of the distance
from the crack tip in the linear elastic region. Within the micro cracking region the mathematical
relation is different. The border can be allocated to the maxima described before. Results are, once
again, are summarized in Table 3, column 4.
Table 3. Electronic speckle pattern interferometry (ESPI) results of process zone size rp.
Specimen Process zone length in crack
forward direction from vertical profiles in (mm); Method 1
Process zone width in (mm) from horizontal
profiles; Method 1
Process zone width in (mm) from horizontal
profiles; Method 2 1 (KS 3) 7.66 2.44 6.23 2 (KS 7) 5.47 2.75 6.58 3 (KS 12) 5.83 2.57 6.12
Intersection of the horizontal dashed line in Figure 5, corresponding to the critical strain, with the
profile lines gives the process zone size (Method 1). This method worked well for the vertical profile
shown in Figure 3 and 4. The results are summarized in Table 3.
The third method to estimate the fracture process zone size in crack growing direction uses the
analytical solution of the stress field surrounding a crack [33]. Equation 5 provides the second order
estimate of process zone length for plane strain conditions (see Equation 2.68 for ry in [33]).
mm03.551.0
111.0
3
1
3
12
22
ib
Iyp
Krr
(5)
Equation 5 is an approximation since it was derived for an ideal elastic plastic material [33]. The
micromechanics of damage of MDF are different from this assumption. Exceeding a critical load
micro cracks develop in the material and prevent the stress from increasinge further in the concerned
region. Although the micromechanics of cracking is different from that of ideal material, a process
zone develops around the crack tip similar to a plastic zone in metals. The analytically determined
process zone width rpw is approximately 1.25 times the process zone in forward direction [33]; for a
Poisson ratio of 0.1, it gives rpw = 6.3 mm. This value is close to the second method of experimental
evaluation. It might be concluded from the process zone size and shape, comparing the ESPI results
with the FE simulation (see Figures 5 and 6), that the material behaves isotropically within the range of
measurement. This conclusion is supported by the well-known correlation between the modulus of
elasticity and the density. The density profile shown in part one of this series [31] is approx. constant
within ±10 mm from center; therefore the isotropic FE-simulation might describe the material and
setup correctly within the measurement plane and region. Nevertheless, there might be a different
modulus of elasticity in the direction of depth.
Materials 2012, 5 1505
4. Conclusions
Wedge splitting experiments were performed in order to characterize the fracture behavior of the
MDF core zone. Compared to the original, patented setup, specimens with metal reinforcements at the
sides were used. This modification was necessary to guarantee that the highest stresses within the
specimen occur at notch ground and avoid failing of the specimen close to the surface.
ESPI measurements were used to measure the process zone and visualize the material
inhomogeneity. The ESPI results were compared to linear elastic and isotropic FE simulations and
confirm the assumptions of isotropic material behavior made for the FE simulations.
The article presents new experimental data on fracture toughness of the MDF core layer described
in terms of specific fracture energy and critical stress intensity factor. Results show that fracture
experiments performed can provide valuable information in addition to the standardized tests and
characterize the core material of MDF. The modified wedge splitting setup in combination with
two-dimensional strain measurement and FE-simulations can provide further information on
nonlinearities or anisotropic material response in an early state of damage.
Acknowledgments
The financial support of the Austrian Science Fund (FWF), as well as language support by
Veronika Doblhoff-Dier, are gratefully acknowledged by the authors.
References
1. European Committee for Standardization. Particleboards and Fiberboards—Determination Of
Tensile Strength Perpendicular to the Plane of the Board CSN EN 319; Österreichisches
Normungsinstitut: Vienna, Austria, 1993.
2. European Committee for Standardization. Wood-Based-Panels—Determination of Modulus of
Elasticity in Bending and of Bending Strength CSN EN 310; Österreichisches Normungsinstitut:
Vienna, Austria, 1993.
3. Tschegg, E.K. Prüfeinrichtung zur Ermittlung von Bruchmechanischen Kennwerten sowie hierfür
geeignete Prüfkörper. Austria Patent 3,903,28B, 31 January 1986.
4. Tschegg, E.K. New equipments for fracture tests on concrete. Materialprüfung 1991, 33,
5189–5194.
5. Stanzl-Tschegg, S.E.; Tan, D.M.; Tschegg, E.K. New splitting method for wood fracture
characterization. Wood Sci. Technol. 1995, 29, 31–50.
6. Ehart, R.J.A.; Stanzl-Tschegg, S.E.; Tschegg, E.K. Fracture characteristics of PARALLAM (R)
PSL in comparison to solid wood and particleboard. Wood Sci. Technol. 1998, 32, 43–55.
7. Ehart, R.J.A.; Stanzl-Tschegg, S.E.; Tschegg, E.K. Characterization of crack propagation in
particleboard. Wood Sci. Technol. 1996, 30, 307–321.
8. Ehart, R.J.A.; Stanzl-Tschegg, S.E.; Tschegg, E.K. Fracture mechanics in particleboard–experiments
and FE simulations. In Proceedings of the 2nd International Conference On the Development of
Wood Science, Technology and Forestry (ICWSF 96), Sopron, Hungary, 10–12 April 1996.

Materials 2012, 5 1506
9. Sinn, G.; Beer, P.; Gindl, M.; Stanzl-Tschegg, S. Wedge splitting experiments on three-layered
particleboard and consequences for cutting. Holz Roh Werkstoff 2008, 66, 135–141.
10. Matsumoto, N.; Nairn, J.A. The fracture toughness of medium density fiberboard (MDF)
including the effects of fiber bridging and crack-plane interference. Eng. Fract. Mech. 2009, 76,
2748–2757.
11. Yoshihara, H. Mode I and mode II initiation fracture toughness and resistance curve of medium
density fiberboard measured by double cantilever beam and three-point bend end-notched flexure
tests. Eng. Fract. Mech. 2010, 77, 2537–2549.
12. Harmuth, H. Stability of Crack-Propagation Associated with Fracture Energy Determined by
Wedge Splitting Specimen. Theor. Appl. Fract. Mech. 1995, 23,103–108.
13. Müller, U.; Sretenovic, A.; Vincenti, A.; Gindl, W. Direct measurement of strain distribution
along a wood bond line. Part 1: Shear strain concentration in a lap joint specimen by means of
electronic speckle pattern interferometry. Holzforschung 2005, 59, 300–306.
14. Frühmann, K.; Reiterer, A.; Tschegg, E.K.; Stanzl-Tschegg, S.S. Fracture characteristics of wood
under mode I, mode II, and mode III loading. Phil. Mag. A 2002, 82, 3289–3298.
15. Reiterer, A. The influence of temperature on the mode I fracture behavior of wood. J. Mater. Sci.
Lett. 2001, 20, 1905–1907.
16. Reiterer, A.; Sinn, G.; Stanzl-Tschegg, S.E. Fracture characteristics of different wood species
under mode I loading perpendicular to the grain. Mater. Sci. Eng. A 2002, 332, 29–36.
17. Reiterer, A.; Stanzl-Tschegg, S.E.; Tschegg, E.K. Mode I fracture and acoustic emission of
softwood and hardwood. Wood Sci. Technol. 2000, 34, 417–430.
18. Reiterer, A.; Tschegg, S. The influence of moisture content on the mode I fracture behaviour of
sprucewood. J. Mater. Sci. 2002, 37, 4487–4491.
19. Tan, D.M.; Stanzltschegg, S.E.; Tschegg, E.K. Models of Wood Fracture in Mode-I and Mode-Ii.
Holz Roh Werkstoff 1995, 53, 159–164.
20. Tschegg, E.K.; Bohner, E.; Tritthart, J.; Müller, H.S. Investigations into fracture of carbonated
concrete. Mag. Concr. Res. 2011, 63, 21–30.
21. Tschegg, E.K.; Fendt, K.T.; Manhart, Ch.; Harmuth, H. Uniaxial and biaxial fracture behaviour of
refractory materials. Eng. Fract. Mech. 2009, 76, 2249–2259.
22. Tschegg, E.K.; Jamek, M.; Lugmayr, R. Fatigue crack growth in asphalt and asphalt-interfaces.
Eng. Fract. Mech. 2011, 78, 1044–1054.
23. Niemz, P.; Diener, M. Vergleichende Untersuchungen zur Ermittlung der Bruchzähigkeit an
Holzwerkstoffen. Eur. J. Wood Wood Prod. 1999, 57, 222–224.
24. Niemz, P.; Diener, M.; Pöhler, E. Untersuchungen zur Ermittlung der Bruchzähigkeit and
MDF-Platten. Eur. J. Wood Wood Prod. 1997, 55, 327–330.
25. Schachner, H.; Reiterer, A.; Stanzl-Tschegg, S.E. Orthotropic fracture toughness of wood. J.
Mater. Sci. Lett. 2000, 19, 1783–1785.
26. Henshell, R.D.; Shaw, K.G. Crack Tip Finite Elements Are Unnecessary. Int. J. Numer. Methods
Eng. 1975, 9, 495–507.
27. Eberhardsteiner, J. Biaxial testing of orthotropic materials using electronic speckle pattern
interferometry. Measurement 1995, 16, 139–148.
Materials 2012, 5 1507
28. Rastogi, P.K. Measurement of static surface displacements, derivatives of displacements,
and three-dimensional surface shapes—Examples of applications to non-destructive testing.
In Digital Speckle Pattern Interferometry and Related Techniques; Rastogi, P.K., Ed.;
John Wiley & Sons: Chichester, UK, 2000; pp. 141–224.
29. Eberhardsteiner, J. Mechanisches Verhalten von Fichtenholz: Experimentelle Bestimmung der
biaxialen Festigkeitseigenschaften; Springer: Vienna, Austria, 2002.
30. Mohan, N.K.; Rastogi, P. Recent developments in digital speckle pattern interferometry.
Opt. Lasers Eng. 2003, 40, 439–445.
31. Rathke, J.; Sinn, G.; Konnerth, J.; Müller, U. Strain measurements within fiber boards. Part I:
Inhomogeneous strain distribution within medium density fiberboards (MDF) loaded
perpendicularly to the plane of the board. Materials 2012, 5, 1115–1124.
32. Matsumoto, N.; Nairn, J.A. Fracture Toughness of Wood and Wood Composites during Crack
Propagation. Wood Fiber Sci. 2012, 44, 121–133.
33. Anderson, T.L. Linear Elastic Fracture Mechanics. In Fracture Mechanics. Fundamentals and
Applications; CRC Press: Boca Raton, FL, USA, 1995; pp. 31–96.
© 2012 by the authors; licensee MDPI, Basel, Switzerland. This article is an open access article
distributed under the terms and conditions of the Creative Commons Attribution license
(http://creativecommons.org/licenses/by/3.0/).