stotoil - Oljedirektoratet · stotoil Tritiated water in the mud by drilling well 31/3-1....
22
Denne rapport tilhører O STATOIL L&U DOK. SENTER L. NR. KODE 2>\/.\-\ Returneres etter bruk stotoil Tritiated water in the mud by drilling well 31/3-1. Estimation of formation water from FMT-samples. STATOIL EXPLORATION & PRODUCTION LABORATORY by Reidun Kleven _July 1984 Den norske stats oljeselskap a.s LAB
Transcript of stotoil - Oljedirektoratet · stotoil Tritiated water in the mud by drilling well 31/3-1....
Denne rapporttilhører O STATOIL
L&U DOK. SENTERL. NR.
KODE 2>\ / . \ - \
Returneres etter bruk
stotoil
Tritiated water in the mud bydrilling well 31/3-1. Estimationof formation water from FMT-samples.
STATOIL
EXPLORATION & PRODUCTIONLABORATORY
by
Reidun Kleven
_July 1984
Den norske stats oljeselskap a.s
LAB
oStatoilDen norske statsoljeselskap a.s
Classification
Requested by
Roald Riise, LET S
Subtitle
Co-workers
Didrik Malthe-rSørenssen, Torgeir Lund, Hans Petter Rønningsen
Kåre Sørheim
l
l
l
I
iii
i
Title
Tritiated water in the mud bydrilling well 31/3-1. Estimationof formation water from FMT-samples
STATOIL
EXPLORATION & PRODUCTIONLABORATORY
by
Reidun Kleven
_July 1984
Prepared
LAB84 .221J
Approved
Reidun Kleven Didrik Malthe-Sørenssen
9.03.21 A
SUMMARY
To determine the migration of mud into the rock structure,
mud samples and FMT-water samples were analysed for ion and
tritium concentrations. In addition, leakage of cushion
water into the sampling chambers was measured.
Tritiated water was injected in the mud during drilling the
well 31/3-1, depth 1303-1820 m. Samples of the mud were
analysed on the platform for tritium concentration by liquid
scintillation counting. Further, samples were analysed on
shore under lab conditions by atomic absorbtion spectroscopy
The data was used to estimate the ion composition of the
formation water by using sorption coefficients previously
determined. The results obtained were generally in
accordance with results from previous wells tested in this
area, with the exception which showed higher concentrations
than expected of potassium. The calculations have been
described in detail in a separate report from IFE (1).
LAB 84.221
1 INTRODUCTION
The purpose of the experiments was to study mudfiltrate
invasion into the rock formation. Sorption effects were
determined by adding tritiated water to the mud. The initial
approach was to measure tritium and ion concentrations in
water produced during a drill stem test as a function of
time. A similar experiment has previously been performed by
drilling and testing on well 30/6-6. (2,3). However, due to
the low recovery of oil in the FMT-tests in the oil/water
zone it was decided not to proceed with the DST in this zone.
The experiment was concluded by chemical and radiochemical
analysis of the FMT-samples. These analysis, together with
information on sorption coefficients determined in the
evaluation of data from 30/6-6, were used to estimate the ion
composition of the formation water.
Tritiated water is an ideal tracer for measuring the mud
infiltration in the formation fluid. It is easy to detect,
has a good miscibility and does not interfer with the
formation.
LAB 84.221
2. EXPERIMENT AND RESULTS
2.1 Mud system
Tritiated water was injected into the mud at a rate of 83
ml/min. during one mud cycle (1 1/2 h.). The tritium level
was kept constant at (65 +_ 4) Bq/ml in the mud during
drilling through the section 1303-1820 m. This was achieved
by adding tritiated water to all pits where mud was mixed.
Controlled amounts of tritium were also added directly to the
circulating system to compensate for fluid loss.
0,5 litres of drilling mud was sampled from the shaker pit
every hour during the drilling period, and processed on the
rig. 100 ml of the mud samples were distilled and one ml of
the distillate was used to determine the tritium
concentration by liquid scintillation counting.
To measure the ion composition in the mud used in the
actually zone mud- samples no. 123 (1564 m), no 124 (1571 m)
and no. 134 (1613 m) were sent to West Lab for ion analysis.
The results of these analyses are summarised in Table 1. The
average ion composition of three samples is used to represent
the ion composition of the mud filtrate for the interval
where FMT-tests were done (1570-80 m).
LAB 84.221

I
2.2 FMT-samples
Three FMT-tests were performed in the gas/oil/water - zone:
FMT 1 (1574,2 m), FMT 2 (1579,5 m) and FMT 3 (1570,0 m). The
10.409 litre chambers were treated off shore and the water
samples designated FMT lb, FMT 2b and FMT 3b were collected
in one liter bottles on the rig and shipped to West lab for
ion analysis.
The coutent of the 3,785 litre chamber was shipped to the
Statoil laboratory. The water from the chamber was collected
in 1 liter bottles and 5 ml cone HNO., was added to prevent
salt precipitation. These samples were designated FMT la,
FMT 2a and FMT 3a. The volume of sample FMT 3a was to small
to obtain analytical data.
The following data was obtained for the FMT-samples:
a) Tritium concentrations in the distillate.
The same procedure used to analyse the mud samples was
adopted. The ratios of tritium concentration in the
FMT-samples to tritium concentration in the mud are given
in Table 2. These results are used to determine
contamination of the mud in the FMT-water.
b) Cushion water in FMT-samples.
Prior to sampling a known concentration of Nal was added
to the cushion water in the FMT-tools (0,82 g / 14,2 1).
The contamination of the cushion water is proportional to
the concentration of iodine in the FMT-water samples. The
volume of cushion water in the FMT-samples is given in
LAB 84.221
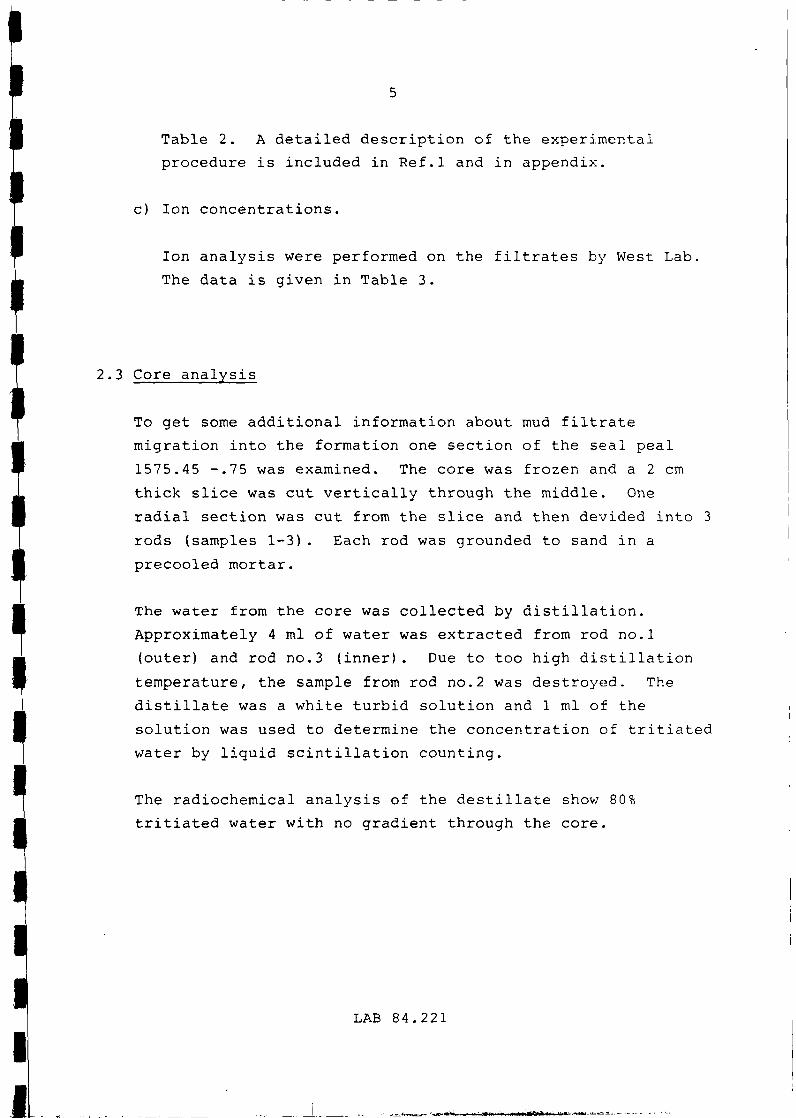
Table 2. A detailed description of the experimental
procedure is included in Ref.l and in appendix.
c) Ion concentrations.
Ion analysis were performed on the filtrates by West Lab,
The data is given in Table 3.
2 . 3 Core analysis
To get some additional information about mud filtrate
migration into the formation one section of the seal peal
1575.45 -.75 was examined. The core was frozen and a 2 cm
thick slice was cut vertically through the middle. One
radial section was cut from the slice and then devided into 3
rods (samples 1-3). Each rod was grounded to sand in a
precooled mortar.
The water from the core was collected by distillation.
Approximately 4 ml of water was extracted from rod no.l
(outer) and rod no.3 (inner). Due to too high distillation
temperature, the sample from rod no.2 was destroyed. The
distillate was a white turbid solution and 1 ml of the
solution was used to determine the concentration of tritiated
water by liquid scintillation counting.
The radiochemical analysis of the destillate show
tritiated water with no gradient through the core.
LAB 84.221
I
I
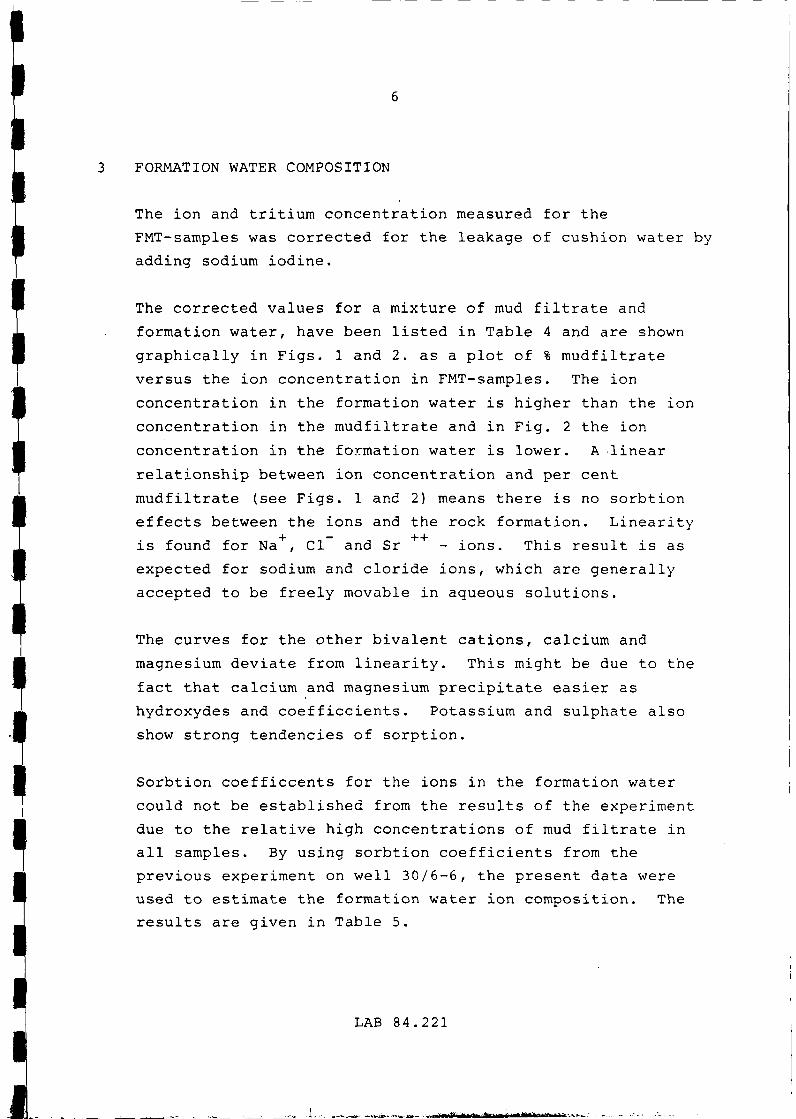
FORMATION WATER COMPOSITION
The ion and tritium concentration measured for the
FMT-samples was corrected for the leakage of cushion water by
adding sodium iodine.
The corrected values for a mixture of mud filtrate and
formation water, have been listed in Table 4 and are shown
graphically in Figs. 1 and 2. as a plot of % mudfiltrate
versus the ion concentration in FMT-samples. The ion
concentration in the formation water is higher than the ion
concentration in the mudfiltrate and in Fig. 2 the ion
concentration in the formation water is lower. A linear
relationship between ion concentration and per cent
mudfiltrate (see Figs. 1 and 2) means there is no sorbtion
effects between the ions and the rock formation. Linearity
is found for Na , Cl and Sr - ions. This result is as
expected for sodium and cloride ions, which are generally
accepted to be freely movable in aqueous solutions.
The curves for the other bivalent cations, calcium and
magnesium deviate from linearity. This might be due to the
fact that calcium and magnesium precipitate easier as
hydroxydes and coefficcients. Potassium and sulphate also
show strong tendencies of sorption.
Sorbtion coefficcents for the ions in the formation water
could not be established from the results of the experiment
due to the relative high concentrations of mud filtrate in
all samples. By using sorbtion coefficients from the
previous experiment on well 30/6-6, the present data were
used to estimate the formation water ion composition. The
results are given in Table 5.
LAB 84.221
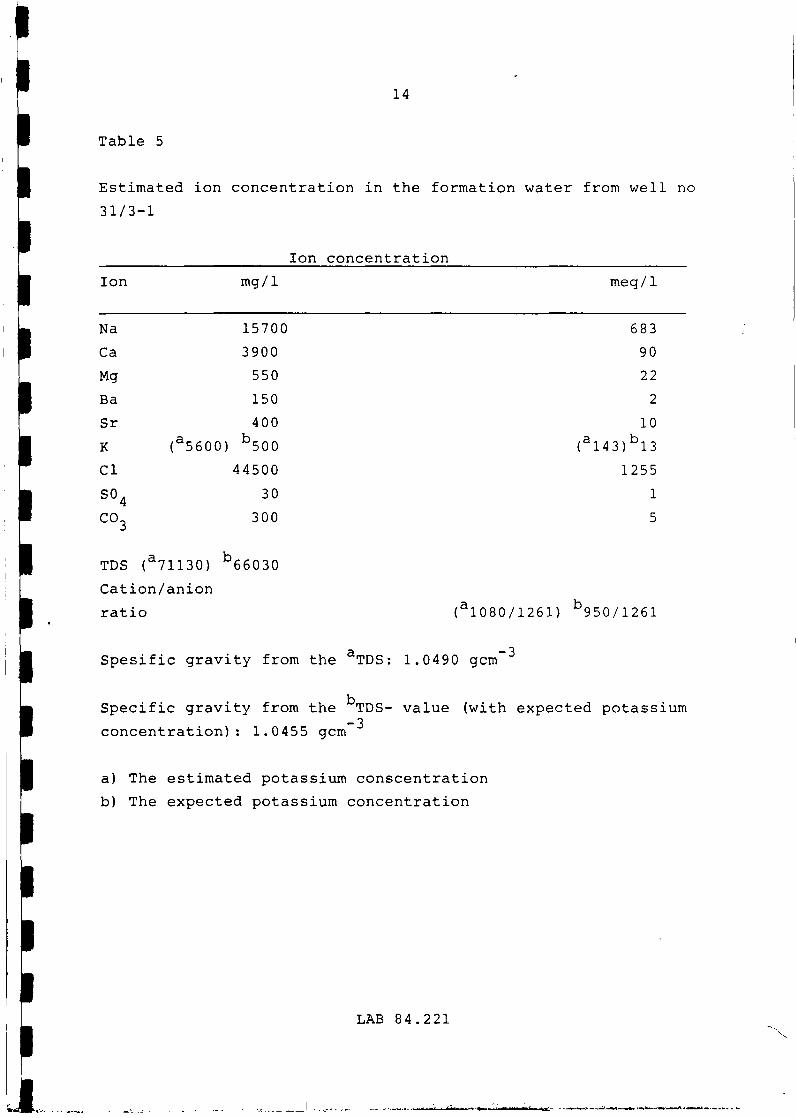
The ion concentrations are generally in'agreement with those
found in formation water from other wells in this area (ref
4-7). The only exception is the extremely high potassium
concentration as mentioned earlier in this report. From the
general agreement of concentrations of all other ions, we
have indicated a potassicum concentration of 500 mg/1 being
more reasonable.
LAB 84.221
4. RESISTIVITY OF FORMATION WATER AND MUD FILTRATE
The resistivity in the estimated formation water is
calculated from the equivalent NaCl-concentrations (see Table
6) based on the varialbe multipliers method (ref.8-9). Two
values for the resistivity are given in Table 6:
b) based on the estimated potassium concentration and
c) based on the expected potassium concentration.
As earlier discussed (Chap. 3) the estimated potassium
concentration is too high. The more reasonable value is 500
mg/1 and the corresponding resistivity in the formation water
is 0.118 ohm-m.
LAB 84.221
I

REFERENCES
1. Dahl, J.B and Tollan, O. : Use of trit.iated water as a
drilling mud tracer in well 31/3-1 in the North Sea.
Institutt for energiteknikk Prosjektrapport, des. 1983.
2. Dahl, J.B and Tollan, O : Use of tritiated water as a
drilling mud tracer in well 30/6-6 in the North Sea.
Institut for energiteknikk, Prosjektrapport, juni 1982.
3. Didrik Malthe-Sørensen: Mudfiltrate invasion in formation
fluid studied by isotope tracer-formation water analysis
of 30/6-6, LAB 82.25.
4. Norske Shell A/S
Water analysis well 31/2-11 (Geco)
5. Norske Shell A/S
Water analysis well 31/2-1A (Geco 13.11.81)
6. Water analysis for Norsk Hydro North Sea
well 31/4-2 (Core Lab 19.nov. 1979)
7. Water analysis for Norsk Hydro
report no. sec 109/6
well 31/4-3 (Core Lab 2. febr. 1980)
8. Schlumberger Log interpretation chart 1978 edition.
9. CRC Handbook of chemistry and Physics 55th Edition,
CRC-Press (1975) .
LAB 84.221
il
10
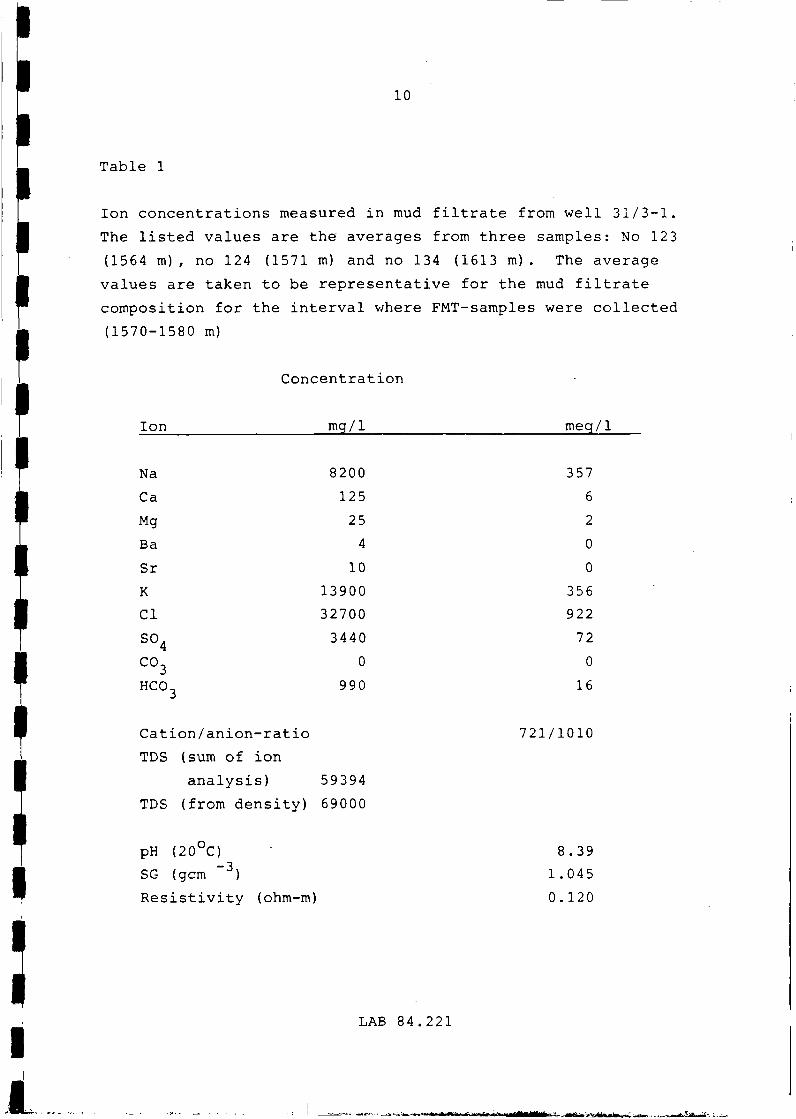
Table l
Ion concentrations measured in mud filtrate from well 31/3-1.
The listed values are the averages from three samples: No 123
(1564 m), no 124 (1571 m) and no 134 (1613 m). The average
values are taken to be representative for the mud filtrate
composition for the interval where FMT-samples were collected
(1570-1580 m)
Concentration
Ion mg/1 meg/I
Nå
Ca
Mg
Ba
Sr
K
Cl
so4co3HCO-,
8200
125
25
4
10
13900
32700
3440
0
990
357
6
2
0
0
356
922
72
0
16
Cation/anion-ratio 721/1010
TDS (sum of ion
analysis) 59394
TDS (from density) 69000
pH (20°C) ' 8.39
SG (gcm ~3) 1.045
Resistivity (ohm-m) 0.120
LAB 84.221

11
Table 2
Volume of cushion water and % mud filtrate in FMT-water samples
from well 31/3-1
Sample
identi- .
f ication
FMT
FMT
FMT
FMT
FMT
FMT
la
lb
2a
2b
3a
3b
Depth
(m)
1574
1574
1579
1579
1570
1570
.2
.2
.5
.5
.0
.0
Volume
FMT-
chamber
3.
10.
3.
10.
3.
10.
(1)
785
409
785
409
785
409
Volume of total Volume % mud filtrate
FMT-water cushion in total
sample water in FMT-water
FTM-sample sample
2
6
3
6
1
(1)
.15
.10
.70
.70
.50
0
0
0
0
0
(1)
.312
.673
.465
.492
.033
45
59
53
77
35
91
LAB 84.221

12
Table 3
Ion concentrations in FMT-samples from well no 31/3-1
DepthFMT
noIon
Na
Ca
Mg
Ba
Fe
Sr
K
Cl
so4HC03
TDS/SUM
pH (20°C)
Spesific
gravity
(measured
gem )
1574,2
la1'rag /I
8500
1080
235
3
3
141
5040
29110
600
566
452785
6.75
1.034
m
Ib2)
mg/1
9250
1010
214
3
2
105
7500
31950
900
645
51579
7.35
1.037
1579
2a1)
mg/1
7750
980
204
5
3
115
5440
29465
700
554
45216
6.78
1.034
,5 m
2b2)
mg/1
7750
730
147
4
2
75
6240
31240
1400
693
48280
7.20
1.037
1570m
3b1)
mg/1
7250
365
88
1
2
34
6520
29820
1900
1115
47095
7.80
1.037
Spesific
gravity from
TDS (gcm~3) 1.032 1.036 1.031 1 .034 1.033
Resistivety
(ohm-m) 0.146 0.132 0 .143 0 .132 0 . 1 3 2
f1) a = sample from 3.785 1 chamber
2) b = sample from 10.409 1 chamber
LAB 84.221
L

13
Table 4
Ion concentrations and % mud filtrate in FMT-samples after
correction for cushion water contamination.
DepthFMT
noIon
Na
Ca
Mg
Ba
Fe
Sr
K
Cl
S04HC03
% mud
filtrate
la1)mg/1
9945
1264
275
3
3
165
4897
34059
702
662
52
1574,2 m
Ib2)
mg/1
10397
1135
241
3
2
118
8430
35912
1012
725
67
1579
2a1)
mg/1
8866
1121
233
6
3
132
6223
33708
801
634
61
, 5 m
2b2)
mg/1
8362
788
159
4
2
80
6733
33708
1511
748
83
1570:
3b1}
mg/1
7410
373
90
1
2
35
6663
30476
1942
1140
93
1) a = sample from 3.785 1 chamber
b = sample from 10.409 1 chamber
LAB 84.221
l
•l̂ Bktl=«-
14
Table 5
Estimated ion concentration in the formation water from well no
31/3-1
Ion concentration
Ion
Nå
Ca
Mg
Ba
Sr
K
ClS04CO.,
mg /l
15700
3900
550
150
400
(a5600) b500
44500
30
300
meq/1
683
90
22
2
10
(a143)b!3
1255
1
5
TDS (71130) 66030
Cation/anion
ratio (a!080/1261) b950/1261
Spesific gravity from the aTDS: 1.0490 gem"
Specific gravity from the TDS- value (with expected potassium
concentration): 1.0455 gem
a) The estimated potassium conscentration
b) The expected potassium concentration
LAB 84.221
15
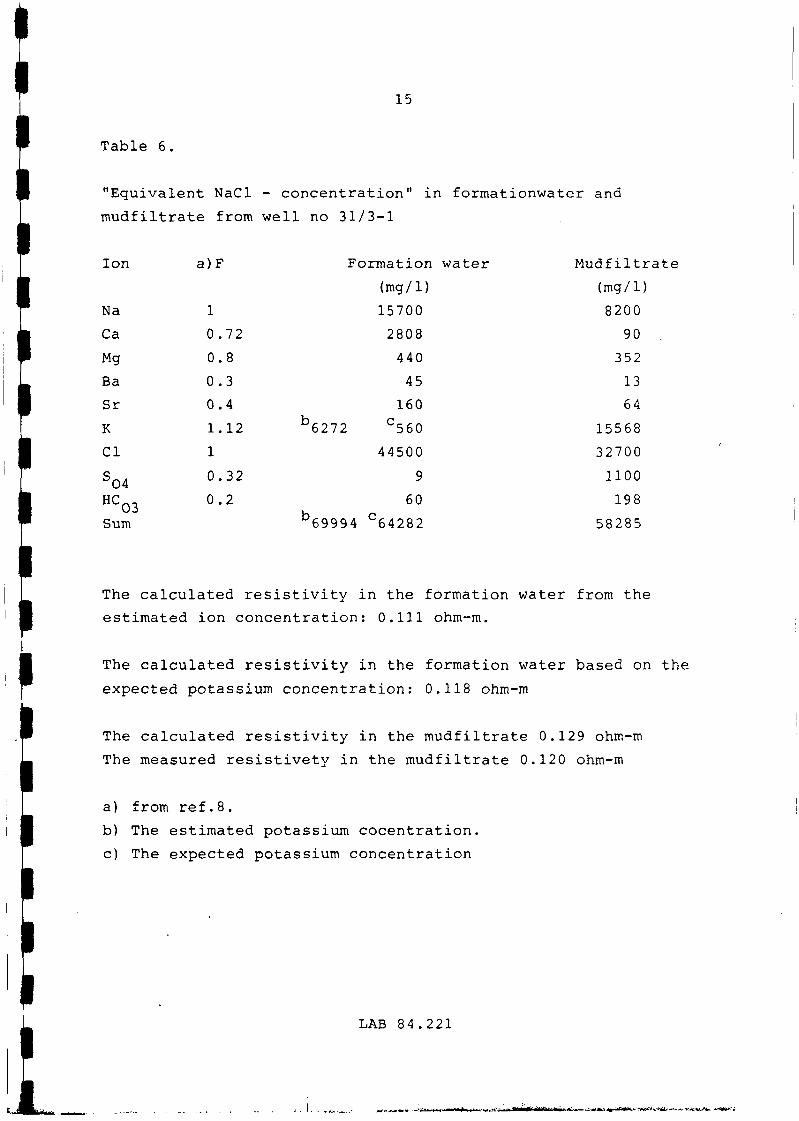
Table 6.
"Equivalent NaCl - concentration" in formationwater and
mudfiltrate from well no 31/3-1
Ion a)F
Na
Ca
Mg
Ba
Sr
K
Cl
S04HC03Sum
1
0.72
0.8
0.3
0.4
1.12
1
0.32
0.2
'6272
69994
Formation water
4
(mg/1)
15700
2808
440
45
160C560
44500
9
60C64282
Mudf iltrate
(mg/1)
8200
90
352
13
64
15568
32700
1100
198
58285
The calculated resistivity in the formation water from the
estimated ion concentration: 0.111 ohm-m.
The calculated resistivity in the formation water based on the
expected potassium concentration: 0.118 ohm-m
The calculated resistivity in the mudfiltrate 0.129 ohm-m
The measured resistivety in the mudfiltrate 0.120 ohm-m
a) from ref.8.
b) The estimated potassium cocentration.
c) The expected potassium concentration
LAB 84.221

Rg. 1 THE IONCONCENTRATION IN ESTIMATED FORMATION WATER
AS A FUNCTION OF % MUDFILTRATE IN THE SAMPLE.
% FORMATION WATER
cone (mg/l)
^^ Od ^^ ^3 'o cnooo ooo
oo§ 88
COooo
coroo- -0000
co00 -KØO 10 OOo woo- -o ooo
co§ _ _o oooo ooo
co£ NO -tO>Oo cnoo--o ooo
co/roooo ooo
Ul OO+/.'ooo ' '
20 40-H
O) / >*-* -oo / ̂ -7o o o - - /* /
ocosozrW
• NåD CaO MgA Sr• Cl
100 80 % MUDFILTRATE 6°
60
40
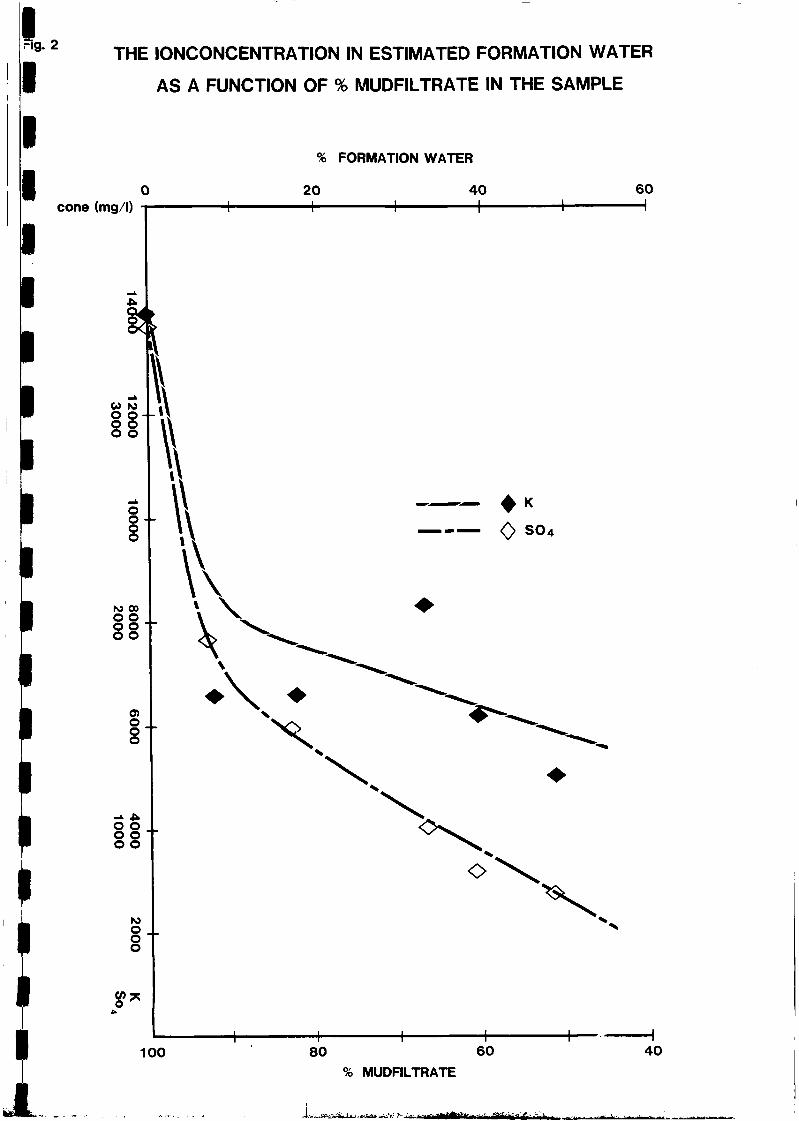
IFig. 2
IIII
THE IONCONCENTRATION IN ESTIMATED FORMATION WATER
AS A FUNCTION OF % MUDFILTRATE IN THE SAMPLE
cone (mg/l)
% FORMATION WATER
20—I-
40
H-60
- \\S 8 - - Ao o88
to oo88o o
\&V
O)o
o o00"o o
roo
100
X
80
- *"--- 0 so4
60 40
% MUDFILTRATE
f •tfc«iiJ'M.k
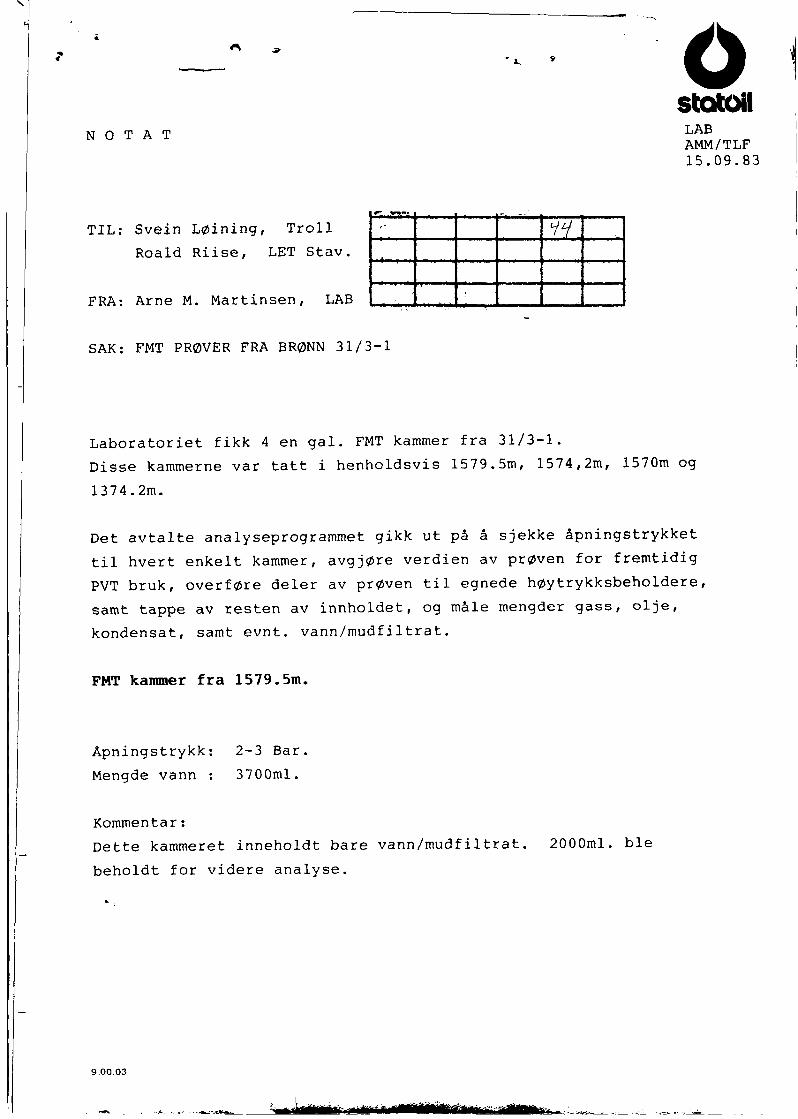
N O T A T
oStatoil
LABAMM/TLF15.09.83
TIL: Svein Løining, Troll
Roald Riise, LET Stav.
FRA: Arne M. Martinsen, LAB
SAK: FMT PRØVER FRA BRØNN 31/3-1
Laboratoriet fikk 4 en gal. FMT kammer fra 31/3-1.
Disse kammerne var tatt i henholdsvis 1579.5m, 1574,2m, 1570m og
1374.2m.
Det avtalte analyseprogrammet gikk ut på å sjekke åpningstrykket
til hvert enkelt kammer, avgjøre verdien av prøven for fremtidig
PVT bruk, overføre deler av prøven til egnede høytrykksbeholdere,
samt tappe av resten av innholdet, og måle mengder gass, olje,
kondensat, samt evnt. vann/mudfiltrat.
FMT kammer fra 1579.5m.
Apningstrykk: 2-3 Bar,
Mengde vann : 3700ml.
Kommentar:
Dette kammeret inneholdt bare vann/mudfiltrat
beholdt for videre analyse.
2000ml. ble
9.00.03
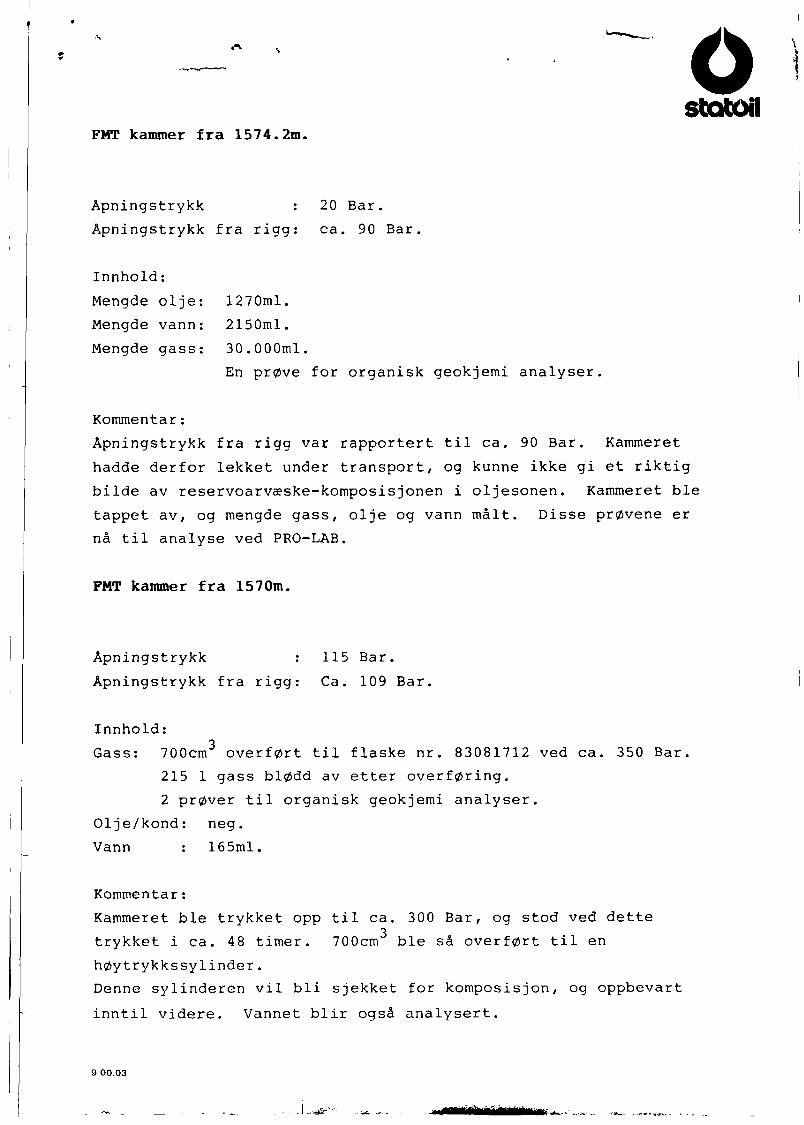
oStatoil
FMT kanoner fra 1574.2m.
Åpningstrykk : 20 Bar.
Åpningstrykk fra rigg: ca. 90 Bar.
Innhold:
Mengde olje: 1270ml.
Mengde vann: 2150ml.
Mengde gass: 30.000ml.
En prøve for organisk geokjemi analyser.
Kommentar:
Åpningstrykk fra rigg var rapportert til ca. 90 Bar. Kammeret
hadde derfor lekket under transport, og kunne ikke gi et riktig
bilde av reservoarvæske-komposisjonen i oljesonen. Kammeret ble
tappet av, og mengde gass, olje og vann målt. Disse prøvene er
nå til analyse ved PRO-LAB.
FMT kammer fra 1570m.
Åpningstrykk : 115 Bar.
Åpningstrykk fra rigg: Ca. 109 Bar.
Innhold:
Gass: 700cm overført til flaske nr. 83081712 ved ca. 350 Bar,
215 l gass blødd av etter overføring.
2 prøver til organisk geokjemi analyser.
Olje/kond: neg.
Vann : 165ml.
Kommentar:
Kammeret ble trykket opp til ca. 300 Bar, og stod ved dette
trykket i ca. 48 timer. 700cm ble så overført til en
høytrykkssylinder.
Denne sylinderen vil bli sjekket for komposisjon, og oppbevart
inntil videre. Vannet blir også analysert.
9.00.03
. l ,-
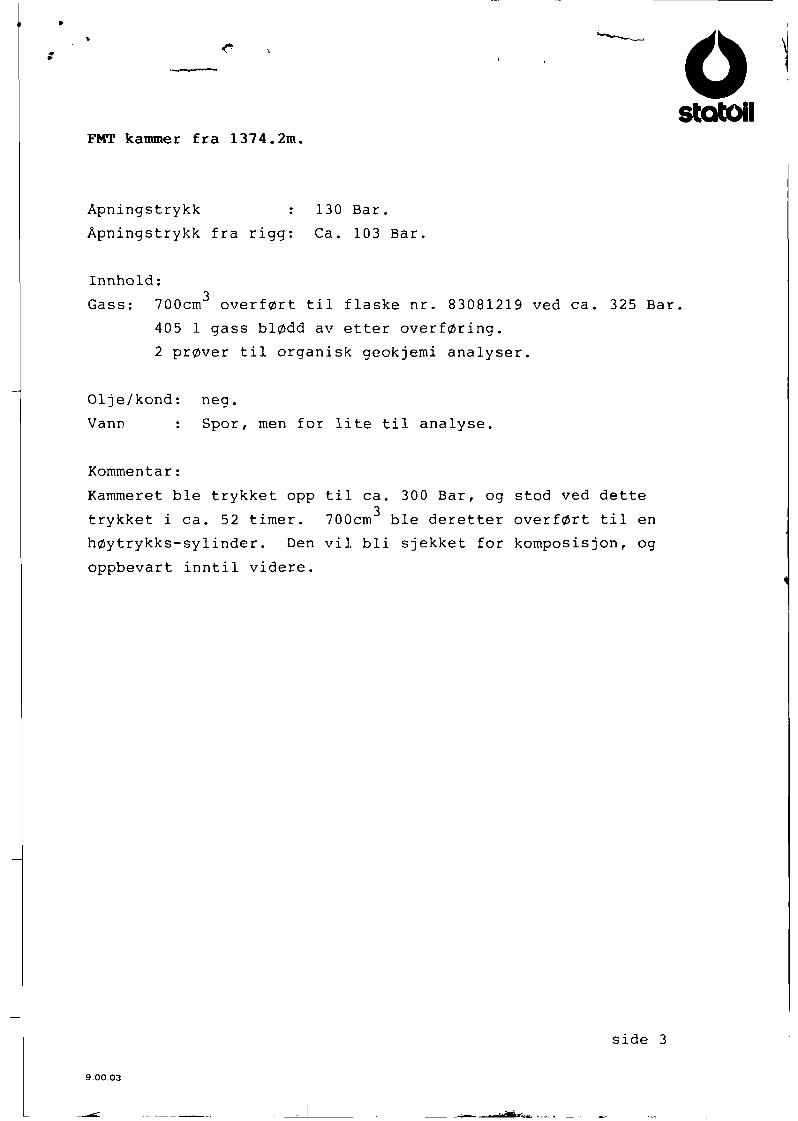
ostotoil
FMT kammer fra 1374.2m.
Apningstrykk : 130 Bar.
Åpningstrykk fra rigg: Ca. 103 Bar.
Innhold:
Gass: 700cm overført til flaske nr. 83081219 ved ca. 325 Bar
405 l gass blødd av etter overføring.
2 prøver til organisk geokjemi analyser.
Olje/kond: neg.
Vann : Spor, men for lite til analyse.
Kommentar:
Kammeret ble trykket opp til ca. 300 Bar, og stod ved dette
trykket i ca. 52 timer. 700cm ble deretter overført til en
høytrykks-sylinder. Den vil bli sjekket for komposisjon, og
oppbevart inntil videre.
side 3
9.00.03