Story points considered harmful - or why the future of estimation is really in our past
45
Story Points Considered Harmful Or why the future of estimation is really in our past... #ard2012, Riga All pictures available on
-
Upload
vasco-duarte -
Category
Sports
-
view
4 -
download
3
description
Transcript of Story points considered harmful - or why the future of estimation is really in our past

Story Points Considered HarmfulOr why the future of estimation is really in our past...
#ard2012, Riga All pictures available on

Vasco Duarte
@duarte_vascohttp://bit.ly/vasco_bloghttp://bit.ly/vasco_slideshare
Talk Developed with @josephpelrine


Tell me again: why did we move here?


</intro><talk>


The Flat Earth Society (also known as the International Flat Earth Society or the International Flat Earth Research Society) is an organization that seeks to further the belief that the Earth is flat instead of an oblate spheroid
More at: http://theflatearthsociety.org

Expert estimation
Consensus estimation
Function Point Analysis
COCOMO
SDM

Precognition [pree-kog-nish-uhn] pre·cog·ni·tion [pree-kog-nish-uhn] 1. knowledge of a future event or situation,
especially through extrasensory means.

(Hindsight is always twenty-twenty)-Anonymous (the other one!)
Life Can only be understood backwards, but it must be lived forwards…
- Soren Kierkegaard


To be or not to be complex! That is the question!

Looking for an alternative...

• Q1: Is there sufficient difference between what Story Points and ’number of items’ measure to say that they don’t measure the same thing?
• Q2: Which one of the two metrics is more stable? And what does that mean?
• Q3: Are both metrics close enough so that measuring one (# of items) is equivalent to measuring the other (Story Points)?

Data summary
• Nine (9) data sets (a few more by now...)• I was not a stakeholder or had any role in any
of these projects• Data came from different companies and
different sized teams

The Data
spr22 spr21 spr20 spr19 spr18 spr17 spr16 spr150
5
10
15
20
25
30
35
40
45
Story pts doneitems done
Correlation: 0,755
Team A / Company N
spr21 spr20 spr19 spr18 spr170
5
10
15
20
25
30
35
40
45
Sp NormalizedItems done normalized
Correlation (w/out normalization): 0,92
Team CB / Company N
spr F spr E spr D spr C spr B spr A0.00
10.00
20.00
30.00
40.00
50.00
60.00
70.00
80.00
Sp NormalizedItems done normalized
Team HC / Company N
Correlation (w/out) normalization: 0,83
spr14 spr13 spr12 spr11 spr10 spr9 spr8 spr70
10
20
30
40
50
60
Story pts doneitems done
Team CF / Company N
Correlation: 0,51(0,71 without the spr14)

The Data
sprint 40
sprint 41
sprint 39
sprint 38
sprint 37
sprint 36
sprint 35
sprint 34
0.00
2.00
4.00
6.00
8.00
10.00
12.00
14.00
Sp Normalized
Items done normalized
Team HCM / Company N
Correlation (w/out normalization): 0,88
1 3 5 7 9 11 13 15 17 19 210.00
20.00
40.00
60.00
80.00
100.00
120.00
140.00
160.00
180.00
SP normalizedItems Normalized
Team AT / Company AT
Correlation: 0,75
1 2 3 4 5 6 7 8 9 10 11 12 13 14 15 16 170
50
100
150
200
250
Story point velocityItem velocity
Correlation: 0,70
Team 2 / Company RF
1 2 3 4 5 6 7 8 9 10 11 12 13 14 15 160
20
40
60
80
100
120
140
Story point velocityItem velocity
Correlation: 0,75
Team 1 / Company RF
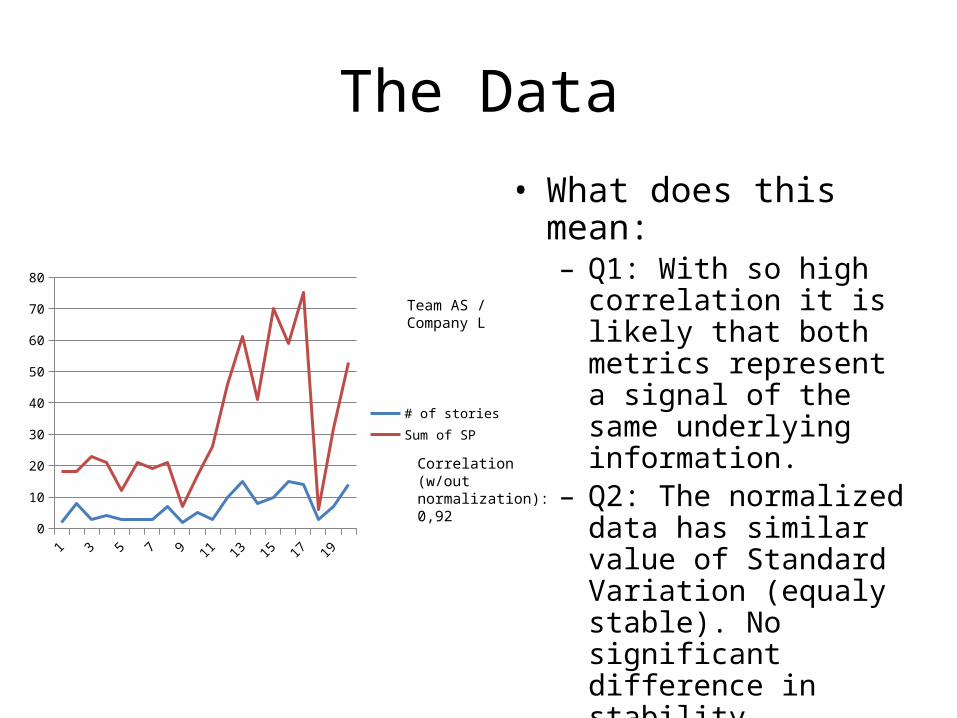
The Data• What does this mean:
– Q1: With so high correlation it is likely that both metrics represent a signal of the same underlying information.
– Q2: The normalized data has similar value of Standard Variation (equaly stable). No significant difference in stability
– Q3: They seem to measure the same thing so...
1 2 3 4 5 6 7 8 9 10 11 12 13 14 15 16 17 18 19 200
10
20
30
40
50
60
70
80
# of storiesSum of SP
Team AS / Company L
Correlation (w/out normalization): 0,92

We should analyse the claims that justify Story Points...

• Claim 1: allows us to change our mind whenever we have new information about a story
• Claim 2: works for both epics and smaller stories• Claim 3: doesn’t take a lot of time• Claim 4: provides useful information about our
progress and the work remaining• Claim 5: is tolerant of imprecision in the
estimates• Claim 6: can be used to plan releases• Source: Mike Cohn, User Stories Applied, page 87
More details at: http://bit.ly/ard2012_estimation

Claim 1: allows us to change our mind whenever we have new information about a story
• No explanation about what this means in the User Stories Applied book
• Measuring completed number of items allows for immediate visibility of the impact of the new items in the progress (project burndown)

Claim 2: works for both epics and smaller stories
• Allowing for large estimates for items in the backlog does help to account for the impact of very large items by adding uncertainty.
• The same uncertainty exists in any way we may use to measure progress. The fact is that we don’t really know if an Epic (say 100 SPs) is really equivalent to a similar size aggregate of User Stories (say 100 times 1 SP story). Conclusion: there is no significant added information by classifying a story in a 100 SP category.

Story Points
Hours

Claim 3: doesn’t take a lot of time
• Not my experience. Although some progress has been done by people like Ken Power (at Cisco) with the Silent Grouping technique, the fact that we need such technique should dispute any idea that estimating in SP’s ”doesn’t take a lot of time”
Silent Grouping technique: http://slidesha.re/AgileKonstanz_silentgrouping

Claim 4: provides useful information about our progress and the work remaining
• This claim holds if, and only if you have estimated all of your stories. Even the stories that will only be developed a few months or even a year later (for long project). This approach is not very efficient (Claim 3).
• Basing your progress assessment on the Number of Items completed in each Sprint is faster to calculate (# of items in the PBL / velocity per Sprint = number of Sprints left) and can be used to provide critical information about project progress. Example:

The example you are about to see is a real life example. One where the data collected made a big impact on an important business decision.
The names have been changed to protect the innocent...

Sprint xProject feature burndown
0
20
40
60
80
100
120
140
Sprints
Nu
mb
er
of
Fe
atu
res
op
en
n. items done in this sprint (Actual Velocity)
Projected Items still open at the end of the sprint
Actual items open at the end of the sprint(including results of removing items)
Pilot feature burndown
Pilot projection
Ideal Pilot burndown
Ideal Release Feature burndown
Evolution of velocity
Start of pilot/beta
Release date
Start of pilot/beta
Actual progress
trend
What progress
trend should be
What progress
trend should be

Sprint x + 1Project feature burndown
0
20
40
60
80
100
120
140
160
180
Sprints
Nu
mb
er
of
Fe
atu
res
op
en
n. items done in this sprint (ActualVelocity)
Projected Items still open at the end ofthe sprint
Actual items open at the end of the sprint(including results of removing items)
Pilot feature burndown
Pilot projection
Ideal Pilot burndown
Ideal Release Feature burndown
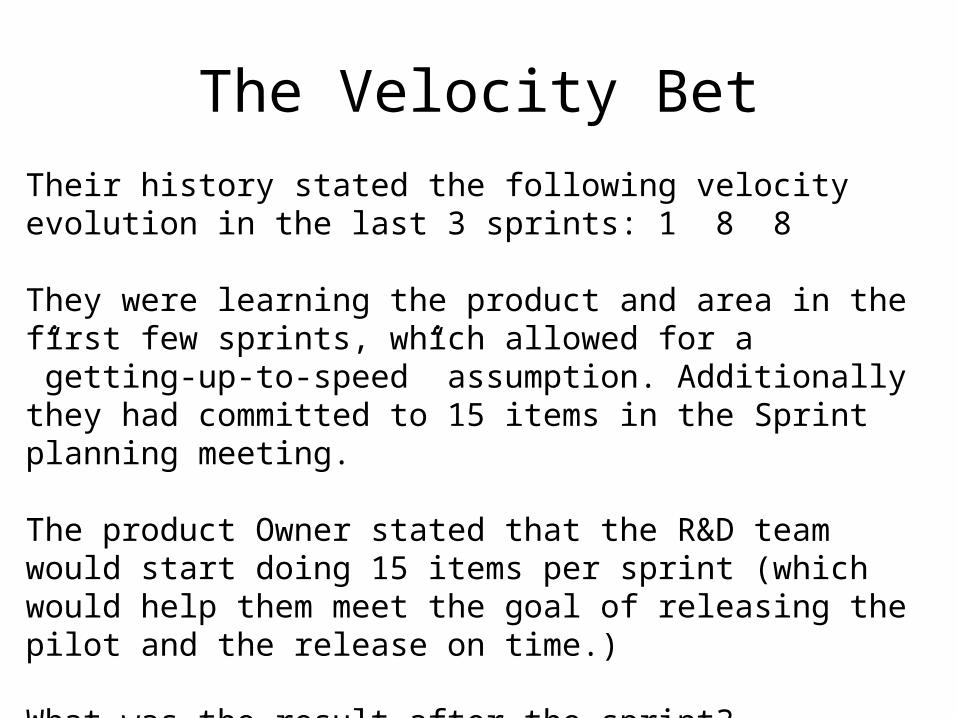
The Velocity BetTheir history stated the following velocity evolution in the last 3 sprints: 1 8 8
They were learning the product and area in the first few sprints, which allowed for a ”getting-up-to-speed” assumption. Additionally they had committed to 15 items in the Sprint planning meeting.
The product Owner stated that the R&D team would start doing 15 items per sprint (which would help them meet the goal of releasing the pilot and the release on time.)
What was the result after the sprint?

Sprint x + 2Project feature burndown
0
20
40
60
80
100
120
140
160
180
Sprints
Nu
mb
er
of
Fe
atu
res
op
en
n. items done in this sprint (ActualVelocity)
Projected Items still open at the end ofthe sprint
Actual items open at the end of thesprint (including results of removingitems)
Pilot feature burndown
Pilot projection
Ideal Pilot burndown
Ideal Release Feature burndown
They did 10 items. A 20% increase in velocity.

Finally...
We release Stories/Backlog items, not story points...

The Number of Items technique in a nutshell
• When doing Backlog Grooming or Sprint Planning just ask: can this Story be completed in a Sprint by one person? If not, break the story down!
• For large projects use a further level of abstraction: Stories fit into Sprints, therefore Epics fit into meta-Sprints (for example: meta-Sprint = 4 Sprints)

Why it works
• By continuously harmonizing the size fo the Stories/Epics you are creating a distribution of the sizes around the median:
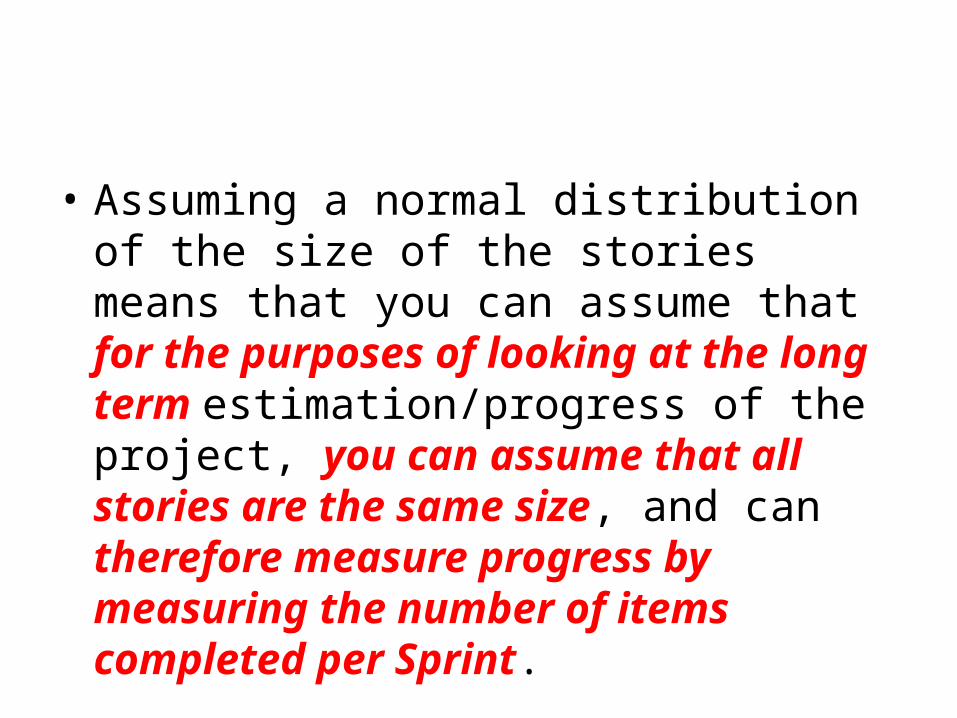
• Assuming a normal distribution of the size of the stories means that you can assume that for the purposes of looking at the long term estimation/progress of the project, you can assume that all stories are the same size, and can therefore measure progress by measuring the number of items completed per Sprint.

One more thing...
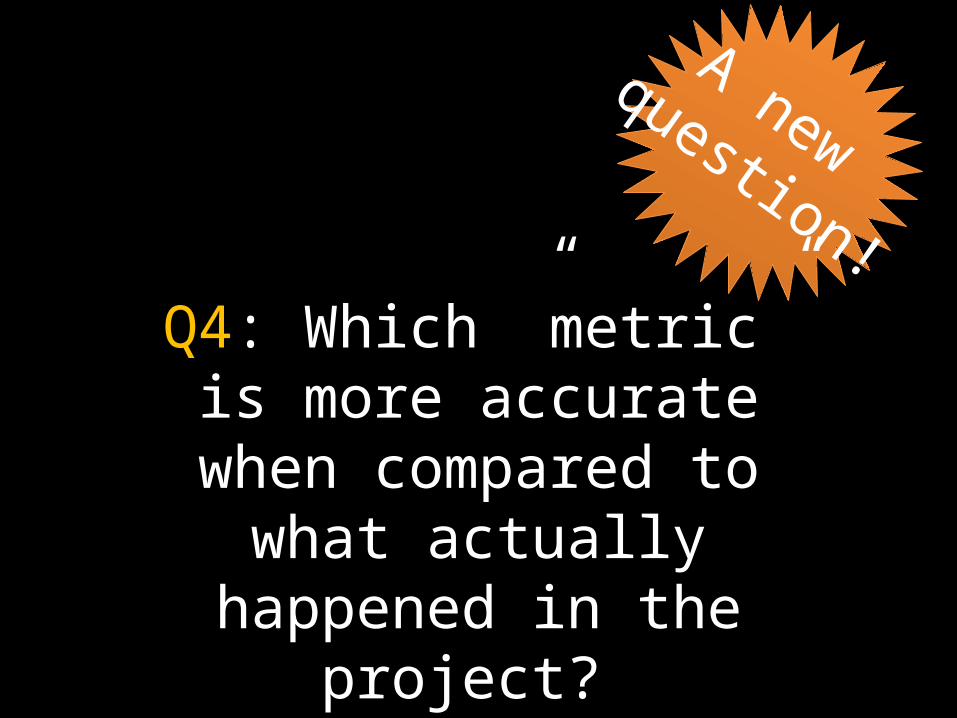
Q4: Which ”metric” is more accurate when compared to
what actually happened in the project?
A new question!
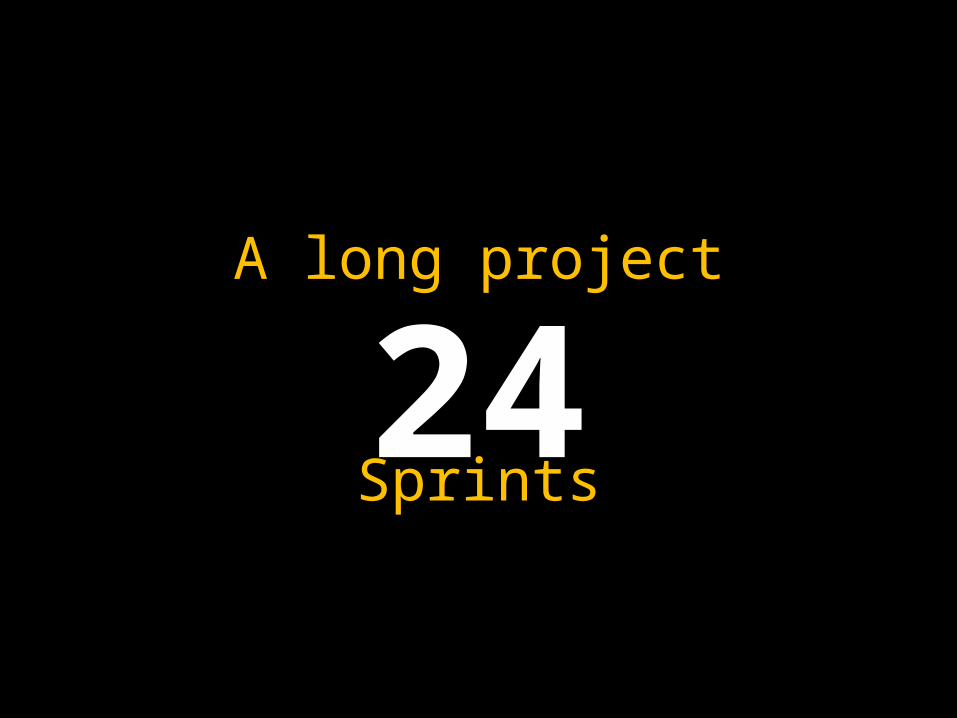
A long project
24Sprints

Which metric predicted most accurately the output of the
whole project?
a) After only the first 3 Sprintsb) After only the first 5 Sprints

Disclaimer...This is only one project! We need more data to verify or contradict these findings...
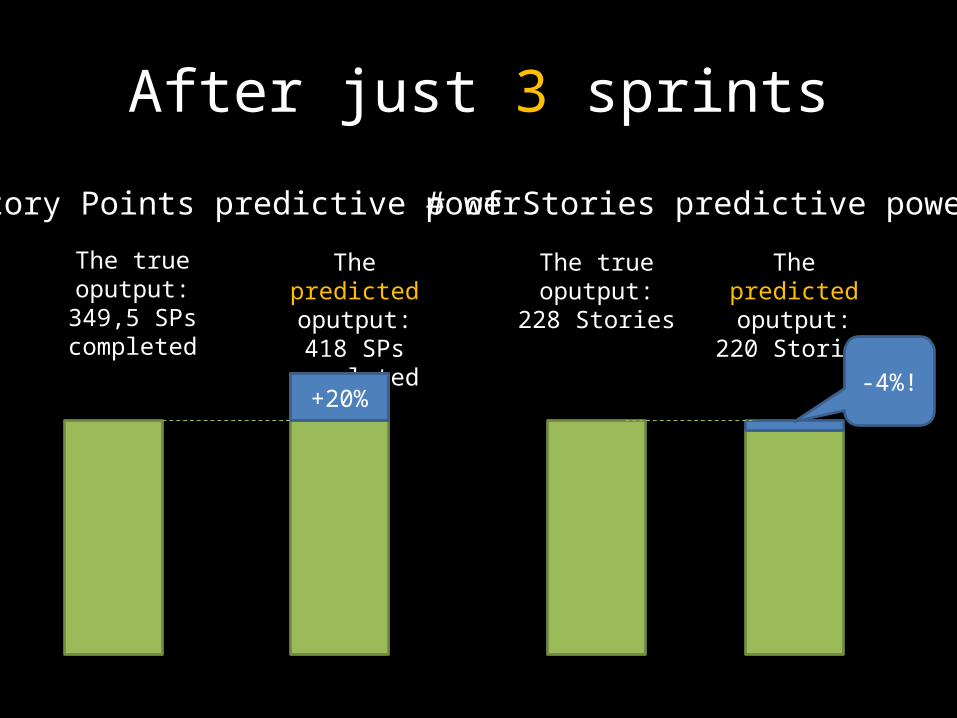
After just 3 sprints
# of Stories predictive powerStory Points predictive power
The true oputput: 349,5 SPs completed
The predicted oputput: 418
SPs completed
+20%
The true oputput: 228
Stories
The predicted oputput: 220
Stories
-4%!

After just 5 sprints
# of Stories predictive powerStory Points predictive power
The true oputput: 349,5 SPs completed
The predicted oputput: 396
SPs completed
+13%
The true oputput: 228
Stories
The predicted oputput: 220
Stories
-4%!
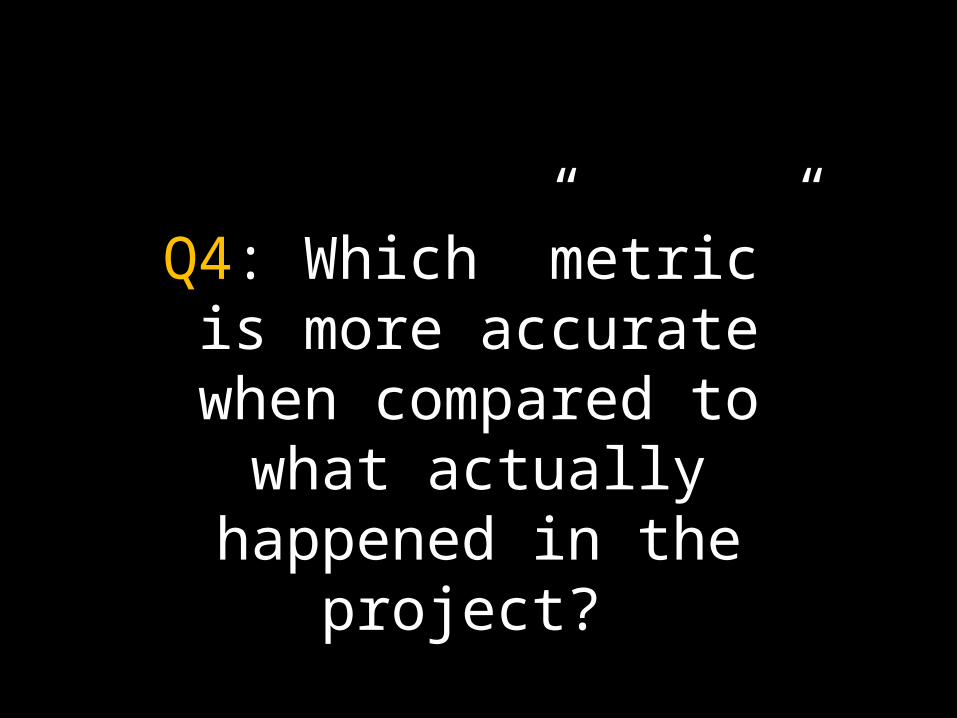
Q4: Which ”metric” is more accurate when compared to
what actually happened in the project?

Click here!Sign-up and get the paper today!
Sign-up and receive this paper which explains why we need #NoEstimates and how to get started!Includes:• Why estimates should not be used,
and how they fail• An example of how #NoEstimates
can reach a 4% accuracy to actuals• How to apply #NoEstimates:
Vasco’s recipe!