Stormwater Program Update to McLean Citizens Association
35
January 2 1, 2015
-
Upload
fairfax-county -
Category
News & Politics
-
view
135 -
download
0
Transcript of Stormwater Program Update to McLean Citizens Association

January 21, 2015

Stormwater Drivers
• MS4 Permit
• Bay TMDL
• Other Local TMDLs
• Maintenance of existing facilities
• Public Safety /Emergency Response
• Dam Regulations

• Conveyance Systems
• Dam Safety and Facility Rehabilitation
• Emergency and Flood Response
• Operations
• Stormwater Regulatory Program
• Streams and Water Quality

• Inspect and maintain approximately 1,500 miles of storm sewer
• Investigate storm drainage and flooding complaints
• Maintain inventory of county facilities
Pipe Before Lining
Pipe After Lining
2013:• Inspected 255 miles of pipe and
12,000 structures• Relined/repaired over 19,000 LF
of storm sewer

• Dam certification and regulatory compliance
• Dam inspection and maintenance
• Dredging
2014:• County SWM Facilities: 1749
• Inspected: 486• Cleaned and mowed: 1,355• Maintenance work orders: 3,432
• Private SWM Facilities: 3825• Inspected: 744

Trends
6

• National Flood Insurance Program
Community Rating System (CRS)
• Storm monitoring
2013:• Flood response events: 8 • Snow removal events: 20
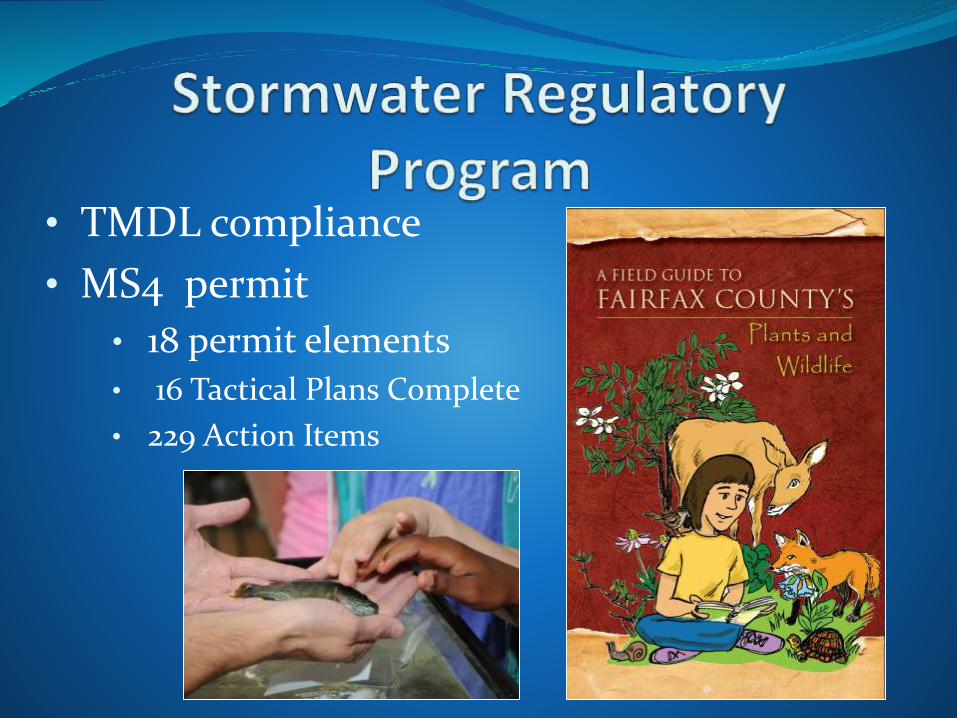
• TMDL compliance
• MS4 permit
• 18 permit elements
• 16 Tactical Plans Complete
• 229 Action Items

• Wet and dry weather monitoring
• Annual stream bio-assessments (since 1999)
• Evaluate trends in stream health countywide
2014:• Dry Weather Monitoring:
• Screened: 102 outfalls• 47 wet• 0 required track down
• Benthic Macroinvertebrates:• Sites Monitored: 70
• Fish Community:• Sites Monitored: 23
• Bacteria Monitoring:• Samples Taken: 176

Stream Quality Index
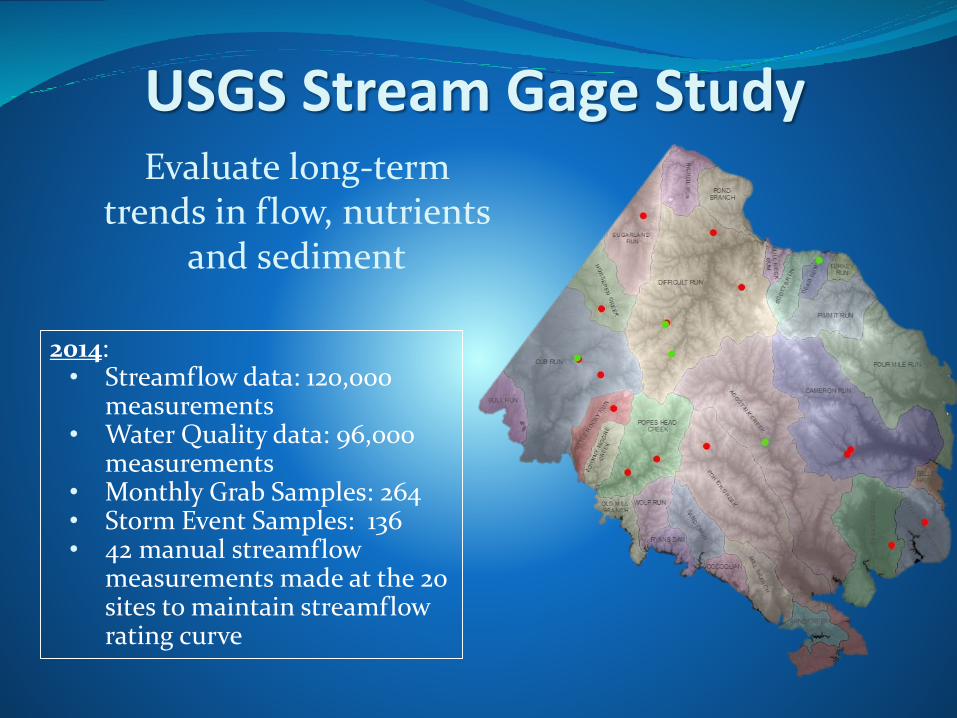
USGS Stream Gage StudyEvaluate long-term
trends in flow, nutrients and sediment
2014:• Streamflow data: 120,000
measurements• Water Quality data: 96,000
measurements• Monthly Grab Samples: 264• Storm Event Samples: 136• 42 manual streamflow
measurements made at the 20 sites to maintain streamflowrating curve

•Rain Barrel Program•Reforestation •Community Outreach & Public Education•Stream clean-ups

• Stormwater Pond Retrofits
• LID Implementation
• Outfall Improvement
• Stream restoration• Area-Wide Drainage
Improvement
http://www.fairfaxcounty.gov/dpwes/stormwater/projects/project_list.htm

Completed Water Quality Projects
7
12
12
1
4
8
2
10 4
2
1
12
Completed Water Quality Projects FY09-14
Number of Projects 83
Acres Treated 9,172
Linear Feet Treated 19,800
Phosphorous Removed
1,262 lb/yr
Nitrogen Removed 3,591 lb/yr
Sediment Removed 277 tons/yr
2
3
1
1
1
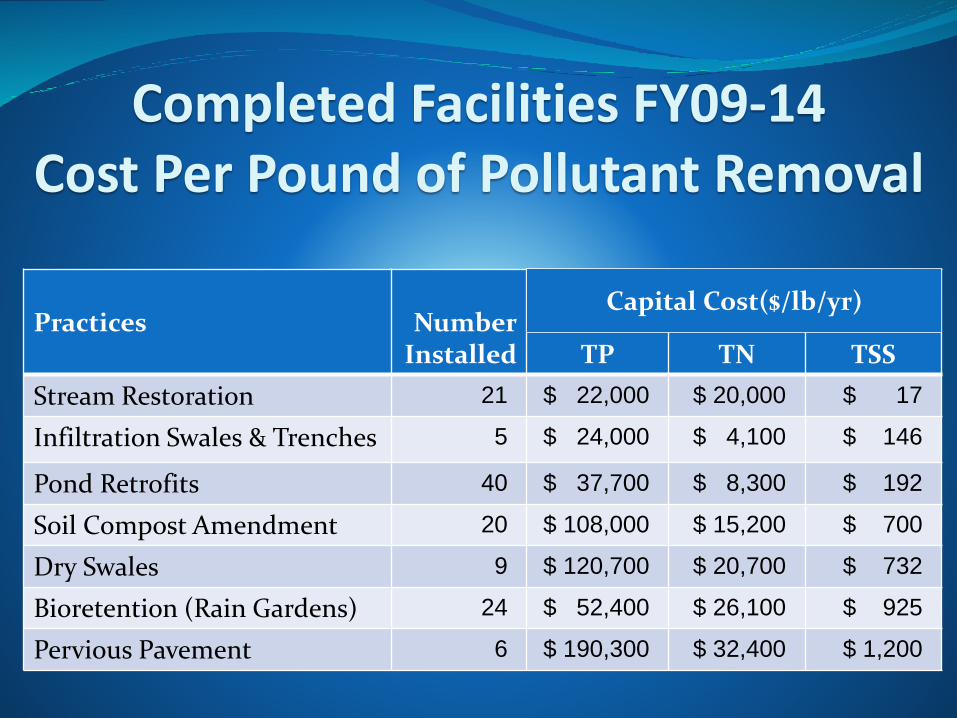
Completed Facilities FY09-14 Cost Per Pound of Pollutant Removal
Practices NumberInstalled TP TN TSS
Stream Restoration 21 $ 22,000 $ 20,000 $ 17
Infiltration Swales & Trenches 5 $ 24,000 $ 4,100 $ 146
Pond Retrofits 40 $ 37,700 $ 8,300 $ 192
Soil Compost Amendment 20 $ 108,000 $ 15,200 $ 700
Dry Swales 9 $ 120,700 $ 20,700 $ 732
Bioretention (Rain Gardens) 24 $ 52,400 $ 26,100 $ 925
Pervious Pavement 6 $ 190,300 $ 32,400 $ 1,200
Capital Cost($/lb/yr)

History of Stormwater Funding
$0.0
$5.0
$10.0
$15.0
$20.0
$25.0
$30.0
$35.0
$40.0
$45.0
$50.0
FY05 FY06 FY07 FY08 FY09 FY10 FY11 FY12 FY13 FY14 FY15Operations (General Fund) Fringe (General Fund)Public Works Construction (Fund 308) Operations (Fund 318)Penny Dedication (Fund 318) Operations, Fringe & Contributory (Fund 125)Stormwater Service District (Fund 125)

Stormwater FY15 Budget
(2%) NVSWCD, Occoquan Lab,Towns, $1.0 M
(12%) Stormwater RegulatoryPrograms, $5.5 M
(9%) Dam Saftey and FacilityRehabilitation, $4.5M
(27%) Streams and WaterQuality, $13.2M
(10%) Conveyance Systems,$5.0M
(38%) Operations, $18.1M
(2%) Emergency and FloodResponse, 0.9M
38% Operations
2% NVSWCD, Lab, Towns
2% Emergency & Flood Response


19
Uncontrolled overland
flow leads to …Flooding
Flooding Managed flow

Outfall RestorationLoftridge- Before & After
Drainage Area(acres)
Phosphorous Removal(lbs/yr)
Nitrogen Removal(lbs/yr)
Sediment Removal(tons/yr)
34 11 13 3.8

Outfall RestorationLoftridge- Now
Drainage Area(acres)
Phosphorous Removal(lbs/yr)
Nitrogen Removal(lbs/yr)
Sediment Removal(tons/yr)
34 11 13 3.8

Outfall RestorationSheffield Hunt– Before & After
Drainage Area(acres)
Phosphorous Removal(lbs/yr)
Nitrogen Removal(lbs/yr)
Sediment Removal(tons/yr)
29 64 188 25

Stream RestorationSheffield Hunt - Now

Stream RestorationBridal Path - Before & After
Drainage Area(acres)
Phosphorous Removal(lbs/yr)
Nitrogen Removal(lbs/yr)
Sediment Removal(tons/yr)
162 138 790 132

Stream RestorationDead Run – Before

Stream RestorationDead Run – During & After
Drainage Area(acres)
Phosphorous Removal(lbs/yr)
Nitrogen Removal(lbs/yr)
Sediment Removal(tons/yr)
415 15 283 2.5

Stream RestorationWolftrap Creek- Before & After
Drainage Area(acres)
Phosphorous Removal(lbs/yr)
Nitrogen Removal(lbs/yr)
Sediment Removal(tons/yr)
766 90 1,016 172

Fair Woods- Before & After
Area Treated(acres)
Phosphorous Removal(lbs/yr)
Nitrogen Removal(lbs/yr)
Sediment Removal(tons/yr)
26 9 44 0.9
Pond Retrofits

Fair Woods- Now
Area Treated(acres)
Phosphorous Removal(lbs/yr)
Nitrogen Removal(lbs/yr)
Sediment Removal(tons/yr)
26 9 44 0.9
Pond Retrofits

Low Impact DevelopmentSpring Hill RECenter - After
Area Treated(acres)
Phosphorous Removal(lbs/yr)
Nitrogen Removal(lbs/yr)
Sediment Removal(tons/yr)
14 2.5 11.5 0.2

Kings Park West- Bioretention and Reforestation Before
Drainage Area(acres)
Phosphorous Removal(lbs/yr)
Nitrogen Removal(lbs/yr)
Sediment Removal(tons/yr)
3 5 35 0.3
Low Impact Development

Kings Park West- Bioretention and Reforestation now
Drainage Area(acres)
Phosphorous Removal(lbs/yr)
Nitrogen Removal(lbs/yr)
Sediment Removal(tons/yr)
3 5 35 0.3
Low Impact Development

Fred McMath Facility - Bioretention Before & After
Drainage Area(acres)
Phosphorous Removal(lbs/yr)
Nitrogen Removal(lbs/yr)
Sediment Removal(tons/yr)
1 1 9 0.1
Low Impact Development

Low Impact DevelopmentNoman Cole WWTP- Before & After
Area Treated(acres)
Phosphorous Removal(lbs/yr)
Nitrogen Removal(lbs/yr)
Sediment Removal(tons/yr)
0.6 0.4 2

Questions?
Stormwater Planning Division 703-324-5500, TTY 711www.fairfaxcounty.gov/dpwes/stormwater
www.fairfaxcounty.gov/dpwes/watersheds
[email protected] County is committed to nondiscrimination on the basis of disability in all county programs, services and activities.
Reasonable accommodations will be provided upon request.