Stormwater Assessment and Design Modeling Tools · design of stormwater management practices, flow...
32
APPENDIX D – RESPONSE TO COMMENTS ON THE DRAFT MS4 PERMIT APRIL, 2008 1 Stormwater Assessment and Design Modeling Tools For Implementation of Stormwater Management Plans Abstract: Computer models are commonly used for simulation of stormwater runoff, pollutant loading and design of stormwater management structures and pollutant removal practices. This study examined appropriate applications of available modeling tools for implementation of New York State stormwater design standards requirements and assessment of Municipal Separate Storm Sewer System (MS4) Stormwater Management Plans (SWMP). The study provides a summary of required elements, data, procedures, and software used for stormwater modeling. Various details of the designs for state standard practices can be configured by the use of simple methods and techniques and used along with, or exported to more advanced stormwater modeling tools. The study provides examples of design applications for satisfying state standards and application of the simple methods for stormwater management analysis and tracking. Introduction Stormwater quality and quantity computer models are used for pollution load assessment, watershed planning and design of stormwater control and treatment facilities. This study examines appropriate applications of available modeling tools for implementation of New York State stormwater design standards requirements and assessment of Municipal Separate Storm Sewer System (MS4) Stormwater Management Plans (SWMP). Water quantity models are generally used for hydrologic and or hydraulic simulation, design of stormwater management practices, flow routing and flood control. Water quality models range from simple tools for screening watershed pollutant load to advanced simulation of in-stream pollutant transport and transform in a dynamic system. In urban stormwater management, hydrology and hydraulic models are heavily used by the design professionals for an efficient design of the configuration of stormwater controls, while water quality models are commonly used for pollutant load estimates and source identification in management decision-making process.
Transcript of Stormwater Assessment and Design Modeling Tools · design of stormwater management practices, flow...

APPENDIX D – RESPONSE TO COMMENTS ON THE DRAFT MS4 PERMIT APRIL, 2008
1
Stormwater Assessment and Design Modeling Tools For Implementation of Stormwater Management Plans
Abstract:
Computer models are commonly used for simulation of stormwater runoff, pollutant
loading and design of stormwater management structures and pollutant removal practices.
This study examined appropriate applications of available modeling tools for
implementation of New York State stormwater design standards requirements and
assessment of Municipal Separate Storm Sewer System (MS4) Stormwater Management
Plans (SWMP). The study provides a summary of required elements, data, procedures,
and software used for stormwater modeling. Various details of the designs for state
standard practices can be configured by the use of simple methods and techniques and
used along with, or exported to more advanced stormwater modeling tools. The study
provides examples of design applications for satisfying state standards and application of
the simple methods for stormwater management analysis and tracking.
Introduction
Stormwater quality and quantity computer models are used for pollution load assessment,
watershed planning and design of stormwater control and treatment facilities. This study
examines appropriate applications of available modeling tools for implementation of New
York State stormwater design standards requirements and assessment of Municipal
Separate Storm Sewer System (MS4) Stormwater Management Plans (SWMP).
Water quantity models are generally used for hydrologic and or hydraulic simulation,
design of stormwater management practices, flow routing and flood control. Water
quality models range from simple tools for screening watershed pollutant load to
advanced simulation of in-stream pollutant transport and transform in a dynamic system.
In urban stormwater management, hydrology and hydraulic models are heavily used by
the design professionals for an efficient design of the configuration of stormwater
controls, while water quality models are commonly used for pollutant load estimates and
source identification in management decision-making process.

APPENDIX D – RESPONSE TO COMMENTS ON THE DRAFT MS4 PERMIT APRIL, 2008
2
EPA’s Compendium of Tools for Watershed Assessment and TMDL Development
provides an excellent source of information for selection of an appropriate model.
Although computation methods and water quality components of the available model
engines have not significantly changed lately, recent development of stormwater
regulations has led the industry in a direction for more effective and innovative
application of the design tools. This report focuses on methods and models with most
immediate use for implementation of urban stormwater management and design. This
study examines some of the urban modeling tools available commercially or in public
domain. However, the list of models discussed in this paper is not exhaustive. Selections
are made solely based on providing simulation examples for required design components
and program needs.
Applications:
Stormwater modeling tools may be grouped to three types of applications: hydrologic
models, hydraulic models and water quality models. Some of the modeling tools provide
a combination of functions and best apply to the specific applications for which they are
designed. Selection of an appropriate tool is made based on the capability, strength and
appropriateness of the tool in answering the question and objectives of the study. The
purpose of this paper is evaluation of modeling tools that useful for implementation of
Phase II Stormwater rules and since the rules calls for technology based controls, this
study focuses on modeling tools for the design of stormwater management practices.
Watershed models are discussed for comparative analysis of stormwater management
practice implementation. Water quality models are discussed for applications where in-
stream water quality is of significance such as TMDL watersheds.
A typical modeling process involves identification of modeling objectives, resources
identification (hardware, software, expertise), data collection, model selection,
watershed/field characterization, model execution (calibration, validation, verification),
model post processing, output analysis and report.

APPENDIX D – RESPONSE TO COMMENTS ON THE DRAFT MS4 PERMIT APRIL, 2008
3
Objectives Identification:
Objectives are identified by the questions that need to be answered. That is the key factor
that sets the goal and extent of all related activities. The process identified in this report
is limited to the needs of stormwater program that may involve the use of modeling tools:
Stormwater Pollution Prevention Plan (SWPPP) preparation
Stormwater Management Plan (SMP) implementation assessment
For the purpose of this review several modeling tools, commonly used for hydrology,
hydraulics and watershed assessment are selected. A brief evaluation of each model is
discussed. A few selected tools are applied and their key features are identified. This
evaluation includes the methodologies incorporated in the modeling tools, a brief
description of model capabilities, and examples of actual applications of the models. This
report may provide a useful toll to the communities whom may decide to use the
hydrology/hydraulic/water quality models for assessment of their stormwater
management program, construction plan review, evaluating flood impacts, or analysis for
discharges to sensitive waters. Regulated municipalities may find use of such analysis
tools helpful in their day-to-day decision-making process or long-term stormwater
management and land use control.
This document provides a brief overview of the basic steps involved in the use of
stormwater models and examines the assessment and design capabilities of the
models for applications that are often used by practitioners for compliance with
stormwater regulations. This study does not provide step-by-step instructions for any
of the evaluated models. All readers must refer to the original documentation
provided by the developer of each model. The mention of trade names or commercial
products does not constitute endorsement or recommendation of the authors for use.

APPENDIX D – RESPONSE TO COMMENTS ON THE DRAFT MS4 PERMIT APRIL, 2008
4
Data Management
Modeling stormwater runoff is driven by two sources of data: meteorological data and
land based data. Locating the most appropriate, accurate and recent data that reflect the
characteristics of the watershed, site area, or waterbody can be challenging. Although
most data analysis tools and software are commercially available, most spatial and
historical data sets remain in public domain. Water quality and flow measures are as
significant as physical features in water quality modeling. The calibration and
verification process in watershed modeling involve use of pollutant measures in the
surface water of concern. This section briefly lists some of the resources commonly used
in stormwater modeling in the following order:
Meteorological Data
Distribution List
Spatial Data
Data Distribution
Federal Agencies
State Agencies
Local Agencies
Academic Sources
Other Sources of Interest
Data Category
Waters
Land use/cover
Watershed boundary
Slope length/percentage
CAD compatibility
Commercial GIS Software
Guidance for resources of tabular or spatial data is provided on DEC website.

APPENDIX D – RESPONSE TO COMMENTS ON THE DRAFT MS4 PERMIT APRIL, 2008
5
Hydrologic Models
Hydrologic models are used to quantify rainfall-runoff and flow hydrograph. They
provide a basis for most hydraulics and water quality computations. Hydrologic models
are typically characterized by following properties:
Input parameters:
Rainfall- historic or event based precipitation measures
Soil- properties that impact the hydrologic behavior of the watershed
Slope- percentage and sheet, shallow concentrated, channelized flow length
Land cover/ land use characteristics
Antecedent moisture condition or storage potential
Drainage system configuration (pipes, inlet, outlet)
Output parameters:
Runoff – depth of rainfall runoff, which does not infiltrate to ground
Runoff volume- runoff depth X area
Peak flow – maximum rate of discharge
Spatial distribution:
Lumped – variables in a land area are represented as an aerial weighted averages.
Distributed– variables of each homogenous land areas are represented
individually.
Temporal distribution:
Continuous – precipitation of multiple events are accounted for over a period of
time for long-term hydrologic simulation
Event based –rainfall of single storm event in certain frequencies for design
purposes.

APPENDIX D – RESPONSE TO COMMENTS ON THE DRAFT MS4 PERMIT APRIL, 2008
6
Hydrology Computation Methods:
Hydrology models are essential to implementation of the stormwater permit. They are
the primary tools for the design of stormwater drainage and structural controls. A few
hydrology methods are used within various stormwater modeling tools. Among many
others, rational method, NRCS TR-55, USGS regression, and Green-Ampt are commonly
incorporated in stormwater models. Simple Method however, required by New York
design standards for sizing stormwater treatment facilities, is not included in any of the
commercial or public domain models. The following is a brief description of the
available methods often used in the stormwater control design.
APPENDIX D – RESPONSE TO COMMENTS ON THE DRAFT MS4 PERMIT APRIL, 2008
7
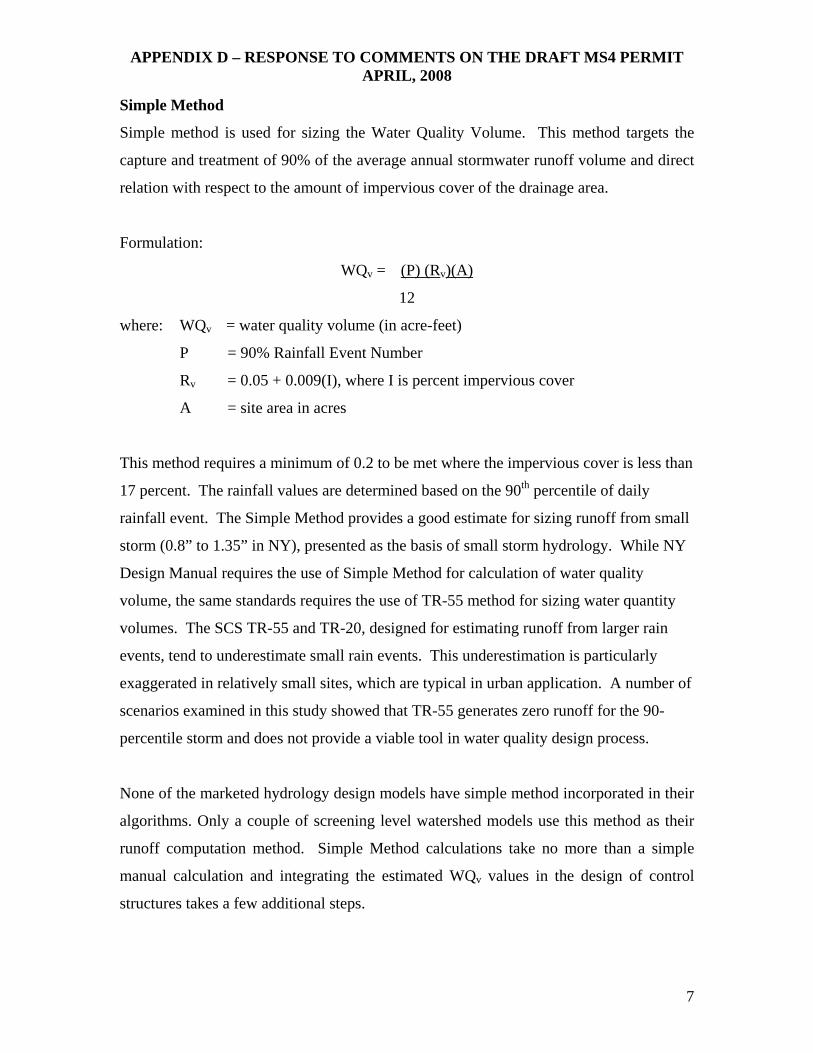
Simple Method
Simple method is used for sizing the Water Quality Volume. This method targets the
capture and treatment of 90% of the average annual stormwater runoff volume and direct
relation with respect to the amount of impervious cover of the drainage area.
Formulation:
WQv = (P) (Rv)(A)
12
where: WQv = water quality volume (in acre-feet)
P = 90% Rainfall Event Number
Rv = 0.05 + 0.009(I), where I is percent impervious cover
A = site area in acres
This method requires a minimum of 0.2 to be met where the impervious cover is less than
17 percent. The rainfall values are determined based on the 90th percentile of daily
rainfall event. The Simple Method provides a good estimate for sizing runoff from small
storm (0.8” to 1.35” in NY), presented as the basis of small storm hydrology. While NY
Design Manual requires the use of Simple Method for calculation of water quality
volume, the same standards requires the use of TR-55 method for sizing water quantity
volumes. The SCS TR-55 and TR-20, designed for estimating runoff from larger rain
events, tend to underestimate small rain events. This underestimation is particularly
exaggerated in relatively small sites, which are typical in urban application. A number of
scenarios examined in this study showed that TR-55 generates zero runoff for the 90-
percentile storm and does not provide a viable tool in water quality design process.
None of the marketed hydrology design models have simple method incorporated in their
algorithms. Only a couple of screening level watershed models use this method as their
runoff computation method. Simple Method calculations take no more than a simple
manual calculation and integrating the estimated WQv values in the design of control
structures takes a few additional steps.

APPENDIX D – RESPONSE TO COMMENTS ON THE DRAFT MS4 PERMIT APRIL, 2008
8
NRCS (SCS) Methods
The NRCS (SCS) TR-55 (Technical Release 55), the Urban Hydrology for Small
Watersheds and TR-20 are the basis of runoff calculation in many hydrology/watershed
models. TR-55 is an event based hydrology method for calculation of runoff volume,
discharge rate and storage volume. The model uses a series of soil/land use based curve
numbers for runoff computation and generates the watershed hydrograph for a 24-hour
rainfall duration. It is limited to a maximum of 2000 acres, 10 sub-watershed with a
minimum or 0.1 hour and maximum 10-hour time of concentration. This method has
been widely used for urban hydrology and integrated in various model interfaces. TR-20
has fewer limitations and applies hydrologic soil-cover complexes to determine runoff volumes and
peak rates of discharge by using time of concentration, travel time, and drainage area for large drainage
basins and routing flow in multiple watersheds, storage facilities and outlet structures.
Formulation (TR-55): Q= (P-Ia)2 / (P-Ia)+S
Where, Q = runoff (in),
P = rainfall (in),
S = potential maximum retention after runoff begins (in),
Ia = initial abstraction (in).
Ia = 0.2S
Q = (P-0.2S)2 / (P+0.8S)
S = (1000 / CN) - 10
Watershed size: Maximum 2000 acres
Input parameters: runoff coefficient (curve numbers, values based on land use/cover)
rainfall depth (for various storm frequencies)
drainage area (contributing area, acres)
Output variables: peak discharge (Q, cfs)
Runoff depth (inch)
Runoff hydrograph

APPENDIX D – RESPONSE TO COMMENTS ON THE DRAFT MS4 PERMIT APRIL, 2008
9
Rational Method:
The Rational Method is a simple method recommended for small catchments, which are
highly paved. This method provides a tool suitable for calculating the discharge from
relatively homogenous areas into a conveyance system such as pipes or ditches. This
method is not suitable for storage sizing.
Formulation: Qp = KcCIA
Qp= peak flow (cfs, m^3/s))
C = runoff coefficient representing the ratio of runoff to rainfall
I = average rainfall intensity for a duration equal to the tc (in/hr or mm/h)
A = drainage area contributing to the design location (acres or ha)
Kc= conversion factor =1.008 to convert ac.in/hr to cfs (routinely ignored)
Watershed size: smaller than 20 acres
Input parameters: runoff coefficient (constants, values based on ratio of runoff to
rainfall)
rainfall intensity (IDF curves from locally derived data)
drainage area (contributing area, acres)
Output variables: peak discharge (Q, cfs)
Limitations: no volume calculation, not suitable for storage sizing
in the absence of IDF curves for the area of concern, custom made
values need to be used with caution
The rational method does not produce a hydrograph, it does not account for time
dependent conditions such as soil moisture or rainfall intensity, and because of assuming
homogenous rain and equilibrium at the time of peak, it does not provide accurate results
for large watersheds. Due to assuming homogenous rain, rational method over estimates
the peak for larger areas. Because the only product of the rational method is peak flow,
this method is not useful for the design of stormwater control practices.

APPENDIX D – RESPONSE TO COMMENTS ON THE DRAFT MS4 PERMIT APRIL, 2008
10
Modification are made to the rational method to make up for these shortcomings and
presented as Modified Rational Method. In this method runoff hydrograph is assumed to be
trapezoidal in shape with a peak runoff rate calculated using the rational formula. Given the
watershed time of concentration and the allowable runoff rate, the method estimates a runoff
volume to be used for sizing stormwater structure. MODRAT (Modified Rational) model is
developed by the Los Angeles County Department of Public Works (LACDPW) to
compute runoff rates under the conditions common to the area of the county.
http://www.ems-
i.com/wms70help/Hydrologic_Models/Models/MODRAT/Overview_of_MODRAT.htm

APPENDIX D – RESPONSE TO COMMENTS ON THE DRAFT MS4 PERMIT APRIL, 2008
11
USGS Regression method
The USGS regression method is a hydrologic computation method derived by statistical
analysis of hydrologic response of the physiographic regions using historical data
associated with rainfall, stream flow, and a few physical characteristics of each region.
The USGS regression equations are suitable for large un-gagged drainage areas whose
characteristics fall within the ranges identified for the equations of each physiographic
region (USGS Report 90-4197).
The Report 94-4002 lists the following variables for application in NY’s eight
physiographic regions: “drainage area (A), in square miles; basin storage (ST), the
percentage of the drainage area shown as lakes, ponds, or swamps on topographic maps;
mean annual precipitation (P), in inches; main-channel slope (SL), in feet per mile; basin
forest cover (F), as a percentage of the total drainage area; average main-channel
elevation (EL), in feet, computed as the average of the elevations at points located 10 and
85 percent of the channel length upstream from the gage; and basin shape index (SH),
computed as the ratio of the square of the main-channel stream length, in miles, to
drainage area, in square miles.”
• This method is most useful for flood studies at basin or watershed scale. A number of
elements limit the use of USGS equations for site-specific urban applications.
• This method is not suitable for areas with significant size of pond and lakes, which
effect the storage capacity of the drainage area.
• This method is not suitable where other drainage characteristics alter the hydrology so
that the general regression equations may not hold true.
The urban application of this method in NY is documented by Stedfast (1986). Stedfast
concluded that the urban equations described in Sauer and others (1983) yielded the
smallest standard errors and bias in relation to flood peaks based on a rainfall-runoff
model at the 11 urban watersheds. The method of Sauer and others (1983) is available in
the NFF Program.

APPENDIX D – RESPONSE TO COMMENTS ON THE DRAFT MS4 PERMIT APRIL, 2008
12
Documentation on this model is available at:
http://water.usgs.gov/software/nff.html
http://water.usgs.gov/software/nff_manual/ny/index.html
USGS is in the process of updating the regression variables and integrating the model in a
GIS environment. A beta version of the model is scheduled for December 2004.

APPENDIX D – RESPONSE TO COMMENTS ON THE DRAFT MS4 PERMIT APRIL, 2008
13
Hydraulic Models
Hydraulics generally describes the physics and dynamics of the water within the system.
Hydraulic models use the output of the hydrologic model to compute the flow
characteristics such as discharge rate, depth, velocity, and pressure in a dynamic or static
system. Hydraulic models are typically characterized by following properties:
Input parameters:
Watershed hydrology: flow rate, velocity, runoff volume
Water course geometry: bank slope, bottom width, length
Slope- percentage of the water course slope
Drainage system configuration (pipes, channels, inlet/outlet, storage, obstructions)
Output parameters:
Flow discharge rate – stage-discharge relation, flow velocity
Outlet design: configuration and sizing
Flow characterization: normal, critical, super critical, hydraulic jump
Flow regime:
Uniform – assuming depths and velocities are constant throughout the flow
Non-uniform – assuming varying energy and momentum of flow (e.g. variable
channel geometry)
Flow dynamics:
Steady – assuming constant flow with respect to time
Unsteady – assuming variable flow in time (e.g. lateral flow)
Flow directions:
One-dimensional – modeling flow in one direction
Multi-dimensional – modeling flow in multiple directions (e.g. estuaries)
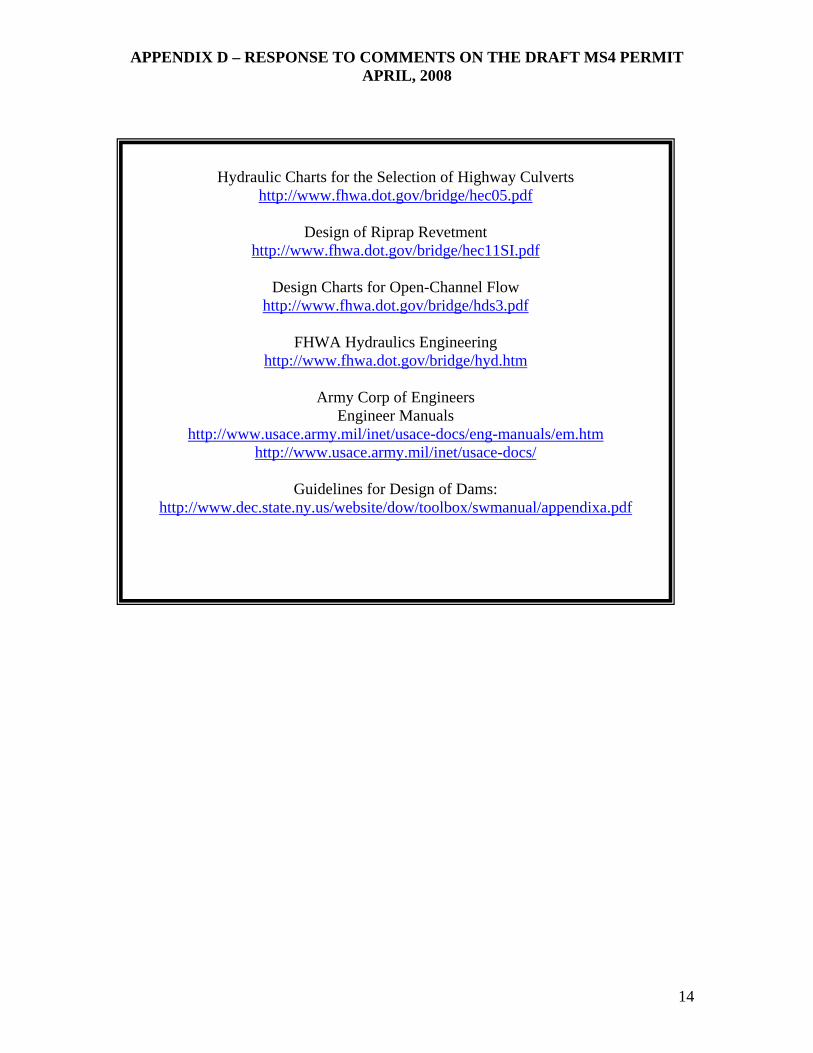
Hydrology and Hydraulic Computation Tools:
As many technical documents and literature are made available in electronic format on
the Internet, most agencies are providing their standard computation methods
electronically. The following list some of the tools commonly used for hydrologic and
hydraulic computation that can be easily accessed on the web.
APPENDIX D – RESPONSE TO COMMENTS ON THE DRAFT MS4 PERMIT APRIL, 2008
14
Hydraulic Charts for the Selection of Highway Culverts
http://www.fhwa.dot.gov/bridge/hec05.pdf
Design of Riprap Revetment http://www.fhwa.dot.gov/bridge/hec11SI.pdf
Design Charts for Open-Channel Flow
http://www.fhwa.dot.gov/bridge/hds3.pdf
FHWA Hydraulics Engineering http://www.fhwa.dot.gov/bridge/hyd.htm
Army Corp of Engineers
Engineer Manuals http://www.usace.army.mil/inet/usace-docs/eng-manuals/em.htm
http://www.usace.army.mil/inet/usace-docs/
Guidelines for Design of Dams:http://www.dec.state.ny.us/website/dow/toolbox/swmanual/appendixa.pdf

APPENDIX D – RESPONSE TO COMMENTS ON THE DRAFT MS4 PERMIT APRIL, 2008
15
Water Quality Models
Water quality models are used for simulation of watershed or receiving water pollutant
load and transport processes for various pollutants of concern. The basis most
watershed/stormwater models is hydrologic and or hydraulic calculation. Stormwater
models are typically characterized by following properties:
Methodology:
Empirical: relationships developed based on observations or measurements.
Mechanistic: based on some fundamental relationship - balance laws or other
physical Laws.
Variability:
Deterministic: does not account for variability in model parameters.
Stochastic: accounts for variability in model parameter
System simulation:
Watershed model - load estimate from non-point sources for specific pollutants
Receiving water model – pollutant load, transport, transformation, accumulation
and degradation in waterbody
Rain simulation type
Event based: for design of stormwater control practices
Continuous: for modeling long-term impacts of loading
Loading function:
Steady – assuming constant pollutant load concentration at a given point in the
system
Unsteady – assuming variable flow concentration temporally and spatially
Application type:
Screening – simple calculation methods for a gross load estimate

APPENDIX D – RESPONSE TO COMMENTS ON THE DRAFT MS4 PERMIT APRIL, 2008
16
Planning – mid range computations with algorithms for basic planning analysis
Design - Complex loading processes simulation with greater input variable
demand and detailed output results suitable for advanced applications.
Several models are evaluated for their applications in stormwater management.
Evaluation of any modeling tool relies on the methodologies incorporated in the tool.
Methodologies primarily relate to the hydrology and hydraulic computations and the
loading processes simulation.

APPENDIX D – RESPONSE TO COMMENTS ON THE DRAFT MS4 PERMIT APRIL, 2008
17
Table 1. Stormwater Management and Design Models Model
Developer Modeling Tools Hydrology
/ Hydraulics
Calculation Method
Simulation Method
Range /
Application
Parameters
BMP Platform *Public Domain
Water Quantity Models TR-55 /
Win-TR55
X / - Runoff CN Event Simple / Urban
Flow rate, runoff volume
Q DOS / Windows
AU / Y
TR-20 Win-TR20 - / X Runoff CN Event
Mid / Mixed Flow rate, runoff storage & channel
routing
Q DOS Windows
AU / Y
NRCS Hydraulics
&Hydrology Models
NRCS Geo-Hydro - -- TR-20 GIS
Interface Mid Input variables -- GIS Y
HEC-HMS HEC-GeoHMS X / -
Runoff CN Rational
Hyd. Sim.
Event Continuous
Mid / Mixed Flow rate, runoff storage & channel
routing
Q Windows GIS Y
US Army Corps of
Engineers HEC-RAS
HEC-GeoRAS - / X Hyd. Sim. Event Continuous
Detailed / Mixed
Storage, routing, water surf. Elev., back water
Q Windows GIS Y
Stormwater System HydroCAD X / X Runoff CN
Rational Event Mid / Urban
Flow rate, runoff storage & channel
routing
Q Windows N
PondPack X / X Runoff CN Rational Event
Mid / Urban Flow rate, runoff storage & channel
routing
Q Windows N
StormCAD X / - Event - - Q Win-CAD N
CulvertMaster - / X Channel flow Event Simple /
Urban Flow analysis, Conveyance
Q Windows N
FlowMaster - / X Channel flow Event Simple /
Urban Flow analysis, Conveyance
Q Windows N
WMS X / X
Runoff CN Rational
Hyd. Sim.
Event Continuous
Mid / Mixed Flow rate, runoff storage & channel
routing
Q Windows GIS B
USGS NFF X / - Regression Statistical Medium / Peak flow, N Windows Y
APPENDIX D – RESPONSE TO COMMENTS ON THE DRAFT MS4 PERMIT APRIL, 2008
18
Model Developer
Modeling Tools Hydrology /
Hydraulics
Calculation Method
Simulation Method
Range /
Application
Parameters
BMP Platform *Public Domain
WSPRO - /X Mixed open channel, back water
Q DOS
NYSDEC FloodWare X / X Hyd. Sim. Event / continuous
Detailed / Mixed
Storage, routing, water surf. Elev., back water
GIS A
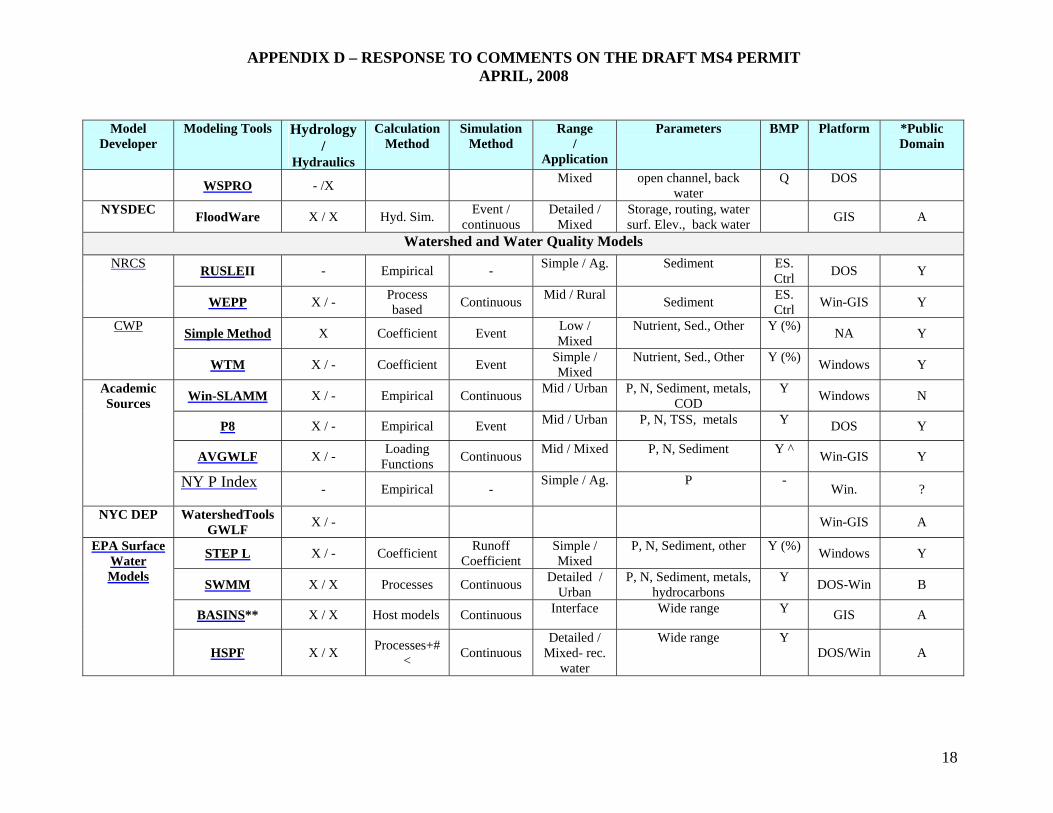
Watershed and Water Quality Models
RUSLEII - Empirical - Simple / Ag. Sediment ES. Ctrl DOS Y NRCS
WEPP X / - Process based Continuous Mid / Rural Sediment ES.
Ctrl Win-GIS Y
Simple Method X Coefficient Event Low / Mixed
Nutrient, Sed., Other Y (%) NA Y CWP
WTM X / - Coefficient Event Simple / Mixed
Nutrient, Sed., Other Y (%) Windows Y
Win-SLAMM X / - Empirical Continuous Mid / Urban P, N, Sediment, metals, COD
Y Windows N
P8 X / - Empirical Event Mid / Urban P, N, TSS, metals Y DOS Y
AVGWLF X / - Loading Functions Continuous Mid / Mixed P, N, Sediment Y ^ Win-GIS Y
Academic Sources
NY P Index
- Empirical - Simple / Ag. P -
Win. ?
NYC DEP
WatershedTools GWLF X / - Win-GIS A
STEP L X / - Coefficient Runoff Coefficient
Simple / Mixed
P, N, Sediment, other Y (%) Windows Y
SWMM X / X Processes Continuous Detailed / Urban
P, N, Sediment, metals, hydrocarbons
Y DOS-Win B
BASINS** X / X Host models Continuous Interface Wide range Y GIS A
EPA Surface Water Models
HSPF X / X Processes+#< Continuous
Detailed / Mixed- rec.
water
Wide range Y DOS/Win A

APPENDIX D – RESPONSE TO COMMENTS ON THE DRAFT MS4 PERMIT APRIL, 2008
19
Model Developer
Modeling Tools Hydrology /
Hydraulics
Calculation Method
Simulation Method
Range /
Application
Parameters
BMP Platform *Public Domain
WASP5 - / X Processes+# Continuous Estuary
Detailed/ rec. water,
Wide range Y DOS Y
USACE BATHTUB -- Empirical+ Statistical Mid / rec. water, Lake
N, P, DO, chlorophyll -- DOS Y
USGS SPARROW X / - Regression Statistical Simple / Mixed
Nutrients -- Win-GIS Y
Key: * A = Available upon agreement AU = Available but un-supported B = Both commercially and in public domain Y = Available in public Domain N = Commercially available Hyd. Sim. = Hydrologic and / or Hydraulic Simulation Processes ^ = Percentage of removal by the use of BMPs estimated by an additional tool, PREDICT. ** BASINS includes a host of modeling tools at varied levels of capabilities BASINS Modules Hydrology /
Hydraulics Simulation Method Range Application Public Domain
QUAL2E/QUAL2K -- Event Mid Receiving Water Yes
WinHSPF X / X Continuous Detailed Watershed Rec. Water Yes
SWAT X Continuous / Event Mid - Detailed Watershed Rec. Water Yes
PLOAD Event Simple Yes
+ Dilution # Advection, Dispersion, Re-aeration < Heat Balance, Particle fate, cohesive / non-cohesive sediment transport
APPENDIX D – RESPONSE TO COMMENTS ON THE DRAFT MS4 PERMIT APRIL, 2008
20
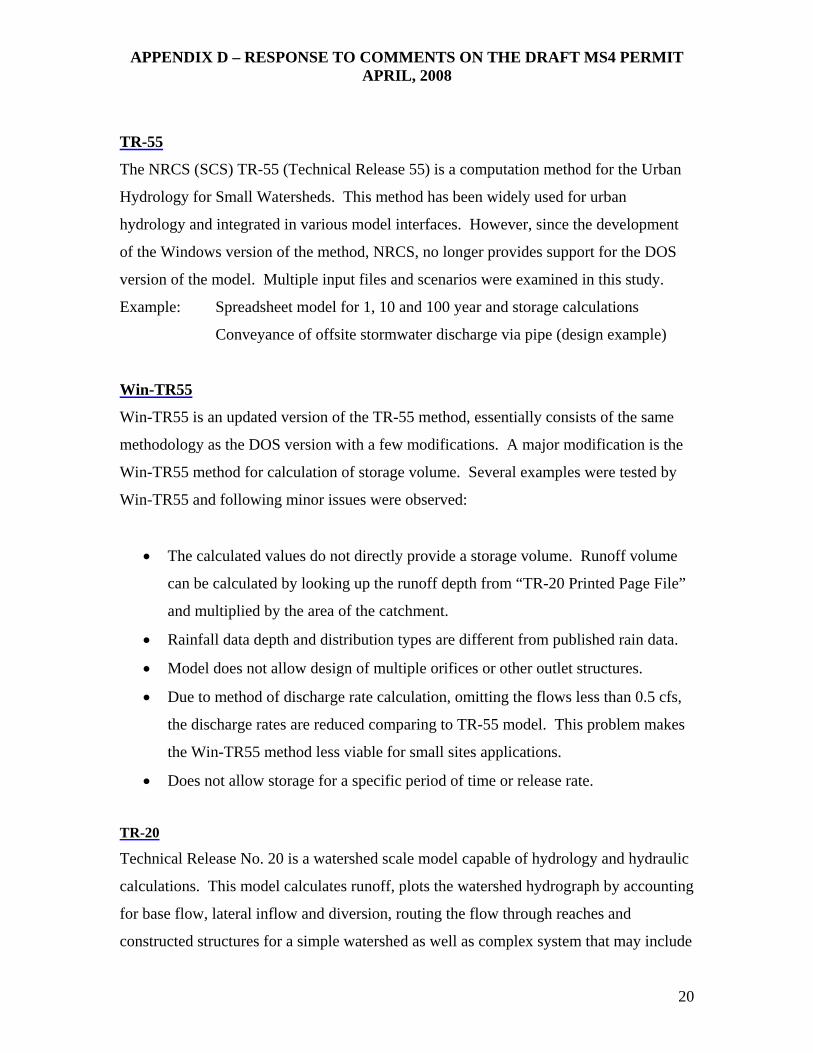
TR-55
The NRCS (SCS) TR-55 (Technical Release 55) is a computation method for the Urban
Hydrology for Small Watersheds. This method has been widely used for urban
hydrology and integrated in various model interfaces. However, since the development
of the Windows version of the method, NRCS, no longer provides support for the DOS
version of the model. Multiple input files and scenarios were examined in this study.
Example: Spreadsheet model for 1, 10 and 100 year and storage calculations
Conveyance of offsite stormwater discharge via pipe (design example)
Win-TR55
Win-TR55 is an updated version of the TR-55 method, essentially consists of the same
methodology as the DOS version with a few modifications. A major modification is the
Win-TR55 method for calculation of storage volume. Several examples were tested by
Win-TR55 and following minor issues were observed:
• The calculated values do not directly provide a storage volume. Runoff volume
can be calculated by looking up the runoff depth from “TR-20 Printed Page File”
and multiplied by the area of the catchment.
• Rainfall data depth and distribution types are different from published rain data.
• Model does not allow design of multiple orifices or other outlet structures.
• Due to method of discharge rate calculation, omitting the flows less than 0.5 cfs,
the discharge rates are reduced comparing to TR-55 model. This problem makes
the Win-TR55 method less viable for small sites applications.
• Does not allow storage for a specific period of time or release rate.
TR-20
Technical Release No. 20 is a watershed scale model capable of hydrology and hydraulic
calculations. This model calculates runoff, plots the watershed hydrograph by accounting
for base flow, lateral inflow and diversion, routing the flow through reaches and
constructed structures for a simple watershed as well as complex system that may include
APPENDIX D – RESPONSE TO COMMENTS ON THE DRAFT MS4 PERMIT APRIL, 2008
21
detention structures and hydraulic structures with multiple discharge rate and targeted
flow characteristics.
This model, developed and maintained by NRCS in cooperation with the Hydrology
Laboratory (ARS) in 1964, was originally utilized in mainframe platform and later on
DOS environment. Many other hydrology/hydraulic software system employ the TR-20
model algorithms in their computational processes.
Win-TR20
Win-TR20 is windows version of TR-20 computer model which is reconstructed by using
new algorithms. This model is planned to follow the same computation methods as TR20
and deliver the same outputs. The Beta Test version (including programs, sample data,
and documentation) was made available on the web for download and testing in 2000.
The latest updates of the model available for download, dated April 2004, are still in Beta
format.
NRCS-Geo Hydro
NRCS Hydro is a GIS interface to the WinTR-20 hydrologic model. This interface,
developed in ESRI ArcView 3.3 and the Spatial Analyst extension, enables the user to
extract the required for setting up a WinTR-20 hydrologic analysis model. The GIS
scripts provide an automated process to define drainage boundaries and channel
geometry. The WinTR-20 is executed provides the model engine for hydraulics
calculation.
HEC-HMS
The Hydrologic Modeling System is a hydrologic simulation system applicable in a wide
range of applications. The model provides an integrated set of tools and computation
methods that could be used for large river basins, flood hydrology, and small urban or
natural watershed runoff. Hydrographs produced, flow forecasting, future urbanization
impact, reservoir spillway design, flood damage reduction, floodplain regulation, and
systems operation. The integrated work environment of the software allows a seamless

APPENDIX D – RESPONSE TO COMMENTS ON THE DRAFT MS4 PERMIT APRIL, 2008
22
transition between the different components of the model. Program is in public domain
while technical support is only provided to the US Army Corp of Engineers applications.
HEC-GeoHMS
Is the GIS interface of HEC-HMS for data extraction and import into HEC model engine
and preparation of the input files.
HEC-RAS
HEC-RAS is a one-dimensional hydraulic model for a full network of natural and
constructed channels. The hydraulic analysis capabilities of the model currently include
steady and unsteady flow components and the sediment transport component is being
developed at this time. The system can handle a full network of channels, with capability
of modeling subcritical, supercritical, and mixed flow regimes water surface profiles, as
well as one-dimensional unsteady flow component primarily for subcritical flow regime
calculations. Technical support is provided only to USACE applications.
HEC-GeoRAS
Is the GIS interface of HEC-RAS for data extraction and import into HEC model engine
and preparation of the input files.
HydroCAD
HydroCAD is a stormwater runoff modeling tool, which provides computation methods
such as SCS, NRCS, SBUH runoff hydrographs, Rational Method with automatic IDF
curves, Hydrograph routing through ponds & reaches, tailwater and culvert hydraulic
calculation and infiltration systems.
Heastad Methods
Heastad Methods include a model series for vaious hydrology and hydraulic calculations
in multiple individual platforms
PondPack: is used for storage design and flow routing.
CulvertMaster: is used for hydraulic design and analysis of barrels, different shapes and
sizes, special tailwater considerations, and roadway overtopping,

APPENDIX D – RESPONSE TO COMMENTS ON THE DRAFT MS4 PERMIT APRIL, 2008
23
FlowMaster: is used for design and analysis of pipes, ditches, open channels, weirs,
orifices, and inlets.
StormCAD: offers gradually varied flow computations, inlet and gutter flow
computations and profile manager, and headloss detailed reports by integration in CAD
environment.
FloodWare:
Floodware is a detailed GIS tool for floodplain mapping, is developed under a contract
with NYS Environmental Conservation for use by FEMA. This GIS tools extracts the
spatial data from GIS, performs the basic hydrology calculations, and exports the flow
discharge values to an input file usable for HEC-RAS model interface. Floodware uses
two hydrology methods: USGS regression and NRCS CN. The model is very data
intensive and uses high resolution digital elevation models (LIDAR) and survey data for
generating the stream and floodplain geometry. This model is not available for public
use.
Simple Method
The Simple Method (Schueler, 1987) is a method of pollutant load estimate from a site or
drainage area. This method is used for stormwater runoff pollutant loads urban areas
with minimal amount of information, including the subwatershed drainage area and
impervious cover, stormwater runoff pollutant concentrations, and annual precipitation.
With the Simple Method, land use can be broken up into specific land use areas and
annual pollutant loads for each type of land can be calculated by utilizing their
corresponding pollutant concentration.
This model provides a simple and easy to use tool for gross estimate of loading. The
model provides a list of pollutant removal efficiency for various stormwater management
practice groups, which allows a relative comparison of before and after treatment
scenarios for the MS4 program implementation. It is noted however, that the calculations
method provided in this document for multiple practices in series is not validated and for
some variation of practices my result in unrealistic load reduction.

APPENDIX D – RESPONSE TO COMMENTS ON THE DRAFT MS4 PERMIT APRIL, 2008
24
WTM
The Watershed Treatment Model (WTM) is a simple spreadsheet that tracks pollutant
sources from various sources in urban and urbanizing watersheds. The model allows
incorporating multiple treatment options and estimates their effectiveness in pollutant
removal. The WTM can be used to estimate nutrients or sediment, help direct bacteria
detective work, determine the effectiveness of watershed education programs; and target
the future program in a Phase II community. The WTM spreadsheet does not contain a
compiled source code and may be enhanced or customized based on the users need.
EPA Spreadsheet Models (STEPL)
Spreadsheet Tool for Estimating Pollutant Load (STEPL) and Region 5 model are two
spreadsheet-based models developed for non-point source load evaluation. These models
use simple algorithms to calculate nutrient and sediment loads from different land uses
and the load reductions and factor in a load reduction based on BMP implementation.
Scenarios can be set up for a watershed scale and calculations can provide result for
surface runoff; nutrient loads, including nitrogen, phosphorus, and 5-day biological
oxygen demand (BOD5); and sediment delivery based on various land uses and
management practices. Both models are available for public use, support is not provided
for these models, although the user-friendly interface and simplicity of the algorithms
seem to be easy for any novice user.
Win-SLAMM
WinSLAMM (Source Loading and Management Model for Windows) is a mid-range
empirical model for evaluation of stormwater runoff loading in urban watersheds. This
modeling tool uses small storm hydrology method and calculates the runoff from rain
events for any given period of time. The model pollutant loading from various land uses
and allows the user to simulate the stormwater load reduction by incorporating control
devices. The stormwater management practices provided in WinSLAMM include:
infiltration, bio-filtration, street sweeping, wet detention ponds, grass swales, porous
pavement, and catchbasins.
APPENDIX D – RESPONSE TO COMMENTS ON THE DRAFT MS4 PERMIT APRIL, 2008
25
Win-SLAMM provides a useful tool for the MS4s to evaluate the implementation of their
SWMPs in an easy and efficient manner. This user-friendly tool is built based on a
comprehensive field data collected in urban areas. The latest version of this model
include includes instruction on stormwater BMP modeling, including Better Site Design
and Low Impact Development techniques. EPA report BMP Modeling Concept and
Simulation discusses the details of these model features.
P8
The Urban Catchment Model, P8, is a mid-range model for estimating pollutant load and
transport from urban runoff. This model provides a useful tool for watershed evaluation
by single event or continuous simulation of rain event. The model can incorporate up to
24 sub-catchments and calculate the load using up to five particle sizes and ten water
quality components. The model allows simulation of 24 stormwater management
practices including swales, buffer strips, detention ponds (dry, wet, extended), flow
splitters, and infiltration basins (offline and online).
GWLF
The Generalized Watershed Loading Function model (Haith &Shoemaker, 1987) is a
lumped, mid-range, continuous simulation model that estimates runoff, sediment, and
nutrient loading from a watershed for mixed land uses, The model also allows the user to
incorporate point source and septic system loading.the given variable-size source areas.
In runoff calculation the model uses SCS curve numbers for pervious areas, where in
urban areas a runoff coefficient is employed. The model uses the USLE algorithm for
each land cover area and calculates the sediment delivery ratio based on watershed size.
AVGWLF
GWLF has been linked to a GIS in several platforms. The most recent version of a GIS
coupled version is the Penn. State AVGWLF. This model additionally includes an
algorithm for streambank erosion routine based on estimation of watershed-specific
lateral erosion rate. Several other improvements are made to improve the functions of the

APPENDIX D – RESPONSE TO COMMENTS ON THE DRAFT MS4 PERMIT APRIL, 2008
26
original model engine. This model is calibrated for use in NY. Read about it here. The
latest version of this model is being revised to incorporate an urban hydrology module.
SWMM
SWMM is an urban runoff hydrology, hydraulics, and runoff quality model, for single-
event or long-term simulation of watershed flow and loading processes. SWMM, by far is
the most advanced and detailed design tool capable of flow routing and storage for
surface, sub-surface, stormwater and combined sewer overflow conveyance and
groundwater system, as well as treatment and application of stormwater management
practices. The recent version of this model has an improved algorithm for Transport and
Extran blocks, resulting in computations equivalent to HEC software as well as additional
algorithms such as disconnecting flow from pipes and directing through BMPs.
This software is in public domain and Fortran source codes are available to end users.
Numerous graphical user interfaces of this software are developed and distributed by
various entities. Because all versions of the models are not necessarily approved by the
regulatory agencies, users need to verify the status of the versions before application of
the model where such compliance is required. The latest version of this model include
includes instruction on stormwater BMP modeling, including Better Site Design and Low
Impact Development techniques. EPA report BMP Modeling Concept and Simulation
discusses the details of these model features.
BASINS
BASINS is a comprehensive watershed and water quality modeling tool for a multi-
faceted analysis of environmental problems at regional, state, and local level. This system
was originally developed in 1996 as a host tool or interface for an integrated analysis of
point and nonpoint source pollution and for targeting problem areas and evaluation of
management option by utilizing simple to advanced model engines. The most recent
version of BASINS includes AGWA, SWAT, PLOAD, AquaTox, and, HSPF models.
The models can be used for simple watershed assessment to advanced load estimates, as
well as well as in-stream water quality simulation of pollutant load and transport
APPENDIX D – RESPONSE TO COMMENTS ON THE DRAFT MS4 PERMIT APRIL, 2008
27
processes. Although an efficient use of the more advanced features of the model requires
sufficient expertise and can be labor intensive, it still is one of the most comprehensive,
well supported, data incorporated, and widely used tools in public domain. BASINS is
often used to support development of cost-effective approaches to watershed
management and environmental protection, including TMDLs.
RUSLE
Revised Universal Soil Loss Equation, an empirical model for prediction of soil erosion
by water, has evolved since its initial development in the 40s. This multiplicative model,
A=R.C.SL.K.P, uses a series of unit-less factors such as rainfall erosivity factor (R ), crop
factor (C), soil slope and length (SL), soil erodibility factor (K) and management practice
factor (P) to estimate the soil mass that is mobilized due to the energy of the raid drops.
The latest version of this model, RUSLE2, is available in electronic format. This simple
tool, originally developed for field scale agricultural land applications, is also used for
urban or construction phase erosion control planning. Numerous non-point source and
stormwater modeling tools use this method as their soil loss algorithm.
Many resources are available in the form of desktop software to commercial of public
funded interactive calculation tools. The interactive tools provide easy access
instantaneous calculation useful for variety of applications. The following are a few
examples of such tools:
LandfillDesign.com
NYS Standards and Specifications for Erosion and Sediment Control
WEPP
The Water Erosion Prediction Project (WEPP) is a mechanistic model that simulates the
soil erosion and transport processes based on the fundamentals of hydrologic and erosion
mechanics. WEPP relies on an extensive use of rainfall simulators, incorporates
hydrology, sedimentology, and the impact of channel erosion as well as management
practices. This method include rill and inter-rill ersion as well as freeze/thaw process.
The model contains three primary components: hillslope, channel, and impoundment.

APPENDIX D – RESPONSE TO COMMENTS ON THE DRAFT MS4 PERMIT APRIL, 2008
28
The hillslope component calculates rainfall excess by a Green-Ampt, Mein-Larson
infiltration equation; peak runoff rate by kinematic wave overland flow routing or
simplified regression equations for predicting interrill erosion as a process of soil
detachment by raindrop impact. The hillslope hydrologic and erosion outputs such as
storm duration, time of concentration, runoff depth, volume and peak, total sediment
detachment and sediment deposition at the end of the hillslope, as well as sediment
concentration by particle size class are computed and then read in and used in simulation
of sediment transport or deposition in the channels and impoundments. Considering the
strengths of the WEPP method, it is predicted that it will replace the earlier methods of
soil loss equations. This model is primarily suitable for agricultural and forestry
application, although it has been applied to special urban scenarios such as construction
sites, road-sides and land fills. An interactive version of WEPP is available online.
HSPF
Hydrologic Simulation Program, Fortran, is a mechanistic model with comprehensive
calculation methods for watershed loading processes and in-stream interaction for a wide
range of pollutants as well as contaminants. This model simulates both upland and in-
stream erosion and sediment transport. The erosion algorithms use a detachment and
wash-off equation for calculating soil loss and delivery. The model is capable of
continuous and event based hydrology computations. The in-stream pollutant transport
and sediment-chemical reaction are simulated using a one-dimensional hydraulic model.
The model demands calibration and verification. This advanced planning tool is
appropriate for watersheds with mixed land uses. HSPF model engine is available in
DOS, Windows and also GIS environment as the NPS component of BASINS model.

APPENDIX D – RESPONSE TO COMMENTS ON THE DRAFT MS4 PERMIT APRIL, 2008
29
Response to Comments on Draft SPDES General Permit for Stormwater Discharges from Municipal Separate Storm Sewer Systems (MS4s)
GP-0-08-002 April, 2008
Instructions for a preliminary delineation of storm sewershed map: A storm sewershed is a drainage area where the drainage boundaries are defined based on not only the surface topography, but also the topography of the sewer system. It can be looked at as a watershed which may have additional catchment area created by drainage system modifications. The point(s) of discharge and service areas are subject to the configuration of man-made structures and direction of conveyance systems, which do not necessarily follow surface topography. Evaluating their storm sewersheds can help the operators of the regulated municipal separate storm sewer systems (MS4’s) identify and control the areas contributing to their outfalls and point out locations where adjacent MS4’s discharge, pass-through or receive stormwater from the MS4. The following identifies the steps involved in a preliminary delineation of storm sewersheds. Storm sewersheds are generally identified as either unsewered, combined, or separate, depending on the contributing storm sewer system. The regulated MS4 boundaries which are defined based on the census tracks meeting a minimum population density may be corrected to show the actual drainage area that contributes to the regulated separate systems and their outfalls. These boundaries may be extended or reduced to reflect the boundaries operated by each permitted municipality. A preliminary map of the storm sewersheds may be delineated using desktop tools (such as GIS) along with minimal field inspection. More detailed delineation involving field verification and further investigation is an ongoing activity of MS4s stormwater management programs.
1- Obtain Spatial Data a. Hydrography dataset 1:24,000 or greater b. Watershed and sub-watershed boundaries c. Municipal boundaries d. Regulated MS4 boundaries and surrounding/adjacent MS4s identified e. Outfalls The following datasets and images are helpful in data processing and as background information for interpretation and analysis: • Roads • Record Maps of existing storm systems (mapping databases if available) • Historical drawing for approved storm sewer systems • Wetlands • Topo maps • Planimetric map • Ortho-photo or aerial photos • Tax maps

APPENDIX D – RESPONSE TO COMMENTS ON THE DRAFT MS4 PERMIT APRIL, 2008
30
2- Overlay the following data sets. The polygon features of the data layers may be intersected or united to form an output that contains the attributes of the full extent of all the datasets.
a. Regulated MS4 boundaries b. Municipal boundaries c. Watershed boundaries and Sub-watershed boundaries d. Topographic maps
3- Examine the sewersheds by defining
the distinct drainage areas within the regulated MS4. Example: Regulated stormwater discharges in the Town of Bethlehem fall under three watersheds (Figure 1): a. Normanskill (HUC 02020006030) b. Vlomankill Creek (HUC
02020006050) c. Onesquathaw Creek (HUC
02020006060)
4- Evaluate individual drainage areas in relation with the receiving surface water and regulated outfalls. Starting from either the boundaries of regulated MS4 or outfalls, verify based on the natural topography and road configuration whether the system boundaries are correct or if additional drainage areas need to be added to the existing boundaries. a. If the regulated MS4 areas are
located on the upper part of the watershed and / or clearly do not convey stormwater from areas outside of the regulated area, the boundaries remain the same as the MS4 regulated areas. Example: Areas A discharging to the stream in the lowest part of the regulated MS4 in the Town of Bethlehem. (Area A up to the watershed line in Selkirk in Figure 2)
Figure 1. Watershed delineation
Figure 2. Condition a and b

APPENDIX D – RESPONSE TO COMMENTS ON THE DRAFT MS4 PERMIT APRIL, 2008
31
b. If there is a municipal collection or conveyance system or a distinct
topographic divide line indicating that greater areas contribute stormwater discharges to the regulated outfall, then the boundary of the sewershed may be extended to the boundaries of the service areas. (Area B in Selkirk up to the divide line or road system in Figure 3)
c. If multiple areas outside of the
regulated areas contribute to the outfalls, owned and operated by the same MS4, discharging to different tributaries, collectively create a new sewershed line. Adding areas A and B (up to area B divide line in Figure 3) to the storm sewershed is recommended.
d. If an area with stormwater connection is outside of the regulated MS4 boundaries, but is municipally owned and is a potential source of polluted runoff, it should be considered for adding to the sewershed line (Town garage area shown on figure 4).
5- Evaluate individual drainage areas in relation with the receiving surface water and regulated outfalls and neighboring municipalities. Starting from the boundaries of the regulated MS4, based on the natural topography, road drainage, and interconnections with neighboring MS4s, verify whether the system boundaries are correct or greater drainage areas need to be added to or eliminated from the existing boundaries. Such determination is established via inter-municipal agreements.
Figure 4. Condition d
Figure 3. Condition c

APPENDIX D – RESPONSE TO COMMENTS ON THE DRAFT MS4 PERMIT APRIL, 2008
32
a. When a portion of the system drains to a combined sewer system, the actual drainage of the area may be identified accordingly in the storm sewershed map.
b. Areas that discharge to a storm sewer system owned and operated by another MS4 entity (Transportation agency) may be identified accordingly in the storm sewershed map. Area A in Figure 5 discharges to the road operated by NYS Thruway Authority.
6- If any new lines are defined based on
assumptions or topographic mapping, a field inspection would be necessary to verify the delineation to the extent practicable.
7- Finalize the map by defining the storm sewershed line consisting of a single boundary line. This modified delineation of regulated MS4 boundaries represents a more accurate sewershed division line operated by the regulated municipality.
For available resources refer to Data Management instructions on DEC’s website.
Figure 5. Multiple MS4 connection