Storm-tracking Infrared Data Handbook DETAILS Author Phil Harwood, Rory Scarrott, Helen Snaith...
22
Storm-tracking Infrared Data Handbook Issue 2.0, 23 April 2014 Edited by the Coastal & Marine Research Centre, University College Cork
Transcript of Storm-tracking Infrared Data Handbook DETAILS Author Phil Harwood, Rory Scarrott, Helen Snaith...

Storm-tracking Infrared Data Handbook
Issue 2.0, 23 April 2014
Edited by the Coastal & Marine Research Centre, University College Cork

DOCUMENT DETAILS
Author Phil Harwood, Rory Scarrott, Helen Snaith
Document Title Product Data Handbook: Infrared Image Data for Storm Tracking
Document Reference D180H_HB_IR1
Product Reference IR1
Issue 2.0
Date of Issue 23 April 2014
CHANGE RECORD
Version Date Change Description Author
0.1 17.12.2012 Document Template created RS
0.2 08.02.2013 Document template edited RS/PH
1.0 27.05.2013 Version 1.0 released RS
1.1 04.11.2013 Version 1.0 reviewed.
Version 1.1 prepped for editing.
RS
1.1 23.04.2014 Version 2.0 finalised. RS / HS
Front cover images credit: EUMETSAT, ABC Action News, and University Wisconsin CIMSS

Contents
Summary ................................................................................................................................................. 5
Abbreviations and Acronyms .............................................................................................................. 6
Glossary of Terms................................................................................................................................ 7
1. THE INFRARED IMAGERY FOR STORM TRACKING PRODUCT .......................................................... 8
1.1 Introduction ............................................................................................................................ 8
1.2 From Data to Product ............................................................................................................. 9
1.3 Product Validation .................................................................................................................. 9
1.3.1 Product quality ................................................................................................................ 9
1.4 Potential Uses of Infrared Image Data for Storm Tracking in Storm Surge Applications ....... 9
2. PRODUCT DETAILS ........................................................................................................................ 10
2.1 Technical Description ............................................................................................................ 10
2.1.1 File Type ........................................................................................................................ 10
2.1.2 File Names ..................................................................................................................... 10
2.1.3 File Sizes ........................................................................................................................ 10
2.1.4 Global Attributes ........................................................................................................... 10
2.2 File Contents ......................................................................................................................... 10
2.2.1 MVIRI images ................................................................................................................ 10
2.2.2 More information ......................................................................................................... 10
2.3 Accessing the Product ........................................................................................................... 11
2.3.1 Viewing the product in the eSurge website .................................................................. 12
2.3.2 Download the product .................................................................................................. 14
2.4 Using the Product.................................................................................................................. 14
2.5 Constraints on Use ................................................................................................................ 15
3. FURTHER INFORMATION AND CONTACTS .................................................................................... 16
4. Further Reading ............................................................................................................................ 17
ANNEX A : THE ESURGE PROJECT ..................................................................................................... 18
A.1 About eSurge ........................................................................................................................ 18
A.2 The eSurge Consortium ......................................................................................................... 19

List of Tables and Figures
Table 0-1 Acronyms and abbreviations
Figure 1-1 Example Meteosat IR image
Figure 2-1 Accessing the data on the eSurge website.
Figure 2-2 The data access page of the eSurge website
Figure 2-3 The Cyclone Sidr dataset inventory on the eSurge web-service.
Figure 2-4 Previewing the Cyclone Sidr inundation dataset using the Preview link
Figure 2.5 Viewing dataset metadata and information using OPeNDAP.
Figure 2-6 Exploring Cyclone Sidr datasets in the eSurge GIS web-viewer.
Figure 2-7 Downloading data using the OPeNDAP dataset information page.

Summary
The infra red (IR) eSurge product consists of extracted Meteosat 6 and 7 images, mapped onto the
same dispay as for other products. It is not intended for scientific use per-se, however it has been
found by many people that viewing IR (or visible) data together with other data gives a clearer
understanding of what is going on. (For example by looking at cloud formations.) IR has been chosen
in preference to visible data as it is available at all times of day and night.
Since this product is not intended for assimilation into models, but rather to provide a context for
understanding other data sets, this handbook is not given the same level of detail as for other data
sets.
This product was compiled for the eSurge Project, funded by the European Space Agency under the
ESA Data User Element (DUE) Programme.
For more information on the eSurge project go to http://www.storm-surge.info/.
More information about the project and the consortium is given in Annex A.

Abbreviations and Acronyms Table 0-1 lists the acronyms and abbreviations used within this document.
Table 0-1: Acronyms and abbreviations
Acronym Meaning
AOI Area of Interest
BODC British Oceanographic Data Centre
BOOS Baltic Sea Operational Oceanographic System
BUFR Binary Universal Form for the Representation of meteorological data
CCI Climate Change initiative
CMRC Coastal and Marine Research Centre
DMI Danmarks Meteorologiske Institut (Danish Meteorological Institute).
DUE Data User Elements
DUP Data User Programme
EO Earth Observation
EOEP Earth Observation Envelope Programme
ESA European Space Agency
EUMETSAT European Organisation for the Exploitation of Meteorological Satellites
INSPIRE Infrastructure for Spatial Information in the European Community
KNMI Koninklijk Nederlands Meterologisch Instituut (Royal Netherlands Meteorological
Institute)
NERC Natural Environment Research Council (UK)
NOAA National Oceanic and Atmospheric Administration
NOC National Oceanographic Centre
NOOS North West Shelf Operational Oceanographic System
IR Infra-red
ISRO Indian Space Research Organisation
SAF Satellite Application Facility
STFS Storm Tide Forecasting System
UCC University College Cork
WOND The weather research section of the Royal Netherlands Meteorological Institute
OSI SAF Ocean and Sea Ice Satellite Application Facility (of EUMETSAT)
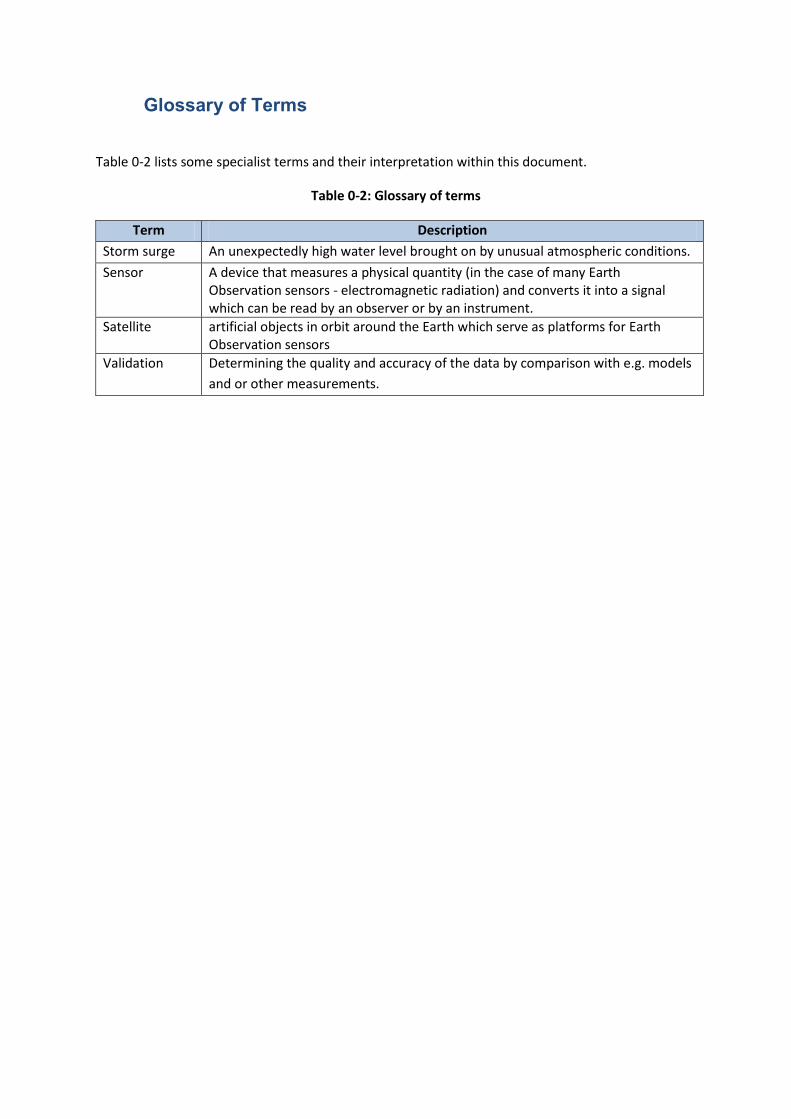
Glossary of Terms
Table 0-2 lists some specialist terms and their interpretation within this document.
Table 0-2: Glossary of terms
Term Description
Storm surge An unexpectedly high water level brought on by unusual atmospheric conditions.
Sensor A device that measures a physical quantity (in the case of many Earth Observation sensors - electromagnetic radiation) and converts it into a signal which can be read by an observer or by an instrument.
Satellite artificial objects in orbit around the Earth which serve as platforms for Earth Observation sensors
Validation Determining the quality and accuracy of the data by comparison with e.g. models
and or other measurements.
1. THE INFRARED IMAGERY FOR STORM TRACKING
PRODUCT
1.1 Introduction
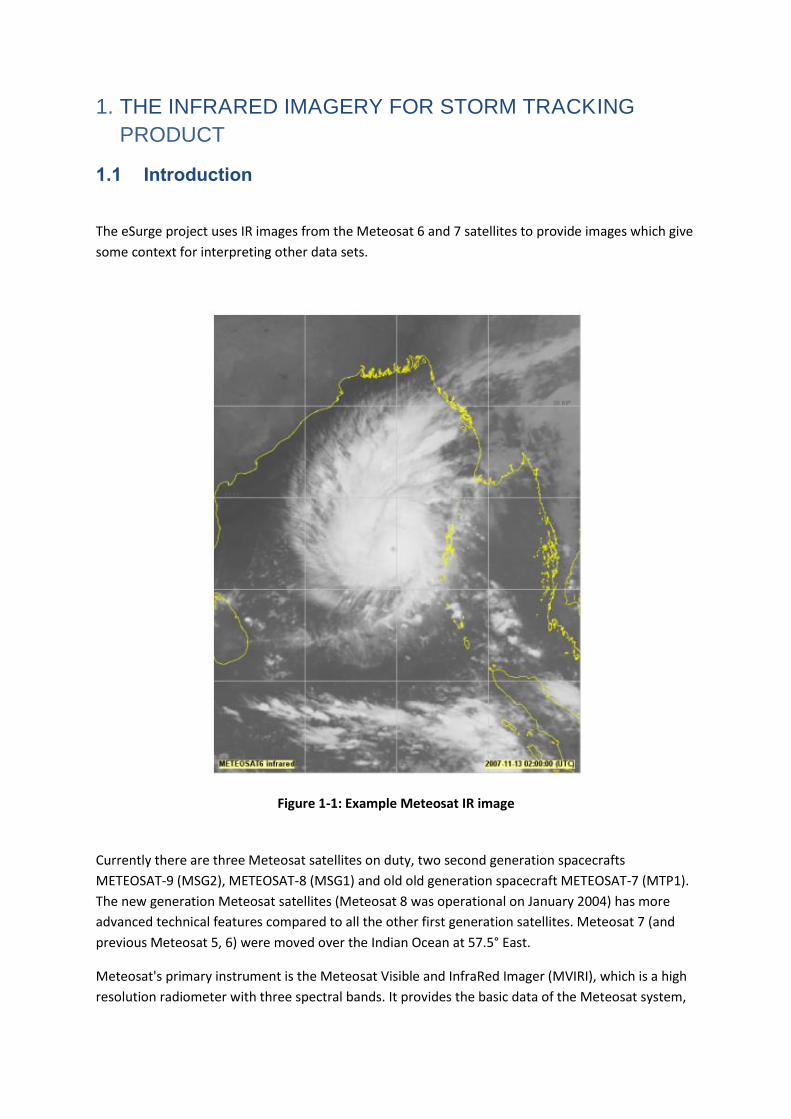
The eSurge project uses IR images from the Meteosat 6 and 7 satellites to provide images which give
some context for interpreting other data sets.
Figure 1-1: Example Meteosat IR image
Currently there are three Meteosat satellites on duty, two second generation spacecrafts
METEOSAT-9 (MSG2), METEOSAT-8 (MSG1) and old old generation spacecraft METEOSAT-7 (MTP1).
The new generation Meteosat satellites (Meteosat 8 was operational on January 2004) has more
advanced technical features compared to all the other first generation satellites. Meteosat 7 (and
previous Meteosat 5, 6) were moved over the Indian Ocean at 57.5° East.
Meteosat's primary instrument is the Meteosat Visible and InfraRed Imager (MVIRI), which is a high
resolution radiometer with three spectral bands. It provides the basic data of the Meteosat system,

in the form of radiances from the visible and infrared parts of the electromagnetic spectrum. The
instrument allows continuous imaging of the Earth.
The MVIRI acquires radiance data from the full earth disc during a 25-minute period. This is followed
by a five-minute retrace and stabilisation interval, so that one complete set of full earth disc images
is available every half-hour.
1.2 From Data to Product
1.3 Product Validation
This data is made available “as is” to our users for the purposes of information only. Users should
not rely on this data for scientific purposes that require validated data.
1.3.1 Product quality
This data is made available for convenience only. It is intended for use with previews and
visualisation tools in order to give context to other data sets. As such, no determination on product
quality has been executed by the eSurge project team.
1.4 Potential Uses of Infrared Image Data for Storm Tracking in
Storm Surge Applications
This data is made available for convenience only. It is intended for use with previews and
visualisation tools in order to give context to other data sets.

2. PRODUCT DETAILS
2.1 Technical Description
2.1.1 File Type
The NetCDF files have been generated specifically for eSurge . Each one contains a single MVIRI
image from Meteosat, giving MTP15 channel pixel counts with calibration coefficients and geo-
location values.
2.1.2 File Names
filenames are of the form:
W_XX-EUMETSAT-
Darmstadt,VIS+IR+IMAGERY,MET6+MVIRI_C_EUMS_20071112120000_AOI_090.nc
Where 20071112120000 represents the image time and AOI_090 the eSurge AOI. The remainder of
the file name is retained for consistency with the source file.
2.1.3 File Sizes
Each image file is ~3MB in size.
2.1.4 Global Attributes
A large number global attributes are available with each file: these are not listed here but can be
found by examining the NetCDF header.
2.2 File Contents
2.2.1 MVIRI images
Each file contains the following variables:
Ch2: MVIRI infrared pixel counts
channelAvailableFlags: satellite_geo_channels_available_flags
lat: latitude
lon: longitude
2.2.2 More information
More information can be found in the product handbook available from EUMETSAT at
http://www.eumetsat.int/Home/Main/DataProducts/Resources/index.htm

2.3 Accessing the Product
For many storm cases (events) where storm-surges are reported to have arisen, IR data have been
collected and made available through the eSurge web-service (see www.storm-surge.info shown in
figure 2-1). We would encourage users to look up these events and the inundation data contained
on the facility database.
Figure 2-1: Accessing the data on the eSurge website (tabs encircled)
Figure 2-2: The data access page of the eSurge website

2.3.1 Viewing the product in the eSurge website
The eSurge web-service provides users with a number of ways to explore and assess the utility of
data they are interested in. Upon navigating to a storm surge event of interest (e.g. Cyclone Sidr
shown in figure 2-3), the individual datasets can be previewed (figure 2-4) using the preview tab
alongside the dataset name as shown encircled in figure 2-3. Alongside the dataset name also lies
the link to view global attributes and dataset information through the OPeNDAP viewer (figure 2-5).
Alternatively, users can quick link to the eSurge GIS web-viewer, where they can visualise and
explore all the datasets available concerning the event (figure 2-6)
Figure 2-3: The Cyclone Sidr dataset inventory on the eSurge web-service. Preview option links are encircled.

Figure 2-4: Previewing the Cyclone Sidr inundation dataset using the Preview link.
Figure 2-5: Viewing dataset metadata and information using OPeNDAP.
Figure 2-6: Exploring Cyclone Sidr datasets in the eSurge GIS web-viewer.

2.3.2 Download the product
If users are satisfied that the product suits their purposes, there is an option to download the data
using the OPenDAP dataset information window (figure 2-7). Simply click on the “Get ASCII” or “Get
Binary” tab to download the data. Note that the ability to download requires registration.
Figure 2-7: downloading data using the OPeNDAP dataset information page (tabs encircled).
2.4 Using the Product
Useful tools to work with the NetCDF SST data are Python (with netCDF4 and matplotlib libraries)
and IDV for plotting. For manipulating the data NCO offers many tools, and Python offers higher
level tools as well as low level manipulation of the data. Of course commercial software as Matlab
and IDL also provide all capabilities.
An example of how to use IR data to support storm-tracking can be found in Stoffelen, 1998.

2.5 Constraints on Use
These products are freely available to use, however ESA and EUMETSAT should be acknowledged in
any publications. The data provided are freely available to use, however users do not have
permission to redistribute the data they obtain. The free data must be obtained from the eSurge
website, and the user must register their intent to use the data. User registration is essential to
assess the success and performance of the eSurge web-service as it allows monitoring of data use
and future tailoring of product availability to user needs. Also note that use of the data implies that
the user is agreeing to give proper accreditation to both the eSurge inundation dataset providers,
and the ESA in any publications arising from the data’s use.

3. FURTHER INFORMATION AND CONTACTS
For queries regarding Infrared Image Data for Storm Tracking data, please do not hesitate to contact:
Product Originators contact: National Oceanographic Centre
Email address: [email protected]
For queries regarding the eSurge Project, please do not hesitate to contact:
General eSurge contact: Phil Harwood
Website http://www.storm-surge.info
Email address: [email protected]
For queries regarding the European Space Agency (ESA) Data User Elements (DUE) Programme, see
http://due.esrin.esa.int/

4. Further Reading
Stoffelen, 1998
Stoffelen , A.C.M., (1998) Infrared Image Data for Storm Tracking, Thesis,
University Utrecht, http://igitur-
archive.library.uu.nl/dissertations/01840669/inhoud.htm

ANNEX A: THE ESURGE PROJECT
A.1 About eSurge
Despite the potential utility of satellite data, the storm surge community has not made as much use
of it as they could. Largely this is due to the lack of easy data access. Different datasets are stored in
different locations, in different data formats and with different access requirements. eSurge aims to
change this, bringing relevant datasets together in an east to use, web-accessible database of data
products, downloadable in a standardised format.
The eSurge project is being run in two phases. During the initial Development Phase (Phase 1) we
have built the database, known as SEARS (Surge Event Analysis and Repository Service), and
populated it with initial data for a selection of historical surge events. This will give a useful library
that can be used for assessing and improving the performance of numerical models. Whilst most of
the datasets are already available, and just need to be imported into the database, others are being
created during the project.
Following the launch of the SEARS database, eSurge will move into a Service Demonstration phase
(Phase 2). During this phase we will continue to add more historical data, but will also look at making
data available for surge events as they occur. The aim is to show that it is feasible to provide satellite
data in near real time, so that it could potentially be used in forecasting and warning systems.
It is important to note that eSurge is not itself a forecasting and warning system, it is a system to
make data available to forecasters. There are dedicated agencies (such as the UK Environment
Agency) whose role it is to warn of impending flooding.
Making the data available is just part of the process of getting people to use it; we must also show
the value of the data. To this end our partners at DMI and NOC will perform a series of experiments,
focussing on the North Sea and North Indian Ocean. These will take existing models, such as DMI’s
HBM model and NOC’s operational CS3X surge model, and will look at how incorporating satellite
data could improve the models’ hindcast accuracy. These experiments will also investigate the best
way to incorporate satellite data into models. This is a complex subject, and we do not expect to be
able to resolve it in this project, but we aim to pave the way for future work

A.2 The eSurge Consortium
The eSurge consortium consists of CGI (UK), the National Oceanography Centre (UK), the Danish
Meteorological Institute (DK), University College Cork’s Coastal and Marine Research Centre (IRL)
and the Royal Dutch Meteorological Institute (NL).
Consultants to Government and Industry (CGI) was founded in 1976, and is a global IT and business
process services provider delivering business consulting, systems integration and outsourcing
services. With 72,000 professionals operating in 400 offices in 40 countries, CGI fosters local
accountability for client success while bringing global delivery capabilities to clients’ front doors. CGI
applies a disciplined and creative approach to achieve an industry-leading track record of on-time,
on-budget projects and to help clients leverage current investments while adopting new technology
and business strategies. As a result of this approach, our average client satisfaction score for the past
10 years has measured consistently higher than 9 out of 10. We have a dedicated international
Space and Satcoms business with over 300 specialists and a long track record in delivering mission
critical software systems across the Space sector, and in particular for Navigation and GNSS systems.
We have worked on many ESA Earth Observation projects, including GlobWave, CCI, GECA, PALSAR
and many others.
The National Oceanography Centre (NOC) is a wholly owned centre of the Natural Environment
Research Council (NERC). The NOC was formed by bringing together the NERC-managed activity at
Liverpool’s Proudman Oceanographic Laboratory and the National Oceanography Centre,
Southampton, creating the UK’s leading institution for sea level science, coastal and deep ocean
research and technology development. The NOC hosts both the National Tidal and Sea Level Facility,
and the Permanent Service for Mean Sea Level (since 1933), and contributes to the Storm Tide
Forecasting Service (STFS), developing operational tide-surge models that provide UK coastal flood
warning (in partnership with the Met Office and the Environment Agency). It has been at the
forefront in developing interfaces to data sources and information. NOC have been involved in ESA
funded projects such as COASTALT, GlobColour and GlobWave.
The Danish Meteorological Institute (DMI) is a public institute, providing meteorological,
oceanographic and related services for the people of the Kingdom of Denmark (Denmark, the Faroe
Islands and Greenland). DMI’s area of activity comprises forecasting and warning services as well as
continuous monitoring of weather, sea state, climate, and related environmental conditions in the
atmosphere, over land and in the sea. As such, it has national responsibility for carrying out storm

surge model forecasts and issuing warnings for Danish areas to the Danish coastal authorities and
the public in general. DMI is part of the Baltic Sea Operational Oceanographic System (BOOS) and
North West Shelf Operational Oceanographic System (NOOS). DMI play the role as the real-time in-
situ sea level centre for the BOOS and NOOS communities. In the MyOcean project DMI leads the
Baltic Model Forecasting Centre providing real time ocean forecasting for the Baltic Sea. DMI is part
of the High Resolution Local Area Modelling (HIRLAM) developing consortium within numerical
weather predictions. DMI is operationally running a number of numerical forecast models for
European and Arctic regions, alongside regional and large scale ocean models (HBM and HYCOM).
DMI is part of a collaboration developing a coupled atmosphere, ocean and sea ice climate model
(EC-Earth), whilst a high resolution coupled ocean and ice forecast model (HYCOM/CICE) is currently
being developed at the institute.
The Coastal and Marine Research Centre (CMRC) in University College Cork was established in 1994
to undertake research into coastal and marine resource management. It is part of the Environmental
Research Institute (ERI) and the Irish Maritime and Energy Resource Cluster (IMERC).Research and
consultancy in the CMRC is undertaken by staff with a range of specialist backgrounds, all of whom
work collaboratively in a project orientated environment. The Centre’s expertise and skill sets are
highly regarded both nationally and internationally. Fundamental and applied research in the CMRC
is organised according to five specialist areas of interest: marine geomatics; applied remote sensing
and GIS; marine and coastal governance; coastal processes and seabed mapping and marine ecology.
The CMRC works with data from a wide range of satellite EO instruments including MERIS, MODIS,
SAR and higher resolution optical datasets (e.g. Landsat, IRS, SPOT, and IKONOS) for land, coastal
and marine applications. It lies at the forefront of geomatics research with Europe and
internationally, with an ability to work with a variety of data in projects such as FP7 NETMAR, FP6
InterRisk and FP5 DISMAR. It has a track record of engaging end users and stakeholders in projects,
organising the CoastColour users’ workshop in 2008 and, was part of the organising committee for
the European Space Agency’s Space innovation Powering Blue Growth Conference held in Cork in
April 2013. The CMRC is currently being merged with sister centres in University College Cork under
the banner of Beaufort Research. For further information see www.beaufortresearch.ie.
The Koninklijk Nederlands Meteorologisch Instituut, KNMI, (Royal Netherlands Meteorological
Institute) is a government agency operating under the responsibility of the Dutch Ministry of
Transport. It provides weather observations, weather forecasts and vital weather information, whilst
carrying out applied and fundamental research in support of its operational tasks and as a global
change research centre. Skilled and experienced groups, specialising in diverse topics such as
instrument development and electronic read-out, automation, computing, operations control and
quality control are employed within the institute, providing quality controlled, and cost effective
data acquisition and data processing services. As an operational meteorological data centre and
research institute in one, KNMI combines its international networks and collaborative projects in a
practical way. It is an active member of the World Meteorological Organisation (Geneva, CH), the
European Centre for Medium-range Weather Forecasts (Reading, UK) and the European
Organisation for the Exploitation of Meteorological Satellites (Darmstadt, G), and Eumetsat's Ocean
and Sea Ice Satellite Application Facility (SAF).

Blank
Page

For more information on this product please contact
the NOC at
For more information on eSurge please contact
Phillip Harwood, eSurge Project Manager, at