
Module G1 Electric Power Generation and Machine Controls James D. McCalley.
Upload
robert-gilmoreCategory
view
214download
1
Storage technologies and wind in electricity markets
EE 552June 16, 2013
James D. McCalley Harpole Professor of Electrical & Computer Engineering
Acknowledgment Trishna Das Venkat Krishnan
PhD Student Research Scientist

Outline1. Objective2. Balancing systems3. Storage classifications4. Model description5. Production cost study results
(economic assessment of storage)6. Conclusions
2

ObjectiveWe seek to establish tools and procedures
for evaluating the extent to which storage technologies should play a role in portfolios of future grid services,
given objectives of • minimizing investment & production costs, • minimizing environmental impact (e.g., CO2), • maximizing system reliability & resilience.
An essential step in this effort is to develop a high-fidelity model for use in day-ahead markets and production cost studies.
3

4
Balancing Systems
NETWORKAUTOMATIC GENERATION
CONTROL SYSTEM
REAL-TIME MARKET
1 sol/5min gives 1 oprtng cdtn
DAY-AHEAD MARKET
1 sol/day gives 24 oprting cdtns
ENERGY & RESERVE SELL OFFERS
ENERGY BUY BIDS
FREQUENCY DEVIATION FROM 60 HZ
ENERGY BUY BIDS
REQUIRED RESERVES
ENERGY & RESERVE SELL OFFERS REQUIRED
RESERVES
minΣΣ zit{Cost(GENit)+Cost(RSRVit)}sbjct to ntwrk+status cnstraints
minΣΣ {Cost(GENit)+Cost(RSRVit)}sbjct to ntwrk cnstraints
LARGE MIXED INTEGER PROGRAM
LARGE LINEAR PROGRAM
BOTH CO-OPTIMIZE: energy & reserves

5
Market prices - Energy
6:00 am-noon (CST) 8/28/2012
PennOhio
NY
Iowa
s

6
Market prices - Energy
Real-Time 8:25 am (CST) 6/4/2013
7
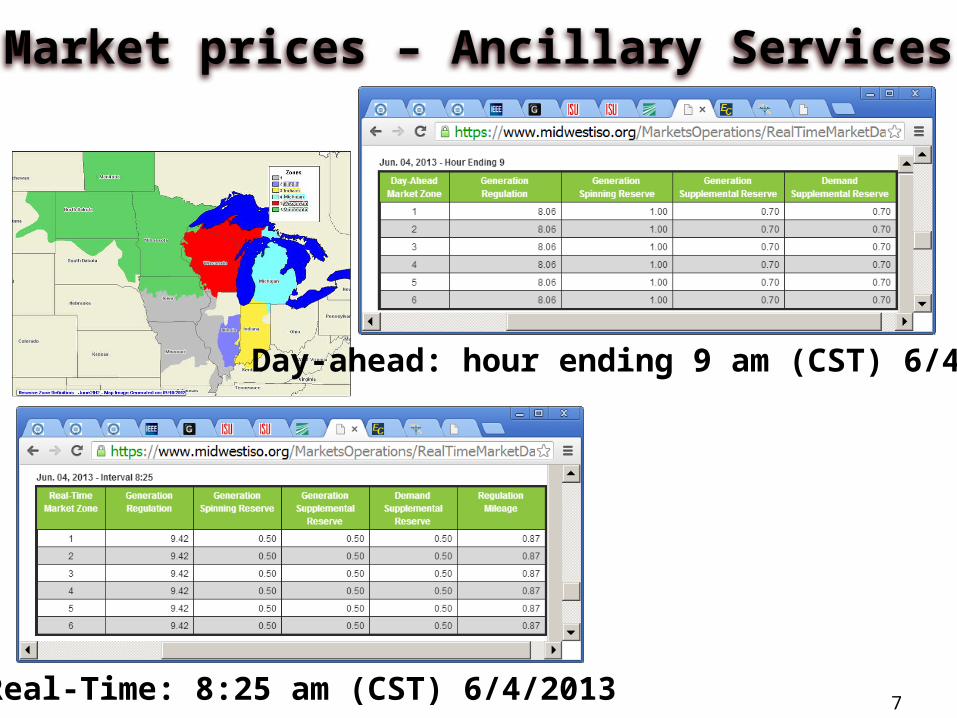
Market prices – Ancillary Services
Real-Time: 8:25 am (CST) 6/4/2013
Day-ahead: hour ending 9 am (CST) 6/4/2013
8
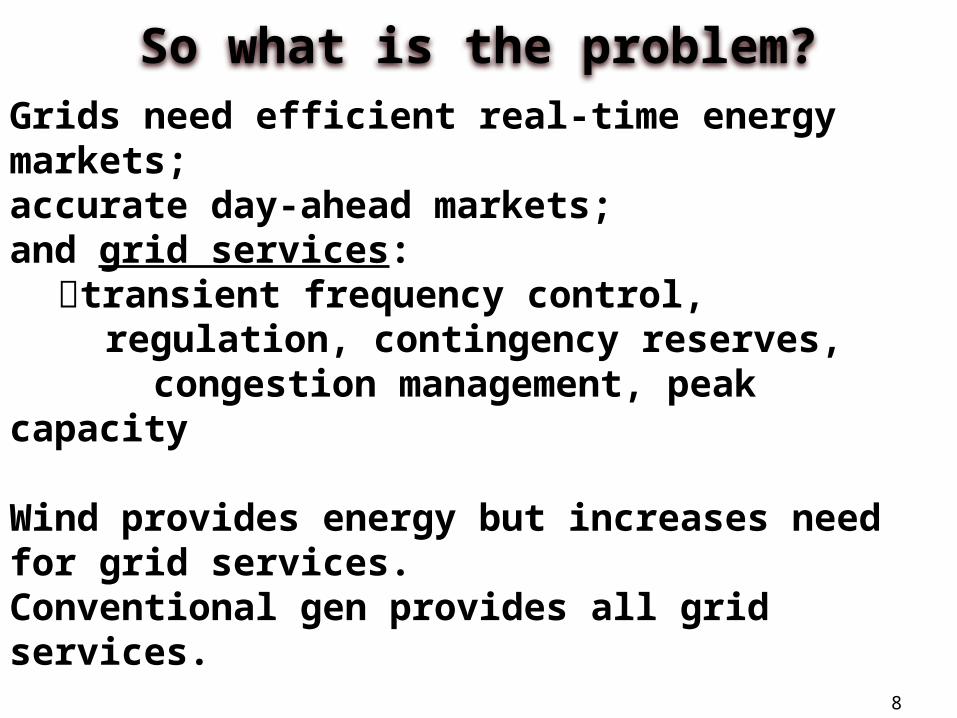
So what is the problem?Grids need efficient real-time energy markets;accurate day-ahead markets; and grid services:
transient frequency control,regulation, contingency reserves,
congestion management, peak capacity
Wind provides energy but increases need for grid services.Conventional gen provides all grid services.
Increased wind causes conventional gen displacement.
How to provide grid services when wind penetration is high and conventional generation penetration is low?

9
Regulation requirements increase

10
Grid serviceGrid technologies to improve grid performance
Control of variable wind &
solar
Increased cnventional generation
Storage Load Cntrl
Stoch-astic SCUC
Dec fore-cast error
Wind plant remote trip (SPS)
Add HVDC and utilize control
Add AC Transmission
Geo- diversity of wind
Inrtial emu-lation
Freq reg & rmping control
DIR market
Spnng /10 min resrves
Avalble Capcity
Shrt-
term
Bulk Fast Slow
Efficient real-time market (low market clearing prices) √ √ √ √ √ √ √ √ √ √Efficient day-ahead market (highly accurate conditions) √ √ √ √ √ √ √ √ √ √Transient freq control
√ √ √ √ √ √ √Regulation (frequency control) √ √ √ √ √ √ √ √ √ √Load following (includes load leveling) √ √ √ √ √ √Managed transmission congestion √ √ √ √ √ √ √ √Peak capacity
√ √ √ √ √
How much role should storage play within portfolio of technologies for high renewable penetration?
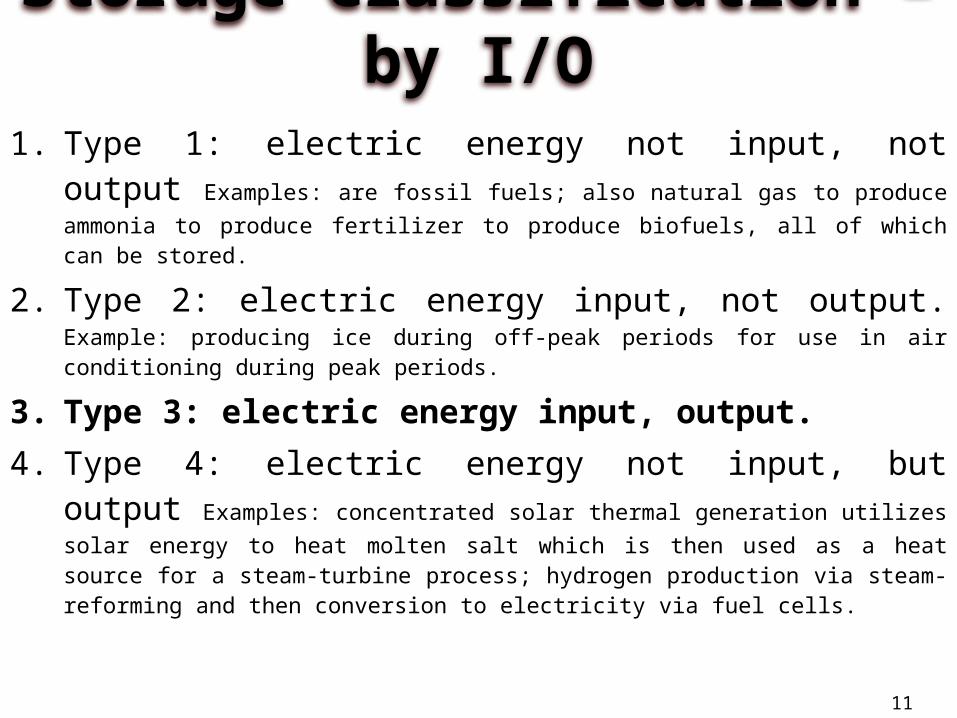
1. Type 1: electric energy not input, not output Examples: are fossil fuels; also natural gas to produce ammonia to produce fertilizer to produce biofuels, all of which can be stored.
2. Type 2: electric energy input, not output. Example: producing ice during off-peak periods for use in air conditioning during peak periods.
3. Type 3: electric energy input, output.4. Type 4: electric energy not input, but output
Examples: concentrated solar thermal generation utilizes solar energy to heat molten salt which is then used as a heat source for a steam-turbine process; hydrogen production via steam-reforming and then conversion to electricity via fuel cells.
11
Storage Classification – by I/O

12
Storage Classification – by capacity
Bulk storage: Stores large quantities of energy and sustains power production across several hours.
BatteriesFlywheels
Fuel Cells
ThermalStorage
SMESSuper
CapacitorsPumped Hydro
CompressedAirNaS Lead Acid
Power Density Good Good Very GoodVery Good
Excellent Excellent Very Good Very Good Very Good
Energy DensityExcellent
170 kWh/m3
Very Good40 kWh/m3
FairVery Good
Excellent Fair Good Very Good Very Good
Recharge Time Very Good Good Excellent Fair Very Good Excellent Excellent Fair Fair
Dynamic Response
ms ms ms 1s mins msLess than 1
minLess than 3
minLess than 10
min
Cost/kW $1800 $120 $100 -$300 $4000 $600 $975 $120 $1000 $400
Round Trip Efficiency %
89-92 75 85-90 59Depends on
Storage medium
90-95 95 70-85 70+
Short-term storage: High ramp rates - instantaneously responds to net-load fluctuations, but with sub-hourly energy sustaining capacity.

13
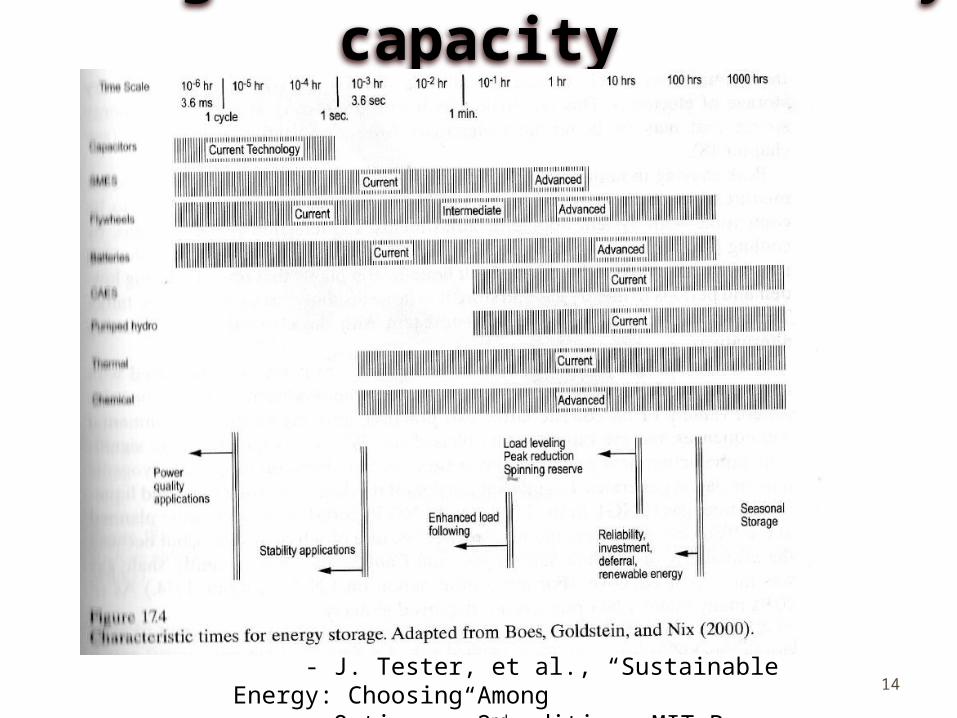
Storage Classification – by capacity
- J. Tester, et al., “Sustainable Energy: Choosing Among Options,” 2nd edition, MIT Press, 2012.
Observe the charge/discharge time…
14
Storage Classification – by capacity
- J. Tester, et al., “Sustainable Energy: Choosing Among Options,” 2nd edition, MIT Press, 2012.

Comparison: energy vs. power
15
Bulk Storage Technologies

Pumped Storage
16
• Reliable technology over the years for applications requiring long-term and large storage capacities, and have proliferated in most parts of the world.
• Typically, cheap off peak power is used to pump the water into an elevated reservoir, thereby storing energy in the form of potential energy, which is utilized through conventional hydro-turbine technology as electricity demand increases.
• Presently, siting of new PHS face objections regarding their effect on environment, similar to what transmission lines are facing. Pumped hydro is particularly difficult to use in the Midwest of the United States, although MISO has initiated the Manitoba Hydro Wind Synergy Study.

Pumped Storage
17

Pumped Storage
18

Compressed air energy storage
19
During peak wind generation hours, power is drawn from the grid and used to run a compressor to compresses air into an underground rock or salt cavity, an aquifer, or an above-ground tank.
When power is needed, the compressed air is used to combust with fuel which in turn runs the gas turbine. The gas turbine is coupled with an electric generator connected to the grid. The fact that the air is compressed means that the compressor which is needed in a standard gas turbine is not needed on the turbine side of this process.

Short-term (or bulk?) storage:Chemical storage – Fuel cells
20
“One of the advantages of having gasoline and diesel as primary transportation fuels is their high energy density and their ability to be stored on –board as liquids at ambient pressure s and temperatures. The infrastructure for producing and distributing these fuels is highly developed. While hydrogen has a reasonable energy density on a mass basis of 120,000kJ/kg compared to about 45,000 kJ/kg for gasoline or diesel, its low density as a gas at ambient temperature and pressure results in a volumetric energy density of only 10MV/m3 compared to 35,000MJ/m3 for gasoline or diesel. The energy content of a full 20-gallon gasoline tank in an automobile is about 2.8GJ. If we were to fill that same tank with hydrogen gas at 1 atmosphere, the energy content would only be 0.0008GJ. One way around this problem is to pressurize the hydrogen and store it as a compressed gas, which introduces both infrastructure and safety challenges.” - J. Tester, et al., “Sustainable Energy: Choosing Among Options,” 2nd edition, MIT Press, 2012.
Converts chemical energy from a fuel (e.g., hydrogen) into electrical energy via a chemical reaction with oxygen. Without the continuous supply of fuel, the fuel cell is inoperative.

Short-term storage:Electrochemical storage (batteries)
21
• Lead-acid batteries: very low cost, but low energy density
• Sodium-sulfur: maybe the most promising
• Flow (redox) batteries: combines flow (as in fuel cell) of an electrolyte with electrochemical reaction; unlike the fuel cell, the flow battery remains operative even without its flow
• Nickel-cadmium batteries• Nickel-metal hydride batteries

Thermal-energy storage
22
Heat-based thermal energy storage
Ice-based thermal energy storage

Kinetic energy storage - flywheels
23
Flywheel energy storage (FES):Flywheels work under the principle of mechanical inertia. Energy is stored in the form of rotational kinetic energy by accelerating a disc or rotor (flywheel), which can be extracted in the form of electricity by decelerating the flywheel.

Other short-term storage technologies
24
• Super capacitors: Their operation is similar to capacitors with one major difference being the usage of ionic conductor as electrolyte instead of insulating material, for the electrolyte made of conductors with a very large specific surface allows ion movement.
• Superconducting magnetic energy storage (SMES): stores energy in the form of a magnetic field that is created by the flow of direct current in a superconducting coil such as niobiumtitane (NbTi) filaments, below its superconducting critical temperature. This energy is released back, by discharging the coil, when needed for various purposes such as meeting peak demand during day, improving power quality, and powering transportation systems .
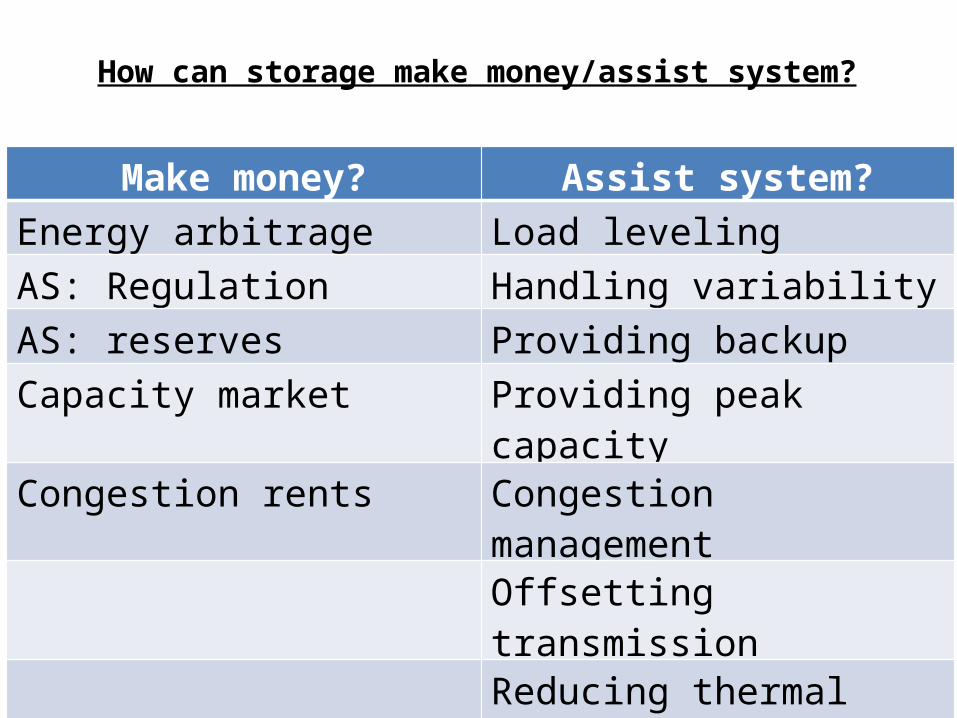
How can storage make money/assist system?
25
Make money? Assist system?Energy arbitrage Load levelingAS: Regulation Handling variabilityAS: reserves Providing backupCapacity market Providing peak capacityCongestion rents Congestion management
Offsetting transmissionReducing thermal cyclingImproving frequency performance

26
Three types of storageCompressed Air Energy Storage (CAES) Flywheel
Batteries
For very readable summary of storage technologies, see P. Parfomak, “Energy storage for power grids and electric transportation: a technology assessment,” Congressional Research Service, March, 2012, at http://www.fas.org/sgp/crs/misc/R42455.pdf.

CAES, PHS, large capacity batteries Flywheel, SMES, small capacity batteries
• Regulation-Up• Discharge Increase
• Regulation-Down• Charge Decrease
Conventional generator
• Regulation-Up• Discharge Increase
• Regulation-Down• Discharge Decrease
4-Quadrant 2-Quadrant
27
Storage classification – by operational modes
SET POINT, CHARGING
SET POINT, DISCHARGING
REGULATION UP
REGULATION DOWN
Increase discharging
Decrease charging
Increase charging
Decrease discharging
Short-term storage has little energy arbitrage potential; therefore no reason to be charging while providing RU or discharging while providing RD. That is, it is a regulation-provider only.
• Regulation-Up• Discharge Increase• Charge Decrease
• Regulation-Down• Discharge Decrease• Charge Increase

28
Developed storage model
SOME LIMITATIONS OF PUBLISHED MODELS CAPABILITIES OF DEVELOPED MODEL
Price-taker/self-scheduler Active market participant
Models energy arbitrage only Also models ancillary services (AS)
Models only discharging side of AS Models discharging & charging sides of AS
Models only charging-RD & discharging-RU Models charging-RD/RU & discharging-RD/RU
Models reservoir limits for only energy Models reservoir limits for AS commitments
Not used for smaller dispatch interval Adapts to smaller dispatch interval (e.g., 5 min)

29
Test systemSTORAGE
3405 MW of installed gen capacity (w/o wind)
2490 MW of peak load

30
Model: 2 multi-period optimizations
…SYSTEM EQUATIONS
FOR t=1SYSTEM EQUATIONS
FOR t=2
48-hour Mixed Integer Program (MIP)Unit status constraints
Unit ramping constraints
Reservoir update constraint
…48-hour Linear Program (LP)Reservoir update constraint
Unit statuses, dispatch levels, AS commitments
Unit dispatch levels, AS commitments, LMPs
SYSTEM EQUATIONS FOR t=48
SYSTEM EQUATIONS FOR t=1
SYSTEM EQUATIONS FOR t=2
SYSTEM EQUATIONS FOR t=576
A “production-cost” model to simulate days, weeks, 1 year of power system operation.

Objective Function for Hourly MIP
TGFji
jiji tetC,,),(
),(),( )(.)(
Gji
jisr
jisr tetC
),(
),(),( )(.)(
Gji
jinsr
jinsr tetC
),(
),(),( )(.)(Non-Spinning Reserve (NSR) Cost ($/MWh) * Non-Spinning Reserve(MW)
Gji
jireg
jireg tetC
),(
),(),( )(.)(
Regulation Up (RU) Cost ($/MWh) * Regulation Up (MW)
Gji
jireg
jireg tetC
),(
),(),( )(.)(
Regulation Down (RD) Cost ($/MWh) * Regulation Down (MW)
Gji
jijijix tXtXtS
),(
),(0
),(),( )()(.)(Start-Up Cost ($/MWh) * (Start-Up Indicator + NSR Start-up Indicator)
Gji
jijijiy tYtYtS
),(
),(0
),(),( )()(.)(Shut-Down Cost ($/MWh) * (Shut-Down Indicator + NSR Shut-Down Indicator)
Dj
jj tLtPen )(.)(Penalty($/MWh) * Load not served (MW)
Energy Cost ($/MWh)* Energy Flow (MW)
Spinning Reserve (SR) Cost ($/MWh) * Spinning Reserve (MW)
ANCILLARY SERVICES
Minimize:
31

32
General arc equations
)()()()( ),(),(),(),( tdtLtete jjk
kjiji
jiji Energy balance at every node. η(i,j)= η(j,i) represents losses: half on charging side, half on discharging side.
),(max
),(),(min )( jijiji EteE Constrains arc flows within limits.
Transmission arcs )()()()( ),(),( tttbte jijiji DC power flow relations
Wind arcsWind is modeled as market participant, limited by hourly forecast W(t)
)()( ),(),( tWte jiji
All arcs

33
Gen/discharge & charge arcs
),(max
),(),(),(min
),( )( jijijijiji EUteEU unit maximum & minimum limits
60)()1()( ),(),(),( trrtete jijiji unit ramp-up and ramp-down constraints
60)()()1( ),(),(),( trrtete jijiji
)()(),(
),( tRteji
jireg
)()(),(
),( tRteji
jireg
required system up-reg (R+(t)) and down-reg (R--(t)) is provided by units that are ON, per the two equations below.
5)()()(0 ),(),(),( trrtUte jijijireg
5)()()(0 ),(),(),( trrtUte jijijireg
required spinning reserves provided by reg & spinning reserves; )()()()(),(
),(
),(
),( tRSRtRteteji
jisr
ji
jireg
),(
),(
),(
),(
),(
),( )(.)()(ji
jinsr
ji
jisr
ji
jireg tetete
)()()( tRNSRtRSRtR
10)()()()(0 ),(),(),(),( trrtUtete jijijisr
jireg
10)()()(0 ),(),(0
),( trrtUte jijijinsr
),(max
),(),(),(),( )()()()( jijinsr
jisr
jireg
ji Etetetete
)()()()( ),(),(max
),(),(),( tUEtetete jijijisr
jireg
ji
)()()( ),(),(min
),(),( tUEtete jijijireg
ji
unit energy, reg, & spinning reserve constrained by maximum and minimum limits
)()()1()( ),(),(),(),( tYtXtUtU jijijiji change in discharge state during time t-1 to t must have a start or a shut at time t
SAME
GEN/DISCHARGE CHARGE
SAME
SAME
5)()()(0 ),(),(),( trrtUte jiC
jijireg
5)()()(0 ),(),(),( trrtUte jiC
jijireg
10)()()()(0 ),(),(),(),( trrtUtete jiC
jijisr
jireg
)()()()( ),(),(min
),(),(),( tUEtetete ijC
ijijreg
ijsr
ij
)()()( ),(),(max
),(),( tUEtete ijC
ijijreg
ij
unit energy, reg, spinning reserve & nonspinning reserve constrained by maximum limit
),(max
),(),(),(min
),( )( jiC
jijijiC
ji EUteEU
unit’s reg offer is constrained by its 5-min ramp rate.
unit’s reg +spinning reserve offer constrained by 10min ramp rate.
required total reserves provided by reg, spinning & nonspinning reserves;
unit’s nonspinning reserve offer constrained by 10min ramp rate.
NONSPINNING RESERVE NOT ALLOWED
1)()( ),(0
),( tUtU jiji
1)()()( ),(0
),(),( tUtUtU jijiijC
unit must be discharging , down, or providing nonspinning reserveunit must be charging, discharging, down, or providing non-spinning reserve
)()()1()( ),(0
),(0
),(0
),(0 tYtXtUtU jijijiji change in nonspinning reserve state during time t-1 to t must have a quick-start or a shut at time t
DESCRIPTION
Each charge/discharge operation must model energy & AS within units capabilities

34
Reservoir modeling)()()1()( ),(),(),(),(),(),(),( tetetete jiijijijiiiiii )()()( ),(),(),(),(),(),( tetete ij
srijij
regijij
regij )()()()( ),(),(),(),(),(),(),(),( tetetete ji
nsrjiji
srjiji
regjiji
regji
),(max
),(),(),(),(),( )()()()()( iiijsr
ijijreg
ijii Etettette
energy stored in period t-1 less leakage
plus energy to be charged at period t
less energy to be discharged at period t
plus reg-down in charging mode
less reg-up in charging mode
less spinning reserve in charging mode
plus reg-down in discharging mode
less reg-up in discharging mode
less spinning reserve in discharging mode
less nonspinning reserve in discharging mode
energy stored in period t
RESERVOIR UPDATE EQUATION
Must schedule charge/discharge (blue) accounting for AS commitments (red), imposing storage level (yellow), and reservoir limits (below). Limits are derived from the above.
),(min
),(),( )()( iijireg
ii Etete Charge operation with reg-up and spinning reserve: Discharge operation with reg-down:
Reservoir level e(i,i)(t), which includes its charge, must have capacity for scheduled reg-up & spinning reserve.
Reservoir level e(i,i)(t), which includes its discharge, must have capacity for scheduled reg-down
RESERVOIR LIMITS WITH A.S. ARE ESSENTIAL.
35
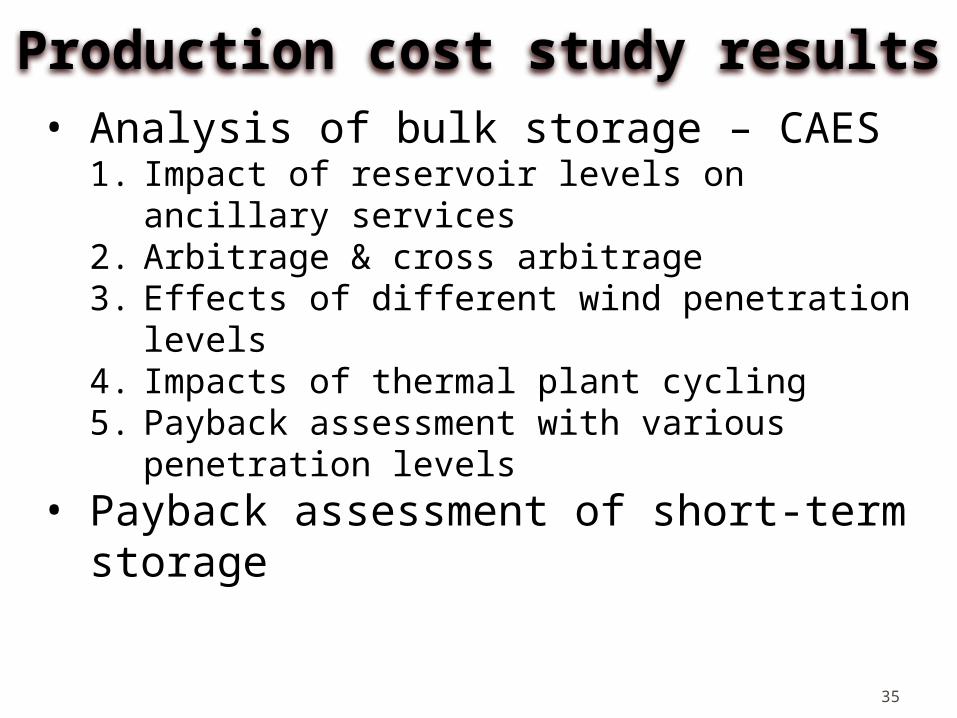
Production cost study results• Analysis of bulk storage – CAES
1. Impact of reservoir levels on ancillary services2. Arbitrage & cross arbitrage 3. Effects of different wind penetration levels4. Impacts of thermal plant cycling5. Payback assessment with various penetration levels
• Payback assessment of short-term storage
36
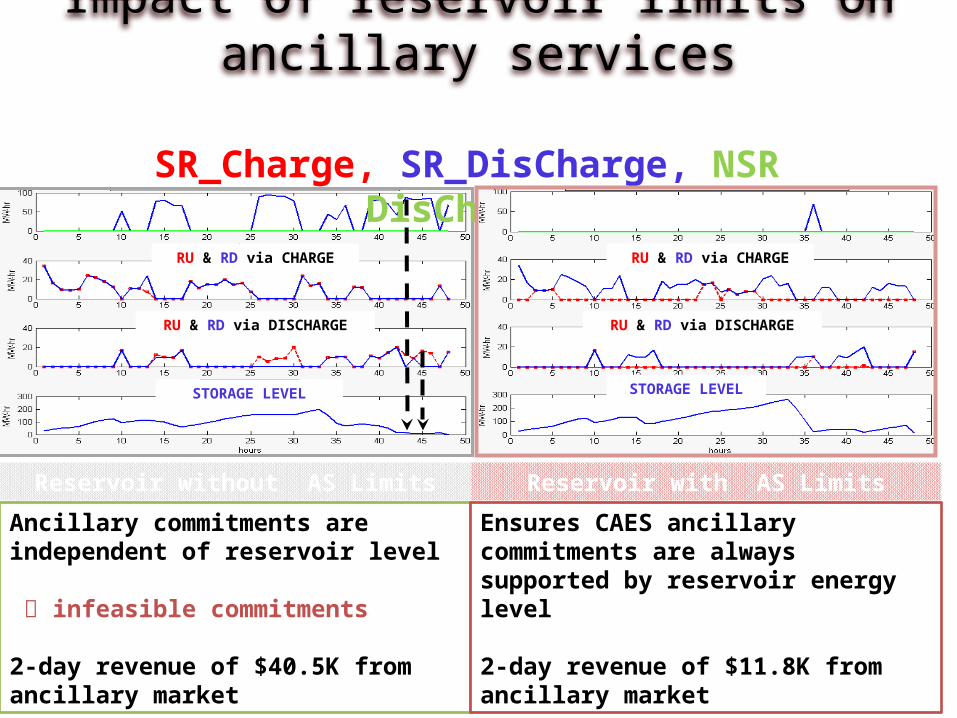
Impact of reservoir limits on ancillary services
Ancillary commitments are independent of reservoir level infeasible commitments
2-day revenue of $40.5K from ancillary market
Ensures CAES ancillary commitments are always supported by reservoir energy level
2-day revenue of $11.8K from ancillary market
Reservoir without AS Limits Reservoir with AS Limits
STORAGE LEVEL
SR_Charge, SR_DisCharge, NSR DisCharge
RU & RD via CHARGE
RU & RD via DISCHARGE
RU & RD via CHARGE
RU & RD via DISCHARGE
STORAGE LEVEL

37
Energy arbitrageENERGY-ARBITRAGE: Charging during low-LMP off-peak periods and discharging during high-LMP peak-demand periods
CAES is charged during low LMPs (≤15$/MWh) and discharged during high LMPs (≥28.03$/MWh).
ChargeCharge
DischargeDischarge
Discharge
Price

38
Cross-arbitrage CROSS-ARBITRAGE: Charges from the regulation market and discharges into the energy market or charges from the energy market and discharges into the regulation market
The amount of down-regulation is more than up-regulation, charging up the reservoir for energy dispatch during high LMP periods
CHARGING, DISCHARGING, LMPS
RU & RD via CHARGE
SR_Ch, SR_DisCh, NSR DisCh
RU & RD via DISCHARGE
STORAGE LEVELCROSS-ARBITRAGE
With AS, 2-day revenue from energy market is $11.28K
Without AS, 2-day revenue from energy market is $3.54K.
39
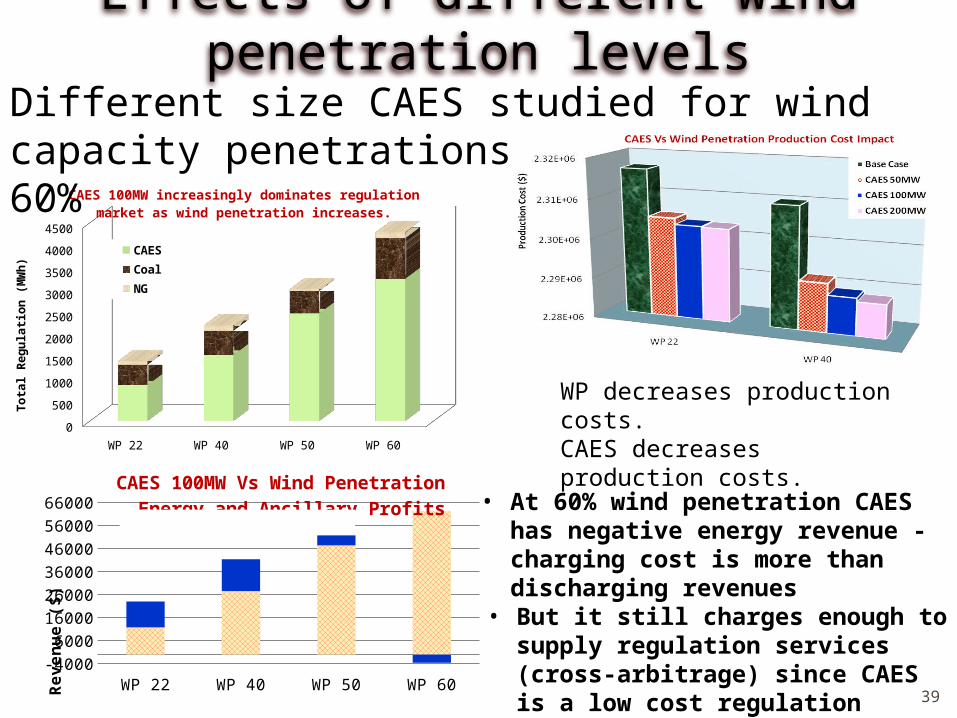
Effects of different wind penetration levels
WP 22 WP 40 WP 50 WP 600
500
1000
1500
2000
2500
3000
3500
4000
4500
CAES 100MW increasingly dominates regulation market as wind penetration increases.
CAES
Coal
NG
To
tal R
eg
ula
tio
n (
MW
h)
Different size CAES studied for wind capacity penetrations of 22, 40, 50, 60%
WP 22 WP 40 WP 50 WP 60-4000
6000
16000
26000
36000
46000
56000
66000CAES 100MW Vs Wind Penetration
Energy and Ancillary ProfitsAncillary Profit Energy Profit
Re
ve
nu
e (
$)
• At 60% wind penetration CAES has negative energy revenue - charging cost is more than discharging revenues
• But it still charges enough to supply regulation services (cross-arbitrage) since CAES is a low cost regulation provider
• Under high wind penetration, bulk storage may benefit more from ancillary services
WP decreases production costs.CAES decreases production costs.
40
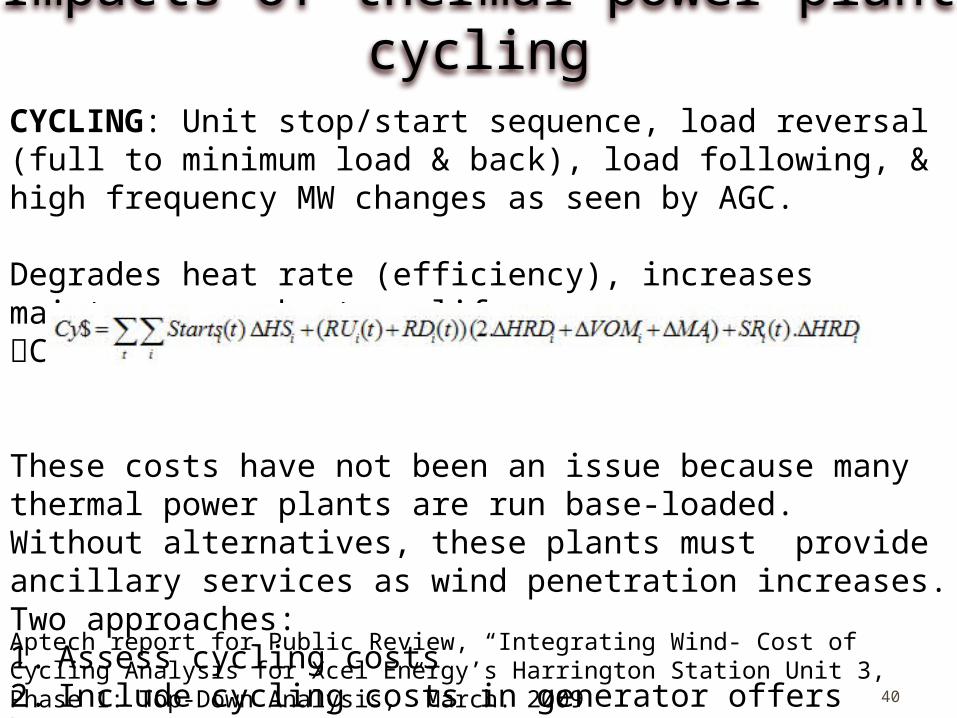
Impacts of thermal power plant cyclingCYCLING: Unit stop/start sequence, load reversal (full to minimum load & back), load following, & high frequency MW changes as seen by AGC.
Degrades heat rate (efficiency), increases maintenance, shortens life.COSTS MONEY!
These costs have not been an issue because many thermal power plants are run base-loaded. Without alternatives, these plants must provide ancillary services as wind penetration increases. Two approaches:1. Assess cycling costs2. Include cycling costs in generator offers
Aptech report for Public Review, “Integrating Wind- Cost of Cycling Analysis for Xcel Energy’s Harrington Station Unit 3, Phase 1: Top-Down Analysis,” March. 2009 http://blankslatecommunications.com/Images/Aptech-HarringtonStation.pdf.

Base Case CAES 100MW Min Cycling Cost Max Cycling Cost2,300,000.002,310,000.002,320,000.002,330,000.002,340,000.002,350,000.002,360,000.002,370,000.002,380,000.00
Cycling cost with Production Cost @ WP 60%Cycling Cost Classical Production Cost
41
Impacts of cycling: System view
Case 2: CAES lowers both production and cycling costs.Case 1: Without CAES,
and without cycling in bids, production cost and cycling cost are very high.
Case 3: Inclusion of cycling costs in bids increases prod cost but lowers cycling costs.
d
d
Assessed cycling cost“Classical” Production costs
42
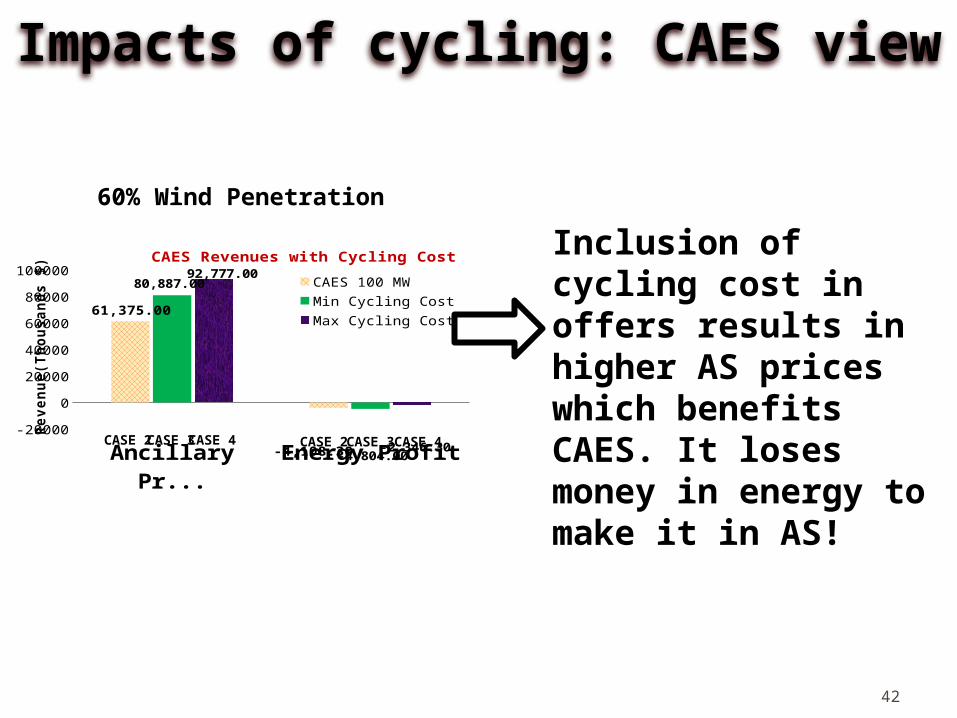
Impacts of cycling: CAES view
Inclusion of cycling cost in offers results in higher AS prices which benefits CAES. It loses money in energy to make it in AS!
Ancillary Profit Energy Profit-20000
0
20000
40000
60000
80000
100000
61,375.00
-4,108.30
80,887.00
-4,804.00
92,777.00
-2,346.30
CAES Revenues with Cycling Cost
CAES 100 MWMin Cycling CostMax Cycling Cost
Reve
nue(
Thou
sand
s $)
CASE 2 CASE 3 CASE 4 CASE 2 CASE 3 CASE 4
60% Wind Penetration
43
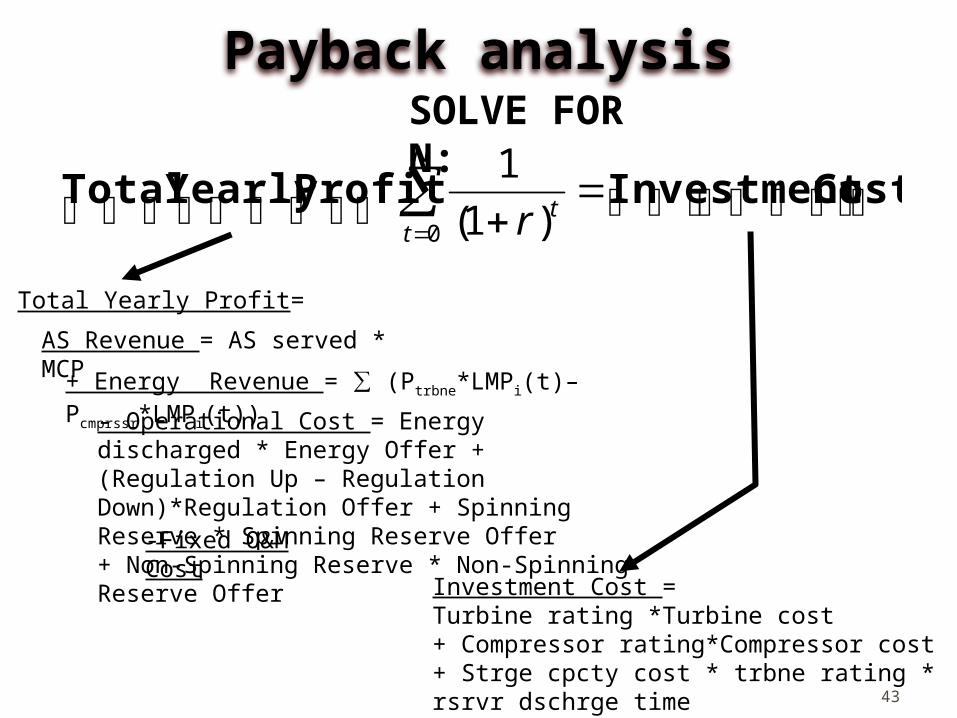
Payback analysis
Cost InvestmentProfit Yearly Total
N
ttr0 )1(
1SOLVE FOR N:
AS Revenue = AS served * MCP
+ Energy Revenue = ∑ (Ptrbne*LMPi(t)–Pcmprssr*LMPi(t))
Total Yearly Profit=
- Operational Cost = Energy discharged * Energy Offer + (Regulation Up – Regulation Down)*Regulation Offer + Spinning Reserve * Spinning Reserve Offer + Non-Spinning Reserve * Non-Spinning Reserve Offer
Investment Cost = Turbine rating *Turbine cost + Compressor rating*Compressor cost + Strge cpcty cost * trbne rating * rsrvr dschrge time
-Fixed O&M Cost

44
Payback analysisAttributes CAES 50MW CAES 100MW
Wind Penetration WP 22 WP 40 WP 60 WP 22 WP 40 WP 60Energy Discharge (MWh) 386.45 395.13 132.57 452.06 650.23 368.22Up-Reg/Down-Reg (MW-hr) 288/682 513/933 883/1206 138/682 474/1025 1503/1728Spin/Non-Spin (MW-hr) 0/0 49.4/0 18/0 67/0 58/100 245/0Yearly Fuel Cost (M$) 1.23 1.46 2.37 1.35 1.71 2.73Yearly Fixed O&M Cost (M$) 1.63 1.63 1.63 3.26 3.26 3.26Investment Cost (M$) 25.5 25.5 25.5 51 51 51Ancillary Revenue (K$) 16.97 26.85 43.85 11.81 27.58 70.07Energy Revenue (K$) 8.06 8.44 -0.033 11.28 13.88 -5.61Total Yearly Revenue (M$) 4.55 6.42 7.97 4.20 7.55 11.73Yearly Profit (M$) 1.70 3.34 3.97 -0.413 2.57 5.74Payback (years) 15.02 7.64 6.42 - 19.81 8.88
• Payback period improves under increasing wind penetration levels system regulation requirement increases
• At the lower penetration level (WP 22%) Smaller capacity CAES has a better payback For larger CAES, its high investment cost dominates its ability to benefit from markets Larger CAES makes less total revenue than smaller CAES, but objective value with larger
CAES is lower than with smaller CAES. Storage investors need to understand this!• Sensitivity studies show that storage economics significantly benefit from
inclusion of cycling costs in AS offers: CAES 100 MW @ WP 60% PB 8 to 5years from institution of a CO2 tax: CAES 100 MW @ WP 40% PB = 20 to 10years

45
Analysis of short-term storage 20 MW flywheel
FW 20MW FW 50MW Batt 50MW
WP 22 WP 40 WP 60 WP 22 WP 60 WP 60
Regulation Bid ($/MW-hr) 2 2 2 2 2 2Investment Cost (M$) 8.15 8.15 8.15 20.375 20.375 12.5
Rating (MW-hr) 5 5 5 12.5 12.5 12.5
Regulation served (MW-hr) 856.65 887.73 887.77 1243.21 2202.48 2260.61
Ancillary revenue (K$) 10.768 12.512 (9) 13.567 11.737 26.338 26.684Yearly revenue (M$) 1.96 2.275 2.47 2.135 4.795 4.86Yearly op. cost (M$) 0.155 0.16 0.16 0.225 0.4 0.41Yearly profit (M$) 1.805 2.115 2.31 1.91 4.395 4.45Payback (years) 4.52 3.85 (10.62) 3.53 10.67 4.64 2.81
Similar studies performed for a 50 MW Flywheel and a 50 MW Battery, with associated payback analysis.
Small and short-term storage pay back quickly due to ability to provide low regulation offers.

46
Insights from this work1. Storage models for production cost must constrain
reservoir levels for energy & AS commitments.2. Energy arbitrage & cross-arbitrage are important for
storage to obtain revenues and provide grid services3. Bulk storage is expensive but can be economic if
cycling is modeled.4. Short-term storage participates only in AS but is
cheap and can therefore be very economic. 5. All storage looks better as AS requirements
(wind/solar) increase, but, need to study options.6. Storage economics are not simple and must be
studied for a given system, location, size, and type