STORAGE, MANIPULATION, AND VISUALIZATION … · This paper discusses these and other relevant...
8
STORAGE, MANIPULATION, AND VISUALIZATION OF LIDAR DATA B. Schön a , M. Bertolotto a , D.F. Laefer b,* , a , Seán W. Morrish b a UCD, School of Computer Science & Informatics, Belfield, Dublin 4, Ireland - (bianca.schoen, michela.bertolotto)@ucd.ie b UCD, Urban Modelling Group, School of Architecture, Landscape & Civil Engineering, Newstead, Belfield, Dublin 4, Ireland - (debra.laefer, sean.morrish)@ucd.ie KEY WORDS: Spatial Information Systems, LiDAR, three-dimensional indexing techniques ABSTRACT: In recent years, three-dimensional (3D) data has become increasingly available, in part as a result of significant technological progresses in Light Detection and Ranging (LiDAR). LiDAR provides longitude and latitude information delivered in conjunction with a GPS device, and elevation information generated by a pulse or phase laser scanner, which together provide an effective way of acquiring accurate 3D information of a terrestrial or manmade feature. The main advantages of LiDAR over conventional surveying methods lie in the high accuracy of the data and the relatively little time needed to scan large geographical areas. LiDAR scans provide a vast amount of data points that result in especially rich, complex point clouds. Spatial Information Systems (SISs) are critical to the hosting, querying, and analyzing of such spatial data sets. Feature-rich SISs have been well-documented. However, the implementation of support for 3D capabilities in such systems is only now being addressed. This paper analyzes shortcomings of current technology and discusses research efforts to provide support for the querying of 3D data records in SISs. 1. INTRODUCTION 1.1 Motivation True three-dimensional (3D) support for spatial data has only recently been addressed in Spatial Information Systems (SISs). Examples include ESRI’s ArcGIS geo-database with its support for two-and-a-half dimensions (2.5D) in its Digital Elevation Model (DEM) and Triangular Irregular Network (TIN) and the more recent development of a Terrain feature class and support for 3D objects and buildings with its multipatch feature class. These new achievements towards multi-dimensional data representation allow for a high level of accuracy, with regard to feature visualization, as well as empowering applications that employ this enhanced information level. However, current technology has only begun to exploit the potential richness, because true 3D support is presently rather static, as current SISs only offer capabilities for hosting of 3D data and fall short of supporting meaningful analysis of these vast data sets. For example, although most SISs provide the functionality to create TINs from LiDAR point clouds, these TINs cannot be updated or manipulated efficiently. This limitation significantly restricts the potential for harnessing these data sets for integrated and dynamic urban planning, as changes cannot be easily implemented on the environment, and subsequently, they cannot be analyzed for decision making. In addition to the inflexibility of TIN creation, 3D indexing techniques have yet to be fully incorporated. The original R- tree, for instance, is based on a hierarchical structure of minimum bounding rectangles (MBRs) that divide the space along the x- and y-axes. Important height information provided by 3D data is, thus, ignored. This paper analyses and discusses efforts to date made in the area of indexing of 3D data sets in SISs. 1.2 Related Work Recently, some Geographic Information Systems (GISs) and Spatial Database Management Systems (SDBMSs) vendors have extended their technologies to integrate true 3D features. This is largely driven by the increased availability of 3D data (e.g. from aerial and terrestrial LiDAR). A 3D spatial system must support 3D data types, such as point, line, surface and volume in 3D Euclidean space. Such data types are based on a 3D geometric data model (i.e. vector and/or raster data with underlying geometry and topology). A 3D spatial system must also offer operations and functions embedded into its query language that can operate with its 3D data types (Bruening et al., 2004). In order to query data efficiently, it is crucial to apply a suitable index as the entire database record would otherwise have to be traversed during even the most rudimentary of queries. Considering that aerial LiDAR data, for instance, easily produces approximately 280,000,000 data points per square kilometre (Hinks et al. 2007), any query would take a considerable amount of time. Support for two-dimensional (2D) feature types and indexing techniques in systems dealing with spatial data sets has been well documented and exploited commercially. The most popular and enduring indexing technique in this context is Guttman’s R- tree (Guttmann, 1984), which finds application in most SDBMs, such as PostGIS and Oracle Spatial. R-tree is based on MBRs and the 3D extension consists of minimum bounding boxes (MBB). However, R-tree techniques are often low in efficiency, as sibling nodes might overlap. Additionally, nodes are generally uneven in size (Qing et al., 2007). Another popular spatial index is the so called quadtree (Samet, 2006), which aims to decompose the space into 2D cells and is implemented, for example in Oracle Spatial. Octrees are a 3D extension of quadtrees.
Transcript of STORAGE, MANIPULATION, AND VISUALIZATION … · This paper discusses these and other relevant...

STORAGE, MANIPULATION, AND VISUALIZATION OF LIDAR DATA
B. Schön a, M. Bertolottoa, D.F. Laefer b,*, a, Seán W. Morrish b
a UCD, School of Computer Science & Informatics, Belfield, Dublin 4, Ireland - (bianca.schoen,
michela.bertolotto)@ucd.ie b UCD, Urban Modelling Group, School of Architecture, Landscape & Civil Engineering, Newstead, Belfield, Dublin
4, Ireland - (debra.laefer, sean.morrish)@ucd.ie
KEY WORDS: Spatial Information Systems, LiDAR, three-dimensional indexing techniques ABSTRACT: In recent years, three-dimensional (3D) data has become increasingly available, in part as a result of significant technological progresses in Light Detection and Ranging (LiDAR). LiDAR provides longitude and latitude information delivered in conjunction with a GPS device, and elevation information generated by a pulse or phase laser scanner, which together provide an effective way of acquiring accurate 3D information of a terrestrial or manmade feature. The main advantages of LiDAR over conventional surveying methods lie in the high accuracy of the data and the relatively little time needed to scan large geographical areas. LiDAR scans provide a vast amount of data points that result in especially rich, complex point clouds. Spatial Information Systems (SISs) are critical to the hosting, querying, and analyzing of such spatial data sets. Feature-rich SISs have been well-documented. However, the implementation of support for 3D capabilities in such systems is only now being addressed. This paper analyzes shortcomings of current technology and discusses research efforts to provide support for the querying of 3D data records in SISs.
1. INTRODUCTION
1.1 Motivation
True three-dimensional (3D) support for spatial data has only recently been addressed in Spatial Information Systems (SISs). Examples include ESRI’s ArcGIS geo-database with its support for two-and-a-half dimensions (2.5D) in its Digital Elevation Model (DEM) and Triangular Irregular Network (TIN) and the more recent development of a Terrain feature class and support for 3D objects and buildings with its multipatch feature class. These new achievements towards multi-dimensional data representation allow for a high level of accuracy, with regard to feature visualization, as well as empowering applications that employ this enhanced information level. However, current technology has only begun to exploit the potential richness, because true 3D support is presently rather static, as current SISs only offer capabilities for hosting of 3D data and fall short of supporting meaningful analysis of these vast data sets. For example, although most SISs provide the functionality to create TINs from LiDAR point clouds, these TINs cannot be updated or manipulated efficiently. This limitation significantly restricts the potential for harnessing these data sets for integrated and dynamic urban planning, as changes cannot be easily implemented on the environment, and subsequently, they cannot be analyzed for decision making. In addition to the inflexibility of TIN creation, 3D indexing techniques have yet to be fully incorporated. The original R-tree, for instance, is based on a hierarchical structure of minimum bounding rectangles (MBRs) that divide the space along the x- and y-axes. Important height information provided by 3D data is, thus, ignored. This paper analyses and discusses efforts to date made in the area of indexing of 3D data sets in SISs.
1.2 Related Work
Recently, some Geographic Information Systems (GISs) and Spatial Database Management Systems (SDBMSs) vendors have extended their technologies to integrate true 3D features. This is largely driven by the increased availability of 3D data (e.g. from aerial and terrestrial LiDAR). A 3D spatial system must support 3D data types, such as point, line, surface and volume in 3D Euclidean space. Such data types are based on a 3D geometric data model (i.e. vector and/or raster data with underlying geometry and topology). A 3D spatial system must also offer operations and functions embedded into its query language that can operate with its 3D data types (Bruening et al., 2004). In order to query data efficiently, it is crucial to apply a suitable index as the entire database record would otherwise have to be traversed during even the most rudimentary of queries. Considering that aerial LiDAR data, for instance, easily produces approximately 280,000,000 data points per square kilometre (Hinks et al. 2007), any query would take a considerable amount of time. Support for two-dimensional (2D) feature types and indexing techniques in systems dealing with spatial data sets has been well documented and exploited commercially. The most popular and enduring indexing technique in this context is Guttman’s R-tree (Guttmann, 1984), which finds application in most SDBMs, such as PostGIS and Oracle Spatial. R-tree is based on MBRs and the 3D extension consists of minimum bounding boxes (MBB). However, R-tree techniques are often low in efficiency, as sibling nodes might overlap. Additionally, nodes are generally uneven in size (Qing et al., 2007). Another popular spatial index is the so called quadtree (Samet, 2006), which aims to decompose the space into 2D cells and is implemented, for example in Oracle Spatial. Octrees are a 3D extension of quadtrees.

This paper discusses these and other relevant indexing techniques, as well as their implementation in current SISs. As our focus is on LiDAR data manipulation, we investigate the challenges imposed by the desire to harness the full potential of 3D data. 1.3 Overview
This paper first presents how spatial data is hosted in SISs (section 2) and illustrates how new developments, specifically how the ISO standard SQL:1999 led to new improvements towards 3D support in GISs and SDBMSs. Additionally, new data types in GISs and SDBMSs are discussed. Section 3 discusses how spatial data have traditionally been employed for visualization through Digital Elevation Models (DEMs). Challenges that need to be solved in order to empower these structures in a true engineering context are discussed. Next, section 4 peresents the indexing of spatial data. Indexing is crucial in order to facilitate efficient querying of data stored in a SIS. Vendor solutions are presented as well as current research achievements for efficient data analysis.
2. HOSTING SPATIAL INFORMATION
Since the 1960s, GISs have been used for the hosting of spatial data. GISs consider both what an object is and where it is located. Early systems utilized a distinct file-based system for representing spatial features and the related attribute information in both vector and raster formats. These early systems did not easily integrate with external database components. GIS vendors have recently facilitated the integration with several commercial database tools but maintain a loosely coupled approach, where proprietary formats are used to store the geometry of geographical features. These are then linked to attribute information stored in external database tables. Later, an integrated approach was developed that stores the spatial component (the so called spatial extent) together with the attribute data within the same database table. This new approach resulted in the in so-called SDBMSs. Both GIS and SDBMS technologies have, to date, largely relied on 2D data manipulation. The advent of the ISO standard SQL:1999 (ISO/IEC,1999) facilitated the extensibility of relational Database Management System (RDBMS) (and their object-relational versions), through mechanisms that allowed new types and operations to be added. These were developed by adding new Abstract Data Types (ADTs). ADTs have the capability to include methods for storing the different types of geometry and object-relational database schemata to be modelled. Advances regarding support for 3D spatial data in GISs and SDBMSs that could be used for storing point cloud data are presented in the following sections. 2.1 3D Geographic Information Systems
Support for 2D feature types and indexing techniques in systems dealing with spatial data sets has been well documented. However, as a result of the increasing availability of 3D data, current systems aim for the better integration of 3D data types and offer support for features and queries. In the following, ESRI’s geo-database is presented as an example of developments towards 3D support in GISs.
2.1.1 Multipatch The ESRI geo-database models support for 3D objects in a feature class called “multipatch”, which is a geometry type within the ESRI database (ESRI,2008). Multipatch is constructed much like the OpenGL 3D primitive triangle, in that it consists of strips and fans and defines an object’s boundaries through triangular faces. Multipatches can be used in a variety of applications, generally to represent geographic objects similar to cubes and spheres, or real-world features, such as buildings and trees, where the 3D capability is vital for the whole application. Real-life scenarios include, for instance, employing multipatch during a modelling framework for the representation of 3D archaeological intra-site research (Katsianis et al., 2007). Multipatch also finds application in areas, where 3D modelling is an important part of a project management workflow. Bansal and Pal (2008), for instance, describe a system that visualizes and reviews construction production schedules. Their system strives to provide a four-dimensional (4D) project management view that combines 3D models (constructed of multipatches) and a project management schedule in GIS. The representation of features in 3D is often crucial, in order to present a complete picture for decision-making. Ford (2004) presents a system that employs multipatch in a system designed for the oil company Shell. This system integrates both information about the surface, as well as subsurface of multiple petroleum datasets. As multipatch provides the functionality to store these features in a 3D type, it facilitates further analysis for decision making. The following section discusses how SDBMS strive to provide true 3D support for hosting and analyzing spatial data. 2.2 3D Spatial Database Management Systems
Traditional RDBMSs were not designed for the storage of spatial data. Recently, RDBMS have been enhanced with object oriented capabilities and generated the new object-relational DBMS (ORDBMS). Many were further extended to incorporate spatial functionality. The functionality to handle spatial data within the Oracle RDBMS was developed for the first time as an additional modification to Oracle 4 by the Canadian Hydrographic Service. Since Oracle 8i the spatial extension (Oracle Spatial) is integrated with the Oracle database package. Initially only 2D functionality was available (Kothuri et al., 2007). However, in Oracle Spatial 11g, true 3D types and a 3D spatial indexing mechanism are provided. In particular, support for LiDAR data storage has been incorporated. This will be further discussed in sections 2.2.1 and 4. Another popular SDMBS, which also provides 3D support, is PostGIS, which is an initiative to extend the open source RDBMS PostgreSQL with spatial functionalities. PostGIS is an implementation of the Open Geospatial Consortium’s (OGC) SQL specification for simple features (OGC, 2008). PostGIS follows the same approach as Oracle, which is to extend a traditional DBMS with functionalities to manage spatial data. PostGIS is a spatial extender for the open source DBMS PostgreSQL. Seven different geographic data types are implemented in PostGIS: POINT, LINESTRING, POLYGON, MULTIPOINT, MULTISTRING, and MULTIPOLYGON (a collection of different polygon objects), and GEOMETRYCOLLECTION (a collection of elements, such as points, lines and polygons). Each can be 3D, and users can mix

data from different sources, as each record has its own Spatial Reference ID (SRID) (ISO, 2003). Additionally, PostgreSQL offers the opportunity to implement custom data types, as an extension to a native data type. The same mechanism theoretically works within PostGIS. However, little has been published on this issue. Furthermore, PostGIS does not natively support 3D indexing or a point clouds as a data type. Microsoft recently included mechanisms for the hosting and querying of spatial data by integrating spatial tools into their SQL Server 2008 (Microsoft, 2007). However, these efforts currently only support 2D spatial data and will, therefore, not be discussed any further within the scope of this paper. Other vendors have also provided spatial extenders for 2D spatial data to their database. Examples include MySQL Spatial Extensions, IBM’s DB2 Spatial Extender, and IBM’s Informix Spatial DataBlade module. The main advantage of storing attributional and spatial data together in one table, within the SDBMS, is that both data types can be queried in the Structured Query Language (SQL). SQL is commonly used in the area of DBMSs in order to access information about the data. An obvious choice would be to exploit this recently provided extended functionality for LiDAR data management in Oracle Spatial 11g. The next sections provide an overview of how the SDBMs Oracle Spatial 11g and PostGIS represent 3D spatial data. 2.2.1 3D Spatial Data in Oracle Spatial 11g Oracle Spatial for Oracle 11g stores geometric vector data in the SDO_GEOMETRY data type. SDO_GEOMETRY supports the data types Point, Line String, Polygon (Area), Polygon with a hole, and Collection in both 2D and 3D. Those limited to 2D are Compound Line String and Compound Polygon. The exclusively 3D forms are Composite Surface, Simple Solid, Composite Solid, and Collection (Oracle, 2007).
Within Oracle Spatial, the topology model also supports hierarchical features in a bottom-up manner (i.e. a new feature layer can be derived from a previous feature layer constructed from the primitive elements, such as nodes, edges and faces). Oracle facilitates this by setting a feature ID within the SDO_TOPO_GEOMETRY constructor. The first feature layer is called a Level-0 feature. The feature layer derived from it is called a Level-1 feature. In general terms, a Level-n feature is derived from a Level-(n-1) feature.
Raster data is stored in Oracle Spatial 11g in the SDO_GEORASTER data type, which represents an n-dimensional matrix of cells. The SDO_GEORASTER consists of RASTERTYPE, SPATIALEXTENT, RASTERDATATABLE, RASTERID and METADATA. Among other things, the RASTERTYPE specifies the dimension of the data, which currently only supports up to two dimensions.
Within Oracle 11g, the Spatial extender provides a native type for the storage of point cloud data, called SDO_PC. As part of this, metadata associated with the point cloud is stored in a base table, whereas the actual point cloud data is stored in a different table. Individual points within the point cloud are divided into subsets and then loaded into multiple rows, with the points stored as a BLOB data type (Kothuri et al., 2007).
Kothuri et al. propose to load the point cloud data first into a table of the following structure:
Name Type RID VARCHAR2(40) VALUE1 NUMBER VALUE2 NUMBER VALUE3 NUMBER Table 1. Structure Source Table
This table need not be a physical table, but could be an external table interface. The base table contains only one column, which contains the point cloud data type. The actual data is stored in the block table in the following format:
Name Type ptn_id NUMBER point_id NUMBER rid VARCHAR(24) value1 NUMBER value2 NUMBER value3 NUMBER Table 2. Structure Block Table
“pnt_id” in this set up points to a particular block and “point_id” refers to its offset for LiDAR data management. A crucial problem is how quickly a representative 3D set of point cloud data can be loaded into the database. As part of the on-going research in this area, the authors loaded a set of approximately 18 million points (approximately 700 MB) from a LiDAR point cloud. This required 20min13sec to load (computer configuration: Intel Duo CPU at 2.4GHz, 4GB RAM, 64bit windows vista). However, a typical point cloud commonly is 1-3 orders of magnitude larger. Thus, this issue needs further investigation. 2.2.2 3D Spatial Data in PostGIS
The open source community developed PostGIS as an alternative tool for handling spatial data. PostGIS is an implementation of the OGC Simple Features for the SQL specification (OGC, SFS 1.2 2006). PostGIS follows the same approach as Oracle, which is to extend a RDBMS with functionalities to manage spatial data. PostGIS is a spatial extender for the open source RDBMS PostgreSQL.
Seven different geographic data types are implemented in PostGIS: POINT, LINESTRING, POLYGON, MULTIPOINT, MULTISTRING, and MULTIPOLYGON (a collection of different polygon objects), and GEOMETRYCOLLECTION (a collection of elements, such as points, lines and polygons). Each can be 3D, and users can mix data from different sources, as each record has its own Spatial Reference ID (SRID) (Ramsey, 2008). Additionally, PostgreSQL offers the opportunity to implement custom data types, as an extension to a native data type. The same mechanism theoretically works within PostGIS. However, little has been published on this issue. The challenge would be to register the new data type with the geometry_columns table that is used within PostGIS, in order to locate tables that contain geometry types.
3. DIGITAL ELEVATION MODELS
The previous section outlined how LiDAR data could be stored in GISs and SDBMSs, where spatial data can be represented by
feature classes such as ESRI’s multipatch or new types, such as Oracle’s SDO_PC. This section discusses ways of representing, manipulating, and visualizing LiDAR data by means of DEMs.
DEMs are a commonly used data representation, in the area of spatial research. They are particularly popular for visualization of 3D content and can be employed for the surface visualization of LiDAR data. DEMs are digital representations of surfaces. A DEM forms the basis for a DTM or a Digital Surface Model (DSM). A DSM contains both location and elevation information, as well as metadata information, about urban features. A DTM is generated by digitally removing all of the urban features within the DSM, in order to expose the underlying terrain. A DEM is usually a raster model (regular spaced grids) or a TIN. Each cell within the raster data model has a value that corresponds to its elevation.
DEM data sets are commonly collected using remote sensing technologies. In addition to LiDAR, interferometric synthetic aperture radar is common, where two passes of a radar satellite produce a DEM with a resolution of approximately ten meters. DEMs can also be generated by using digital image correlation, where two optical images that are taken from different angles are correlated (Wilson and Gallant, 2000).
3.1 Data Acquisition and DEM generation
Technology such as LiDAR challenges SDBMSs, with respect to the sheer volume of data points referred to collectively as a point cloud. Point clouds raise the question of how to allocate these sets of points to feature types within a database. Additionally, point cloud data are collected by a scanner and then transferred into a format that is proprietary to the scanner manufacturer. Figure 1 presents an area in Dublin city centre, illustrated as raw point clouds.
Figure 1. Point Cloud of a part of Dublin City Centre
The image presents an aerial LiDAR scan of Dublin’s city centre in a resolution of 225 points per square meter and a vertical resolution of 15cm. Conventional aerial LiDAR data provided excellent coverage for roof data. Particularly in urban areas, aerial LiDAR provided only inferior surveying data points for facades. However, an alternative flight pattern has been presented that significantly improves the quality of facades in urban aerial, through which LiDAR scans begin to rival terrestrial data quality at a fraction of the time and cost, thus providing further motivation for 3D data manipulation abilities (Hinks et al., 2007).
The quality of a DEM is significantly determined by the roughness of the terrain, the sampling density that is determined by the data collection method, the resolution of the grid, the choice of interpolation algorithm, the vertical resolution, and the choice of terrain analysis algorithm. Figure 2 presents a DEM of a part of Dublin Ireland’s city centre created from a similar LiDAR point cloud dataset as figure 1.
Another data model for the representation of spatial data, which is also appropriate for LiDAR data, is the TIN. TINs are discussed in the following section.
Figure 2. DEM of Dublin's City Centre
(adapted from Schön et al., 2009)
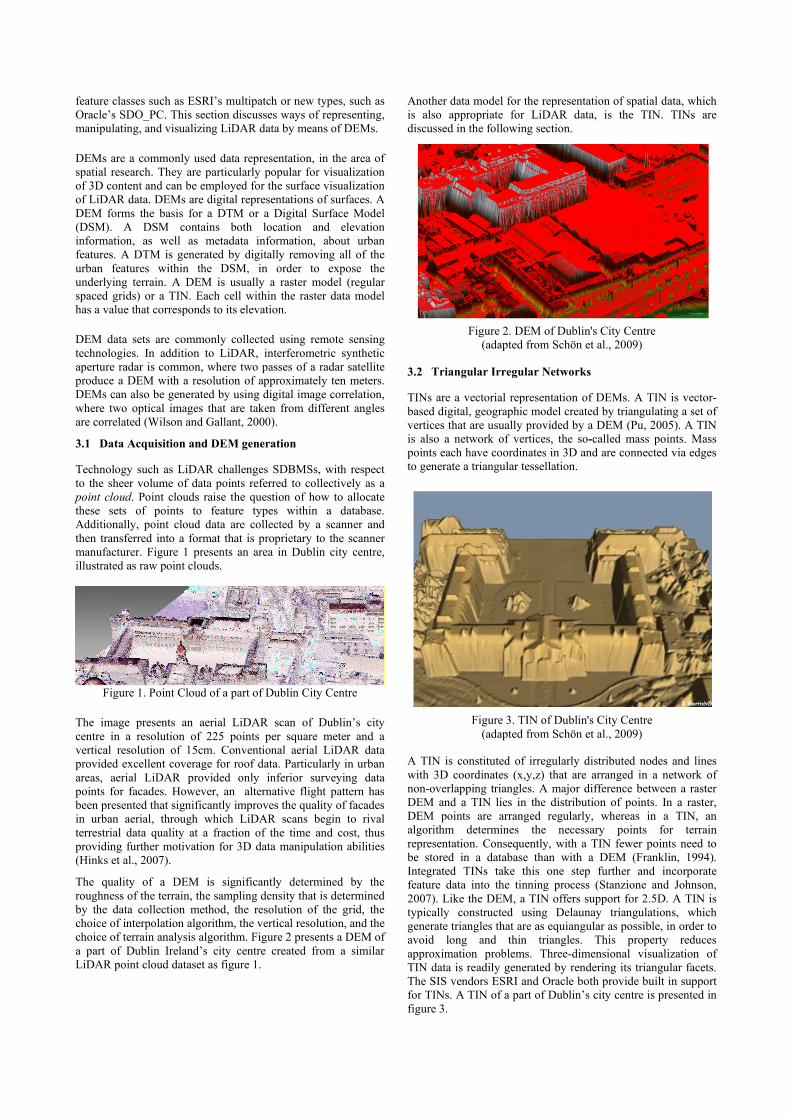
3.2 Triangular Irregular Networks
TINs are a vectorial representation of DEMs. A TIN is vector-based digital, geographic model created by triangulating a set of vertices that are usually provided by a DEM (Pu, 2005). A TIN is also a network of vertices, the so-called mass points. Mass points each have coordinates in 3D and are connected via edges to generate a triangular tessellation.
Figure 3. TIN of Dublin's City Centre
(adapted from Schön et al., 2009)
A TIN is constituted of irregularly distributed nodes and lines with 3D coordinates (x,y,z) that are arranged in a network of non-overlapping triangles. A major difference between a raster DEM and a TIN lies in the distribution of points. In a raster, DEM points are arranged regularly, whereas in a TIN, an algorithm determines the necessary points for terrain representation. Consequently, with a TIN fewer points need to be stored in a database than with a DEM (Franklin, 1994). Integrated TINs take this one step further and incorporate feature data into the tinning process (Stanzione and Johnson, 2007). Like the DEM, a TIN offers support for 2.5D. A TIN is typically constructed using Delaunay triangulations, which generate triangles that are as equiangular as possible, in order to avoid long and thin triangles. This property reduces approximation problems. Three-dimensional visualization of TIN data is readily generated by rendering its triangular facets. The SIS vendors ESRI and Oracle both provide built in support for TINs. A TIN of a part of Dublin’s city centre is presented in figure 3.

TINs only provide 2.5D support and, thus, triangulate surfaces. An interesting approach is to extend this principle into 3D space and, thereby, provide volumetric partitioning of space in Tetrahedral Irregular Networks (TENs) (Penninga and van Oosterom, 2008). In a TEN, the Delaunay triangulation is extended to another point in order to construct a 3D object. Features are represented by their boundaries through a TIN and added one after the other into the TEN. Overlap queries are, thus, supported by the TEN’s internal neighborhood search. The TEN is stored in this approach in a single column database table. Constraints and topologies are derived in views, which allows for relatively easy update functionality. Penninga and van Oosterom (2008) identify that the building of simplexes results in a lot of reference data to vertexes. Building a spatial index on top of this would cause a significant increase in storage utilization. They suggest using the geometry itself, instead, as a unique identifier in the form of a concatenated coordinate triple. Sorting this triple can be seen as a spatial index, while deleting the original table. However, due to very large data set, a secondary R-tree index would be useful and can easily be constructed as the code contains the geometry for which a Minimum Bounding Box (MBB) can be constructed. The principle of extending a 2D R-tree based on MBRs to 3D will be further explained in section 4. This structure is very efficient in terms of updates, as updates have to be applied only to the one column tetrahedron table. All updates performed on the lower levels propagate from this level. The following section discusses approaches of indexing techniques for 3D data, regarding both vendor and research methodologies.
4. INDEXING 3D SPATIAL DATA
Indexing in a database is used to accelerate operations performed on the dataset. A spatial index organizes the space and the objects within this space in a particular manner, so that a spatial query or a spatial operator does not have to traverse the complete table to retrieve specific data.
SDBMS vendors typically offer two types of spatial indexes: quadtrees (Samet, 2006) and R-trees (Guttmann, 1984). Several variations of these index structures have been developed in the literature (Samet, 2006). R-trees are particularly popular with SDBMS vendors: most available indexes are either based on R-trees or use R-trees directly through a dedicated data structure. Alternatively, they map spatial objects into one-dimensional space in order to use a standard index, such as a B-tree (Bayer, 1971). In 2D, an R-tree is constructed by enclosing an object into an MBR (Guttmann, 1984). The 3D extension of a 2D R-tree encloses an object into a MBB.
Another approach to extend 2D spatial indexing to 3D is the development of an octree, which is based on a quadtree structure (Samet, 1989). In a quadtree data structure each node can have up to four child nodes and by doing so decomposes the space into 2D cells. Contrary to the quadtree, each node in an octree can have up to eight child nodes and, thus, divides the space into 3D cubes. However, this approach is not implemented presently within any commercial system.
The following sections present and discuss various approaches for advancing indexing techniques into the 3D space, and discuss both, vendor solutions and research achievements.
4.1 Vendor Approaches for 3D Indexing
The R-tree structure was developed to overcome shortcomings of existing indexing structures at the time (Guttmann, 1984). Cell structures, for instance, are not dynamic, as the cell size has to be decided in advance. K-d trees, on the other hand, are designed particularly for point data (Bentley, 1975) and use paged memory.
Indexing is implemented differently by particular vendors, which might be a function of historical product development, where the current spatial index has evolved out of an existing technology. In the following, current vendor solutions are presented, focusing on SDBMSs that provide 3D support
PostgreSQL supports three indexing structures: B-tree for data that can be sorted along one axis; R-tree for spatial data, which is then broken up into rectangles, sub-rectangles and sub-rectangles; and the Generalized Search Tree (GiST) index, a “template data structure for abstract data types” that offers more robust support for spatial indexing than the PostgreSQL R-tree implementation (Geo-Consortium, 2007). GiST is a template for implementing other indexing methods, such as B-tree and R-tree, and is a balanced tree structure that contains <key, pointer> pairs. The key is a member of a user-defined class that represents an attribute valid for all items that the pointer element can reach. A key in an R-tree like GiST refers to a bounding box. For instance: all items that the pointer reaches are in Ireland. PostGIS consequently offers an R-tree index on top of GiST (Ramsey, 2008).
Figure 4. PostGIS index implementation (Arens et al., 2005)
Compared to a traditional R-tree index, a GiST index is “null save” (i.e. GiST can index columns that contain null values). In addition to this, PostgeSQL allows a page size of 8K; R-trees fail, when trying to index GIS data that exceeds 8K. As a consequence of this, GiST supports “lossiness”, which means that only critical parts of an object (i.e. the bounding boxes) are stored in the index (Ramsey, 2008). MS SQL also works with a limit of 8K for page sizes (they are called blocks in Oracle), whereas Oracle offers a variable page size of 2, 4, 8 or 16K. PostGIS developers plan to soon provide 3D indexing on the basis of this structure.
Oracle Spatial 11g also provides a 3D spatial index on the basis of an R-tree and a partitioning function for logical tables, which includes their spatial indexes. Partitioning delivers significant

performance and manageability advantages. Additionally, the creation of a spatial index can be performed in parallel and spatial queries themselves can be executed in parallel. This is particularly useful for “nearest neighbor”, “within distance”, and “relate” spatial queries (Oracle, 2007).
Oracle Spatial also offers a quadtree based index. As part of the on-going work, a comparison of a LiDAR dataset of 50,000,000 points showed that the 3D R-tree takes approximately 5 times longer in the creation than quadtree [tiling level 8: 10,507sec; R-tree: 51,015sec on a computer with Intel Pentium 4 CPU 3.2 GHz, 2GB DDR2 RAM, 7.200RPM 300 SATA hard drive on Oracle 11g 32 release 11.1.0.6]. However, when performing an update operation, in the form of an insert of 20,000 points, the R-tree performs approximately 2.5 times faster (quadtree: 675sec; R-tree: 267sec; computer configuration as before). In addition to this, the R-tree is approximately 20 times more storage efficient than the quadtree (quadtree: 22,725MB; R-tree: 2,060MB). Table 3 illustrates our results.
Operation Quadtree (tiling level 8) R-tree Insert 10,507 sec 51,015 sec Update 675 sec 267 sec Storage 22,725 MB 2,060 MB Table 3. Performance Comparison Quadtree and R-tree
However, quadtree indexing in Oracle does not support 3D data. Section 4.2, therefore, examines approaches to upgrade a quadtree to 3D. The results presented here are comparable with an evaluation presented in 2002 (Kothuri et al., 2002), who used a 2D R-tree and the quadtree on two 2D GIS data sets (The US Block Group data set contains 2D polygons, and the US Business Area data set contains 2D data points). A similar effect could be found in this evaluation (i.e. the R-tree is slower in the creation of the index but uses less storage space). However, Kothuri et al. found that the speed of insert update operations greatly depends on the kind of geometry inserted, as the quadtree performs significantly better on an insert of small polygons, but significantly worse than the R-tree during an insert operation of large polygons. In the case of simple point cloud updates, the R-tree performed better than the quadtree. R-tree can thus be considered both data and distribution dependent. Although the R-tree appears much more storage efficient than the quadtree, R-trees can also become very resource intensive. For example, in 2D every node split in an R-tree of N number of nodes might result in 2N – (N+1) = N – 1 empty entries (Huang et al., 2001). Huang et al. (2001) conducted experiments that showed that an R-tree only achieves around 70% storage utilization and proposed a new approach, called the compact R-tree. However, to-date there have been no studies evaluating this approach for the 3D case. 4.2 Research Approaches for 3D Indexing
The previous section presented vendor specific indexing solutions for LiDAR data. The amount of vendors that support true 3D data has so far been limited. Consequently, efforts towards amending spatial indexing for 3D data in the research community are of high interest. This section explores recent advancements regarding R-tree, with a view to establishing a suitable approach for indexing vast point cloud data. None of the approaches described in this section are currently available commercially.
One approach is the called V-reactive tree (Li et al., 2001), which is based on combining R-trees (van Oosterom, 1990) with an importance value. The V-reactive tree is a 4D, R-tree structure optimized for 3D visualization. To date, the structure has not been tested within the context of urban planning, nor has it been tested on large-scale, point cloud data sets. Some interesting work has, however been done on extending quadtree based indexes to work with the TIN structure (De Floriani et al., 2008). They argue that their mechanism could be generalized to support TENs on an octree basis, in order to support true 3D functionality. A hybrid approach for the indexing of LiDAR data is proposed in (Hua et al., 2008) and is specialized for point cloud visualization. The basic principle of this approach is to combine an octree with a k-d tree, thereby building a local k-d tree at each octree level node. Although interesting, this approach has so far only been evaluated for the case of visualization speed of point cloud data. For a point cloud of around 100,000 points a rendering speed of 30 seconds was achieved (Hua et al., 2008). Contrary to the approaches presented so far, Boubekeur et al. (2006) emphasize the fact that structures based on the hierarchical space division, such as quadtree and k-d tree, are critical for surface representations, as they are purely volume based. Therefore, they suggest a combined approach, called the Volume-Surface tree (VS tree), which combines a global 3D decomposition of space on a coarse subdivision level and a 2D decomposition of space near the surface, near the finer subdivision levels. The VS-tree, therefore, combines “an octree and a set of quadtrees to describe a discrete 3D surface”. This is achieved by switching back to quadtree during the recursive split performed in an octree, as soon as a certain “height field” has been reached. This method however, has not yet been tested on large data sets or ones with great elevational change. An interesting approach is to index LiDAR data with a Hilbert space filling curve, which is a recursively performed space partitioning process (Wang and Shan, 2005). In this approach, the space is divided into cells, according to a pre-specified, maximum number of points per cell. If the number of points per cell exceeds this predefined limit, the cell is split into a sub-cell. This process is repeated until no cell exceeds the predefined threshold. After this process, the points are stored in a database, with each cell being represented by one record, as a binary blob type. Wang and Shan (2005) employed a MySQL database and a Microsoft Access database for their evaluation. Their biggest data set consisted of approximately 1,4 million LiDAR points from a terrestrial scan of a bridge structure. Encoding was done in 47 minutes, and an average window query took 80 seconds. The Hilbert space filling curve appears to be a promising approach. However, no further evaluation on current technology has been conducted to date, and it has not been implemented in a vendor system. Additionally, this approach is only suitable for accessing raw LiDAR data, while LiDAR data is often represented in the form of a TIN for different analysis and manipulation operations as outlined in section 3. In such cases the approach presented by Wang and Shan (2005) would not be directly applicable.
5. DISCUSSION
The increased availability of highly accurate LiDAR data has sparked the desire to harness this data in a broad range of applications that go beyond mere visualization and reach into supporting true engineering capabilities. Such applications

include urban planning, for instance for catastrophe prevention and evaluation (van Oosterom et al., 2008). However, from ongoing evaluations of current commercial systems it has emerged that before the advantages of LiDAR data can be fully exploited, support for the hosting and querying of such data has to be significantly improved by SIS vendors through the improvement of 3D functionalities. Crucial for the evaluation of data are 3D indexing capabilities. To date, commercially available indexing techniques consist of quadtree indexing in 2D and R-tree indexing (2D and 3D). R-tree indexes are based on MBR, which make them difficult to apply on point data, as the definition of an MBR on a set of data points is rather arbitrary. Additionally, an R-tree approach is implemented differently by individual vendors. Section 4.1.1 presented an R-tree solution based on the PostgreSQL GIST index. Oracle Spatial on the other hand, emulates the R-tree index through the use of SQL-level tables and recursive queries, while the Informix Spatial DataBlade module has low-level code libraries incorporated into the system kernel (Francica, 2007). These different implementation strategies that vendors adopt have implications on the performance of the indexing technique itself and consequently impair accurate comparison between systems. Research efforts have so far produced a variety of indexing techniques for 3D data, such as hybrid approaches and Hilbert curves and octrees. A more promising approach that would better suit the indexing of 3D point data is the octree, a 3D implementation of quadtree. However, none of these approaches has yet been implemented within a commercial system. Before any real progress for employing LiDAR data sets in an engineering context can be made, it is necessary that 3D approaches for spatial indexing are implemented in vendor systems. This should be the main focus for future developments in the area of 3D capabilities in SISs.
6. CONCLUSION
This paper illustrates the need for 3D data sets to offer stronger and more thorough capabilities for the support of true engineering functionalities with regard to analysis and manipulation within urban modeling tools. Employing, for instance LiDAR data, within the context of urban planning opens a wide range of possibilities for meaningful applications, such as studying the effect of new features within an urban environment, while considering its true 3D effect on the surrounding area. A clear trend towards supporting these new 3D data sets can be identified, as more SIS vendors provide 3D functionalities in the form of new volumetric feature types that go beyond 2.5D technology, such as TENs. Despite the current lack for thorough support for 3D functionalities, much on-going research in this area aims to overcome the current difficulties, and it will be interesting to see, which techniques will be successful in being adopted by SIS vendors in the future.
7. REFERENCES
References from Journals: Bansal, V.K., Pal, M., 2008. Construction schedule review in GIS with a navigable 3D animation of project activities. International Journal of Project Management.
Boubekeur, T., Heidrich, W., Granier, X., Schlick, C., 2006. Volumne-Surface Trees, Eurographics, vol. 25 (3). Guttmann, A., 1984. R-tree: A dynamic index structure for spatial searching. SIGMOD Record. ACM Press, vol. 14 (2), pp. 47 – 57. Katsianis, M., Tsipidis, S., Kotsakis, K., Kousoulakou, A., 2007. A 3D digital workflow for archaeological intra-site research using GIS. Journal of Archaeological science, vol. 35, pp.655 - 667. Penninga, F., van Oosterom, P.J.M., 2008. A simplicial complex-based DBMS approach to 3D topographic data modelling. International Journal of Geographical Information Science, vol. 22 (7), pp. 751 - 779, Taylor & Francis. Schön, B., Laefer, D.F., Morrish, S.W., Bertolotto, M., 2009. Three-dimensional Spatial Information Systems: State of the Art Review. Recent Patents on Computer Science, vol. 2, pp. 21 – 31. Shiode, N., 2001. 3D urban models: recent developments in the digital modeling of urban environments in three dimensions. GeoJournal , vol. 53 (3), pp. 263-269. References from Conference Proceedings: Bayer, R., 1971. Binary B-Trees for Virtual Memory. ACM SIGFIDET Workshop, pp. 219 – 235. San Diego, California, US. De Floriani, L., Facinoli, M., Magillo, P., Dimitri, D., 2008. A Hierarchical Spatial Index for Triangulated Surfaces. International Conference on Computer Graphics Theory and Applications, pp. 86 – 91. Ford, A., 2004. The visualisation of integrated 3D petroleum datasets in ArcGIS. 24th ESRI User Conference, pp. 1 – 11. Hinks, T., Carr, H., Laefer, D., 2007. Impediments to vertical data capture from Aerial LiDAR for Three-dimensional Building Extraction. Improving Infrastructure Worldwide: Bringing People Closer. IABSE, 8 pp. Kothuri, R.K.V., Ravada, S., Abugov, D., 2002. Quadtree and R-tree Indexes in Oracle Spatial: A Comparison using GIS Data. ACM SIGMOD, pp. 546 - 557. Li, J., Jing, N., Sun, M., 2001. Spatial Database Techniques Oriented to Visualization in 3D GIS. In Proceedings of 2nd International Symposium on Digital Earth, 24-28.06.2001, Fredericton, New Brunswick, Canada. Liu, H., Huang, Z., Zhan, Q., Lin, P., 2008. A Database Approach to Very Large LiDAR Data Management. In ISPRS 2008, pp. 463 – 468. Stanzione, T., Johnson, K., 2007. GIS enabled Modeling and Simulation (GEMS). ESRI UC 2007, ESRI. Wang, J., Shan, J., 2005. LiDAR Data Management with 3-D Hilvert Space-Filling Curve. Annual ASPRS Conference, Baltymore, USA. References from Books: Abdul-Rahman, A., Pilouk, M., 2008. Spatial Data Modeling for 3D GIS. Springer Verlag.

Kothuri, R., Godfrind, A., Beinat, E. , 2007. Pro Oracle Spatial for Oracle Database 11g. Apress. Samet, H., 2006. Foundations of Multi-Dimensional and Metric Data Structures, chapter 1.4. Morgan-Kaufmann. vanOosterom, P. (ed.), Zlatanova, S. (ed.), Penninga, F. (ed.), Fendel, E. (ed.), 2007. Advances in 3D Geoinformation Systems. Lecture Notes in Geoinformation and Cartography. Springer Verlag. Wilson, J., Gallant, J., 2000. Terrain Analysis: Principles and Applications. John Wiley and Sons. References from Other Literature: Geo-Consortium, 2007. Introduction to spatial data management with PostGIS. Presentation slides by the Consulting Centre Geographic Information Systems. Franklin, W., 1994. Triangular irregular network to approximate digital terrain. Section 2.3. Research Interests. Technical report, Electrical, Computer, and Systems Engineering Dept., Rensselaer Polytechnic Institute, Troy, NY, USA. ISO/IEC, 1999. SQL Framework 9075, International Organization for Standardization. ISO, 2003. Geographic information - spatial schema. ISO 19107:2003. International Organization for Standardization. Microsoft, 2007. Microsoft SQL Server 2008: Product Overview. White Paper. Microsoft. Van Oosterom, P.J.M., 1990. Reactive Data Structures for Geographic Information Systems. PhD thesis, Department of Computer Science, Leiden University, The Netherlands. Oracle, July 2007. Oracle Spatial 11g: Advanced Spatial Data Management for Enterprise Applications. Pu, S., 2005. Managing Freedom Curves and Surfaces in a Spatial DBMS. Master Thesis. Delft University of Technology, The Netherlands. References from websites: Bruening M, Zlatanova S., 2004. 3D Geo-DBMS. Directions Magazine. Retrieved January 2009, from http://www.directionsmag.com/article.php?article_id=694 ESRI, 2008. ArcGIS Desktop Help 9.2. Retrieved September 18, 2008, from http://webhelp.esri.com/arcgisdesktop/9.2/index.cfm?TopicName=welcome Francica, J., 2007. Informix Spatial Data Technology: update and Positioning. Directions Magazine. Retrieved January 2009, from http://www.directionsmag.com/article.php?article_id=2520&trv=1 OGC, 2008. OGC Abstract Specification. (OGC) Retrieved September 15, 2008, from OpenGIS Project Document Number 01-101: http://www.opengeospatial.org/standards/as Ramsey, P., 2008. PostGIS Manual. (Refractions) Retrieved September 15, 2008, from http://postgis.refractions.net/documentation/
8. ACKNOWLEDGEMENTS
This work was generously support by Ireland’s National Digital Research Centre’s grant EoI/0701/008 “Hosting and analysis capabilities for 3D LiDAR point cloud data”. Data for some of this work was provided by Science Foundation Ireland’s sponsored grant 05/PICA/I830 GUILD: Generating Urban Infrastructures from LIDAR Data.