Stora Enso Full year financial results
39
Stora Enso Full year financial results January–December 2020 Q4
Transcript of Stora Enso Full year financial results
Stora Enso Full year financial resultsJanuary–December 2020
Q4
Steady performance as a result of our own actionsDividend proposal EUR 0.30 per share
Q4/2020 (compared with Q4/2019)• Sales decreased by 10.7% to EUR 2 154 (2 411)
million, due to structural changes, lower prices andvolumes. Sales excluding Paper decreased by 2.5%.
• Operational EBIT was EUR 118 (124) million, lowersales were mitigated by efficient cost management.Operational EBIT excluding Paper increased to EUR122 (80) million.
• Operational EBIT margin increased to 5.5% (5.1%).Excluding Paper, the operational EBIT margin was7.3% (4.6%).
• Operating profit (IFRS) decreased to EUR 289 (680)million, mainly due to the change in biological assetvaluation.
• EPS was EUR 0.30 (0.66) and EPS excl. fairvaluations (FV) was EUR 0.09 (0.04).
• Items affecting comparability (IAC) amounted to EUR-45 (-32) million, mainly related to the closure of theVirdia operations.
• The value of forest assets, including leased land and Stora Enso's share of Tornator, increased by EUR 1 960 million to EUR 7 314 (5 175) million.
• Cash flow from operations amounted to EUR436 (725) million. Cash flow after investing activitieswas EUR 223 (518) million. Cash flow in 2019 waspositively affected by an extraordinary dividend andcapital repayment of EUR 223 million from BergvikSkog.
• The net debt to operational EBITDA ratio at 2.3 (2.0)was above the target level of less than 2.0. Net debtwas reduced by nearly EUR 300 million.
• Strong liquidity at EUR 2.5 billion, including cash andcommitted credit facilities.
• Operational ROCE excluding Forest division was4.6% (5.0%), below the long-term target of more than13%.
2020 (compared with 2019)• Sales were EUR 8 553 (10 055) million, mainly due to
lower volumes and prices, and structural changes.• Operational EBIT decreased to EUR 650 (1 003)
million, due to lower sales. Operational EBITexcluding Paper was EUR 688 (790) million.
Dividend proposal• The Board of Directors proposes a dividend of EUR
0.30 per share. In their proposal, the Boardconsidered the Company's solvency and liquidity.
• Stora Enso's policy is to distribute 50% of EPS excl.FV over the cycle. EPS excl. FV in 2020 was EUR0.45.
Profit protection programmeThe EUR 400 million profit protection programme is proceeding well with the target of delivering these savings by the end of 2021.
Main events • The conversion of Oulu Mill from coated fine paper to
kraftliner is finalised and the mill is in a start-upphase.
• A feasibility study is underway regarding a possibleexpansion of the pulp and board production atSkoghall Mill in Sweden.
• The wood handling capacity at the Imatra Mills inFinland is being modernised with a EUR 80 millioninvestment.
• To support the growth of its lignin business, StoraEnso is investing EUR 14 million in a granulation andpacking plant.
• Stora Enso announced the divestment ofapproximately 5 200 hectares of forest assets insouthern Sweden for approximately EUR 90 million.The transaction was closed in January 2021.
• The US-based Virdia operations will be permanentlyclosed during 2021.
• Some of the long-term financial targets were updatedto support the focus on growth and value creation.
Preventive Covid-19 actions The health and safety of Stora Enso’s employees is a key priority during the pandemic. Thanks to Stora Enso's proactive approach during Covid-19 thus far, there has been minimal impact on the Group's ability to serve customers and run operations.In the end of November, a number of Covid-19 infections were detected among contractors working on the Oulu Mill conversion project. Following the infections, Stora Enso further enhanced guidelines to prevent coronavirus infections, tested the entire personnel including contractors, working at the mill and continued the testing as required. The situation is currently under control.
Outlook Stora Enso resumes an annual outlook even though the uncertainties due to the ongoing pandemic in the global economy are expected to remain in 2021. Provided that the vaccination programmes progress as planned and the virus is contained, there are expectations of economic recovery. Until then, demand for our products remains mixed.Operational EBIT in 2021 is expected to be higher than the 2020 operational EBIT.Stora Enso will conclude its EUR 400 million profit protection programme by the end of 2021. The expected fixed and variable cost savings for the year are approximately EUR 80 million. The Group will continue to focus on customer service and cash flow generation in 2021.
Results summary
Stora Enso Q4/2020 and full year 2020 results 1 (38)

The Oulu Mill conversion is estimated to have approximately EUR 20 million negative impact on the Packaging Materials Q1/2021 operational EBIT. The total impact on operational EBIT is forecasted to be approximately EUR 45-55 million negative for the full year
2021. The mill is planned to reach designed capacity by the end of Q2/2021, commercialisation of product portfolio by the end of 2021 and operational EBITDA break-even in Q1/2022.
Total maintenance impact
EUR million Q4/2019 Q1/2020 Q2/2020 Q3/2020 Q4/2020 Q1/20211
Total maintenance impact 167 98 110 159 161 1051 Estimated
Net debt to operational EBITDA Operational ROCE excl. Forest division
Net debt, EUR millionNet debt to operational EBITDATarget <2.0
Q1/19 Q2/19 Q3/19 Q4/19 Q1/20 Q2/20 Q3/20 Q4/200
500
1 000
1 500
2 000
2 500
3 000
3 500
4 000
0.0
0.5
1.0
1.5
2.0
2.5
3.0
3.5
4.0
Operational ROCE Target >13%
Q1/19 Q2/19 Q3/19 Q4/19 Q1/20 Q2/20 Q3/20 Q4/200%
2%
4%
6%
8%
10%
12%
14%
16%
18%
Key figures
Stora Enso Q4/2020 and full year 2020 results 2 (38)

Key figures
EUR million Q4/20 Q4/19
Change %Q4/20-Q4/19 Q3/20
Change %Q4/20-Q3/20 2020 2019
Change %2020–2019
Sales 2 154 2 411 -10.7 % 2 079 3.6 % 8 553 10 055 -14.9 %Operational EBITDA 274 277 -1.3 % 330 -17.0 % 1 270 1 614 -21.3 %Operational EBITDA margin 12.7 % 11.5 % 15.9 % 14.9 % 16.0 %Operational EBIT 118 124 -5.1 % 175 -32.8 % 650 1 003 -35.2 %Operational EBIT margin 5.5 % 5.1 % 8.4 % 7.6 % 10.0 %Operating profit (IFRS) 289 680 -57.5 % 145 99.1 % 922 1 305 -29.3 %Profit before tax excl. IAC and FV 88 90 -2.0 % 144 -39.1 % 501 835 -40.0 %Profit before tax (IFRS) 260 646 -59.8 % 115 126.3 % 773 1 137 -32.0 %Net profit for the period (IFRS) 237 519 -54.3 % 86 175.0 % 617 856 -27.9 %Cash flow from operations 436 725 -39.8 % 399 9.5 % 1 344 1 991 -32.5 %Cash flow after investing activities 223 518 -57.0 % 250 -11.0 % 680 1 386 -50.9 %Capital expenditure 303 302 0.2 % 156 93.4 % 687 656 4.8 %Capital expenditure excluding investments in biological assets 287 276 4.0 % 143 100.1 % 628 579 8.5 %Depreciation and impairment charges excl. IAC 136 136 0.5 % 135 1.2 % 544 533 2.2 %Net interest-bearing liabilities 2 921 3 209 -9.0 % 3 008 -2.9 % 2 921 3 209 -9.0 %Operational return on capital employed (ROCE), % 4.3% 4.7% 6.7% 5.8% 10.3% Operational ROCE excl. Forest division 4.6% 5.0% 8.0% 7.0% 12.8% Earnings per share (EPS) excl. FV3, EUR 0.09 0.04 127.5 % 0.12 -22.2 % 0.45 0.61 -26.7 %EPS (basic), EUR 0.30 0.66 -53.9 % 0.11 173.9 % 0.79 1.12 -28.9 %Return on equity (ROE) 11.9% 29.1% 4.8% 7.6% 12.1% Net debt/equity ratio 0.33 0.43 0.42 0.33 0.43 Net debt to last 12 months’ operational EBITDA ratio 2.3 2.0 2.4 2.3 2.0 Fixed costs to sales, % 29.0 % 27.5 % 26.8 % 26.7 % 24.3 %Equity per share, EUR 11.17 9.42 18.6 % 9.18 21.6 % 11.17 9.42 18.6 %Average number of employees (FTE) 23 406 25 403 -7.9 % 24 428 -4.2 % 24 455 26 096 -6.3 %TRI rate12 6.7 6.7 0.0 % 6.3 3.2 % 6.1 7.0 -12.9 %
Comparative 2019 figures have been restated as described in our release from 19 March 2020.Operational key figures, items affecting comparability and other non-IFRS measures: The list of Stora Enso’s non-IFRS measures and the calculation of the key figures are presented at the end of this report. See also the chapter Non-IFRS measures at the beginning of the Financials section.IAC = Items affecting comparability, FV = Fair valuations and non-operational itemsTRI (Total recordable incidents) rate = number of incidents per one million hours worked.1 For own employees, including employees of the joint operations Veracel and Montes del Plata2 Historical figures for TRI rate recalculated due to additional data received after the previous Interim Reports.3 Earnings per share (EPS) excl. FV was added to the list of non-IFRS measures during Q4/2020 replacing the key figure of EPS excl. IAC and FV. Comparatives are recalculated.
Production and external deliveries
Q4/20 Q4/19
Change %Q4/20-Q4/19 Q3/20
Change %Q4/20-Q3/20 2020 2019
Change %2020–2019
Consumer board deliveries, 1 000 tonnes 646 687 -5.9 % 686 -5.7 % 2 742 2 811 -2.4 %Consumer board production, 1 000 tonnes 643 686 -6.2 % 684 -6.0 % 2 759 2 775 -0.6 %Containerboard deliveries, 1 000 tonnes 260 238 9.3 % 239 8.7 % 970 943 2.9 %Containerboard production, 1 000 tonnes 344 330 4.3 % 318 8.2 % 1 304 1 303 0.1 %Corrugated packaging European deliveries, million m2 243 236 2.9 % 225 7.9 % 902 925 -2.5 %Corrugated packaging European production, million m2 270 264 2.2 % 249 8.2 % 1 004 1 033 -2.8 %Market pulp deliveries, 1 000 tonnes 689 662 4.1 % 671 2.8 % 2 443 2 362 3.4 %Wood products deliveries, 1 000 m3 1 244 1 194 4.2 % 1 149 8.3 % 4 692 4 918 -4.6 %Wood deliveries, 1 000 m3 3 196 2 919 9.5 % 2 418 32.2 % 11 469 11 717 -2.1 %Paper deliveries, 1 000 tonnes 792 1 029 -23.1 % 731 8.3 % 3 106 4 130 -24.8 %Paper production, 1 000 tonnes 731 982 -25.5 % 723 1.2 % 3 034 4 065 -25.4 %
Key figures
Stora Enso Q4/2020 and full year 2020 results 3 (38)
CEO commentLooking back at 2020, my first year as CEO for Stora Enso, I can undoubtedly say that it has been extremely eventful. The year has been marked by the global pandemic and slowdown of the global economy, but also by geopolitical unrest, Brexit and – for Stora Enso during the first quarter – the strikes in Finland. So, concluding with the fourth quarter, in an environment that is still volatile, I am very satisfied that we deliver steady results in line with Q4/2019. If we exclude Paper, operational EBIT increased to EUR 122 (80) million. Sequentially quarter on quarter, we can see improved sales, an indication that the markets are moving in the right direction. We are delivering on our EUR 400 million savings promise and we have further reduced working capital to record low levels, enhancing our cash flow. Our own actions have made all the difference.The main parts of our businesses have performed well during a quarter that is maintenance heavy. We see increased activity on the market and continued good development in Packaging Materials and Packaging Solutions. Results for the Forest division are strong, and Wood Products delivered the second best Q4 results ever. For Biomaterials, there are positive signs of price recovery, as the supply and demand situation is more balanced, and China continues to recover. The accelerated structural decline persists in the paper business, leading to overcapacity and severe price pressure. Despite this, Paper delivered good cash flow.The conversion of Oulu Mill is in a start-up phase. Its new products will strengthen our offering in the growing packaging business. This is a major step forward in our transformation. To further establish Stora Enso as a provider of high-quality, renewable packaging materials, we have also started a feasibility study for expanding pulp and board capacity at our production site in Skoghall. Moreover, we are investing EUR 80 million to modernise the wood handling capacity at Imatra Mills, where we are one of the world’s largest producers of liquid packaging board, serving customers globally. These investments strengthen our capabilities for premium solutions for food, beverage and luxury packaging. And they are in line with our strategy: to accelerate growth in the packaging business, allowing us to meet the increasing demand for sustainable packaging among consumers.Lignin is one of our key innovation areas for delivering growth in new applications, such as energy storage, binders and carbon fiber. As the largest producer in the world, we are investing EUR 14 million to build a granulation and packing plant for lignin. In addition to reducing both packaging and transportation costs, granulated lignin is easier to handle for our customers.The real value of our forests, the foundation for our renewable raw material, has also been brought to light. After the new market based valuation method for our Nordic forest assets, the total value of our forest assets is over EUR 7 billion, an increase of almost EUR 2 billion. As part of our active forest management, we divested over 5 000 hectares of non-core forest for approximately EUR 90 million. This is a clear proof point of the value that the forest represents.
Following the green bonds issued in 2019 and 2020 in the Swedish market, I am also pleased that we have now issued our first euro green bond, and the interest from the market was big. This will allow us to continue strengthening our position as the leading renewable materials company and fits our sustainable finance strategy well. On the note of sustainability and enabling a circular economy, I’d like to mention that we are joining forces with our customer Tetra Pak to explore the possibility of building a new recycling line in Poland. This would significantly increase the recycling of used beverage cartons in Europe and support in making our customers’ brands circular. Lastly, in 2020 our Board of Directors changed the 2019 dividend proposal due to business impact uncertainties related to Covid-19. In Q4, the Board decided on a second dividend installment. It was paid in December to our valued shareholders, bringing the total 2019 dividend to EUR 0.30 per share. For the financial year 2020, the Board of Directors proposes to the Annual General Meeting a dividend of 0.30 euros per share. This is aligned with our new policy to pay half of the EPS excluding fair valuations as dividend over the cycle.To summarise, I’m proud of our achievements and how our people have not only adjusted, but also stepped up to meet the challenges. We have renewed our strategy and long-term financial targets, shaping our business for accelerated growth and value. Now I am excited to continue executing our chosen direction with the whole Stora Enso team, our customers and partners. The renewable future grows in the forest.
Annica Bresky, President and CEO
Dividend proposal per share
0.30Operational EBIT
5.5%Operational ROCE excluding Forest division
4.6%(Target >13%)
CEO comment
Stora Enso Q4/2020 and full year 2020 results 4 (38)

Reconciliation of operational profitability
EUR million Q4/20 Q4/19
Change %Q4/20-Q4/19 Q3/20
Change %Q4/20-Q3/20 2020 2019
Change %2020–2019
Operational EBITDA1 274 277 -1.3 % 330 -17.0 % 1 270 1 614 -21.3 %Depreciation and silviculture costs of EAI -3 -2 -34.4 % -6 49.7 % -15 -16 8.0 %Silviculture costs2 -17 -15 -9.0 % -14 -19.3 % -61 -62 1.5 %Depreciation and impairment excl. IAC -136 -136 -0.5 % -135 -1.2 % -544 -533 -2.2 %Operational EBIT 118 124 -5.1 % 175 -32.8 % 650 1 003 -35.2 %Fair valuations and non-operational items3 217 588 -63.1 -4 n/m 362 494 -26.9 %Items affecting comparability (IAC) -45 -32 -43.8 % -25 -79.7 % -90 -192 53.4 %Operating profit (IFRS) 289 680 -57.5 % 145 99.1 % 922 1 305 -29.3 %
1 Restated Operational EBITDA includes operational fair value changes of biological assets of EUR 50 million for 2019. In addition, the Nordic forests silviculture costs of EUR 21 million for 2019 have been presented under Operational EBITDA.
2 Including damages to forests3 Fair valuations and non-operational items include CO2 emission rights, non-operational fair valuation changes of biological assets, adjustments for differences
between fair value and acquisition cost of forest assets upon disposal and the Group’s share of income tax and net financial items of EAI. From 1 January 2020 onwards, the changes in the fair valuation of biological assets are categorized in non-operational and operational fair value changes. Non-operational fair value changes of biological assets reflect changes made to valuation assumptions and parameters, usually during the annual valuation process. Operational fair value changes of biological assets are included in Operational EBITDA and contain all other fair value changes, mainly due to inflation and differences in actual harvesting levels compared to the harvesting plan. The previous periods have been restated.
Fourth quarter 2020 results (compared with Q4/2019)Breakdown of change in sales Q4/2019 to Q4/2020Sales Q4/2019, EUR million 2 411 Price and mix -3 %Currency 0 %Volume -2 %Other sales1 -2 %Total before structural changes -8 %Structural changes2 -3 %Total -11 %Sales Q4/2020, EUR million 2 154
1 Energy, paper for recycling, by-products etc. 2 Asset closures, major investments, divestments and acquisitions
Group sales decreased by 11%, or EUR 257 million from the previous year to EUR 2 154 (2 411) million. Group sales excluding the Paper division decreased by 2%. Sales were negatively affected by mix and lower prices especially in the Paper and Forest divisions. Lower by-product sales decreased the top line further. Deliveries were clearly lower in Paper, as the global overcapacity and Covid-19 pandemic reduced demand. The divestment and closures of paper production at Oulu Mill in Finland, the Kitee and Pfarrkirchen sawmills in Finland and Germany, as well as a small packaging paper machine closure at Imatra Mills in Finland reduced sales.
Operational EBIT decreased by 5%, or EUR 6 million, from the previous year to EUR 118 (124) million. The operational EBIT margin increased to 5.5% (5.1%).
Lower sales prices and mix decreased operational EBIT by EUR 104 million, especially due to lower paper and wood prices. Total volume impact decreased operational EBIT by EUR 66 million, mainly due to the accelerated structural decline in paper demand. Production was curtailed due to the Covid-19 pandemic.
Variable costs decreased by EUR 115 million, mainly due to lower fiber, transportation, and chemicals costs, supported by the profit protection programme actions. Fixed costs decreased by EUR 24 million, mainly due to the profit protection programme actions and Covid-19 related savings. Net foreign exchange rates had a positive impact of EUR 20 million on operational EBIT. The operational result from equity accounted investments improved, due to the better profitability of Tornator. Depreciation was slightly higher.
The average number of employees in the fourth quarter of 2020 was approximately 23 400 (25 400).
Fair valuations and non-operational items had a positive net impact on the operating profit of EUR 217 (positive 588) million. The positive impact came mainly from the forest valuation increases.
Earnings per share decreased by 53.9% to EUR 0.30 (0.66), and earnings per share excluding fair valuations increased by 127.5% to EUR 0.09 (0.04).
The Group recorded items affecting comparability (IACs) with a negative impact of EUR 45 (negative 32) million on its operating profit. The related tax impact was positive EUR 12 (positive 5) million. The IACs relate mainly to asset impairments in the US-
Results
Stora Enso Q4/2020 and full year 2020 results 5 (38)
based Virdia operations in the Biomaterials division. Asset disposal gains recognised in the Packaging Materials division had a positive IAC impact.
Net financial expenses of EUR 30 million were EUR 4 million lower than a year ago. Net interest expenses of EUR 33 million decreased by EUR 4 million, mainly as a result of the lower average interest expense rate on borrowings. Other net financial expenses were EUR 4 (5) million. The net foreign exchange rate impact in respect of cash equivalents, interest-bearing assets and liabilities and related foreign-currency hedges amounted to a gain of EUR 7 (gain of EUR 8) million, mainly due to a revaluation of foreign currency net debt in subsidiaries and joint operations.
Breakdown of change in capital employed 31 December 2019 to 31 December 2020
EUR million Capital employed31 December 2019 10 632 Capital expenditure excluding investments in biological assets less depreciation 60 Investments in biological assets less depletion of capitalised silviculture costs 19 Impairments and reversal of impairments -57 Fair valuation of forest assets 1 973 Unlisted securities (mainly PVO) -125 Equity accounted investments -22 Net liabilities in defined benefit plans -11 Operative working capital and other interest-free items, net -172 Net tax liabilities -411 Translation difference -171 Other changes -1 31 December 2020 11 714
The operational return on capital employed (ROCE) in the fourth quarter of 2020 was 4.3% (4.7%). Operational ROCE excluding the Forest division was 4.6%.
Fourth quarter 2020 results (compared with Q3/2020)Group sales increased by 4%, or EUR 75 million, to EUR 2 154 (2 079) million, mainly due to higher Forest, Wood Products and Packaging Solutions sales. Excluding Paper division, sales also increased by 4%. Operational EBIT decreased by EUR 57 million to EUR 118 (175) million. Operational EBIT excluding Paper was EUR 122 (191) million. The sales price and mix was EUR 29 million lower, mainly due to paper. The total volume impact decreased operational EBIT by EUR 1 million, as higher volumes in Forest, Wood Products and Packaging Solutions offset lower volumes in Consumer board and Biomaterials, negatively impacted by annual maintenance shutdowns. Lower variable costs improved operational EBIT by EUR 30 million, but fixed costs increased by EUR 53 million, mainly due to the Oulu Mill conversion costs and higher maintenance activity. The impact of net foreign exchange rates decreased operational EBIT by EUR 9 million. Depreciations, the operational result from equity accounted investments and the impact from divested and closed units increased operational EBIT by EUR 4 million.
Full year results 2020 (compared with full year 2019)Breakdown of change in sales 2019 to 2020Sales 2019, million 10 055 Price and mix -5 %Currency 0 %Volume -6 %Other sales1 -1 %Total before structural changes -13 %Structural changes2 -2 %Total -15 %Sales 2020, EUR million 8 553
1 Energy, paper for recycling, by-products etc. 2 Asset closures, major investments, divestments and acquisitions
Sales, at EUR 8 553 (10 055) million, were 14.9% lower than a year earlier. Deliveries reduced in all divisions and the largest drop was in paper volumes. Sales prices were lower in all divisions, with the biggest negative price impacts coming from pulp and paper. The impact of the foreign exchange rate movements on sales was EUR 19 million positive. Structural changes reduced sales by EUR 226 million, the biggest ones being the Oulu Mill conversion in Finland, the divestment of the Dawang paper mill in China in October 2019, the closure of the paper machine 6 at Imatra Mills in Finland in December 2019, the divestment of the Pfarrkirchen Mill in Austria in during the first quarter of 2020, and the closure of the Kitee sawmill in Finland during the second quarter of 2020. Sales excluding the paper business decreased by 8.7%.
Results
Stora Enso Q4/2020 and full year 2020 results 6 (38)

Operational EBIT, at EUR 650 (1 003) million, decreased by 35.2% or EUR 353 million and represents a margin of 7.6% (10.0%). Operational EBIT decreased due to lower sales prices and lower volumes in all divisions. The biggest negative impact came from the lower paper volumes and prices and the significantly lower pulp prices.Variable costs were EUR 340 million lower, mainly fiber costs including wood, pulp and recycled paper. Fixed costs decreased by EUR 117 million due to Covid-19 and profit protection programme actions. The net foreign exchange impact increased operational EBIT by EUR 123 million. The operational result from equity accounted investments was EUR 16 million lower, mainly due to the Bergvik Skog transaction in 2019.
Results
Stora Enso Q4/2020 and full year 2020 results 7 (38)
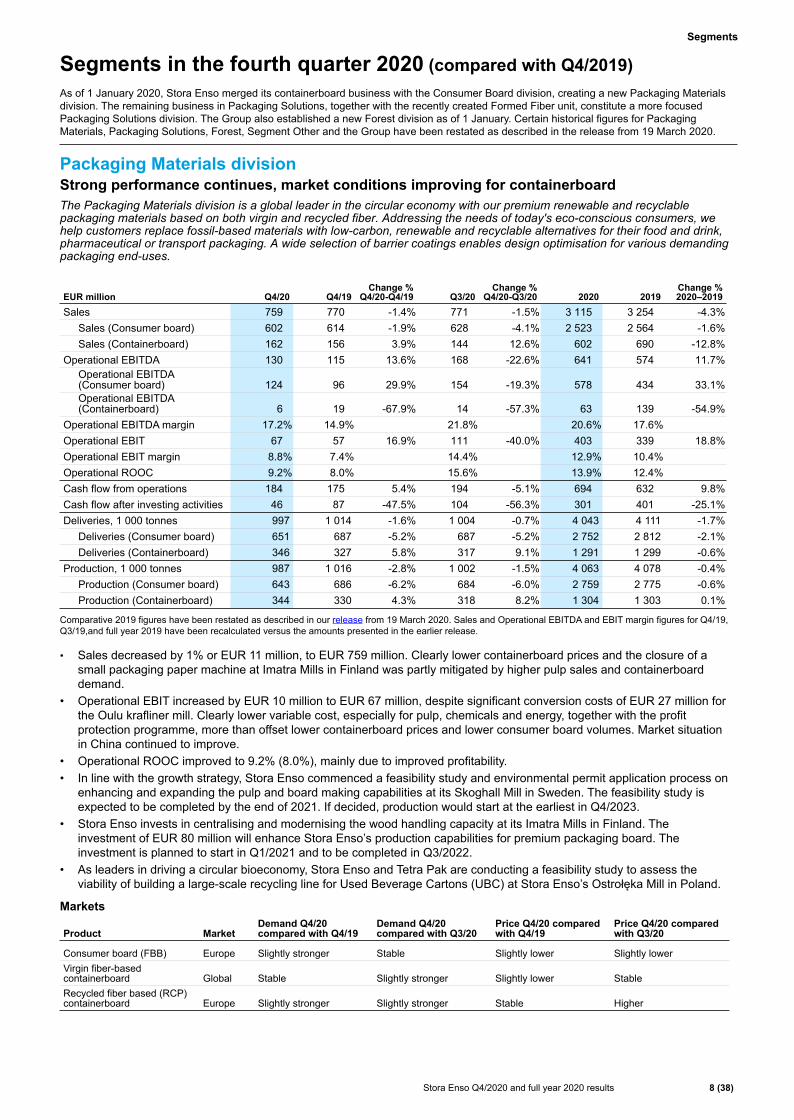
Segments in the fourth quarter 2020 (compared with Q4/2019)As of 1 January 2020, Stora Enso merged its containerboard business with the Consumer Board division, creating a new Packaging Materials division. The remaining business in Packaging Solutions, together with the recently created Formed Fiber unit, constitute a more focused Packaging Solutions division. The Group also established a new Forest division as of 1 January. Certain historical figures for Packaging Materials, Packaging Solutions, Forest, Segment Other and the Group have been restated as described in the release from 19 March 2020.
Packaging Materials divisionStrong performance continues, market conditions improving for containerboardThe Packaging Materials division is a global leader in the circular economy with our premium renewable and recyclable packaging materials based on both virgin and recycled fiber. Addressing the needs of today's eco-conscious consumers, we help customers replace fossil-based materials with low-carbon, renewable and recyclable alternatives for their food and drink, pharmaceutical or transport packaging. A wide selection of barrier coatings enables design optimisation for various demanding packaging end-uses.
EUR million Q4/20 Q4/19Change %
Q4/20-Q4/19 Q3/20Change %
Q4/20-Q3/20 2020 2019Change %2020–2019
Sales 759 770 -1.4 % 771 -1.5 % 3 115 3 254 -4.3 %Sales (Consumer board) 602 614 -1.9 % 628 -4.1 % 2 523 2 564 -1.6 %Sales (Containerboard) 162 156 3.9 % 144 12.6 % 602 690 -12.8 %
Operational EBITDA 130 115 13.6 % 168 -22.6 % 641 574 11.7 %Operational EBITDA (Consumer board) 124 96 29.9 % 154 -19.3 % 578 434 33.1 %Operational EBITDA (Containerboard) 6 19 -67.9 % 14 -57.3 % 63 139 -54.9 %
Operational EBITDA margin 17.2 % 14.9 % 21.8 % 20.6 % 17.6 %Operational EBIT 67 57 16.9 % 111 -40.0 % 403 339 18.8 %Operational EBIT margin 8.8 % 7.4 % 14.4 % 12.9 % 10.4 %Operational ROOC 9.2 % 8.0 % 15.6 % 13.9 % 12.4 %Cash flow from operations 184 175 5.4 % 194 -5.1 % 694 632 9.8 %Cash flow after investing activities 46 87 -47.5 % 104 -56.3 % 301 401 -25.1 %Deliveries, 1 000 tonnes 997 1 014 -1.6 % 1 004 -0.7 % 4 043 4 111 -1.7 %
Deliveries (Consumer board) 651 687 -5.2 % 687 -5.2 % 2 752 2 812 -2.1 %Deliveries (Containerboard) 346 327 5.8 % 317 9.1 % 1 291 1 299 -0.6 %
Production, 1 000 tonnes 987 1 016 -2.8 % 1 002 -1.5 % 4 063 4 078 -0.4 %Production (Consumer board) 643 686 -6.2 % 684 -6.0 % 2 759 2 775 -0.6 %Production (Containerboard) 344 330 4.3 % 318 8.2 % 1 304 1 303 0.1 %
Comparative 2019 figures have been restated as described in our release from 19 March 2020. Sales and Operational EBITDA and EBIT margin figures for Q4/19, Q3/19,and full year 2019 have been recalculated versus the amounts presented in the earlier release.
• Sales decreased by 1% or EUR 11 million, to EUR 759 million. Clearly lower containerboard prices and the closure of a small packaging paper machine at Imatra Mills in Finland was partly mitigated by higher pulp sales and containerboard demand.
• Operational EBIT increased by EUR 10 million to EUR 67 million, despite significant conversion costs of EUR 27 million for the Oulu krafliner mill. Clearly lower variable cost, especially for pulp, chemicals and energy, together with the profit protection programme, more than offset lower containerboard prices and lower consumer board volumes. Market situation in China continued to improve.
• Operational ROOC improved to 9.2% (8.0%), mainly due to improved profitability.• In line with the growth strategy, Stora Enso commenced a feasibility study and environmental permit application process on
enhancing and expanding the pulp and board making capabilities at its Skoghall Mill in Sweden. The feasibility study is expected to be completed by the end of 2021. If decided, production would start at the earliest in Q4/2023.
• Stora Enso invests in centralising and modernising the wood handling capacity at its Imatra Mills in Finland. The investment of EUR 80 million will enhance Stora Enso’s production capabilities for premium packaging board. The investment is planned to start in Q1/2021 and to be completed in Q3/2022.
• As leaders in driving a circular bioeconomy, Stora Enso and Tetra Pak are conducting a feasibility study to assess the viability of building a large-scale recycling line for Used Beverage Cartons (UBC) at Stora Enso’s Ostrołęka Mill in Poland.
Markets
Product MarketDemand Q4/20 compared with Q4/19
Demand Q4/20 compared with Q3/20
Price Q4/20 compared with Q4/19
Price Q4/20 compared with Q3/20
Consumer board (FBB) Europe Slightly stronger Stable Slightly lower Slightly lowerVirgin fiber-based containerboard Global Stable Slightly stronger Slightly lower StableRecycled fiber based (RCP) containerboard Europe Slightly stronger Slightly stronger Stable Higher
Segments
Stora Enso Q4/2020 and full year 2020 results 8 (38)

Packaging Materials division (continued)Sales and operational EBIT
Sales, EUR million Operational EBIT, %
Q1/19 Q2/19 Q3/19 Q4/19 Q1/20 Q2/20 Q3/20 Q4/200
200
400
600
800
1000
0%
4%
8%
12%
16%
20%
Operational ROOC
9.2% (Target: >20%)
Scheduled annual maintenance shutdowns
2021 2020 Q1 – –
Q2 Beihai and Ostrołęka mills Heinola Mill
Q3 Imatra and Varkaus mills Beihai, Imatra, and Varkaus mills
Q4 Skoghall, Fors, Ingerois, Heinola and Oulu mills
Fors, Ingerois, Skoghall and Ostrołęka mills
Segments
Stora Enso Q4/2020 and full year 2020 results 9 (38)

Packaging Solutions divisionSolid result supported by strong e-commerce demandThe Packaging Solutions division develops and sells premium fiber-based packaging products and services. Our high-end eco-friendly packaging products are used by leading brands across multiple market sectors, including store retail, e-commerce and industrials. The portfolio includes corrugated and other converting, design services, automation solutions, and scalable innovations such as formed fiber and biocomposites.
EUR million Q4/20 Q4/19
Change %Q4/20-Q4/19 Q3/20
Change %Q4/20-Q3/20 2020 2019
Change %2020–2019
Sales 160 170 -6.0 % 145 10.5 % 594 698 -14.9 %Operational EBITDA 17 16 0.3 % 15 12.6 % 61 71 -14.3 %Operational EBITDA margin 10.3% 9.7 % 10.1 % 10.3 % 10.2 %Operational EBIT 10 10 -4.4 % 8 24.9 % 34 46 -26.9 %Operational EBIT margin 6.0% 5.9 % 5.3 % 5.7 % 6.6 %Operational ROOC 16.2% 16.4 % 13.2 % 14.1 % 18.9 %Cash flow from operations 17 26 -32.7 % 10 74.3 % 51 93 -45.7 %Cash flow after investing activities 7 16 -57.4 % 7 3.5 % 28 58 -51.5 %Corrugated packaging European deliveries, million m2 268 261 2.8 % 250 7.3 % 999 1 026 -2.6 %Corrugated packaging European production, million m2 270 264 2.2 % 249 8.2 % 1 004 1 033 -2.8 %
Comparative 2019 figures have been restated as described in our release from 19 March 2020. Sales and Operational EBITDA and EBIT margin figures for Q4/19, Q3/19,and full year 2019 have been recalculated versus the amounts presented in the earlier release. The biocomposites business was transferred from Wood Products to Packaging Solutions on 1 July 2020, and the historical figures have not been restated, as the change was not material for the Group.
• Sales decreased by 6%, or EUR 10 million to EUR 160 million. Lower corrugated box prices in Europe due to decreased raw material prices, and negative sales foreign exchange rates were only partly offset by slightly higher European corrugated deliveries.
• Operational EBIT remained flat at EUR 10 million. Lower sales and accelerated efforts in new businesses (biocomposites, formed fiber and Box Inc.) were offset by lower cost for containerboard and lower fixed costs primarily relating to the profit protection programme.
• Operational ROOC remained stable at 16.2% (16.4%), despite costs related to the new business.• Stora Enso and the wholesale company Tingstad launched unique formed fiber food service bowls to replace plastics. The
PureFiber™ by Stora Enso product range will expand to other food and consumer goods applications.
Markets
Product MarketDemand Q4/20 compared with Q4/19
Demand Q4/20 compared with Q3/20
Price Q4/20 compared with Q4/19
Price Q4/20 compared with Q3/20
Corrugated packaging Europe Slightly stronger Significantly stronger Lower Slightly lower
Sales and operational EBIT
Sales, EUR millionOperational EBIT, %
Q1/19 Q2/19 Q3/19 Q4/19 Q1/20 Q2/20 Q3/20 Q4/200
50
100
150
200
0%
3%
6%
9%
12%
Operational ROOC
16.2 %(Target: >25%)
Segments
Stora Enso Q4/2020 and full year 2020 results 10 (38)

Biomaterials divisionMarket conditions improving; low profitability due to planned annual maintenance shutdownsThe Biomaterials division meets the growing demand for the replacement of products made from fossil-based and hazardous materials with bio-based solutions. We use all fractions of biomass, like lignin and sugars, to develop new solutions. We work to replace fossil-based materials with new applications such as carbon for energy storage, bio-based binders, and bio-based carbon fiber. The division’s offering includes a wide variety of pulp grades to meet the demands of paper, board, tissue, textile and hygiene product producers as well as materials from side streams of our processes, such as tall oil and turpentine from biomass.
EUR million Q4/20 Q4/19
Change %Q4/20-Q4/19 Q3/20
Change %Q4/20-Q3/20 2020 2019
Change %2020–2019
Sales 314 341 -7.9 % 305 3.0 % 1 193 1 464 -18.5 %Operational EBITDA 17 21 -19.4 % 38 -55.2 % 128 356 -64.0 %Operational EBITDA margin 5.4 % 6.1 % 12.3 % 10.7 % 24.3 %Operational EBIT -12 -12 -1.7 % 10 -224.5 % 9 233 -96.1 %Operational EBIT margin -3.9 % -3.5 % 3.2 % 0.8 % 15.9 %Operational ROOC -2.1 % -1.9 % 1.6 % 0.4 % 9.4 %Cash flow from operations 44 66 -33.2 % 47 -7.1 % 96 423 -77.2 %Cash flow after investing activities 14 11 20.1 % 26 -46.9 % 0 266 -100.1 %Pulp deliveries, 1 000 tonnes 649 709 -8.4 % 652 -0.4 % 2 427 2 520 -3.7 %
• Sales decreased by 8%, or EUR 27 million, to EUR 314 million. Lower pulp deliveries, mainly due to all-time high deliveries a year ago, and the negative sales foreign exchange rate impact decreased sales.
• Operational EBIT remained flat at EUR -12 million. The negative impact from total volumes affected by larger than normally maintenance works and slightly lower price. The negative impact was partially offset by clearly lower variable costs, especially for wood, chemicals and energy, supported by profit protection programme actions.
• Operational ROOC remained at a low level of -2.1% (-1.9%).• Stora Enso invests EUR 14 million to build a granulation and packing plant for lignin, allowing easier packing and handling
of lignin compared to powder and wet form. The granulation plant will be located at Stora Enso’s Sunila Mill in Finland.• Stora Enso will permanently close its Virdia operations in the United States during 2021. The operations have consisted of
two facilities: a research centre in Danville, Virginia, and a demo plant in Raceland, Louisiana.
Markets
Product MarketDemand Q4/20 compared with Q4/19
Demand Q4/20 compared with Q3/20
Price Q4/20 compared with Q4/19
Price Q4/20 compared with Q3/20
Softwood pulp Europe Slightly weaker Stronger Slightly higher Slightly higherHardwood pulp Europe Slightly weaker Significantly stronger Stable StableHardwood pulp China Stronger Significantly stronger Stable Slightly higher
Sales and operational EBIT
Sales, EUR million Operational EBIT, %
Q1/19 Q2/19 Q3/19 Q4/19 Q1/20 Q2/20 Q3/20 Q4/20-100
0
100
200
300
400
-7%
0%
7%
14%
21%
28%
Operational ROOC
-2.1 %(Target: >15%)
Scheduled annual maintenance shutdowns2021 2020
Q1 – –
Q2 Enocell Mill –
Q3 Skutskär and Sunila mills Sunila and Veracel mills
Q4 Montes del Plata and Veracel mills
Montes del Plata and Skutskär mills
Segments
Stora Enso Q4/2020 and full year 2020 results 11 (38)

Wood Products divisionExceptionally strong Q4The Wood Products division is the largest sawn wood producer in Europe and a leading provider of sustainable wood-based solutions for the construction industry. Our growing Building Solutions business offers building concepts to support low-carbon construction and eco-friendly designs. We develop digital tools to simplify the designing of building projects with wood. We also offer applications for windows, doors and for packaging industries, and our pellets provide a sustainable heating solution.
EUR million Q4/20 Q4/19
Change %Q4/20-Q4/19 Q3/20
Change %Q4/20-Q3/20 2020 2019
Change %2020–2019
Sales 360 374 -3.7 % 341 5.6 % 1 386 1 569 -11.7 %Operational EBITDA 44 26 69.8 % 49 -9.4 % 160 153 4.6 %Operational EBITDA margin 12.3 % 7.0 % 14.3 % 11.6 % 9.8 %Operational EBIT 33 14 143.7 % 38 -12.4 % 114 105 8.6 %Operational EBIT margin 9.2 % 3.6 % 11.0 % 8.3 % 6.7 %Operational ROOC 23.5 % 8.2 % 25.2 % 19.1 % 16.6 %Cash flow from operations 79 57 38.9 % 64 23.8 % 211 183 15.3 %Cash flow after investing activities 74 42 75.1 % 57 30.6 % 181 135 34.0 %Wood products deliveries, 1 000 m3 1 155 1 149 0.5 % 1 071 7.8 % 4 407 4 753 -7.3 %
• Sales decreased by 4%, or EUR 14 million to EUR 360 million. The structural changes at the Pfarrkirchen mill in Germany, and at the Uimaharju and Kitee sawmills in Finland reduced sales by EUR 23 million. This was only partly offset by slightly better prices and mix for classic sawn, laminated veneer lumber (LVL) and US sales.
• Operational EBIT increased by EUR 19 million to EUR 33 million, the second highest Q4 ever. Higher sales prices and good cost control, supported by the profit protection programme, improved profitability.
• Operational ROOC increased above the long-term target to 23.5% (8.2%).• Stora Enso's focus on the mass timber construction business continues, despite the volatile construction outlook and
expected project delays. There were more than 650 projects with CLT and LVL in Q4, covering a wide range for large and smaller buildings delivered to 21 countries around the world.
Markets
Product MarketDemand Q4/20 compared with Q4/19
Demand Q4/20 compared with Q3/20
Price Q4/20 compared with Q4/19
Price Q4/20 compared with Q3/20
Wood products Europe Stronger Stable Slightly higher Slightly higher
Sales and operational EBIT Operational ROOC
Sales, EUR million Operational EBIT, %
Q1/19 Q2/19 Q3/19 Q4/19 Q1/20 Q2/20 Q3/20 Q4/200
100
200
300
400
500
0%
3%
6%
9%
12%
15%
23.5% (Target: >20%)
Segments
Stora Enso Q4/2020 and full year 2020 results 12 (38)

Forest divisionContinued strong and stable performanceThe Forest division creates value with sustainable forest management, competitive wood supply and innovation, which are the foundation for Stora Enso’s renewable offerings. The division manages Stora Enso's forest assets in Sweden and the 41% share of Tornator, the majority of whose forest assets are located in Finland. The division is also responsible for wood sourcing for Stora Enso’s Nordic, Baltic and Russian operations and B2B customers. Stora Enso is one of the biggest private forest owners in the world.
EUR million Q4/20 Q4/19Change %
Q4/20-Q4/19 Q3/20Change %
Q4/20-Q3/20 2020 2019Change %2020–2019
Sales 527 558 -5.5 % 457 15.5 % 2 046 2 321 -11.9 %Operational EBITDA 54 43 26.8 % 54 0.0 % 217 145 49.9 %Operational EBITDA margin 10.3 % 7.7 % 11.9 % 10.6 % 6.2 %Operational EBIT 41 31 31.1 % 38 8.0 % 164 99 64.9 %Operational EBIT margin 7.8 % 5.6 % 8.3 % 8.0 % 4.3 %Operational ROCE 3.8 % 3.8 % 4.3 % 3.9 % 3.7 %Cash flow from operations 41 273 -85.0 % 37 10.3 % 203 370 -45.1 %Cash flow after investing activities 32 258 -87.7 % 29 8.0 % 166 333 -50.0 %Wood deliveries, 1 000 m3 9 956 9 379 6.2 % 8 591 15.9 % 37 369 38 775 -3.6 %Operational fair value change of biological assets 14 12 12.1 % 20 -31.9 % 70 50 40.6 %
Comparative 2019 figures have been restated as described in our release from 19 March 2020.
• Sales decreased by 5% or EUR 31 million to EUR 527 million. Clearly lower wood prices were only partly offset by increased wood deliveries, especially in Sweden.
• Operational EBIT increased by EUR 10 million to a record high Q4 level of EUR 41 million. The Nordic forest equity accounted investment, Tornator, signed a wind power project transaction which together with increased efficiency in the Finnish wood sourcing unit improved profitability significantly.
• Operational ROCE remained above the long-term target at 3.8% (3.8%), despite a clear capital base increase after the adoption of the market transaction based valuation for the Nordic forest assets.
• Stora Enso announced the divestment of forest assets located in southern Sweden to the forestry fund Silvestica Green Forest AB. The total area of forest land in the transaction is approximately 5 200 hectares. The selling price was approximately EUR 90 million. The divestment was closed in January 2021. A gain of approximately EUR 70 million, based on the assets’ historical cost, will be recorded in operational EBIT for the first quarter of 2021. The gain under IFRS is approximately EUR 30 million, based on the IFRS book value.
• At the end of 2020, Stora Enso changed the valuation method for forest assets and accounting principle for forest land in the Nordics. Valuation of forest assets in Sweden is based on market transaction data.
• Tornator and the largest onshore wind power company in Europe OX2 have signed an agreement, according to which Tornator will lease land in Finland for OX2 to a build wind power of 600 MW.
Sales and operational EBIT
Sales, EUR million Operational EBIT, %
Q1/19 Q2/19 Q3/19 Q4/19 Q1/20 Q2/20 Q3/20 Q4/200
200
400
600
800
0%
2%
4%
6%
8%
Operational ROCE
3.8% (Target: >3.5%)
Segments
Stora Enso Q4/2020 and full year 2020 results 13 (38)

Paper divisionChallenging market conditions continue; strong cash flow generationStora Enso is the second largest paper producer in Europe, with an established customer base and a wide product portfolio for print and office use. Customers benefit from Stora Enso's broad selection of paper products made from recycled and virgin fiber, our technical expertise and our sustainability know-how as well as our mill and customer service centre network.
EUR million Q4/20 Q4/19
Change %Q4/20-Q4/19 Q3/20
Change %Q4/20-Q3/20 2020 2019
Change %2020–2019
Sales 476 694 -31.4 % 468 1.7 % 1 979 2 856 -30.7 %Operational EBITDA 19 71 -73.5 % 11 72.3 % 66 318 -79.4 %Operational EBITDA margin 3.9 % 10.2% 2.3 % 3.3 % 11.1% Operational EBIT -5 44 -111.0 % -16 70.4 % -38 213 -118.0 %Operational EBIT margin -1.0 % 6.3% -3.5 % -1.9 % 7.4% Operational ROOC -3.5 % 24.7% -10.1 % -6.7 % 29.3% Cash flow from operations 66 97 -31.8 % 31 111.1 % 105 344 -69.5 %Cash flow after investing activities 49 72 -31.5 % 15 233.3 % 31 264 -88.4 %Cash flow after investing activities to sales, % 10.3 % 10.3% 3.2% 1.6 % 9.3% Paper deliveries, 1 000 tonnes 792 1 029 -23.1 % 731 8.3 % 3 106 4 130 -24.8 %Paper production, 1 000 tonnes 731 982 -25.5 % 723 1.2 % 3 034 4 065 -25.4 %
• Sales decreased by 31%, or EUR 218 million, to EUR 476 million. The ongoing Covid-19 pandemic has accelerated the global overcapacity situation, leading to a further decline in demand and placing additional pressure on both prices and deliveries in all paper grades. The discontinuation of Oulu Mill paper production in Finland decreased sales by EUR 50 million.
• Operational EBIT decreased by EUR 49 million to EUR -5 million. Clearly lower prices and the total volume impact were only partly mitigated by lower costs, supported by the profit protection programme. Activities related to the discontinuation of paper production at Oulu Mill had a EUR 5 million negative impact on the operational EBIT.
• Cash flow after investing activities to sales ratio is clearly above long-term target at 10.3% (10.3%), driven by very good working capital management.
• Stora Enso completed the co-determination negotiations concerning the closure of one standard newsprint paper machine (PM3) in December and the deinking plant in Q2/2021 at Stora Enso’s Hylte Mill in Sweden. The maximum personnel impact is 140 people.
Markets
Product MarketDemand Q4/20 compared with Q4/19
Demand Q4/20 compared with Q3/20
Price Q4/20 compared with Q4/19
Price Q4/20 compared with Q3/20
Paper Europe Significantly weaker Significantly stronger Significantly lower Slightly lower
Sales and operational EBITDA
Sales, EUR million Operational EBITDA, %
Q1/19 Q2/19 Q3/19 Q4/19 Q1/20 Q2/20 Q3/20 Q4/20-200
0
200
400
600
800
-4%
0%
4%
8%
12%
16%
Cash flow after investing activities to sales1
10.3% (Target: >7%)
Scheduled annual maintenance shutdowns2021 2020
Q1 – –
Q2 – –
Q3 Veitsiluoto Mill Veitsiluoto Mill
Q4 Nymölla Mill Nymölla Mill
1 The Paper division’s financial target is cash flow after investing activities to sales (non-IFRS), because the division’s goal is to generate cash flow for the Group so that it can transform into a renewable materials growth company.
Segments
Stora Enso Q4/2020 and full year 2020 results 14 (38)

Segment Other
The segment Other includes Stora Enso’s shareholding in the energy company Pohjolan Voima (PVO), and the Group’s shared services and administration.
EUR million Q4/20 Q4/19Change %
Q4/20-Q4/19 Q3/20Change %
Q4/20-Q3/20 2020 2019Change %2020–2019
Sales 231 262 -11.8 % 230 0.5 % 928 1 076 -13.7 %Operational EBITDA -7 -14 49.6 % -5 -54.2 % -3 -4 20.4 %Operational EBITDA margin -3.1 % -5.5 % -2.0 % -0.3 % -0.3 %Operational EBIT -16 -19 19.8 % -13 -21.0 % -35 -32 -9.8 %Operational EBIT margin -6.7 % -7.4 % -5.6 % -3.8 % -3.0 %Cash flow from operations 5 32 -86.1 % 16 -71.8 % -17 -55 69.3 %Cash flow after investing activities 1 32 -95.5 % 13 -88.5 % -27 -71 62.6 %
• Sales decreased by EUR 31 million to EUR 231 million, as sales related to internal services decreased.• Operational EBIT increased by EUR 3 million to EUR -16 million mainly due to Covid-19 related savings actions.
Segments
Stora Enso Q4/2020 and full year 2020 results 15 (38)
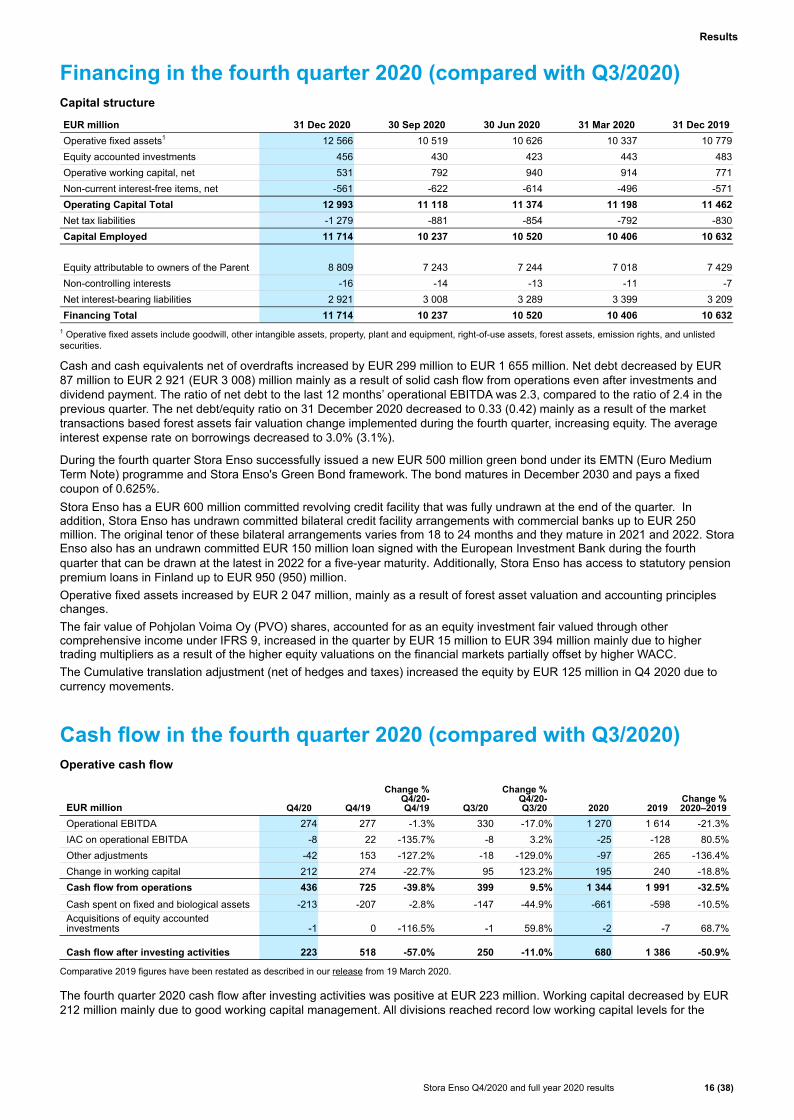
Financing in the fourth quarter 2020 (compared with Q3/2020)Capital structure
EUR million 31 Dec 2020 30 Sep 2020 30 Jun 2020 31 Mar 2020 31 Dec 2019Operative fixed assets1 12 566 10 519 10 626 10 337 10 779 Equity accounted investments 456 430 423 443 483 Operative working capital, net 531 792 940 914 771 Non-current interest-free items, net -561 -622 -614 -496 -571 Operating Capital Total 12 993 11 118 11 374 11 198 11 462 Net tax liabilities -1 279 -881 -854 -792 -830 Capital Employed 11 714 10 237 10 520 10 406 10 632
Equity attributable to owners of the Parent 8 809 7 243 7 244 7 018 7 429 Non-controlling interests -16 -14 -13 -11 -7 Net interest-bearing liabilities 2 921 3 008 3 289 3 399 3 209 Financing Total 11 714 10 237 10 520 10 406 10 632
1 Operative fixed assets include goodwill, other intangible assets, property, plant and equipment, right-of-use assets, forest assets, emission rights, and unlisted securities.
Cash and cash equivalents net of overdrafts increased by EUR 299 million to EUR 1 655 million. Net debt decreased by EUR 87 million to EUR 2 921 (EUR 3 008) million mainly as a result of solid cash flow from operations even after investments and dividend payment. The ratio of net debt to the last 12 months’ operational EBITDA was 2.3, compared to the ratio of 2.4 in the previous quarter. The net debt/equity ratio on 31 December 2020 decreased to 0.33 (0.42) mainly as a result of the market transactions based forest assets fair valuation change implemented during the fourth quarter, increasing equity. The average interest expense rate on borrowings decreased to 3.0% (3.1%).
During the fourth quarter Stora Enso successfully issued a new EUR 500 million green bond under its EMTN (Euro Medium Term Note) programme and Stora Enso's Green Bond framework. The bond matures in December 2030 and pays a fixed coupon of 0.625%.Stora Enso has a EUR 600 million committed revolving credit facility that was fully undrawn at the end of the quarter. In addition, Stora Enso has undrawn committed bilateral credit facility arrangements with commercial banks up to EUR 250 million. The original tenor of these bilateral arrangements varies from 18 to 24 months and they mature in 2021 and 2022. Stora Enso also has an undrawn committed EUR 150 million loan signed with the European Investment Bank during the fourth quarter that can be drawn at the latest in 2022 for a five-year maturity. Additionally, Stora Enso has access to statutory pension premium loans in Finland up to EUR 950 (950) million.Operative fixed assets increased by EUR 2 047 million, mainly as a result of forest asset valuation and accounting principles changes.The fair value of Pohjolan Voima Oy (PVO) shares, accounted for as an equity investment fair valued through other comprehensive income under IFRS 9, increased in the quarter by EUR 15 million to EUR 394 million mainly due to higher trading multipliers as a result of the higher equity valuations on the financial markets partially offset by higher WACC.The Cumulative translation adjustment (net of hedges and taxes) increased the equity by EUR 125 million in Q4 2020 due to currency movements.
Cash flow in the fourth quarter 2020 (compared with Q3/2020) Operative cash flow
EUR million Q4/20 Q4/19
Change %Q4/20-Q4/19 Q3/20
Change %Q4/20-Q3/20 2020 2019
Change %2020–2019
Operational EBITDA 274 277 -1.3 % 330 -17.0 % 1 270 1 614 -21.3 %IAC on operational EBITDA -8 22 -135.7 % -8 3.2 % -25 -128 80.5 %Other adjustments -42 153 -127.2 % -18 -129.0 % -97 265 -136.4 %Change in working capital 212 274 -22.7 % 95 123.2 % 195 240 -18.8 %Cash flow from operations 436 725 -39.8 % 399 9.5 % 1 344 1 991 -32.5 %Cash spent on fixed and biological assets -213 -207 -2.8 % -147 -44.9 % -661 -598 -10.5 %Acquisitions of equity accounted investments -1 0 -116.5 % -1 59.8 % -2 -7 68.7 %
Cash flow after investing activities 223 518 -57.0 % 250 -11.0 % 680 1 386 -50.9 %
Comparative 2019 figures have been restated as described in our release from 19 March 2020.
The fourth quarter 2020 cash flow after investing activities was positive at EUR 223 million. Working capital decreased by EUR 212 million mainly due to good working capital management. All divisions reached record low working capital levels for the
Results
Stora Enso Q4/2020 and full year 2020 results 16 (38)

quarter. Cash spent on fixed and biological assets was EUR 213 million. Payments related to the previously announced provisions amounted to EUR 9 million.
Capital expenditure During 2020, as part of managing the macroeconomic uncertainties, focus was put on cash flow. Capital expenditure was lowered from originally planned maximum amount of EUR 750 million to the actual EUR 687 million. Additions to fixed and biological assets in the fourth quarter 2020 totalled EUR 303 (302) million, of which EUR 287 million were fixed assets including EUR 14 million of leases capex, and EUR 16 million of biological assets. Depreciations and impairment charges excluding IACs totalled EUR 136 (136) million. Additions in fixed and biological assets had a cash outflow impact of EUR 213 (207) million.The main projects ongoing in the fourth quarter of 2020 were the Oulu Mill conversion into kraftliner production in Finland, the pilot facility at Sunila Mill in Finland for producing bio-based carbon materials based on lignin, investment in new production line for cross laminated timber (CLT) at Ždírec Mill in the Czech Republic and the wood handling upgrade investment at Imatra Mills in Finland.
Capital expenditure and depreciation forecast 2021
EUR million Forecast 2021
Capital expenditure 675–725Depreciation and depletion of capitalised silviculture costs 600–640
Stora Enso’s capital expenditure forecast includes approximately EUR 70 million for the Group's biological assets and the capitalised leasing contracts according to IFRS 16 Leases of approximately EUR 40 million. The depreciation and depletion of capitalised silviculture costs forecast also includes the impact of IFRS 16. The depletion of capitalised silviculture costs is forecast to be EUR 45–60 million.
Capital expenditure on fixed assets includes investments in and acquisitions of tangible and intangible assets as well as internally generated assets and capitalised borrowing costs, net of any related subsidies. Capital expenditure on leased assets includes new capitalised leasing contracts. Capital expenditure on biological assets consists of acquisitions of biological assets and capitalisation of costs directly linked to growing trees in plantation forests. The cash flow impact of capital expenditure is presented in cash flow from investing activities, excluding leases capex, where the cash flow impact is based on paid lease liabilities and presented in cash flow from financing and operating activities.
Results
Stora Enso Q4/2020 and full year 2020 results 17 (38)

Sustainability in the fourth quarter 2020
Safety performanceTRI rate
Q4/20 Q4/19 Q3/20 2020 2019 MilestoneMilestone to
be reached by
TRI rate 12 6.7 6.7 6.3 6.1 7.0 4.7 end of 2020
TRI (Total recordable incident) rate = number of incidents per one million hours worked1 For own employees, including employees of the joint operations Veracel and Montes del Plata2 Historical figures for TRI rate recalculated due to additional data received after the previous Interim Reports.
Stora Enso takes active and precautionary measures to mitigate the effects of the pandemic and keep employees and contractors safe and healthy. In the end of November, Covid-19 infections were detected among contractors working on the Oulu Mill conversion project. Consequently, Stora Enso further enhanced its guidelines and tested all personnel including contractors working at the mill. Follow up tests were also conducted. The company also ran a third-party supplier audit of selected contractors on their preparedness and execution of preventive measures while onsite at Oulu Mill. The Covid-19 impact related to the conversion project at the mill is under control.
SuppliersImplementation of the Supplier Code of Conduct
31 Dec 2020 30 Sep 2020 31 Dec 2019 Target% of supplier spend covered by the Supplier Code of Conduct1 96 % 97 % 96% 95 %
1 Excluding joint operations, intellectual property rights, leasing fees, financial trading, government fees such as customs, and wood purchases from private individual forest owners.
Forests, plantations, and land useAgreements with social landless movements and land occupations in Bahia, Brazil
31 Dec 2020 30 Sep 2020 31 Dec 2019Productive area occupied by social movements not involved in the agreements, ha 215 215 470
At the end of the year, 215 hectares or 0.3% of productive land owned by Veracel were occupied by social landless movements not involved in the agreements. Veracel continues to recover occupied areas through legal processes. Since 2012, Veracel has voluntarily approved the transfer of approximately 20 000 hectares of land to benefit landless people. At the end of 2020, the total land area owned by Veracel was 213 000 hectares, of which 82 000 hectares are planted with eucalyptus for pulp production.
Carbon dioxideScience-based target (SBT) performance compared to 2010 base-year level
31 Dec 2020 30 Sep 2020 31 Dec 2019 TargetTarget to be reached by
Reduction of fossil CO2e emissions per saleable tonne of board, pulp, and paper (kg/t) 1 2 -26 % -25 % -26 % -31 % end of 2030
1 Direct fossil CO2e emissions from production and indirect fossil CO2e emissions related to purchased electricity and heat (Scope 1 and 2). Excluding joint operations. Rolling four quarters. ² Historical figures recalculated due to additional data after the previous Interim Reports.
In 2017, the Science Based Target (SBT) initiative approved our 2030 target to reduce our greenhouse gas (GHG) emissions by 31% from operations per tonne of board, pulp, and paper produced compared to a 2010 base-year. Despite lower production volumes in paper the year-on-year performance remained stable mainly due to the less fossil-intensive electricity purchased for our mills in Finland.
Other eventsStora Enso’s Sustainability report 2019 was rated among the top ten globally by the World Business Council for Sustainable Development (WBCSD). Stora Enso was ranked the most sustainable listed company in our sector in Sweden by Dagens Industri, Aktuell Hållbarhet, and Lund University School of Economics and Management. The Swedish University of Agricultural Sciences (SLU), Stora Enso’s partner in developing climate impact research for forest product companies, published a report that provides evidence of our positive climate impact.
Sustainability
Stora Enso Q4/2020 and full year 2020 results 18 (38)

Short-term risks and uncertaintiesThe global outlook has brightened. While we expect a weaker rebound in 2021 than anticipated in the end of Q3/2020, recent vaccine progress has shifted the balance of risks substantially and opened the door to a more rapid relaxation of restrictions. The global output is constrained by social distancing in the near term, before large-scale and permanent reductions in restrictions might begin around mid-2021. Nevertheless, and despite a strong initial recovery, high unemployment, stagnant investments, business insolvencies and surging corporate and sovereign debt, as well as dramatic market corrections triggered by unconventional monetary policy measures may limit the revival in 2021. In addition, Stora Enso continues to face uncertainty in the short and medium term. However, compared with previous recessions, both the industry in general and Stora Enso in particular with its diversified business portfolio and relatively strong balance sheet, are considered more resilient to economic shock and morbid business conditions. Stora Enso maintains a Covid-19 risk assessment process to determine the potential near- and medium-term implications of the direct and indirect impacts on Stora Enso’s business operations. The process builds on several alternative scenarios, involving the identification and planning of business contingency and cash preservation measures to limit the potential impacts across Stora Enso’s business divisions and to ensure sufficient liquidity in all conditions. The contemplated worst-case scenarios, which assume faltering vaccine progress and delayed W-shaped recovery, would not, in Stora Enso's view, lead to circumstances that would compromise Stora Enso’s ability to continue as a going concern. The trend towards nationalist anti-globalist policies may grow following the Covid-19 pandemic, with border checks on goods and people becoming more stringent and national interests being promoted. There is also a risk that even open economies, such as those in Western Europe and Asian business hubs, enact policies in direct opposition to globalisation. The tail risk related to the UK’s exit from the EU, subsequent to the trade deal between the two, is mainly limited to near-term congestion in logistics, while the UK market demand is not expected to suffer notable impacts. Increasing competition, and supply and demand imbalances in the paper, pulp, packaging, wood products and roundwood markets may affect Stora Enso’s market share and profitability. Changes in the global economic and political environment, sharp market corrections, increasing volatility in foreign exchange rates and deteriorating economic conditions in the main markets could all affect Stora Enso’s profits, cash flow and financial position. Stora Enso has been granted various investment subsidies and has given certain investment commitments in different countries e.g. Finland, China and Sweden. If committed planning conditions are not met, local officials may pursue administrative measures to reclaim some of the formerly granted investment subsidies or to impose penalties on Stora Enso, and the outcome of such a process could result in a negative financial impact on Stora Enso. Other risks and uncertainties include, but are not limited to: general industry conditions, such as changes in the cost or availability of raw materials, energy and transport costs; unanticipated expenditures related to the cost of compliance with existing and new environmental and other governmental regulations and to actual or potential litigation; material disruption at one of our manufacturing facilities; risks inherent in conducting business through joint ventures, and other factors that can be found in Stora Enso’s press releases and disclosures.A more detailed description of risks is available in Stora Enso’s Financial Report at storaenso.com/annualreport.
Energy sensitivity analysis: the direct effect of a 10% increase in electricity and fossil fuel market prices would have a negative impact of approximately EUR 11 million on operational EBIT for the next 12 months.Wood sensitivity analysis: the direct effect of a 10% increase in wood prices would have a negative impact of approximately EUR 177 million on operational EBIT for the next 12 months. Pulp sensitivity analysis: the direct effect of a 10% increase in pulp market prices would have a positive impact of approximately EUR 105 million on operational EBIT for the next 12 months. Chemical and filler sensitivity analysis: the direct effect of a 10% increase in chemical and filler prices would have a negative impact of approximately EUR 32 million on operational EBIT for the next 12 months. A decrease of energy, wood, pulp or chemical and filler prices would have the opposite impact. Foreign exchange rates transaction risk sensitivity analysis for the next twelve months: the direct effect on operational EBIT of a 10% strengthening in the value of the US dollar, Swedish krona and British pound would be approximately positive EUR 133 million, negative EUR 20 million and positive EUR 22 million annual impact, respectively. Weakening of the currencies would have the opposite impact. These numbers are before the effect of hedges and assuming no changes occur other than a single currency exchange rate movement in an exposure currency. The Group's consolidated income statement on operational EBIT level is exposed to a foreign-currency translation risk worth approximately EUR 120 million cost exposure in Brazilian real (BRL) and approximately EUR 28 million income exposure in Chinese Renminbi (CNY). These exposures are arising from the foreign subsidiaries and joint-operations located in Brazil and China, respectively. For these exposures a 10% strengthening in the value of a foreign currency would have a negative EUR 12 million and a positive EUR 3 million impact on operational EBIT, respectively.
Events
Stora Enso Q4/2020 and full year 2020 results 19 (38)

Legal proceedingsContingent liabilities Stora Enso has undertaken significant restructuring actions in recent years which have included the divestment of companies, sale of assets and mill closures. These transactions include a risk of possible environmental or other obligations the existence of which would be confirmed only by the occurrence or non-occurrence of one or more uncertain future events not wholly within the control of the Group. A provision has been recognised for obligations for which the related amount can be estimated reliably and for which the related future cost is considered to be at least probable.
Stora Enso is party to legal proceedings that arise in the ordinary course of business and which primarily involve claims arising out of commercial law. The management does not consider that liabilities related to such proceedings before insurance recoveries, if any, are likely to be material to the Group’s financial condition or results of operations.
Legal proceedings in Latin America Veracel On 11 July 2008, Stora Enso announced that a federal judge in Brazil had issued a decision claiming that the permits issued by the State of Bahia for the operations of Stora Enso’s joint operations company Veracel were not valid. The judge also ordered Veracel to take certain actions, including reforestation with native trees on part of Veracel’s plantations and a possible fine of, at the time of the decision, BRL 20 (EUR 3) million. Veracel disputes the decision and has filed an appeal against it. Veracel operates in full compliance with all Brazilian laws and has obtained all the necessary environmental and operating licences for its industrial and forestry activities from the relevant authorities. In November 2008, a Federal Court suspended the effects of the decision. No provisions have been recorded in Veracel’s or Stora Enso’s accounts for the reforestation or the possible fine.
Changes in organisational structure in 2020As of 1 January 2020, Stora Enso merged its containerboard business in the Packaging Solutions division with the Consumer Board division, creating a new Packaging Materials division. The remaining business in Packaging Solutions, together with Stora Enso’s recently created formed fiber unit, constituted a more focused Packaging Solutions division. The Group also established a new Forest division.
Changes in Group Leadership Team in 2020Jari Suominen was appointed as EVP, Head of Forest division as of 1 January 2020. He continued as a member of the Group Leadership Team. David Ekberg was appointed as EVP, Head of Packaging Solutions division and member of the Group Leadership Team as of 1 April 2020.Lars Völkel was appointed EVP, Head of Wood Products division, and member of the Group Leadership Team as of 1 July 2020.Katariina Kravi was appointed EVP, Head of Human Resources, and member of the Group Leadership Team as of 1 September 2020. Annette Stube was appointed EVP, Head of Sustainability, and member of the Group Leadership Team as of 1 September 2020. She succeeded Noel Morrin, who retired at the end of 2020.Tobias Bäärnman, Chief Strategy and Innovation Officer, was appointed as a member of the Group Leadership Team as of 1 November 2020. He joined Stora Enso in 2017, first as SVP Controlling, Strategy and IT for Consumer Board division. Since December 2019, he has worked as Chief Strategy and Innovation Officer.Teemu Salmi, CIO and Head of IT & Digitalisation, was appointed as a member of the Group Leadership Team as of 1 November 2020. He joined Stora Enso in 2017.
Events
Stora Enso Q4/2020 and full year 2020 results 20 (38)

Major events in 2020Decisions of Annual General Meeting in 2020 and dividend payment Stora Enso’s Annual General Meeting (AGM) was held on 4 June 2020 at the Company's Head Office in Helsinki, Finland. In order to prevent the spread of the Covid-19 pandemic, a shareholder or his/her proxy representative could not be present at the venue of the meeting. The AGM approved the proposal by the Board of Directors that the Company distributes a dividend of EUR 0.15 per share for the year 2019. In addition, the AGM approved the proposal that the Board of Directors to decide at its discretion on the payment of dividend up to a maximum of EUR 0.35 per share. In December, Stora Enso Oyj's Board of Directors decided that a second dividend instalment of EUR 0.15 per share would be paid on 17 December 2020. Following the second dividend payment, the total dividend for the financial year 2019 was EUR 0.30 per share.The AGM approved the proposal that of the current members of the Board of Directors – Jorma Eloranta, Elisabeth Fleuriot, Hock Goh, Mikko Helander, Christiane Kuehne, Antti Mäkinen, Richard Nilsson and Hans Stråberg – be re-elected members of the Board of Directors until the end of the following AGM and that Håkan Buskhe be elected new member of the Board of Directors for the same term of office. The AGM elected Jorma Eloranta as Chair of the Board of Directors and Hans Stråberg as Vice Chair.The AGM approved the proposed annual remuneration for the Board of Directors as follows:Chair EUR 197 000 (2019: EUR 192 000)Vice Chair EUR 112 000 (2019: EUR 109 000)Members EUR 76 000 (2019: EUR 74 000)The AGM also approved the proposal that the annual remuneration for the members of the Board of Directors, be paid in Company shares and cash so that 40% will be paid in Stora Enso R shares to be purchased on the Board members’ behalf from the market at a price determined in public trading, and the rest in cash.The AGM also approved the proposed annual remuneration for the Board committees.The AGM approved the proposal that PricewaterhouseCoopers Oy be elected as auditor until the end of the following AGM. PricewaterhouseCoopers Oy has notified the company that Samuli Perälä, APA, will act as the responsible auditor. It was resolved that the remuneration for the auditor shall be paid according to invoice approved by the Financial and Audit Committee. The AGM approved the proposals that the Board of Directors be authorised to decide on the repurchase and on the issuance of Stora Enso R shares. The amount of shares shall not to exceed a total of 2 000 000 R shares, corresponding to approximately 0.25% of all shares and 0.33% of all R shares.
Decisions by the Board of DirectorsAt its meeting held after the AGM, Stora Enso's Board of Directors elected Richard Nilsson (chair), Jorma Eloranta, Elisabeth Fleuriot and Hock Goh as members of the Financial and Audit Committee.Jorma Eloranta (chair), Antti Mäkinen, and Hans Stråberg were elected members of the Remuneration Committee. Christiane Kuehne (chair), Håkan Buskhe and Mikko Helander were elected members of the Sustainability and Ethics Committee.
Shareholders' Nomination BoardThe Shareholders' Nomination Board, established by Stora Enso’s Annual General Meeting (AGM), was appointed in September and it consists of the same members as for the previous period: Jorma Eloranta (Chair of Stora Enso’s Board of Directors), Hans Stråberg (Vice Chair of Stora Enso’s Board of Directors), Harri Sailas (Chair of the Board of Directors of Solidium Oy), and Marcus Wallenberg (Chair of the Board of Directors of FAM AB). The Shareholders’ Nomination Board has elected Marcus Wallenberg as its Chair. The Shareholders' Nomination Board proposes to the AGM to be held on 19 March 2021 that the Company's Board of Directors shall have nine (9) members. The Shareholders’ Nomination Board proposes that of the current members of the Board of Directors, Håkan Buskhe, Elisabeth Fleuriot, Hock Goh, Mikko Helander, Christiane Kuehne, Antti Mäkinen and Richard Nilsson be re-elected members of the Board of Directors until the end of the following AGM and that Helena Hedblom and Hans Sohlström be elected new members of the Board of Directors for the same term of office. The Shareholders’ Nomination Board proposes that Antti Mäkinen be elected Chair and Håkan Buskhe be elected Vice Chair of the Board of Directors. Jorma Eloranta and Hans Stråberg have announced that they are not available for re-election to the Board of Directors.
Events
Stora Enso Q4/2020 and full year 2020 results 21 (38)

Annual General Meeting 2021Stora Enso Oyj's Annual General Meeting (AGM) will be held on Friday 19 March 2021.The Company will publish the invitation to the Annual General Meeting 2021 on or about 11 February 2021 with more detailed information on the participation and voting at the meeting. More information is available at storaenso.com/agmThe proposals by the Shareholders’ Nomination Board to the AGM 2021 have been released on 9 December 2020 and the proposals by the Board of Directors on 29 January 2021. Stora Enso Oyj’s annual accounts, the report of the Board of Directors and the auditor’s report for 2020 will be published at storaenso.com/annualreport during the week commencing 8 February.The Annual General Meeting 2021 will be held with exceptional procedures based on the temporary legislative act to limit the spread of the Covid-19 pandemic approved by the Finnish Parliament.
The Board of Directors’ proposal for the payment of dividendThe Board of Directors proposes to the AGM that a dividend of EUR 0.30 per share be distributed on the basis of the balance sheet adopted for the year 2020. The Board of Directors has assessed the Company’s financial situation and liquidity before making the proposal. There have been no material changes in the parent company’s financial position since 31 December 2020, the liquidity of the parent company remains good and the proposed dividend does not risk the solvency of the company. Stora Enso's policy is to distribute 50% of earnings per share (EPS) excluding fair valuation over the cycle. In 2020, EPS excluding fair valuation was EUR 0.45.The dividend would be paid to shareholders who on the record date of the dividend payment, 23 March 2021, are recorded in the shareholders’ register maintained by Euroclear Finland Oy or in the separate register of shareholders maintained by Euroclear Sweden AB for Euroclear Sweden registered shares. Dividends payable to Euroclear Sweden registered shares will be forwarded by Euroclear Sweden AB and paid in Swedish crowns. Dividends payable to ADR holders will be forwarded by Citibank N.A. and paid in US dollars.The Board of Directors proposes to the AGM that the dividend be paid on or about 30 March 2021.
Share capital and shareholdingsDuring the fourth quarter of 2020, the conversions of 311 A shares into R shares were recorded in the Finnish trade register. During 2020, the conversions of 2 419 A shares into R shares were recorded in the Finnish trade register.On 31 December 2020, Stora Enso had 176 254 415 A shares and 612 365 572 R shares in issue. The company did not hold its own shares. The total number of Stora Enso shares in issue was 788 619 987 and the total number votes at least 237 490 972.
Events after the periodOn 20 January 2021, the Court of Justice of the European Union has given a preliminary ruling (Lexel AB -case, C-484/19) which might have an impact on Stora Enso’s pending disputes concerning the deduction of interest expenses in Sweden.
This report has been prepared in Finnish, English and Swedish. If there are any variations in the content between the versions, the English version shall govern. This report is unaudited.
Helsinki, 29 January 2021Stora Enso OyjBoard of Directors
Events
Stora Enso Q4/2020 and full year 2020 results 22 (38)

Financials
Basis of PreparationThis unaudited interim financial report has been prepared in accordance with the accounting policies set out in International Accounting Standard 34 on Interim Financial Reporting and in the Group’s Financial Report for 2019 with the exception of new and amended standards applied to the annual periods beginning on 1 January 2020 and changes in accounting principles described below.All figures in this Interim Report have been rounded to the nearest million, unless otherwise stated. Therefore, percentages and figures in this report may not add up precisely to the totals presented and may vary from previously published financial information.
Changes in accounting principlesValuation of Nordic forest assetsStora Enso changed the valuation method for its forest assets and the accounting principle for forest land in the Nordics at the end of 2020. Forest assets are defined as biological assets (standing growing trees) and the related forest land. As a result of the valuation method change, the forest assets in Sweden are valued using a market approach. Due to the change in accounting principle, the forest land in Sweden and Finland are accounted for under the revaluation method instead of cost method.Forest assets in Sweden are valued by using a market approach method based on the forest market transactions in the areas where Stora Enso’s forests are located. In Sweden, reliable market transaction data is available and provides a more transparent and observable valuation basis. The total forest assets net cash flows consist of cash flows related to standing trees (biological assets) and separate cash flows regarding forest land. The standing trees valuation is computed based on a discounted cash flow (DCF) method and using a discount rate implied by the market transactions in accordance IAS 41 Agriculture standard. The discount rate is determined as the rate at which the market transaction prices match the total forest assets cash flows. For forest land, previously accounted at cost, the revaluation method is applied as defined in IAS 16 Property, plant and equipment standard. Forest land is revalued using a DCF method based on future net cash flow streams related to trees to-be-planted in the future, as well as other land related income, such as hunting rights, wind power leases and soil material sales. The discount rate is the same for biological assets and forest land.For the other Nordic forest assets, owned mainly in Finland through Group’s 41% shareholding in the equity accounted investment Tornator, the market approach is not considered to be an accurate valuation method, as reliable market data is not available with enough details. The discounted cash flow method will continue to be used for valuation of biological assets, where the discount rate applied is determined using the weighted average cost of capital method. The forest land, previously accounted at cost, is revalued by using DCF method based on its future net cash flow streams related to trees to-be-planted in the future, as well as other related income.For the plantation forests, there are no changes in accounting principles or in the valuation method, as there is no reliable market transaction data available. Therefore in plantations, biological assets are continued to be valued using DCF method and the related forest land is continued to be accounted at cost. Plantation forest assets are classified as a separate asset class as compared to Nordic forest land to reflect the different nature, usage and characteristics. The main difference is the short-term growing cycle of 6–12 years in plantations versus the long-term growing cycle of 60–100 years in Nordic forests. There are also differences in regeneration methods, forest management and use of the assets for other purposes.The changes in accounting principles of the Swedish forest assets increased the carrying amount of forest land from EUR 324 million to EUR 1 829 million, resulting in EUR 1 504 million increase in forest land, EUR 1 195 increase in Other Comprehensive Income (OCI, revaluation reserve) and EUR 310 million increase in the deferred tax liability. The accounting principle change related to other Nordic forest assets, owned mainly in Finland, is not considered to be material. The increase in forest land assets is recognised in OCI net of deferred taxes and accumulated in revaluation reserve in equity and does not have impact on the income statement. The fair value changes in biological assets continue to be recognised in the income statement. The comparative periods have not been restated and in the comparative periods forest land is measured at cost.The Group has also changed its forest land presentation principles. Previously forest land assets were included in the statement of financial position on the line Property, plant and equipment. In accordance with new presentation principles, forest land assets and corresponding comparative figures are presented on a separate line in the statement of financial position.
Accounting implications of the effects of Covid-19The Group has assessed the potential accounting implications of decreased economic activity as a result of Covid-19 pandemic. The Group has also assessed impact on significant accounting estimates and management judgement and identified certain items, which have been evaluated in more detail. The review of significant estimates and judgement did not result in any material adjustments to the carrying amounts of assets and liabilities or amounts recognised in income statement. IAS 36 requires non-financial assets to be tested for impairment whenever there is an indicator those assets might be impaired and in addition goodwill is tested at least every year. The uncertainty in the economic environment may decrease the reliability of long-term forecasts used in the impairment testing models. Based on the current estimates of expected performance, no impairment needs were identified at the end of the quarter.
Financials
Stora Enso Q4/2020 and full year 2020 results 23 (38)
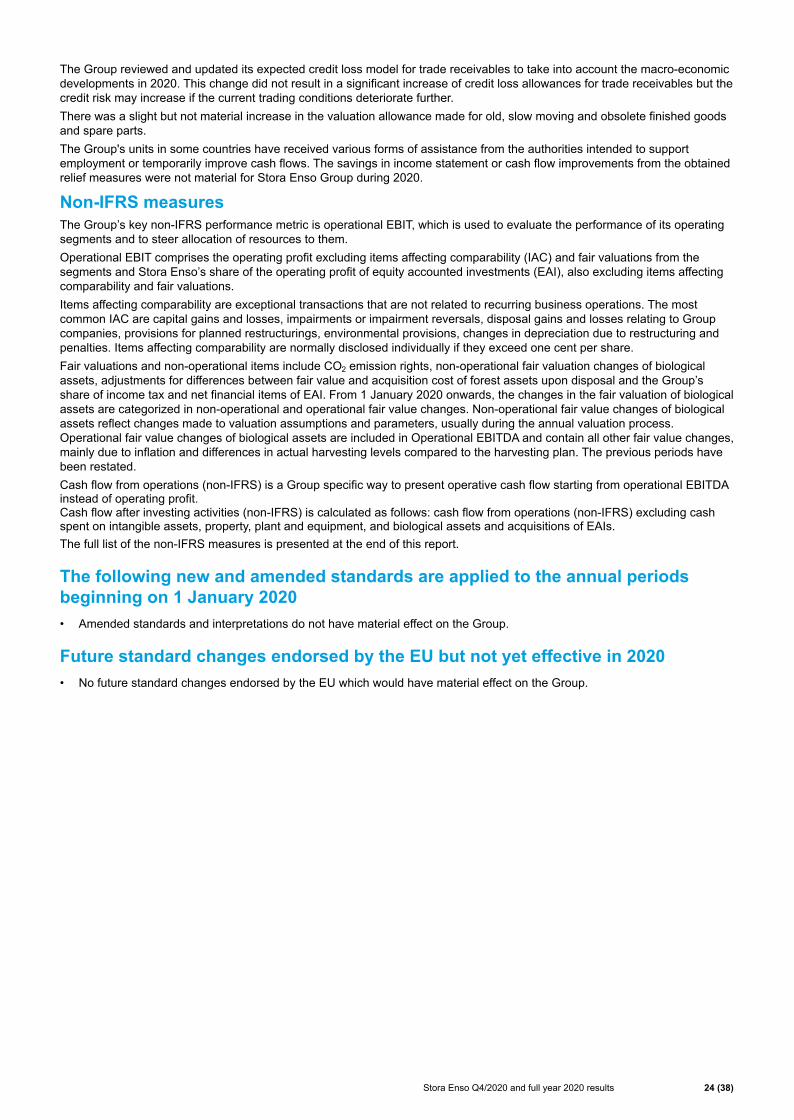
The Group reviewed and updated its expected credit loss model for trade receivables to take into account the macro-economic developments in 2020. This change did not result in a significant increase of credit loss allowances for trade receivables but the credit risk may increase if the current trading conditions deteriorate further.There was a slight but not material increase in the valuation allowance made for old, slow moving and obsolete finished goods and spare parts.The Group's units in some countries have received various forms of assistance from the authorities intended to support employment or temporarily improve cash flows. The savings in income statement or cash flow improvements from the obtained relief measures were not material for Stora Enso Group during 2020.
Non-IFRS measuresThe Group’s key non-IFRS performance metric is operational EBIT, which is used to evaluate the performance of its operating segments and to steer allocation of resources to them. Operational EBIT comprises the operating profit excluding items affecting comparability (IAC) and fair valuations from the segments and Stora Enso’s share of the operating profit of equity accounted investments (EAI), also excluding items affecting comparability and fair valuations. Items affecting comparability are exceptional transactions that are not related to recurring business operations. The most common IAC are capital gains and losses, impairments or impairment reversals, disposal gains and losses relating to Group companies, provisions for planned restructurings, environmental provisions, changes in depreciation due to restructuring and penalties. Items affecting comparability are normally disclosed individually if they exceed one cent per share. Fair valuations and non-operational items include CO2 emission rights, non-operational fair valuation changes of biological assets, adjustments for differences between fair value and acquisition cost of forest assets upon disposal and the Group’s share of income tax and net financial items of EAI. From 1 January 2020 onwards, the changes in the fair valuation of biological assets are categorized in non-operational and operational fair value changes. Non-operational fair value changes of biological assets reflect changes made to valuation assumptions and parameters, usually during the annual valuation process. Operational fair value changes of biological assets are included in Operational EBITDA and contain all other fair value changes, mainly due to inflation and differences in actual harvesting levels compared to the harvesting plan. The previous periods have been restated. Cash flow from operations (non-IFRS) is a Group specific way to present operative cash flow starting from operational EBITDA instead of operating profit. Cash flow after investing activities (non-IFRS) is calculated as follows: cash flow from operations (non-IFRS) excluding cash spent on intangible assets, property, plant and equipment, and biological assets and acquisitions of EAIs. The full list of the non-IFRS measures is presented at the end of this report.
The following new and amended standards are applied to the annual periods beginning on 1 January 2020• Amended standards and interpretations do not have material effect on the Group.
Future standard changes endorsed by the EU but not yet effective in 2020• No future standard changes endorsed by the EU which would have material effect on the Group.
Stora Enso Q4/2020 and full year 2020 results 24 (38)
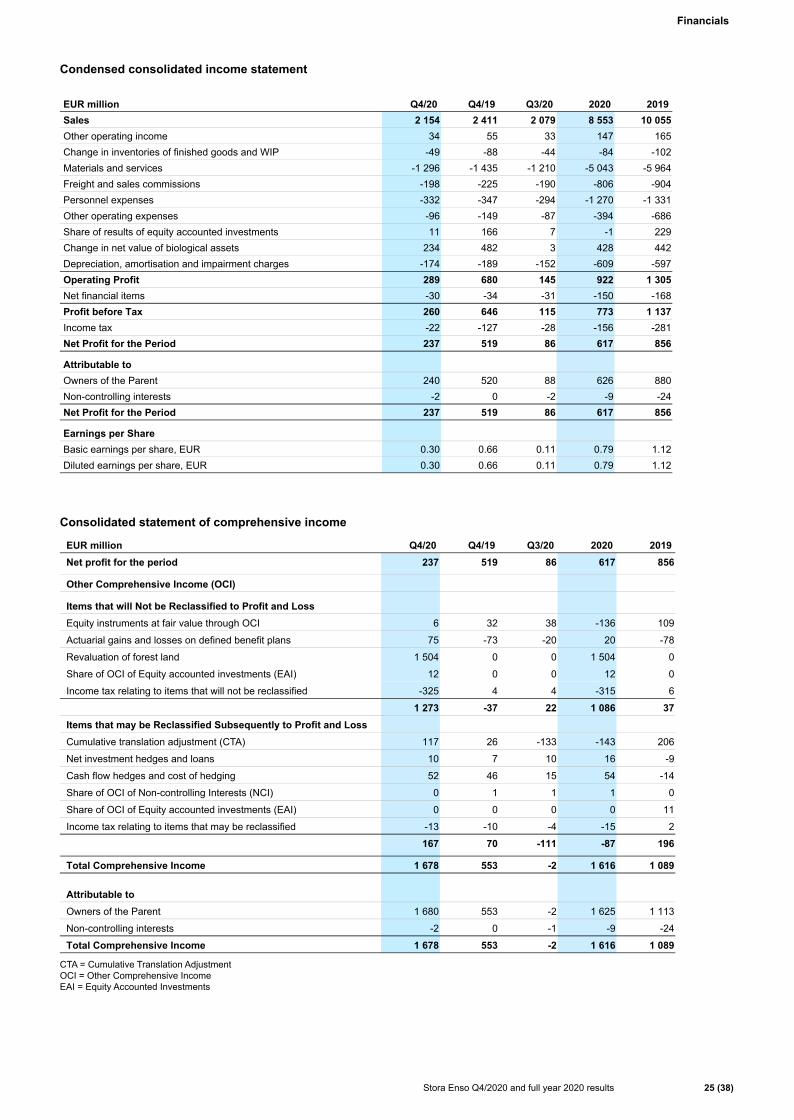
Condensed consolidated income statement
EUR million Q4/20 Q4/19 Q3/20 2020 2019Sales 2 154 2 411 2 079 8 553 10 055 Other operating income 34 55 33 147 165 Change in inventories of finished goods and WIP -49 -88 -44 -84 -102 Materials and services -1 296 -1 435 -1 210 -5 043 -5 964 Freight and sales commissions -198 -225 -190 -806 -904 Personnel expenses -332 -347 -294 -1 270 -1 331 Other operating expenses -96 -149 -87 -394 -686 Share of results of equity accounted investments 11 166 7 -1 229 Change in net value of biological assets 234 482 3 428 442 Depreciation, amortisation and impairment charges -174 -189 -152 -609 -597 Operating Profit 289 680 145 922 1 305 Net financial items -30 -34 -31 -150 -168 Profit before Tax 260 646 115 773 1 137 Income tax -22 -127 -28 -156 -281 Net Profit for the Period 237 519 86 617 856
Attributable toOwners of the Parent 240 520 88 626 880 Non-controlling interests -2 0 -2 -9 -24 Net Profit for the Period 237 519 86 617 856
Earnings per ShareBasic earnings per share, EUR 0.30 0.66 0.11 0.79 1.12 Diluted earnings per share, EUR 0.30 0.66 0.11 0.79 1.12
Consolidated statement of comprehensive income
EUR million Q4/20 Q4/19 Q3/20 2020 2019Net profit for the period 237 519 86 617 856
Other Comprehensive Income (OCI)
Items that will Not be Reclassified to Profit and LossEquity instruments at fair value through OCI 6 32 38 -136 109
Actuarial gains and losses on defined benefit plans 75 -73 -20 20 -78
Revaluation of forest land 1 504 0 0 1 504 0
Share of OCI of Equity accounted investments (EAI) 12 0 0 12 0
Income tax relating to items that will not be reclassified -325 4 4 -315 6
1 273 -37 22 1 086 37 Items that may be Reclassified Subsequently to Profit and LossCumulative translation adjustment (CTA) 117 26 -133 -143 206
Net investment hedges and loans 10 7 10 16 -9
Cash flow hedges and cost of hedging 52 46 15 54 -14
Share of OCI of Non-controlling Interests (NCI) 0 1 1 1 0
Share of OCI of Equity accounted investments (EAI) 0 0 0 0 11
Income tax relating to items that may be reclassified -13 -10 -4 -15 2
167 70 -111 -87 196
Total Comprehensive Income 1 678 553 -2 1 616 1 089
Attributable toOwners of the Parent 1 680 553 -2 1 625 1 113
Non-controlling interests -2 0 -1 -9 -24
Total Comprehensive Income 1 678 553 -2 1 616 1 089
CTA = Cumulative Translation Adjustment OCI = Other Comprehensive Income EAI = Equity Accounted Investments
Financials
Stora Enso Q4/2020 and full year 2020 results 25 (38)
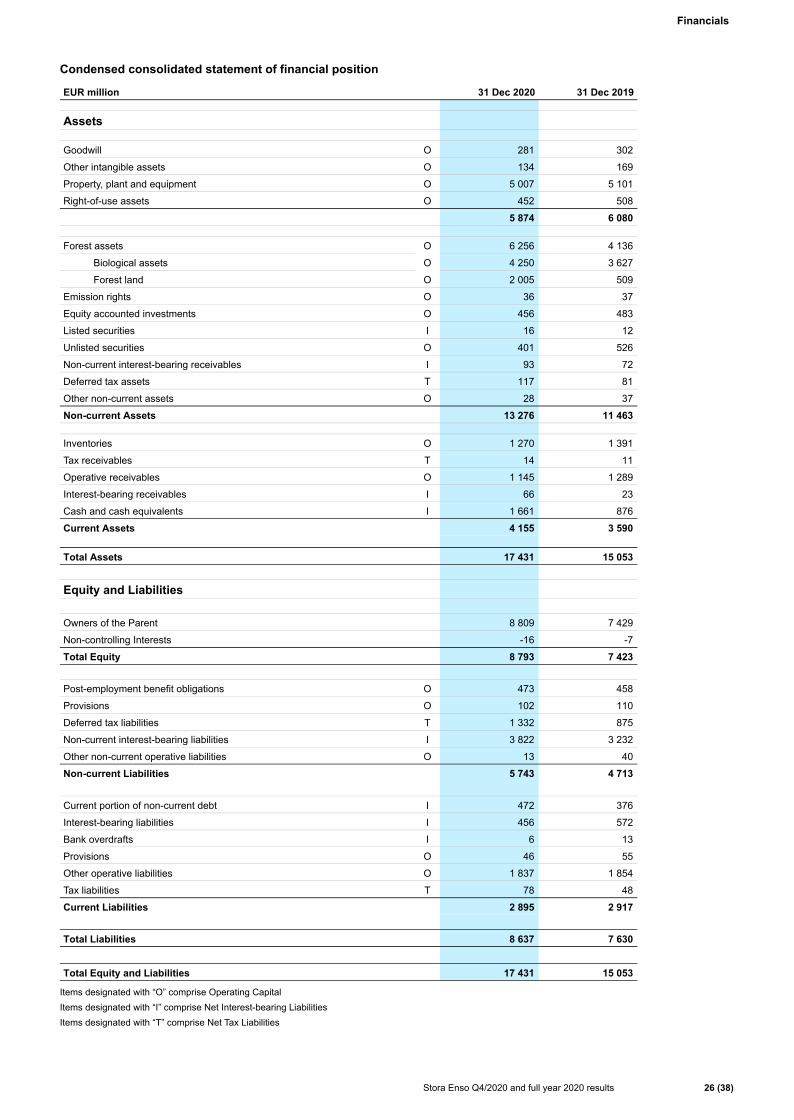
Condensed consolidated statement of financial position
EUR million 31 Dec 2020 31 Dec 2019
Assets
Goodwill O 281 302
Other intangible assets O 134 169
Property, plant and equipment O 5 007 5 101
Right-of-use assets O 452 508
5 874 6 080
Forest assets O 6 256 4 136
Biological assets O 4 250 3 627
Forest land O 2 005 509
Emission rights O 36 37
Equity accounted investments O 456 483
Listed securities I 16 12
Unlisted securities O 401 526
Non-current interest-bearing receivables I 93 72
Deferred tax assets T 117 81
Other non-current assets O 28 37
Non-current Assets 13 276 11 463
Inventories O 1 270 1 391
Tax receivables T 14 11
Operative receivables O 1 145 1 289
Interest-bearing receivables I 66 23
Cash and cash equivalents I 1 661 876
Current Assets 4 155 3 590
Total Assets 17 431 15 053
Equity and Liabilities
Owners of the Parent 8 809 7 429
Non-controlling Interests -16 -7
Total Equity 8 793 7 423
Post-employment benefit obligations O 473 458
Provisions O 102 110
Deferred tax liabilities T 1 332 875
Non-current interest-bearing liabilities I 3 822 3 232
Other non-current operative liabilities O 13 40
Non-current Liabilities 5 743 4 713
Current portion of non-current debt I 472 376
Interest-bearing liabilities I 456 572
Bank overdrafts I 6 13
Provisions O 46 55
Other operative liabilities O 1 837 1 854
Tax liabilities T 78 48
Current Liabilities 2 895 2 917
Total Liabilities 8 637 7 630
Total Equity and Liabilities 17 431 15 053
Items designated with “O” comprise Operating Capital Items designated with “I” comprise Net Interest-bearing Liabilities Items designated with “T” comprise Net Tax Liabilities
Financials
Stora Enso Q4/2020 and full year 2020 results 26 (38)
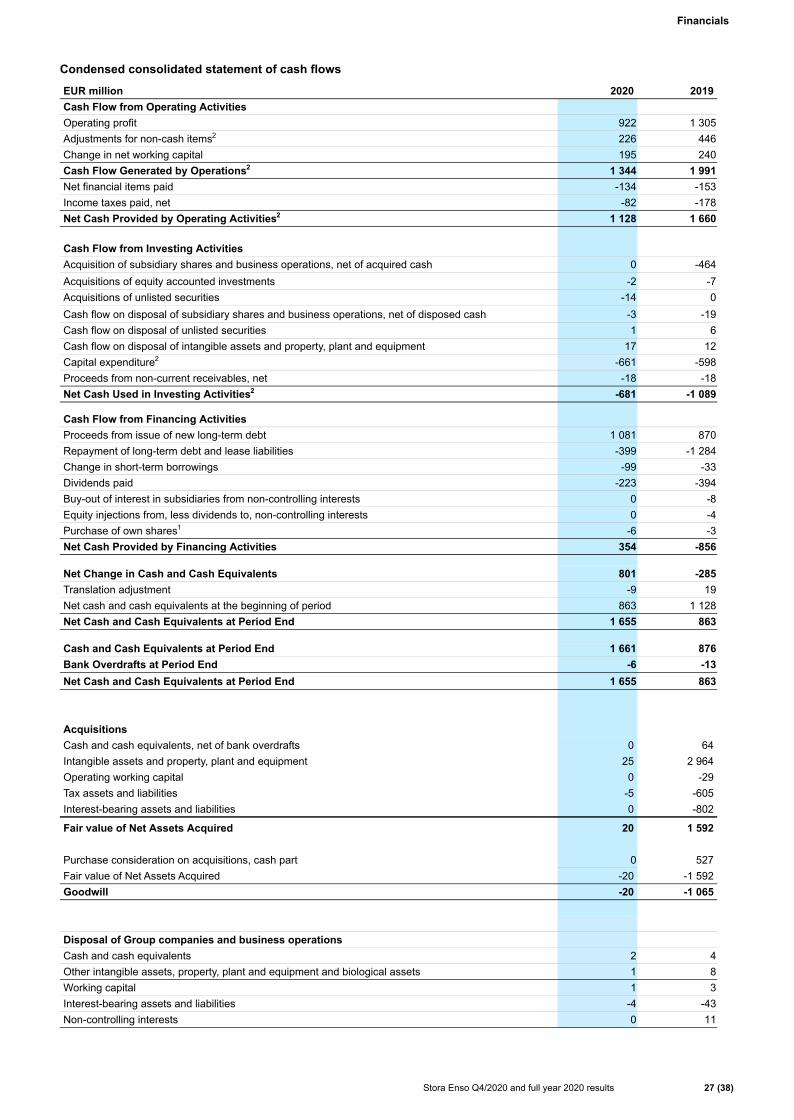
Condensed consolidated statement of cash flows
EUR million 2020 2019Cash Flow from Operating ActivitiesOperating profit 922 1 305 Adjustments for non-cash items2 226 446 Change in net working capital 195 240 Cash Flow Generated by Operations2 1 344 1 991 Net financial items paid -134 -153 Income taxes paid, net -82 -178 Net Cash Provided by Operating Activities2 1 128 1 660
Cash Flow from Investing ActivitiesAcquisition of subsidiary shares and business operations, net of acquired cash 0 -464 Acquisitions of equity accounted investments -2 -7 Acquisitions of unlisted securities -14 0 Cash flow on disposal of subsidiary shares and business operations, net of disposed cash -3 -19 Cash flow on disposal of unlisted securities 1 6 Cash flow on disposal of intangible assets and property, plant and equipment 17 12 Capital expenditure2 -661 -598 Proceeds from non-current receivables, net -18 -18 Net Cash Used in Investing Activities2 -681 -1 089
Cash Flow from Financing ActivitiesProceeds from issue of new long-term debt 1 081 870 Repayment of long-term debt and lease liabilities -399 -1 284 Change in short-term borrowings -99 -33 Dividends paid -223 -394 Buy-out of interest in subsidiaries from non-controlling interests 0 -8 Equity injections from, less dividends to, non-controlling interests 0 -4 Purchase of own shares1 -6 -3 Net Cash Provided by Financing Activities 354 -856
Net Change in Cash and Cash Equivalents 801 -285 Translation adjustment -9 19 Net cash and cash equivalents at the beginning of period 863 1 128 Net Cash and Cash Equivalents at Period End 1 655 863
Cash and Cash Equivalents at Period End 1 661 876 Bank Overdrafts at Period End -6 -13 Net Cash and Cash Equivalents at Period End 1 655 863
AcquisitionsCash and cash equivalents, net of bank overdrafts 0 64Intangible assets and property, plant and equipment 25 2 964Operating working capital 0 -29Tax assets and liabilities -5 -605Interest-bearing assets and liabilities 0 -802
Fair value of Net Assets Acquired 20 1 592
Purchase consideration on acquisitions, cash part 0 527Fair value of Net Assets Acquired -20 -1 592Goodwill -20 -1 065
Disposal of Group companies and business operationsCash and cash equivalents 2 4 Other intangible assets, property, plant and equipment and biological assets 1 8 Working capital 1 3 Interest-bearing assets and liabilities -4 -43 Non-controlling interests 0 11
Financials
Stora Enso Q4/2020 and full year 2020 results 27 (38)
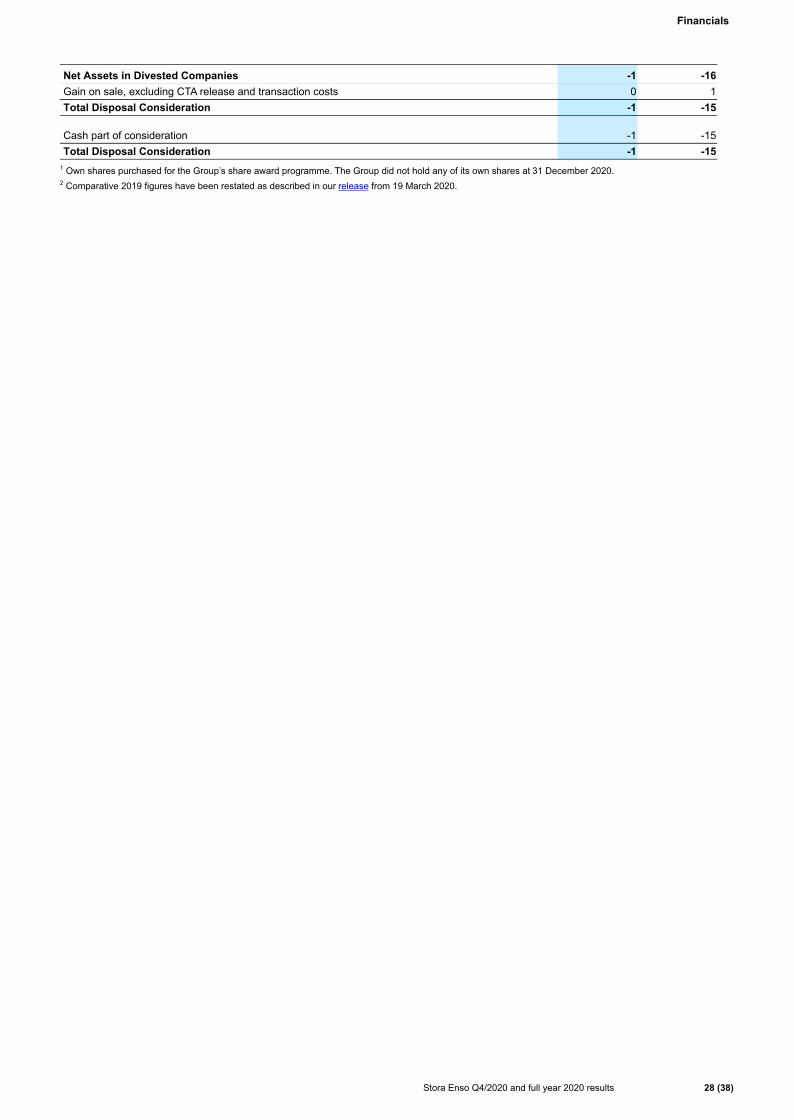
Net Assets in Divested Companies -1 -16 Gain on sale, excluding CTA release and transaction costs 0 1 Total Disposal Consideration -1 -15
Cash part of consideration -1 -15 Total Disposal Consideration -1 -15
1 Own shares purchased for the Group’s share award programme. The Group did not hold any of its own shares at 31 December 2020.2 Comparative 2019 figures have been restated as described in our release from 19 March 2020.
Financials
Stora Enso Q4/2020 and full year 2020 results 28 (38)

Statement of changes in equity
Fair Value Reserve
EUR millionShare
Capital
Share Premium
and Reserve fund
Invested Non-
Restricted Equity Fund
Treasury Shares
Step Acquisition Revaluation
Surplus
Equity instruments through OCI
Cash Flow Hedges
Revaluation reserve
OCI of Equity Accounted
Investments
CTA and Net Investment
Hedges and loans
Retained Earnings
Attributable to Owners of
the Parent
Non-controlling
Interests TotalBalance at 1 January 2019 1 342 77 633 — 4 304 -7 — -11 -335 4 706 6 714 18 6 732 Net profit for the period — — — — — — — — — — 880 880 -24 856 OCI before tax — — — — — 109 -14 — 11 197 -78 225 — 225 Income tax relating to OCI — — — — — — 1 — — 1 6 9 — 9 Total Comprehensive Income — — — — — 109 -13 — 11 198 808 1 113 -24 1 089 Dividend — — — — — — — — — — -394 -394 -1 -395 Acquisitions and disposals — — — — — — — — — — — — 1 1 Purchase of treasury shares — — — -4 — — — — — — — -4 — -4 Share-based payments — — — 4 — — — — — — -3 — — — Balance at 31 December 2019 1 342 77 633 — 4 413 -20 — — -136 5 116 7 429 -7 7 423 Net profit for the period — — — — — — — — — — 626 626 -9 617 OCI before tax — — — — — -136 54 1 504 12 -127 20 1 328 1 1 329 Income tax relating to OCI — — — — — -1 -11 -310 — -4 -5 -330 — -330 Total Comprehensive Income — — — — — -137 43 1 195 12 -131 642 1 625 -9 1 616 Dividend — — — — — — — — — — -237 -237 — -237 Acquisitions and disposals — — — — -4 — — — — — 4 — — — Purchase of treasury shares — — — -6 — — — — — — — -6 — -6 Share-based payments — — — 6 — — — — — — -8 -3 — -3 Balance at 31 December 2020 1 342 77 633 — — 277 23 1 195 12 -267 5 518 8 809 -16 8 793
CTA = Cumulative Translation Adjustment OCI = Other Comprehensive Income NCI = Non-controlling Interests
Financials

Goodwill, other intangible assets, property, plant and equipment, right-of-use assets and forest assets
EUR million 2020 2019Carrying value at 1 January 10 216 6 187
Additions in right-of-use assets due to adoption of IFRS 16 0 530
Additions in tangible and intangible assets 589 550
Additions in right-of-use assets 39 29
Additions in biological assets 59 77
Depletion of capitalised silviculture costs -41 -51
Acquisition of subsidiary companies 5 2 988
Disposals -13 -11
Disposals of subsidiary companies -3 -8
Depreciation and impairment -609 -597
Fair valuation of forest assets 1 973 493
Translation difference and other -86 29
Statement of Financial Position Total 12 130 10 216
The value of forest assets, including leased land and Stora Enso's share of Tornator's forest assets, increased by EUR 2 139 million in 2020. The total forest asset value, including leased forest land, was EUR 7 314 (5 175) million. The increase during 2020 in total forest asset value is mainly related to valuation and accounting principles changes. More detailed information related to the accounting principle change is presented in the chapter Basis of Preparation.The fair value of biological assets, including Stora Enso's share of Tornator, increased by EUR 648 million in 2020. The biological asset fair value was EUR 5 028 (4 380) million. The fair value changes in biological assets are recognised in the income statement.The value of forest land, including leased land and Stora Enso's share of Tornator, increased by EUR 1 491 million in 2020. The value of forest land was EUR 2 286 (795) million. The increase in forest land assets is recognised in OCI net of deferred taxes and accumulated in revaluation reserve in equity and does not have impact on the income statement.
Borrowings
EUR million 31 Dec 2020 31 Dec 2019Bond loans 2 789 1 978
Loans from credit institutions 1 083 1 162
Lease liabilities 397 440
Long-term derivative financial liabilities 21 24
Other non-current liabilities 5 5
Non-current interest bearing liabilities including current portion 4 294 3 608 Short-term borrowings 413 516
Interest payable 35 33
Short-term derivative financial liabilities 9 23
Bank overdrafts 6 13
Total Interest-bearing Liabilities 4 756 4 192
EUR million 2020 2019Carrying value at 1 January 4 192 3 344
Additions in lease liabilities due to adoption of IFRS 16 0 525
Acquisition of subsidiary companies 0 793
Proceeds of new long-term debt 1 081 870
Additions in lease liabilities 39 29
Repayment of long-term debt -333 -1 216
Repayment of lease liabilities and interest -85 -88
Change in short-term borrowings and interest payable -101 -58
Change in derivative financial liabilities -17 -21
Translation differences and other -20 13
Total Interest-bearing Liabilities 4 756 4 192
Financials
Stora Enso Q4/2020 and full year 2020 results 30 (38)

Commitments and contingencies
EUR million 31 Dec 2020 31 Dec 2019On Own BehalfMortgages 0 2 Other commitments 14 3 On Behalf of Equity Accounted InvestmentsGuarantees 2 4 On Behalf of OthersGuarantees 6 6 Other commitments 36 13 Total 58 28
Mortgages 0 2 Guarantees 8 10 Other commitments 50 17 Total 58 28
Capital commitments
EUR million 31 Dec 2020 31 Dec 2019
Total 207 223
The Group’s direct capital expenditure contracts include the Group’s share of direct capital expenditure contracts in joint operations.
Sales by segment – total
EUR million 2020 Q4/20 Q3/20 Q2/20 Q1/20 2019 Q4/19 Q3/19 Q2/19 Q1/19Packaging Materials 3 115 759 771 821 764 3 254 770 805 848 832 Packaging Solutions 594 160 145 141 149 698 170 167 181 180 Biomaterials 1 193 314 305 288 286 1 464 341 331 394 398 Wood Products 1 386 360 341 347 338 1 569 374 380 412 403 Forest 2 046 527 457 519 542 2 321 558 518 603 642 Paper 1 979 476 468 445 591 2 856 694 690 712 760 Other 928 231 230 221 246 1 076 262 268 265 280 Inter-segment sales -2 687 -673 -637 -669 -709 -3 184 -757 -759 -807 -861 Total 8 553 2 154 2 079 2 114 2 207 10 055 2 411 2 402 2 608 2 635
Comparative 2019 figures have been restated as described in our release from 19 March 2020. 2019 sales for Packaging Materials, Packaging Solutions and Inter-Segment sales have been recalculated versus the amounts presented in the release.
Sales by segment – external
EUR million 2020 Q4/20 Q3/20 Q2/20 Q1/20 2019 Q4/19 Q3/19 Q2/19 Q1/19Packaging Materials 2 999 729 742 793 735 3 091 732 767 805 787
Packaging Solutions 578 156 140 137 145 680 165 163 177 175
Biomaterials 1 025 278 267 248 233 1 193 284 268 323 318
Wood Products 1 295 335 322 323 316 1 457 349 356 382 370
Forest 698 182 146 175 194 790 193 164 210 224
Paper 1 931 466 455 432 578 2 800 681 675 699 745
Other 27 8 6 6 7 45 7 10 13 15
Total 8 553 2 154 2 079 2 114 2 207 10 055 2 411 2 402 2 608 2 635
Comparative 2019 figures have been restated as described in our release from 19 March 2020.
Financials
Stora Enso Q4/2020 and full year 2020 results 31 (38)

Disaggregation of revenue
EUR million 2020 Q4/20 Q3/20 Q2/20 Q1/20 2019 Q4/19 Q3/19 Q2/19 Q1/19Product sales 8 460 2 131 2 056 2 087 2 187 9 935 2 389 2 372 2 567 2 608 Service sales 93 23 23 27 20 120 22 31 40 27 Total 8 553 2 154 2 079 2 114 2 207 10 055 2 411 2 402 2 608 2 635
Sales comprise mainly sales of products and are typically recognised at a point in time when Stora Enso transfers control of products to a customer.
Product and service sales by segment
EUR million 2020 Q4/20 Q3/20 Q2/20 Q1/20 2019 Q4/19 Q3/19 Q2/19 Q1/19Packaging Materials Product sales 3 103 755 769 819 761 3 240 767 801 844 828
Service sales 11 4 2 2 3 14 3 4 4 4 Packaging Solutions Product sales 593 160 145 141 148 696 169 166 181 180
Service sales 1 0 0 0 0 2 1 0 0 0
Biomaterials Product sales 1 164 309 297 281 277 1 436 336 324 386 391
Service sales 29 5 7 8 8 27 5 8 8 7
Wood Products Product sales 1 362 354 334 341 334 1 550 368 375 406 400
Service sales 24 6 7 6 5 19 6 5 6 3
Forest Product sales 2 019 521 449 510 539 2 276 551 503 586 636
Service sales 27 7 7 10 3 45 7 15 17 6
Paper Product sales 1 971 476 465 442 588 2 842 690 687 708 757
Service sales 8 0 2 4 2 14 4 3 4 3
Other Product sales 139 37 32 27 44 183 42 46 41 54
Service sales 789 194 198 194 202 892 220 222 224 226
Inter-segment sales Product sales -1 893 -480 -436 -473 -504 -2 288 -533 -532 -585 -638
Service sales -795 -193 -201 -196 -204 -895 -224 -227 -222 -223
Total 8 553 2 154 2 079 2 114 2 207 10 055 2 411 2 402 2 608 2 635
Comparative 2019 figures have been restated as described in our release from 19 March 2020. 2019 sales for Packaging Materials, Packaging Solutions and Inter-Segment sales have been recalculated versus the amounts presented in the release.
Operational EBIT by segment
EUR million 2020 Q4/20 Q3/20 Q2/20 Q1/20 2019 Q4/19 Q3/19 Q2/19 Q1/19Packaging Materials 403 67 111 130 95 339 57 86 98 98 Packaging Solutions 34 10 8 8 8 46 10 15 14 8 Biomaterials 9 -12 10 19 -7 233 -12 39 103 103 Wood Products 114 33 38 26 18 105 14 27 35 29 Forest 164 41 38 41 44 99 31 25 11 33 Paper -38 -5 -16 -39 21 213 44 50 50 69 Other -35 -16 -13 -7 0 -32 -19 2 -11 -4 Operational EBIT 650 118 175 178 180 1 003 124 245 299 335 Fair valuations and non-operational items1 362 217 -4 55 94 494 588 -39 -37 -18 Items affecting comparability -90 -45 -25 -7 -12 -192 -32 -36 -120 -4 Operating Profit (IFRS) 922 289 145 226 262 1 305 680 170 142 313 Net financial items -150 -30 -31 -36 -53 -168 -34 -55 -48 -31 Profit before Tax 773 260 115 190 209 1 137 646 115 93 282 Income tax expense -156 -22 -28 -46 -59 -281 -127 -57 -41 -56 Net Profit 617 237 86 144 149 856 519 59 52 226
1 Fair valuations and non-operational items include CO2 emission rights, non-operational fair valuation changes of biological assets, adjustments for differences between fair value and acquisition cost of forest assets upon disposal and the Group’s share of income tax and net financial items of EAI. From 1 January 2020 onwards, the changes in the fair valuation of biological assets are categorized in non-operational and operational fair value changes. Non-operational fair value changes of biological assets reflect changes made to valuation assumptions and parameters, usually during the annual valuation process. Operational fair value changes of biological assets are included in Operational EBITDA and contain all other fair value changes, mainly due to inflation and differences in actual harvesting levels compared to the harvesting plan. The previous periods have been restated.
Financials
Stora Enso Q4/2020 and full year 2020 results 32 (38)

Items affecting comparability (IAC), fair valuations and non-operational items
EUR million 2020 Q4/20 Q3/20 Q2/20 Q1/20 2019 Q4/19 Q3/19 Q2/19 Q1/19Impairments and impairment reversals -72 -45 -17 -5 -5 -62 -51 -14 6 -3
Restructuring costs excluding impairments -23 -7 -10 -1 -5 -52 -15 -5 -31 -1
Acquisitions and disposals 6 8 0 0 -2 -59 44 -15 -88 0
Other 0 -1 2 -1 0 -19 -9 -2 -8 0
Total IAC on Operating Profit -90 -45 -25 -7 -12 -192 -32 -36 -120 -4 Fair valuations and non-operational items 362 217 -4 55 94 494 588 -39 -37 -18
Total 271 172 -29 48 82 302 556 -75 -157 -22
Items affecting comparability had a negative impact on the operating profit of EUR 45 (negative EUR 32) million. The IACs relate mainly to asset write downs and provisions recognised in Biomaterials division and asset disposal gains recognised in Packaging Materials division.
Fair valuations and non-operational items had a positive net impact on the operating profit of EUR 217 (positive EUR 588) million. The impact came mainly from the biological asset fair valuation increases in Sweden. The biological asset valuation increase (EUR 234 million) was mainly due to lower discount rate used in the valuation model, related to accounting principle change and due to updates to other valuation parameters.
Items affecting comparability (IAC) by segment
EUR million 2020 Q4/20 Q3/20 Q2/20 Q1/20 2019 Q4/19 Q3/19 Q2/19 Q1/19Packaging Materials 0 7 -2 0 -5 6 -3 0 13 -4 Packaging Solutions -6 -1 -5 0 0 -10 -4 -6 0 0 Biomaterials -53 -53 0 0 0 -51 -51 0 0 0 Wood Products -3 0 0 -1 -2 -13 -2 0 -10 0 Forest 0 0 0 0 0 -41 54 -4 -91 0 Paper -21 3 -14 -5 -5 -58 -11 -21 -27 0 Other -7 -1 -5 -1 0 -25 -14 -5 -5 0 IAC on Operating Profit -90 -45 -25 -7 -12 -192 -32 -36 -120 -4 IAC on tax 19 10 5 1 2 13 5 2 6 1 IAC on Net Profit -71 -35 -20 -5 -10 -180 -27 -35 -115 -3
Attributable to:Owners of the Parent -71 -35 -20 -5 -10 -180 -27 -35 -115 -3 Non-controlling interests 0 0 0 0 0 0 0 0 0 0 IAC on Net Profit -71 -35 -20 -5 -10 -180 -27 -35 -115 -3
Fair valuations and non-operational items1 by segment
EUR million 2020 Q4/20 Q3/20 Q2/20 Q1/20 2019 Q4/19 Q3/19 Q2/19 Q1/19Packaging Materials -12 -10 0 -1 -1 7 7 0 0 0 Packaging Solutions 0 0 0 0 0 0 0 0 0 0 Biomaterials 13 10 2 0 1 -2 -1 -2 1 0 Wood Products 0 0 0 0 0 0 0 0 0 0 Forest 360 226 -10 55 89 489 582 -35 -34 -24 Paper 2 -9 4 2 5 -1 1 -3 -3 5 Other -1 0 0 -1 0 1 0 1 -1 0
FV and Non-operational Items on Operating Profit 362 217 -4 55 94 494 588 -39 -37 -18
1 Fair valuations and non-operational items include CO2 emission rights, non-operational fair valuation changes of biological assets, adjustments for differences between fair value and acquisition cost of forest assets upon disposal and the Group’s share of income tax and net financial items of EAI. From 1 January 2020 onwards, the changes in the fair valuation of biological assets are categorized in non-operational and operational fair value changes. Non-operational fair value changes of biological assets reflect changes made to valuation assumptions and parameters, usually during the annual valuation process. Operational fair value changes of biological assets are included in Operational EBITDA and contain all other fair value changes, mainly due to inflation and differences in actual harvesting levels compared to the harvesting plan. The previous periods have been restated.
Financials
Stora Enso Q4/2020 and full year 2020 results 33 (38)

Operating profit/loss by segment
EUR million 2020 Q4/20 Q3/20 Q2/20 Q1/20 2019 Q4/19 Q3/19 Q2/19 Q1/19Packaging Materials 391 64 108 129 89 352 61 86 110 94 Packaging Solutions 28 8 3 8 8 36 6 9 14 8 Biomaterials -31 -55 12 19 -6 180 -65 37 104 103 Wood Products 111 33 38 25 16 92 11 27 25 29 Forest 524 267 28 96 133 547 667 -14 -115 9 Paper -58 -11 -26 -42 21 154 33 26 20 74 Other -42 -17 -17 -9 0 -56 -34 -2 -17 -4 Operating Profit (IFRS) 922 289 145 226 262 1 305 680 170 142 313 Net financial items -150 -30 -31 -36 -53 -168 -34 -55 -48 -31 Profit before Tax 773 260 115 190 209 1 137 646 115 93 282 Income tax expense -156 -22 -28 -46 -59 -281 -127 -57 -41 -56 Net Profit 617 237 86 144 149 856 519 59 52 226
Key exchange rates for the euro
One Euro is Closing Rate Average Rate (Year-to-date)31 Dec 2020 31 Dec 2019 31 Dec 2020 31 Dec 2019
SEK 10.0343 10.4468 10.4881 10.5868USD 1.2271 1.1234 1.1413 1.1195GBP 0.8990 0.8508 0.8892 0.8773
Transaction risk and hedges in main currencies as at 31 December 2020
EUR million EUR USD SEK GBP Other TotalSales during 2020 4 704 1 667 996 278 908 8 553 Costs during 2020 -3 902 -475 -1 898 -14 -1 161 -7 449 Net amount 802 1 192 -901 264 -253 1 104 Estimated annual operative transaction risk exposure from cash flows for the next 12 months1 920 1 330 -197 222 Cash flow hedges for the next 12 months as at 31 December 2020 -433 -629 94 -97 Hedge ratio for the next 12 months as at 31 December 2020 47% 47% 48% 44%Effect of 10% currency strengthening on Operational EBIT2 92 133 -20 22
Sales and costs figures in the above table also include transactions denominated in the functional currencies of Stora Enso group companies whereas those flows do not constitute a foreign-currency transaction risk exposure for cash flow hedging purposes.1 Cash flows are forecasted highly probable foreign exchange net operating cash flows. The exposure presented in the EUR column relates to operative transaction risk exposure from EUR denominated cash flows in Group companies located in Sweden, Czech Republic and Poland with functional currency other than EUR.2 The sensitivity is based on the estimated net operating cash flow for the next 12 months. The calculation does not take into account currency hedges and assumes no other changes occur than exchange rate movement in an exposure currency. A currency weakening would have the opposite impact.
Financials
Stora Enso Q4/2020 and full year 2020 results 34 (38)

Fair Values of Financial InstrumentsThe Group uses the following hierarchy for determining and disclosing the fair value of financial instruments by valuation technique:• Level 1: quoted (unadjusted) prices in active markets for identical assets or liabilities;• Level 2: other techniques, for which all inputs that have a significant effect on the recorded fair value are observable, either
directly or indirectly;• Level 3: techniques which use inputs that have a significant effect on the recorded fair values that are not based on
observable market data.The valuation techniques are described in more detail in the Group’s Financial Report. The instruments carried at fair value in the following tables are measured at fair value on a recurring basis.
Carrying amounts of financial assets and liabilities by measurement and fair value categories: 31 December 2020Fair value
Fair value through Total Fair value hierarchyAmortised through income carrying
EUR million cost OCI statement amount Fair value Level 1 Level 2 Level 3Financial assetsListed securities — 16 — 16 16 16 — — Unlisted securities — 394 7 401 401 — — 401 Non-current interest-bearing receivables 91 2 — 93 93 — 2 — Trade and other operative receivables 814 44 — 858 858 — 44 — Short-term interest-bearing receivables 1 60 6 66 66 — 65 — Cash and cash equivalents 1 661 — — 1 661 1 661 — — — Total 2 566 515 13 3 094 3 094 16 111 401
Fair valueFair value through Total Fair value hierarchy
Amortised through income carryingEUR million cost OCI statement amount Fair value Level 1 Level 2 Level 3Financial liabilitiesNon-current interest-bearing liabilities 3 801 19 2 3 822 4 233 — 21 — Current portion of non-current debt 472 — — 472 472 — — — Short-term interest-bearing liabilities 444 11 1 456 456 — 12 — Trade and other operative payables 1 547 — — 1 547 1 547 — — — Bank overdrafts 6 — — 6 6 — — — Total 6 270 30 3 6 303 6 715 — 33 —
Hedge accounted derivatives are presented under fair value through OCI and non-hedge accounted derivatives under fair value through income statement categories in the above tables for financial assets and liabilities.
Financials
Stora Enso Q4/2020 and full year 2020 results 35 (38)

Carrying amounts of financial assets and liabilities by measurement and fair value categories: 31 December 2019Fair value
Fair value through Total Fair value hierarchyAmortised through income carrying
EUR million cost OCI statement amount Fair value Level 1 Level 2 Level 3Financial assetsListed securities — 12 — 12 12 12 — — Unlisted securities — 522 3 526 526 — — 526 Non-current interest-bearing receivables 71 1 — 72 72 — 1 — Trade and other operative receivables 930 38 — 968 968 — 38 — Short-term interest-bearing receivables 3 17 3 23 23 — 20 — Cash and cash equivalents 876 — — 876 876 — — — Total 1 879 591 7 2 477 2 477 12 59 526
Fair valueFair value through Total Fair value hierarchy
Amortised through income carryingEUR million cost OCI statement amount Fair value Level 1 Level 2 Level 3Financial liabilitiesNon-current interest-bearing liabilities 3 207 21 4 3 232 3 549 — 24 — Current portion of non-current debt 376 — — 376 376 — — — Short-term interest-bearing liabilities 546 24 1 572 572 — 26 — Trade and other operative payables 1 574 — 25 1 598 1 598 — — 25 Bank overdrafts 13 — — 13 13 — — — Total 5 716 45 30 5 790 6 107 — 50 25
Hedge accounted derivatives are presented under fair value through OCI and non-hedge accounted derivatives under fair value through income statement categories in the above tables for financial assets and liabilities.
Reconciliation of level 3 fair value measurement of financial assets and liabilities: 31 December 2020
EUR million 2020 2019Financial assetsOpening balance at 1 January 526 422 Gains/losses recognised in income statement 1 0 Gains/losses recognised in other comprehensive income -140 109 Additions 15 0 Disposals -1 -5 Closing balance 401 526
EUR million 2020 2019Financial liabilitiesOpening balance at 1 January -25 -21 Gains/losses recognised in income statement 0 -4 Deductions 25 0 Closing balance 0 -25
Level 3 Financial AssetsThe level 3 financial assets consist mainly of PVO shares for which the valuation method is described in more detail in the Annual Report. The valuation is most sensitive to changes in electricity prices and discount rates. The discount rate of 3.69% used in the valuation model is determined using the weighted average cost of capital method. A +/- 5% change in the electricity price used in the DCF would change the valuation by EUR +43 million and -37 million, respectively. A +/- percentage point change in the discount rate would change the valuation by EUR -30 million and +90 million, respectively.
Financials
Stora Enso Q4/2020 and full year 2020 results 36 (38)

Stora Enso sharesTrading volume
Helsinki StockholmA share R share A share R share
October 131 253 44 167 134 435 623 12 437 037November 73 409 37 522 685 299 223 11 918 779December 162 159 34 940 871 343 528 9 565 727Total 366 821 116 630 690 1 078 374 33 921 543
Closing price
Helsinki, EUR Stockholm, SEKA share R share A share R share
October 13,15 12,53 135,40 130,55November 14,70 14,17 147,80 144,05December 15,90 15,65 159,20 157,30
Average number of shares
Million Q4/20 Q4/19 Q3/20 2020 2019Periodic 788.6 788.6 788.6 788.6 788.6 Cumulative 788.6 788.6 788.6 788.6 788.6 Cumulative, diluted 788.9 789.4 788.9 789.2 789.5
Calculation of key figuresOperational return on capital employed, operational ROCE (%)
100 x Annualised operational EBIT Capital employed1 2
Operational return on operating capital, operational ROOC (%)
100 x Annualised operational EBIT Operating capital 2
Return on equity, ROE (%) 100 x Net profit/loss for the period Total equity2
Net interest-bearing liabilities Interest-bearing liabilities – interest-bearing assetsNet debt/equity ratio Net interest-bearing liabilities
Equity3
Earnings per share (EPS) Net profit/loss for the period3 Average number of shares
Operational EBIT Operating profit/loss excluding items affecting comparability (IAC) and fair valuations of the segments and Stora Enso’s share of operating profit/loss excluding IAC and fair valuations of its equity accounted investments (EAI)
Operational EBITDA Operating profit/loss excluding silviculture costs and damage to forests, fixed asset depreciation and impairment, IACs and fair valuations. The definition includes the respective items of subsidiaries, joint arrangements and equity accounted investments.
Net debt/last 12 months’ operational EBITDA ratio
Net interest-bearing liabilities LTM operational EBITDA
Fixed costs Maintenance, personnel and other administration type of costs, excluding IAC and fair valuations
Last 12 months (LTM) 12 months prior to the end of reporting periodTRI Total recordable incident rate = number of incidents per one million hours worked
1 Capital employed = Operating capital – Net tax liabilities 2 Average for the financial period 3 Attributable to the owners of the Parent
List of non-IFRS measures
Operational EBITDAOperational EBITDA marginOperational EBITOperational EBIT marginProfit before tax excl. IAC and FVCapital expenditureCapital expenditure excl. investments in biological assetsCapital employed
Depreciation and impairment charges excl. IACOperational ROCEEarnings per share (EPS), excl. FVNet debt/last 12 months’ operational EBITDA ratioFixed costs to salesOperational ROOCCash flow from operationsCash flow after investing activities
Financials
Stora Enso Q4/2020 and full year 2020 results 37 (38)

Contact information
Stora Enso Oyj Stora Enso AB storaenso.comP.O.Box 309 P.O.Box 70395 storaenso.com/investorsFI-00101 Helsinki, Finland SE-107 24 Stockholm, SwedenVisiting address: Kanavaranta 1 Visiting address: World Trade CenterTel. +358 2046 131 Klarabergsviadukten 70
Tel. +46 1046 46 000
For further information, please contact:Seppo Parvi, CFO, tel. +358 2046 21205Ulla Paajanen, SVP, Investor Relations, tel. +358 40 763 8767Ulrika Lilja, EVP, Communications and Marketing, tel. +46 72 221 9228
Stora Enso’s Q1 results will be published on
23 April 2021
Part of the bioeconomy, Stora Enso is a leading global provider of renewable solutions in packaging, biomaterials, wooden constructions and paper. We believe that everything that is made from fossil-based materials today can be made from a tree tomorrow. Stora Enso has some 23 000 employees, and sales in over 50 countries. Our sales in 2020 were EUR 8.6 billion. Stora Enso shares are listed on Nasdaq Helsinki Oy (STEAV, STERV) and Nasdaq Stockholm AB (STE A, STE R). storaenso.com/investors
It should be noted that Stora Enso and its business are exposed to various risks and uncertainties and certain statements herein which are not historical facts, including, without limitation those regarding expectations for market growth and developments; expectations for growth and profitability; and statements preceded by “believes”, “expects”, “anticipates”, “foresees”, or similar expressions, are forward-looking statements. Since these statements are based on current plans, estimates and projections, they involve risks and uncertainties, which may cause actual results to materially differ from those expressed in such forward-looking statements. Such factors include, but are not limited to: (1) operating factors such as continued success of manufacturing activities and the achievement of efficiencies therein, continued success of product development, acceptance of new products or services by the Group’s targeted customers, success of the existing and future collaboration arrangements, changes in business strategy or development plans or targets, changes in the degree of protection created by the Group’s patents and other intellectual property rights, the availability of capital on acceptable terms; (2) industry conditions, such as strength of product demand, intensity of competition, prevailing and future global market prices for the Group’s products and the pricing pressures thereto, price fluctuations in raw materials, financial condition of the customers and the competitors of the Group, the potential introduction of competing products and technologies by competitors; and (3) general economic conditions, such as rates of economic growth in the Group’s principal geographic markets or fluctuations in exchange and interest rates. All statements are based on management’s best assumptions and beliefs in light of the information currently available to it and Stora Enso assumes no obligation to publicly update or revise any forward-looking statement except to the extent legally required.
Contacts
Stora Enso Q4/2020 and full year 2020 results 38 (38)