Stoplight Charts: Ideal for At a Glance Project Reporting...
8
hp:www.kidasa.com Create Stoplight charts using Milestones Professional In a report which has extensive data, how can acon items be quickly highlighted and addressed? Stoplight charts are a wonderful way to show status of projects at-a- glance. Without even looking at the project details, a manager can glance at the pro- ject’s overall stoplight color and tell how it is doing: Green: All systems go! Fully compliant. On track. No problems. Most aspects of the project are doing very well. Yellow: Project on schedule but just. Some aspects of the project may be behind schedule. Detailed monitoring required. Red: Alert! Monitor Carefully. Problems loom. Addional resources, rescheduling and/or rethinking may be required. Stoplight Charts: Ideal for At-a-Glance Project Reporting
-
Upload
duongtuyen -
Category
Documents
-
view
223 -
download
0
Transcript of Stoplight Charts: Ideal for At a Glance Project Reporting...

http:www.kidasa.com
Create Stoplight charts using Milestones Professional
In a report which has extensive data, how can action items be quickly highlighted and
addressed? Stoplight charts are a wonderful way to show status of projects at-a-
glance. Without even looking at the project details, a manager can glance at the pro-
ject’s overall stoplight color and tell how it is doing:
Green: All systems go! Fully compliant. On track. No problems. Most aspects of the
project are doing very well.
Yellow: Project on schedule but just. Some aspects of the project may be behind
schedule. Detailed monitoring required.
Red: Alert! Monitor Carefully. Problems loom. Additional resources, rescheduling
and/or rethinking may be required.
Stoplight Charts: Ideal for At-a-Glance Project Reporting

http:www.kidasa.com
Stoplights: What can they indicate?
Stoplights are typically green, yellow and red and can have many meanings. Here is a sampling:
Ahead of Schedule
On Schedule
Behind Schedule
Under Budget
On Budget
Over Budget
0-5 days behind schedule
6-12 days behind schedule
13+ days behind schedule
Schedule OK, Cost OK
Schedule OK, Over Cost
Behind Schedule, Cost OK
Behind Schedule, Over cost
Future

http:www.kidasa.com
Other Types of Indicators
In addition to simple stoplights, many other indicators can be used for at-a-glance status. This
page and the following pages offer examples .
The Indicators Sampler schedule below illustrates some of the ways indicators can be used with a
schedule. In this example:
The % Complete column shades the pie based on the % complete entered in the col-
umn.
The Indicators by Range column shows a unique symbol for each specified number
range.
The Status Indicator column either shades with a color or displays a symbol based on
the text in the Status column. For On Schedule, it is shaded green. Future is shaded
blue. Critical is shaded red. If complete is entered, a black check-mark is shown.
Indicators Sampler
2018 2019
Jun Jul Aug Sep Oct Nov Dec Jan Feb
Indicators Sampler
Indicators
by Range
%
CompletePHASE Status
Status
Indicator
11 - 20100%Gas Hookup COMPLETE
21 - 3056% Cabinets PlusON
SCHEDULE
11 - 20100% Hardwood Floors COMPLETE
41 - 500%Inserts FUTURE
21 - 3016%Sprinkler System CRITICAL
51 - 60100%Electrical COMPLETE
51 - 600%Plumbing FUTURE
0 - 1073%Stainless Steel ON
SCHEDULE
31 - 40100%Mirrors + Doors COMPLETE
11 - 200%Garage doors CRITICAL
http:www.kidasa.com
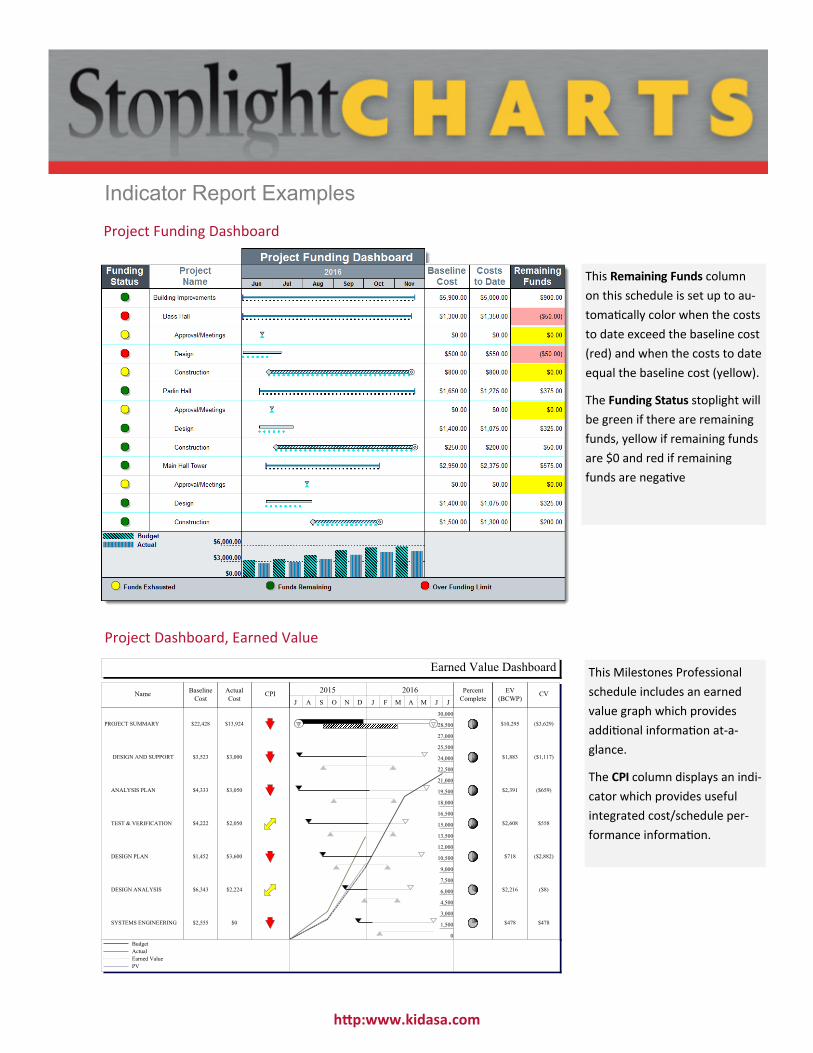
Indicator Report Examples
Project Funding Dashboard
This Remaining Funds column
on this schedule is set up to au-
tomatically color when the costs
to date exceed the baseline cost
(red) and when the costs to date
equal the baseline cost (yellow).
The Funding Status stoplight will
be green if there are remaining
funds, yellow if remaining funds
are $0 and red if remaining
funds are negative
Project Dashboard, Earned Value
This Milestones Professional
schedule includes an earned
value graph which provides
additional information at-a-
glance.
The CPI column displays an indi-
cator which provides useful
integrated cost/schedule per-
formance information.
2015 2016
J A S O N D J F M A M J J
0
1,500
3,000
4,500
6,000
7,500
9,000
10,500
12,000
13,500
15,000
16,500
18,000
19,500
21,000
22,500
24,000
25,500
27,000
28,500
30,000
Budget
Actual
Earned Value
PV
Earned Value Dashboard
CPIActual
Cost
Baseline
CostName
Percent
Complete
EV
(BCWP)CV
$13,924$22,428 PROJECT SUMMARY $10,295 ($3,629)
$3,000$3,523 DESIGN AND SUPPORT $1,883 ($1,117)
$3,050$4,333ANALYSIS PLAN $2,391 ($659)
$2,050$4,222TEST & VERIFICATION $2,608 $558
$3,600$1,452DESIGN PLAN $718 ($2,882)
$2,224$6,343DESIGN ANALYSIS $2,216 ($8)
$0$2,555SYSTEMS ENGINEERING $478 $478

http:www.kidasa.com
Indicator Report Examples
Tracking Status
This Milestones Professional
schedule uses different symbol
shapes and colors to show sta-
tus in the Ahead/Behind col-
umn.
If the project is ahead, a green
triangle is shown. If behind, a
red arrow. If neither ahead nor
behind, a yellow star.
Contract Review Earned Value Report
This Milestones Professional schedule uses Milestones Professional’s built-in earned value calculations.
Additionally, two stoplight columns have been added, one for CPI (Cost Performance Index) and one for
TCPI (To Complete Performance Index).

http:www.kidasa.com
Indicator Report Examples created using Milestones Professional
Aerospace Project Plan Cost Report
This example shows simple cost
variance stoplights. In this case
the stoplights refer only to the
project’s budget and are not
associated with whether or not
the project is ahead or behind
schedule.
Travel Nurse Assignments
The Pie Indicator column
shades the pie based on the
number in the column.
The Assignment Indicator col-
umn uses the “Fill cell with
symbol color” feature to display
a color based on the text locat-
ed in the compare to column.
The Status column displays a
red check if the % complete is
100, a yellow diamond if the %
complete is zero and a green
arrow if the % complete is be-
tween 1 and 99.

http:www.kidasa.com
Indicator Reports generated from Microsoft Project Information
Milestones Professional offers a large selection of indicator report formats for Microsoft Project users.
This example uses the Microsoft
Project Status field to display a
stoplight or a check mark.
The legend below the schedule
describes how the indicators
work.
Finish Date Plus Status
Cost and Schedule Stoplight Report
The Microsoft Project Cost Vari-
ance field is used to determine if
Cost is OK.
The Project Status field is used
to determine if schedule is ok.

http:www.kidasa.com
Create Stoplight and Indicator Charts with Milestones Professional As you have seen in the examples Milestones Professional offers a variety of ways to use stop-
lights and indicators for at-a-glance reporting. To recap and get you started on creating your own
Milestones Professional stoplight or indicator schedule, here are a few helpful reminders:
A basic stoplight column will generate stoplights in red, yellow, green and blue
when the numbers 1,2,3, and 4 are entered. It’s that easy!
Any Values column can also have an indicator associated with it. And… you get to
define how the indicators work.
Other column types in Milestones Professional can have indicators. These include:
duration, earned value, and more.
Indicators can be set up based on text in a cell. For example, an assignment name
like “Team A” can cause a cell to fill with color.
A special percent (pie) indicator is built in to Milestones Professional. It’s possible
to shade the pie by a number between 0 and 100 or between 0 and 1.
Stoplight Variety