STONE & CO. EUROPLUS DIVIDEND GROWTH FUND · European equity markets had an exceptional start to...
12
STONE & CO. EUROPLUS DIVIDEND GROWTH FUND Interim Management Report of Fund Performance June 30, 2015 This interim Management Report of Fund Performance contains financial highlights but does not contain either interim financial report or annual financial statements of the investment fund. You can get a copy of the interim financial reports or annual financial statements at your request, and at no cost, by calling 1 800 336 9528: by writing to us at Stone Asset Management Limited, 36 Toronto Street, Suite 710, Toronto, Ontario, M5C 2C5; or by visiting our website at www.stoneco.com; or SEDAR at www.sedar.com. Securityholders may also contact us using one of these methods to request a copy of the investment fund’s interim financial report, proxy voting policies and procedures, proxy voting disclosure record or quarterly portfolio disclosure.
Transcript of STONE & CO. EUROPLUS DIVIDEND GROWTH FUND · European equity markets had an exceptional start to...

STONE & CO. EUROPLUS DIVIDEND GROWTH FUND
Interim Management Report of Fund PerformanceJune 30, 2015
This interim Management Report of Fund Performance contains financial highlights but does not contain either interim financial report or annual financial statements of the investment fund. You can get a copy of the interim financial reports or annual financial statements at your request, and at no cost, by calling 1 800 336 9528: by writing to us at Stone Asset Management Limited, 36 Toronto Street, Suite 710, Toronto, Ontario, M5C 2C5; or by visiting our website at www.stoneco.com; or SEDAR at www.sedar.com.
Securityholders may also contact us using one of these methods to request a copy of the investment fund’s interim financial report, proxy voting policies and procedures, proxy voting disclosure record or quarterly portfolio disclosure.

INTERIM MANAGEMENT REPORT OF FUND PERFORMANCE2
STONE & CO. EUROPLUS DIVIDEND GROWTH FUND
INVESTMENT OBJECTIVES
The investment objective of the Stone & Co. Europlus Dividend Growth Fund (the “Fund“) is two-fold: (i) to provide a sustainable stream of income; and (ii) to provide long-term capital growth. The Fund will invest primarily in equity securities of companies in Europe and other developed countries around the world. The Fund will generally have significant investment in European markets. There is no restriction on the economic sectors or geographic areas in which the Fund may invest.
INVESTMENT STRATEGIES
The Portfolio sub-advisor of the Fund will invest primarily in equity securities that provide an above-average dividend yield. The Portfolio sub-advisor invests in companies that have a strong competitive position, first-class management, and scope for cost savings and cash generation to support the dividend yield. The Portfolio sub-advisor aims to invest in businesses that generate strong earnings, and in so doing, seeks to provide increasing distributions and capital appreciation.
RISKThe overall long-term risk of the Fund is as described in the most recent simplified prospectus. As an unhedged European equity fund, currency and market risk are inherent. However, no specific changes occurred that have increased or decreased the Fund’s exposure to risk.
RESULTS OF OPERATIONS
Market Overview and Impact on the FundEuropean equity markets had an exceptional start to 2015. The benchmark MSCI Europe Index rose almost 10% in January (in Canadian dollar terms) as the European Central Bank (the "ECB") announced that it would launch a significant quantitative easing programme. The €1.1 trillion ‘shock and awe’ bond-buying program, aimed at jump-starting the euro zone economy to prevent a deflationary spiral, had an immediate positive impact on risk assets. However, following the initial ‘pop’, momentum soon dissipated and markets tracked sideways for the remainder of the period.
Outside Europe, the continued strength of the US economy led to much conjecture regarding the timing and pace of Federal Reserve interest rate rises. Fears that the post-crisis, ‘easy-money’ regime would soon be over led to rising bond yields and the selling of defensive ‘bond-proxy’ stocks.
Towards the end of the period, the multi-year Greek tragedy entered a new phase. The newly-elected Syriza government failed to negotiate new bailout terms with the country’s creditors. As a result, Greece had the ignominy of becoming the first developed country in history to default on its debt to the International Monetary Fund. Following this, Greek banks were shuttered, capital controls were put in place and the banking system slid closer to losing the ECB as its lender of last resort. At the time of writing, the situation remains fluid. The sub-advisors believe that the Fund is relatively well insulated from the first-order effects of Greece’s euro zone exit, should it happen. They also remain alert to further contagion risks.
The Fund delivered a good absolute return in the first half of 2015, despite underperforming the benchmark index. Given the sub-advisor’s macro and valuation concerns, the Fund held a large cash position over the period. This acted as a drag on relative performance in a rising market. Although the Fund is underweight commodity stocks, falling oil and iron ore prices still impacted performance. Stocks including Royal Dutch Shell, Rio Tinto and Eni all posted negative returns during the period. On a more positive note, several stocks including Jupiter Fund Management, Campari Group, William Hill and Sage Group performed well.
Few changes were made to the portfolio over the period. Early in the year, long-held positions in oil majors Eni and Total were sold owing to concerns about a ‘lower for longer’ oil price. The Fund also exited a very small
position in South32, which was spun-out of mining giant BHP Billiton in May. No new holdings were added to the Fund in the first half of the year; however, the sub-advisors significantly increased the Fund’s weighting in UK-listed distribution firm Bunzl.
Heading into the second half of the year, macro-economic and political risks remain front and centre. Markets have fallen already, reflecting some of these concerns, but further falls cannot be ruled out. Whilst indiscriminate selling is beginning to create pockets of value, many stocks still trade on elevated valuations. As a result, they maintain the Fund’s cash weighting and anticipate deploying this considerable asset as further value emerges.
PerformanceThe Fund’s Series generated the following returns for the period.
Series
A B F L T8A
9.8% 9.4% 10.3% 9.5% 9.7%
Any differences in performance returns between series are primarily due to different management and operating fees which are applicable to particular series. Please refer to “Past Performance” for details regarding the performance of all the series of the Fund. The calculation of the Fund’s Series performance takes into consideration all fees and expenses of the Fund, which are not applicable in the calculation of the benchmark’s performance. The Fund’s benchmark, the MSCI Europe (Total Return) Index (in Canadian dollar terms), returned 12.0% over the same period. The comparison to this index is provided to enable you to compare the Fund’s performance with that of the general market.
Change in Net Assets Net Assets of the Fund increased by 24.2% or $6.5 million during the period, from $26.9 million at December 31, 2014 to $33.4 million at June 30, 2015. This change in Net Assets is attributed to net sales (redemptions) of $4.0 million and $2.5 million to investment operations, including market appreciation (depreciation), income and expenses.
RECENT DEVELOPMENTS
Please see “Results of Operations” for market-related developments.
There are no known changes at this time to the policies or strategic positioning of the Fund, or the manager, portfolio manager or the composition of the Independent Review Committee.
Statement of ComplianceThe financial statements have been prepared in compliance with International Financial Reporting Standards (“IFRS”), as published by the International Accounting Standards Board (“IASB”).
RELATED PARTY TRANSACTIONS
Stone Asset Management Limited (“SAM”) is the manager and portfolio manager of the Fund. SAM is a wholly-owned subsidiary of Stone Investment Group Limited.
Fund ManagerAs manager, SAM is responsible for managing the Fund’s overall business and day to day operational services. As described under the heading “Management Fees”, the Fund pays an annual management fee plus applicable taxes to SAM as consideration for these services.
Portfolio ManagerAs portfolio manager, SAM is responsible for providing portfolio management services to the Fund.
MANAGEMENT DISCUSSION OF FUND PERFORMANCEJune 30, 2015

INTERIM MANAGEMENT REPORT OF FUND PERFORMANCE 3
STONE & CO. EUROPLUS DIVIDEND GROWTH FUND
Under the terms of the Investment Management Agreement, the Portfolio Manager is entitled to receive a performance fee (plus applicable taxes) from each Series of securities of the Fund equal to 10 percent of the amount by which the Fund’s Series rate of return exceeds the return of the Fund’s established benchmark since the last time a Performance fee was paid, multiplied by the Fund’s average series NAV during the calendar year. Such fees are accrued monthly, if applicable, and paid annually.
MANAGEMENT FEES
The Fund pays a management fee, calculated daily and paid monthly, based on the following schedule:
Series A/T8A B/T8B C/T8C F L
Annual Fee (%) 2.0 2.5 2.5 1.0 2.5
The following table lists the major services received by the Fund, as a percentage of the Management Fee:
Series A/T8A B/T8B C/T8C F L
Dealer Compensation (%) 50 20 30 – 20
Investment and Fund Management (%) 50 80 70 100 80
Total (%) 100 100 100 100 100
The Fund pays all of the expenses relating to its operation and the carrying on of its business, including legal and audit fees, independent review committee fees, interest, taxes, administrative and overhead costs charged by the manager, as well as the cost of financial and other reports and compliance with all applicable laws, regulations and policies. Expenses incurred by the Fund are allocated among the series on a reasonable basis as determined by the manager.
At its sole discretion, the manager may waive management fees or absorb expenses of the Fund. The management expense ratios of each of the series of units of the Fund with and without the waivers and absorptions are reported in the Ratios and Supplemental Data table.
MANAGEMENT DISCUSSION OF FUND PERFORMANCE (continued)

INTERIM MANAGEMENT REPORT OF FUND PERFORMANCE4
STONE & CO. EUROPLUS DIVIDEND GROWTH FUND
FINANCIAL HIGHLIGHTSThe following tables present selected key financial information about the Fund and are intended to help you understand the Fund’s financial performance for the periods indicated.
THE FUND’S NET ASSETS PER SECURITY1
‡ Series liquidated on May 7, 2015.* Series opened on September 1, 2011.† Series liquidated on January 15, 2015.** Series liquidated on March 7, 2013.
Explanatory Notes:
1. This information is derived from the Fund’s (unaudited) interim financial report and annual audited financial statements.
2. Net assets and distributions are based on the actual number of securities outstanding at the relevant time. The increase/(decrease) from operations is based on the weighted average number of securities outstanding over the financial period. It is not intended that the Fund’s net asset per security table act as a continuity of opening and closing net assets per security.
3. Distributions were paid in cash and/or reinvested in additional securities of the Fund.
4. Current period (Jun 2015) and prior periods (Dec 2014 and 2013) net assets per security figures are disclosed in accordance with the accounting principles under IFRS. All other previous periods are disclosed in accordance with Canadian GAAP.
Series
All figures in ($)
As at
Net assets, beginningof period2
Increase (decrease) from operations2 Distributions2,3
Net assets,end ofperiod
Totalrevenue
Total expenses
(excluding distributions)
Realizedgains
(losses) forthe period
Unrealizedgains
(losses) forthe period
Totalincrease
(decrease)from
operations2
Net investment
income(excludingdividends) Dividends
Capitalgains
Return ofcapital
Totaldistributions3
Jun 2015 11.47 0.28 (0.22) – 1.02 1.08 – – – – – 12.59 Dec 2014 11.11 0.36 (0.40) 0.01 0.37 0.34 – – – – – 11.47 Dec 2013 8.73 0.34 (0.36) 0.04 2.36 2.38 – – – – – 11.11Dec 2012 7.55 0.29 (0.24) 0.31 0.84 1.20 (0.02) – – – (0.02) 8.73Dec 2011 7.64 0.31 (0.27) (0.95) 0.90 (0.01) (0.07) – – – (0.07) 7.55
A Dec 2010 8.19 0.28 (0.22) (0.40) (0.20) (0.54) (0.02) – – – (0.02) 7.64Jun 2015 11.10 0.26 (0.25) (0.01) 1.29 1.29 – – – – – 12.15 Dec 2014 10.80 0.34 (0.45) 0.01 0.40 0.30 – – – – – 11.10 Dec 2013 8.54 0.30 (0.40) (0.03) 2.48 2.35 – – – – – 10.80Dec 2012 7.45 0.28 (0.29) 0.31 0.68 0.98 (0.02) – – – (0.02) 8.54Dec 2011 7.54 0.32 (0.27) (0.95) 0.84 (0.06) (0.07) – – – (0.07) 7.45
B‡ Dec 2010 8.13 0.28 (0.26) (0.39) (0.45) (0.82) (0.02) – – – (0.02) 7.54Jun 2015 11.10 0.17 (0.17) (0.06) 1.28 1.22 – – – – – –Dec 2014 10.80 0.34 (0.45) 0.01 0.46 0.36 – – – – – 11.10 Dec 2013 8.53 0.27 (0.40) (0.10) 2.62 2.39 – – – – – 10.80Dec 2012 7.45 0.28 (0.30) 0.30 0.83 1.11 (0.02) – – – (0.02) 8.53Dec 2011 7.54 0.32 (0.28) (0.99) 0.86 (0.09) (0.07) – – – (0.07) 7.45
C‡ Dec 2010 8.13 0.28 (0.26) (0.40) (0.28) (0.66) (0.02) – – – (0.02) 7.54Jun 2015 12.25 0.31 (0.17) 0.01 0.90 1.05 – – – – – 13.52 Dec 2014 11.73 0.38 (0.29) 0.01 0.26 0.36 – – – – – 12.25 Dec 2013 9.12 0.29 (0.26) (0.08) 2.94 2.88 – – – – – 11.73Dec 2012 7.81 0.29 (0.16) 0.32 0.87 1.32 (0.02) – – – (0.02) 9.12Dec 2011 7.86 0.36 (0.21) (0.97) 1.00 0.18 (0.07) – – – (0.07) 7.81
F Dec 2010 8.33 0.28 (0.14) (0.40) (0.07) (0.33) (0.02) – – – (0.02) 7.86Jun 2015 14.78 0.37 (0.32) 0.01 1.14 1.20 – – – – – 16.18 Dec 2014 14.38 0.45 (0.59) 0.01 0.28 0.15 – – – – – 14.78 Dec 2013 11.35 0.28 (0.53) (0.23) 4.09 3.61 – – – – – 14.38Dec 2012 9.89 0.20 (0.40) 0.25 2.82 2.87 (0.02) – – – (0.02) 11.35
L* Dec 2011 10.00 0.07 (0.12) (0.35) 0.78 0.38 (0.08) – – – (0.08) 9.89Jun 2015 6.61 0.16 (0.13) – 0.57 0.60 – – – (0.26) (0.26) 6.99 Dec 2014 6.94 0.21 (0.25) 0.01 0.21 0.18 – – – (0.55) (0.55) 6.61 Dec 2013 5.86 0.22 (0.24) 0.02 1.56 1.56 – – – (0.47) (0.47) 6.94Dec 2012 5.48 0.20 (0.17) 0.22 0.62 0.87 (0.01) – – (0.44) (0.45) 5.86Dec 2011 6.01 0.22 (0.20) (0.83) 0.87 0.06 (0.07) – – (0.46) (0.53) 5.48
T8A Dec 2010 7.07 0.23 (0.18) (0.33) (0.16) (0.41) – – – (0.58) (0.58) 6.01Jun 2015 6.46 – (0.01) (0.06) 0.18 0.11 – – – – – –Dec 2014 6.81 0.22 (0.27) (0.02) 0.20 0.13 – – – (0.54) (0.54) 6.46 Dec 2013 5.77 0.23 (0.25) 0.02 1.39 1.39 – – – (0.46) (0.46) 6.81Dec 2012 5.43 0.20 (0.20) 0.21 0.56 0.77 (0.01) – – (0.44) (0.45) 5.77Dec 2011 5.97 0.23 (0.21) (0.69) 0.66 (0.01) (0.06) – – (0.47) (0.53) 5.43
T8B† Dec 2010 7.06 0.24 (0.22) (0.33) (0.21) (0.52) – – – (0.56) (0.56) 5.97Jun 2015 n/a n/a n/a n/a n/a n/a n/a n/a n/a n/a n/a n/aDec 2014 n/a n/a n/a n/a n/a n/a n/a n/a n/a n/a n/a n/aDec 2013 5.74 0.16 (0.18) – 2.52 2.50 – – – – – n/aDec 2012 5.41 0.20 (0.21) 0.22 0.58 0.79 (0.01) – – (0.43) (0.44) 5.74Dec 2011 5.96 0.31 (0.22) (0.69) 0.90 0.30 (0.02) – – (0.51) (0.53) 5.41
T8C** Dec 2010 7.04 0.24 (0.22) (0.33) (0.17) (0.48) – – – (0.58) (0.58) 5.96

INTERIM MANAGEMENT REPORT OF FUND PERFORMANCE 5
STONE & CO. EUROPLUS DIVIDEND GROWTH FUND
FINANCIAL HIGHLIGHTS (continued)
RATIOS AND SUPPLEMENTAL DATA
‡ Series closed to new purchases on August 31, 2011.* Series opened on September 1, 2011. † Series closed to new purchases on December 4, 2009.** Series liquidated on March 7, 2013.
Explanatory Notes:
1. This information is provided as at each period shown.
2. Management expense ratio (“MER”) for each series is based on total expenses (excluding [distributions], commissions and other portfolio transaction costs) for the stated period and is expressed as an annualized percentage of daily average NAV during the period. The MER excluding performance fees for the period ending December 31, 2012 was: 3.55%-Series B; 3.67%-Series C; 1.94%-Series F; 3.70%-Series L; 3.40%-Series T8B; 3.64%-Series T8C. The MER excluding performance fees for the period ending December 31, 2011 was: 3.10% – Series A; 2.00% – Series F; and 3.02% – Series T8A.
3. The trading expense ratio represents total commissions and other portfolio transaction costs expressed as an annualized percentage of daily average net asset value during the period.
4. The Fund’s portfolio turnover rate indicates how actively the Fund’s portfolio advisor manages its portfolio investments. A portfolio turnover rate of 100% is equivalent to the Fund buying and selling all of the securities in its portfolio once in the course of the year. The higher a Fund’s portfolio turnover in a year, the greater the trading costs payable by the Fund in the year, and the greater the chance of an investor receiving taxable capital gains in the year. There is not necessarily a relationship between a high turnover rate and the performance of a Fund.
Series As atTotal net assetvalue ($000’s)1
Number of securities outstanding1
Management expenseratio (“MER”) (%)2
MER before waivers or absorptions (%)2
Trading expenseratio (%)3
Portfolio turnoverrate (%)4
Net asset valueper security ($)
Jun 2015 17,748 1,409,579 2.98 2.98 0.03 1 12.59Dec 2014 15,387 1,341,346 3.02 3.09 0.14 10 11.47Dec 2013 13,364 1,203,164 2.98 3.31 0.16 15 11.11Dec 2012 9,261 1,060,269 3.07 3.75 0.10 27 8.73Dec 2011 7,993 1,057,006 3.53 4.15 0.19 38 7.56
A Dec 2010 8,005 1,046,960 2.94 3.60 0.12 21 7.65Jun 2015 797 65,571 3.58 3.58 0.03 1 12.15Dec 2014 927 83,484 3.54 3.61 0.14 10 11.10Dec 2013 949 87,834 3.49 3.81 0.16 15 10.80Dec 2012 309 36,098 3.77 4.44 0.10 27 8.55Dec 2011 348 46,652 3.57 4.18 0.19 38 7.46
B‡ Dec 2010 514 68,077 3.47 4.13 0.12 21 7.55Jun 2015 – – 3.60 2.55 0.03 1 –Dec 2014 38 3,447 3.53 3.60 0.14 10 11.10Dec 2013 42 3,869 3.56 3.89 0.16 15 10.80Dec 2012 47 5,447 3.87 4.55 0.10 27 8.54Dec 2011 43 5,787 3.61 4.23 0.19 38 7.46
C‡ Dec 2010 101 13,344 3.49 4.15 0.12 21 7.55Jun 2015 4,935 365,136 1.89 1.89 0.03 1 13.52Dec 2014 3,385 276,356 1.91 1.98 0.14 10 12.25Dec 2013 1,497 127,643 1.90 2.23 0.16 15 11.73Dec 2012 235 25,751 1.99 2.66 0.10 27 9.13Dec 2011 192 24,494 2.66 3.27 0.19 38 7.82
F Dec 2010 302 38,426 1.85 2.51 0.12 21 7.86Jun 2015 9,592 592,638 3.46 3.46 0.03 1 16.18Dec 2014 6,921 468,215 3.49 3.56 0.14 10 14.78Dec 2013 3,229 224,545 3.34 3.67 0.16 15 14.38Dec 2012 185 16,266 3.74 4.42 0.10 27 11.36
L* Dec 2011 1 97 3.54 4.17 0.56 38 9.90Jun 2015 328 47,001 3.04 3.04 0.03 1 6.99Dec 2014 283 42,850 3.05 3.12 0.14 10 6.61Dec 2013 211 30,388 3.05 3.38 0.16 15 6.94Dec 2012 150 25,637 3.08 3.75 0.10 27 5.87Dec 2011 137 24,991 3.45 4.07 0.19 38 5.49
T8A Dec 2010 4 646 2.95 3.61 0.12 21 6.01Jun 2015 – – 3.57 3.57 0.03 1 –Dec 2014 6 882 3.43 3.50 0.14 10 6.46Dec 2013 28 4,118 3.39 3.71 0.16 15 6.81Dec 2012 30 5,112 3.65 4.32 0.10 27 5.78Dec 2011 33 6,139 3.53 4.15 0.19 38 5.44
T8B† Dec 2010 31 5,186 3.49 4.14 0.12 21 5.97Jun 2015 n/a n/a n/a n/a n/a n/a n/aDec 2014 n/a n/a n/a n/a n/a n/a n/aDec 2013 n/a n/a 3.02 3.35 0.16 15 n/aDec 2012 1 184 3.84 4.51 0.10 27 5.74Dec 2011 1 170 3.63 4.23 0.19 38 5.42
T8C** Dec 2010 4 638 3.48 4.14 0.12 21 5.96
INTERIM MANAGEMENT REPORT OF FUND PERFORMANCE6
STONE & CO. EUROPLUS DIVIDEND GROWTH FUND
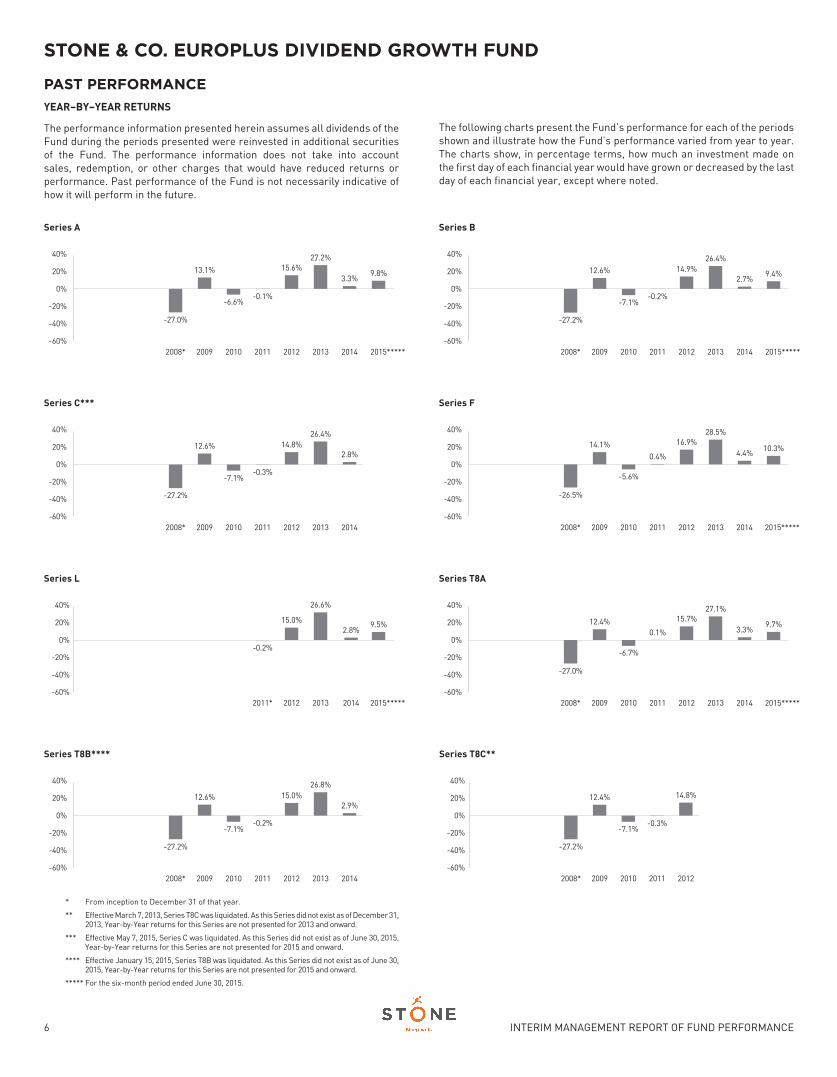
PAST PERFORMANCEYEAR–BY–YEAR RETURNS
The performance information presented herein assumes all dividends of the Fund during the periods presented were reinvested in additional securities of the Fund. The performance information does not take into account sales, redemption, or other charges that would have reduced returns or performance. Past performance of the Fund is not necessarily indicative of how it will perform in the future.
The following charts present the Fund’s performance for each of the periods shown and illustrate how the Fund’s performance varied from year to year. The charts show, in percentage terms, how much an investment made on the first day of each financial year would have grown or decreased by the last day of each financial year, except where noted.
Series A
-40%
-60%
-20%
0%
20%
40%
-60
-40
-20
0
20
40
-27.0%
-6.6%
13.1% 15.6%
-0.1%
2008* 2009 2010 2011 2013 2015*****2012
27.2%
3.3%9.8%
2014
Series C***
-40%
-60%
-20%
0%
20%
40%
-60
-40
-20
0
20
40
-27.2%
-7.1%
12.6% 14.8%
-0.3%
2008* 2009 2010 2011 20132012
26.4%
2.8%
2014
Series L
-40%
-60%
-20%
0%
20%
40%
15.0%
-0.2%
2011* 2013 20142012
26.6%
2.8%
-60
-40
-20
0
20
40
2015*****
9.5%
Series T8A
-40%
-60%
-20%
0%
20%
40%
-60
-40
-20
0
20
40
-27.0%
-6.7%
12.4% 15.7%
0.1%
2008* 2009 2010 2011 2013 20142012
27.1%
3.3%
2015*****
9.7%
Series T8C**
-40%
-60%
-20%
0%
20%
40%
-40
-20
0
20
40
-27.2%
-7.1%
12.4%
-0.3%
2008* 2009 2010 2011
14.8%
2012
9.4%
Series B
-40%
-60%
-20%
0%
20%
40%
-60
-40
-20
0
20
40
-27.2%
-7.1%
12.6% 14.9%
-0.2%
2008* 2009 2010 2011 2013 20142012
26.4%
2.7%
2015*****
Series F
-40%
-60%
-20%
0%
20%
40%
-60
-40
-20
0
20
40
-26.5%
-5.6%
14.1% 16.9%
0.4%
2008* 2009 2010 2011 2013 20142012
28.5%
4.4%10.3%
2015*****
Series T8B****
-40%
-60%
-20%
0%
20%
40%
-60
-40
-20
0
20
40
-27.2%
-7.1%
12.6% 15.0%
-0.2%
2008* 2009 2010 2011 2013 20142012
26.8%
2.9%
* From inception to December 31 of that year.
** Effective March 7, 2013, Series T8C was liquidated. As this Series did not exist as of December 31, 2013, Year-by-Year returns for this Series are not presented for 2013 and onward.
*** Effective May 7, 2015, Series C was liquidated. As this Series did not exist as of June 30, 2015, Year-by-Year returns for this Series are not presented for 2015 and onward.
**** Effective January 15, 2015, Series T8B was liquidated. As this Series did not exist as of June 30, 2015, Year-by-Year returns for this Series are not presented for 2015 and onward.
***** For the six-month period ended June 30, 2015.

INTERIM MANAGEMENT REPORT OF FUND PERFORMANCE 7
STONE & CO. EUROPLUS DIVIDEND GROWTH FUND
SUMMARY OF INVESTMENT PORTFOLIOAS AT JUNE 30, 2015
TOP 25 HOLDINGS PORTFOLIO COMPOSITION
Name of Security % of Total Net Asset Value
Cash & cash equivalents 23.3
Reckitt Benckiser 4.7
Novartis AG, Registered 4.4
Anheuser-Busch InBev NV 4.3
Sanofi-Aventis SA 3.9
Roche Holding AG Genusscheine 3.7
Unilever NV 3.3
Sampo Group 3.2
Rio Tinto Group 3.1
Bunzl PLC 2.9
Reed Elsevier plc 2.8
WPP plc 2.8
The Sage Group 2.7
Jupiter Fund Management PLC 2.6
William Hill plc 2.6
Kinepolis Group NV 2.6
GlaxoSmithKline plc 2.3
Koninklijke Ahold NV 2.2
Aberdeen Asset Management PLC 2.1
BAE Systems plc 2.1
Restaurant Group plc 2.0
Royal Dutch Shell plc, Cl. A 2.0
Henkel AG & Co. 1.8
Davide Campari-Milano SPA 1.7
SAP 1.7
90.8
Sector Allocation (%)
Other net assets (liabilities)
Miscellaneous*
Information Technology
Industrials
Financials
Health Care
Consumer Staples
Consumer Discretionary
5.8
6.3
Cash & cash equivalents 23.3
8.7
14.3
7.9
17.8
15.5
0.4
Industry Allocation (%)
14.2
17.0
4.3
4.4
3.3
3.2
8.1
6.4
4.7
5.9
4.8
0.4
23.3
Household Products
Hotels Restaurants & Leisure
Capital Markets
Beverages
Insurance
Media
Metals & Mining
Personal Products
Pharmaceuticals
Software
Miscellaneous*
Other net assets (liabilities)
Cash & cash equivalents
Country Allocation (%)
This summary of investment portfolio may change due to the ongoing portfolio transactions of the Fund. Quarterly updates of the Fund’s investment portfolio are available from the Manager at www.stoneco.com. *Note: Sectors and Industries representing less than 5% and 3% respectively of the portfolio are included in “Miscellaneous”.
France
Germany
Italy
Netherlands
Sweden
Switzerland
United Kingdom
1.7
10.3
1.4
Finland
8.1
Belgium
33.7
Other net assets (liabilities) 0.4
23.3Cash & cash equivalents
4.8
3.9
5.6
6.8

NOTES

NOTES

NOTES

NOTES
STONE & CO. EUROPLUS DIVIDEND GROWTH FUND
Interim Management Report of Fund PerformanceJune 30, 2015
CAUTION REGARDING FORWARD-LOOKING STATEMENTS
This document may contain forward-looking statements relating to anticipated future events, results, circumstances, performance or expectations that are not historical facts but instead represent our beliefs regarding future events. By their nature, forward-looking statements require us to make assumptions and are subject to inherent risks and uncertainties. There is significant risk that predictions and other forward-looking statements will not prove to be accurate. We caution readers of this document not to place undue reliance on our forward-looking statements as a number of factors could cause actual future results, conditions, actions or events to differ materially from the targets, expectations, estimates or intentions expressed or implied in the forward-looking statements. Actual results may differ materially from management expectations as projected in such forward-looking statements for a variety of reasons, including but not limited to market and general economic conditions, interest rates, regulatory and statutory developments, the effects of competition in the geographic and business areas in which the Fund may invest and the risks detailed from time to time in the Fund’s simplified prospectus. We caution that the foregoing list of factors is not exhaustive and that when relying on forward-looking statements to make decisions with respects to investing in the Fund, investors and others should carefully consider these factors, as well as other uncertainties and potential events, and the inherent uncertainty of forward-looking statements. Due to the potential impact of these fac-tors, the Fund does not undertake, and specifically disclaims, any intention or obligation to update or revise any forward-looking statements, whether as a result of new information, future events or otherwise, unless required by applicable law.
STONE ASSET MANAGEMENT LIMITED36 Toronto Street, Suite 710 | Toronto, Ontario M5C 2C5 | T: 416 364 9188 or 800 336 9528
F: 416 364 8456 | [email protected] | www.stoneco.comEPDG