Stoichiometric Interpretation Escherichia Glucose...
9
Vol. 59, No. 8 APPLIED AND ENVIRONMENTAL MICROBIOLOGY, Aug. 1993, p. 2465-2473 0099-2240/93/082465-09$02.00/0 Copyright C 1993, American Society for Microbiology Stoichiometric Interpretation of Escherichia coli Glucose Catabolism under Various Oxygenation Rates AMIT VARMA, BRIAN W. BOESCH, AND BERNHARD 0. PALSSON* Department of Chemical Engineering, University of Michigan, Ann Arbor, Michigan 48109 Received 26 January 1993/Accepted 12 May 1993 Metabolic by-product secretion is commonly observed in oxygen-limited cultures. Oxygen limitations occur because of limits in the capacity of the respiratory system or because of the oxygenation limits of the cultivation method used. The latter restriction is of considerable practical importance since it results in a critical cell concentration above which oxygenation is insufficient, leading to by-product secretion. In this study we used a flux balance approach to determine optimal metabolic performance of Escherichia coli under variable oxygen limitations. This method uses linear optimization to find optimal metabolic flux patterns with respect to cell growth. Cell growth was defined as precursor requirements on the basis of a composition analysis. A growth-associated maintenance requirement of 23 mmol of ATP per g of biomass and a non-growth-associated maintenance value of 5.87 mmol of ATP per g (dry weight)-h were incorporated on the basis of a comparison with experimental data. From computations of optimal growth increased oxygen limitations were found to result in the secretion of acetate, formate, and ethanol in that order. Consistent with the experimental data in the literature, by-product secretion rates increased linearly with the growth rate. The computed optimal growth under increasing oxygen limitation revealed four critical growth rates at which changes in the by-product secretion pattern were observed. Concomitant with by-product secretion under oxygen limita- tions were changes in metabolic pathway utilization. The shifts in metabolism were characterized by changes in the metabolic values (computed as shadow prices) of the various redox carriers. The redox potential was thus identified as a likely trigger that leads to metabolic shifts. Below a critical oxygen limitation of 0.88 mmol/g (dry weight)-h the anaerobic by-products were secreted at all growth rates, thus defining the upper limits of anaerobic growth. The general agreement between the optimal metabolic results derived here and experimental observations may prove to have evolutionary and ecological significance for stoichiometri- cally optimal metabolism. Microbial cultures are often oxygen limited. Restrictions in oxygen supply can occur because of either capacity limits of the respiratory system or external supply restrictions. When oxygen is limited, the carbon substrate is only par- tially oxidized, which leads to by-product secretion. The secretion of metabolic by-products allows the generation of energy while cellular redox metabolism is balanced. During cell culture the rate of oxygen consumption has to balance with the rate of oxygen supply. Mathematically, this balance is expressed as: qo2- X = k1a.c* (1) where qo is the oxygen consumption per cell, Xv is the viable cell density, c* is the dissolved oxygen concentration, and k,a is the mass transfer coefficient that is a characteristic of the particular cell culture equipment used. Figure 1 shows graphically the balance between oxygen demand and supply as determined by equation 1. The x axis represents the typical oxygen mass transfer capacity of the equipment, while the oxygen demand of a culture is shown on the y axis. Typically, cultivation is initiated at low cell concentrations, usually in the aerobic region. Cell growth results in increasing oxygen demand, as indicated by the arrow in Fig. 1. At a certain cell concentration the oxygen demand of the culture exceeds the supply capacity, resulting in a partially aerobic culture. In this paper we examine the effect of oxygen limitations on optimal by-product secretion and metabolic behavior. * Corresponding author. Recently, stoichiometrically based methods have been developed for the study of optimal metabolic behavior (9, 16, 22, 27-29). This approach utilizes flux balances around metabolic pathways to define a region of stoichiometrically allowable metabolic flux distributions. Within the domain of allowable flux distributions, linear optimization is used to determine the particular flux distribution that leads to opti- mal metabolic performance, as measured by a stated crite- rion. This approach has provided information about the stoichiometric constraints on metabolism and has allowed the determination of fundamental quantities of metabolic physiology, such as limits on catabolic performance and the ability to produce metabolic cofactors (27, 28). Stoichiometric analysis is well suited to address questions associated with the optimal secretion pattern of metabolic by-products under oxygen limitations. In this study the answers to these questions were obtained for Escherichia coli on the basis of the principle of stoichiometric optimality. By-product secretion patterns due to the enzymatic limits of the respiratory chain were evaluated on the basis of stoichio- metric optimality. We have also examined the effect of externally imposed oxygen limitations from completely anaerobic to aerobic conditions. MATERIALS AND METHODS Stoichiometric analysis. A metabolic steady state was considered for analysis, where metabolic fluxes leading to the formation and degradation of a metabolite must balance, leading to the flux balance equation (9, 22): S v = b 2465 (2)
Transcript of Stoichiometric Interpretation Escherichia Glucose...
Vol. 59, No. 8APPLIED AND ENVIRONMENTAL MICROBIOLOGY, Aug. 1993, p. 2465-24730099-2240/93/082465-09$02.00/0Copyright C 1993, American Society for Microbiology
Stoichiometric Interpretation of Escherichia coli GlucoseCatabolism under Various Oxygenation RatesAMIT VARMA, BRIAN W. BOESCH, AND BERNHARD 0. PALSSON*
Department of Chemical Engineering, University ofMichigan, Ann Arbor, Michigan 48109
Received 26 January 1993/Accepted 12 May 1993
Metabolic by-product secretion is commonly observed in oxygen-limited cultures. Oxygen limitations occurbecause of limits in the capacity of the respiratory system or because of the oxygenation limits of the cultivationmethod used. The latter restriction is of considerable practical importance since it results in a critical cellconcentration above which oxygenation is insufficient, leading to by-product secretion. In this study we used a
flux balance approach to determine optimal metabolic performance of Escherichia coli under variable oxygenlimitations. This method uses linear optimization to find optimal metabolic flux patterns with respect to cellgrowth. Cell growth was defined as precursor requirements on the basis of a composition analysis. Agrowth-associated maintenance requirement of 23 mmol ofATP per g of biomass and a non-growth-associatedmaintenance value of 5.87 mmol of ATP per g (dry weight)-h were incorporated on the basis of a comparisonwith experimental data. From computations of optimal growth increased oxygen limitations were found toresult in the secretion of acetate, formate, and ethanol in that order. Consistent with the experimental data inthe literature, by-product secretion rates increased linearly with the growth rate. The computed optimalgrowth under increasing oxygen limitation revealed four critical growth rates at which changes in theby-product secretion pattern were observed. Concomitant with by-product secretion under oxygen limita-tions were changes in metabolic pathway utilization. The shifts in metabolism were characterized by changesin the metabolic values (computed as shadow prices) of the various redox carriers. The redox potential wasthus identified as a likely trigger that leads to metabolic shifts. Below a critical oxygen limitation of 0.88mmol/g (dry weight)-h the anaerobic by-products were secreted at all growth rates, thus defining the upperlimits of anaerobic growth. The general agreement between the optimal metabolic results derived hereand experimental observations may prove to have evolutionary and ecological significance for stoichiometri-cally optimal metabolism.
Microbial cultures are often oxygen limited. Restrictionsin oxygen supply can occur because of either capacity limitsof the respiratory system or external supply restrictions.When oxygen is limited, the carbon substrate is only par-tially oxidized, which leads to by-product secretion. Thesecretion of metabolic by-products allows the generation ofenergy while cellular redox metabolism is balanced.During cell culture the rate of oxygen consumption has to
balance with the rate of oxygen supply. Mathematically, thisbalance is expressed as:
qo2- X = k1a.c* (1)
where qo is the oxygen consumption per cell, Xv is theviable cell density, c* is the dissolved oxygen concentration,and k,a is the mass transfer coefficient that is a characteristicof the particular cell culture equipment used.
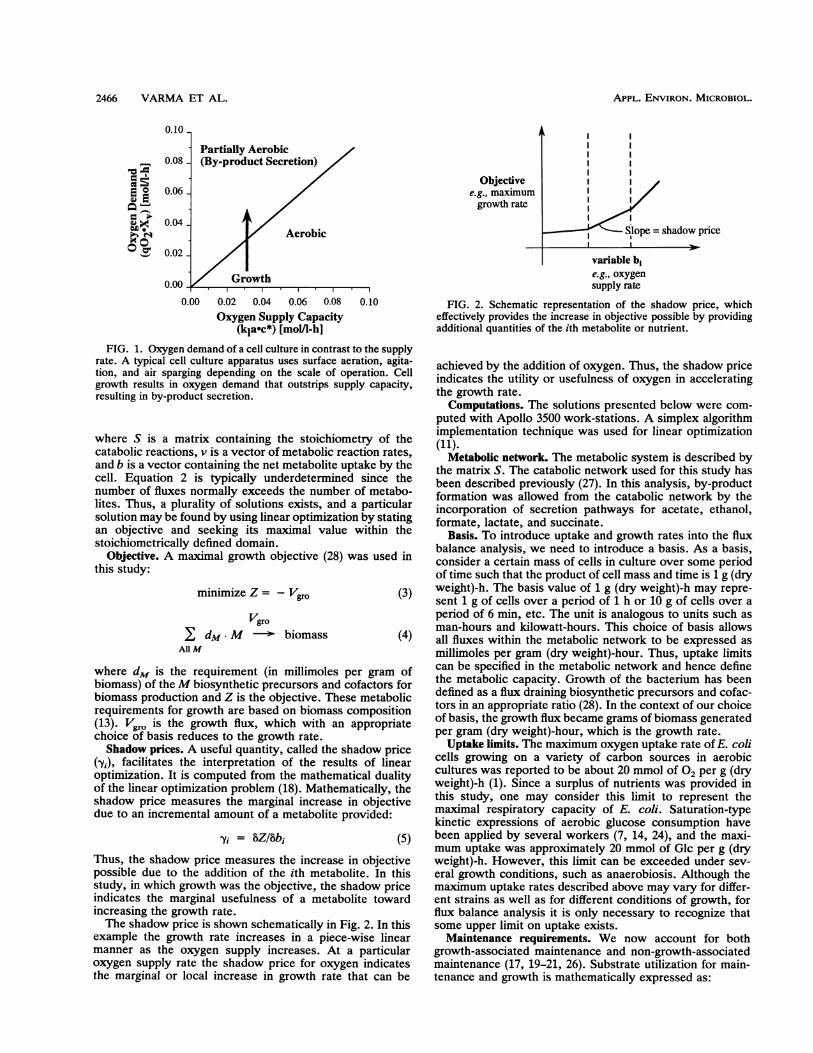
Figure 1 shows graphically the balance between oxygendemand and supply as determined by equation 1. The x axisrepresents the typical oxygen mass transfer capacity of theequipment, while the oxygen demand of a culture is shownon the y axis. Typically, cultivation is initiated at low cellconcentrations, usually in the aerobic region. Cell growthresults in increasing oxygen demand, as indicated by thearrow in Fig. 1. At a certain cell concentration the oxygendemand of the culture exceeds the supply capacity, resultingin a partially aerobic culture. In this paper we examine theeffect of oxygen limitations on optimal by-product secretionand metabolic behavior.
* Corresponding author.
Recently, stoichiometrically based methods have beendeveloped for the study of optimal metabolic behavior (9, 16,22, 27-29). This approach utilizes flux balances aroundmetabolic pathways to define a region of stoichiometricallyallowable metabolic flux distributions. Within the domain ofallowable flux distributions, linear optimization is used todetermine the particular flux distribution that leads to opti-mal metabolic performance, as measured by a stated crite-rion. This approach has provided information about thestoichiometric constraints on metabolism and has allowedthe determination of fundamental quantities of metabolicphysiology, such as limits on catabolic performance and theability to produce metabolic cofactors (27, 28).
Stoichiometric analysis is well suited to address questionsassociated with the optimal secretion pattern of metabolicby-products under oxygen limitations. In this study theanswers to these questions were obtained for Escherichiacoli on the basis of the principle of stoichiometric optimality.By-product secretion patterns due to the enzymatic limits ofthe respiratory chain were evaluated on the basis of stoichio-metric optimality. We have also examined the effect ofexternally imposed oxygen limitations from completelyanaerobic to aerobic conditions.
MATERIALS AND METHODSStoichiometric analysis. A metabolic steady state was
considered for analysis, where metabolic fluxes leading tothe formation and degradation of a metabolite must balance,leading to the flux balance equation (9, 22):
S v = b
2465
(2)
APPL. ENVIRON. MICROBIOL.
0.10.
Ac _0°
I--
0.08 -
0.06 -
0.04.
0.02 -
Partially Aerobic(By-product Secretion)
Objectivee.g., maximumgrowth rate
0.00 ie W
0.00 0.02 0.04 0.06 0.08 0.1Oxygen Supply Capacity
(klaec*) [mol/1-h]
t0
FIG. 1. Oxygen demand of a cell culture in contrast to the supplyrate. A typical cell culture apparatus uses surface aeration, agita-tion, and air sparging depending on the scale of operation. Cellgrowth results in oxygen demand that outstrips supply capacity,resulting in by-product secretion.
where S is a matrix containing the stoichiometry of thecatabolic reactions, v is a vector of metabolic reaction rates,and b is a vector containing the net metabolite uptake by thecell. Equation 2 is typically underdetermined since thenumber of fluxes normally exceeds the number of metabo-lites. Thus, a plurality of solutions exists, and a particularsolution may be found by using linear optimization by statingan objective and seeking its maximal value within thestoichiometrically defined domain.
Objective. A maximal growth objective (28) was used inthis study:
minimize Z= - Vgro (3)
Vgro
dM.M ' biomass (4)All M
where dM is the requirement (in millimoles per gram ofbiomass) of the M biosynthetic precursors and cofactors forbiomass production and Z is the objective. These metabolicrequirements for growth are based on biomass composition(13). Vgro is the growth flux, which with an appropriatechoice of basis reduces to the growth rate.Shadow prices. A useful quantity, called the shadow price
(-y,), facilitates the interpretation of the results of linearoptimization. It is computed from the mathematical dualityof the linear optimization problem (18). Mathematically, theshadow price measures the marginal increase in objectivedue to an incremental amount of a metabolite provided:
yi = 8ZIbbi (5)
Thus, the shadow price measures the increase in objectivepossible due to the addition of the ith metabolite. In thisstudy, in which growth was the objective, the shadow priceindicates the marginal usefulness of a metabolite towardincreasing the growth rate.The shadow price is shown schematically in Fig. 2. In this
example the growth rate increases in a piece-wise linearmanner as the oxygen supply increases. At a particularoxygen supply rate the shadow price for oxygen indicatesthe marginal or local increase in growth rate that can be
III
I
Slope = shadow priceI I _
variable bie.g., oxygensupply rate
FIG. 2. Schematic representation of the shadow price, whicheffectively provides the increase in objective possible by providingadditional quantities of the ith metabolite or nutrient.
achieved by the addition of oxygen. Thus, the shadow priceindicates the utility or usefulness of oxygen in acceleratingthe growth rate.
Computations. The solutions presented below were com-puted with Apollo 3500 work-stations. A simplex algorithmimplementation technique was used for linear optimization(11).
Metabolic network. The metabolic system is described bythe matrix S. The catabolic network used for this study hasbeen described previously (27). In this analysis, by-productformation was allowed from the catabolic network by theincorporation of secretion pathways for acetate, ethanol,formate, lactate, and succinate.
Basis. To introduce uptake and growth rates into the fluxbalance analysis, we need to introduce a basis. As a basis,consider a certain mass of cells in culture over some periodof time such that the product of cell mass and time is 1 g (dryweight)-h. The basis value of 1 g (dry weight)-h may repre-sent 1 g of cells over a period of 1 h or 10 g of cells over aperiod of 6 min, etc. The unit is analogous to units such asman-hours and kilowatt-hours. This choice of basis allowsall fluxes within the metabolic network to be expressed asmillimoles per gram (dry weight)-hour. Thus, uptake limitscan be specified in the metabolic network and hence definethe metabolic capacity. Growth of the bacterium has beendefined as a flux draining biosynthetic precursors and cofac-tors in an appropriate ratio (28). In the context of our choiceof basis, the growth flux became grams of biomass generatedper gram (dry weight)-hour, which is the growth rate.Uptake limits. The maximum oxygen uptake rate of E. coli
cells growing on a variety of carbon sources in aerobiccultures was reported to be about 20 mmol of 02 per g (dryweight)-h (1). Since a surplus of nutrients was provided inthis study, one may consider this limit to represent themaximal respiratory capacity of E. coli. Saturation-typekinetic expressions of aerobic glucose consumption havebeen applied by several workers (7, 14, 24), and the maxi-mum uptake was approximately 20 mmol of Glc per g (dryweight)-h. However, this limit can be exceeded under sev-eral growth conditions, such as anaerobiosis. Although themaximum uptake rates described above may vary for differ-ent strains as well as for different conditions of growth, forflux balance analysis it is only necessary to recognize thatsome upper limit on uptake exists.Maintenance requirements. We now account for both
growth-associated maintenance and non-growth-associatedmaintenance (17, 19-21, 26). Substrate utilization for main-tenance and growth is mathematically expressed as:
2466 VARMA ET AL.
z 4-rnrawth
E. COLI BY-PRODUCr SECRETION 2467
61° j ¢
m gt 410
co 1
od 2qwr
.oJ. Fomn
L0 / / ~~~~~~~~~~Acet. / / / ~~~~~~~~~Gluc10
.0
0 o / ~~~~~~~~~~~~~Ethai0.0.0 0.2 0.4 0.6 0.8 1.0 1.2 1.4 1.6 1.8 2.0
nate
tateose
mol
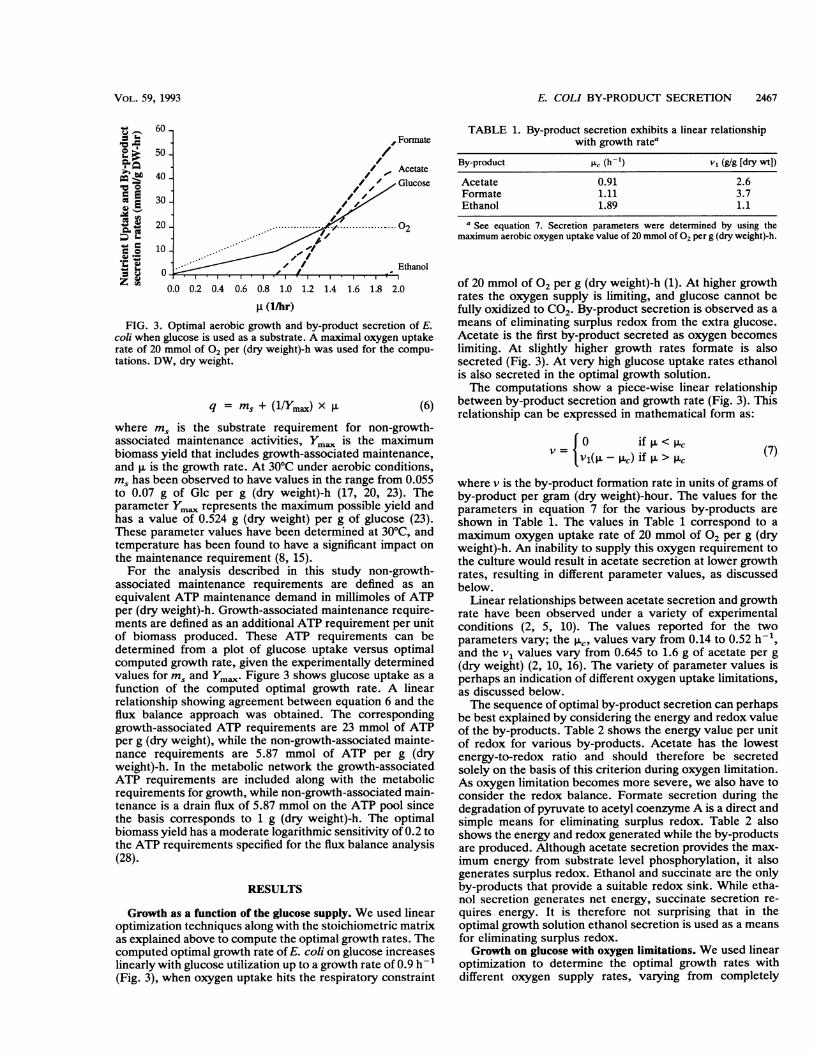
p (l/hr)FIG. 3. Optimal aerobic growth and by-product secretion of E.
coli when glucose is used as a substrate. A maximal oxygen uptakerate of 20 mmol of 02 per (dry weight)-h was used for the compu-tations. DW, dry weight.
q = ms + (1/Ymax) X p. (6)
where ms is the substrate requirement for non-growth-associated maintenance activities, Ym. is the maximumbiomass yield that includes growth-associated maintenance,and p. is the growth rate. At 30° C under aerobic conditions,ms has been observed to have values in the range from 0.055to 0.07 g of Glc per g (dry weight)-h (17, 20, 23). Theparameter Ym. represents the maximum possible yield andhas a value of 0.524 g (dry weight) per g of glucose (23).These parameter values have been determined at 30° C, andtemperature has been found to have a significant impact onthe maintenance requirement (8, 15).For the analysis described in this study non-growth-
associated maintenance requirements are defined as anequivalent ATP maintenance demand in millimoles of ATPper (dry weight)-h. Growth-associated maintenance require-ments are defined as an additional ATP requirement per unitof biomass produced. These ATP requirements can bedetermined from a plot of glucose uptake versus optimalcomputed growth rate, given the experimentally determinedvalues for ms and Ym.. Figure 3 shows glucose uptake as afunction of the computed optimal growth rate. A linearrelationship showing agreement between equation 6 and theflux balance approach was obtained. The correspondinggrowth-associated ATP requirements are 23 mmol of ATPper g (dry weight), while the non-growth-associated mainte-nance requirements are 5.87 mmol of ATP per g (dryweight)-h. In the metabolic network the growth-associatedATP requirements are included along with the metabolicrequirements for growth, while non-growth-associated main-tenance is a drain flux of 5.87 mmol on the ATP pool sincethe basis corresponds to 1 g (dry weight)-h. The optimalbiomass yield has a moderate logarithmic sensitivity of 0.2 tothe ATP requirements specified for the flux balance analysis(28).
RESULTS
Growth as a function of the glucose supply. We used linearoptimization techniques along with the stoichiometric matrixas explained above to compute the optimal growth rates. Thecomputed optimal growth rate of E. coli on glucose increaseslinearly with glucose utilization up to a growth rate of 0.9 h- 1(Fig. 3), when oxygen uptake hits the respiratory constraint
TABLE 1. By-product secretion exhibits a linear relationshipwith growth ratea
By-product tL, (h ) v, (g/g [dry wt])
Acetate 0.91 2.6Formate 1.11 3.7Ethanol 1.89 1.1a See equation 7. Secretion parameters were determined by using the
maximum aerobic oxygen uptake value of 20 mmol Of 02 per g (dry weight)-h.
of 20 mmol of 02 per g (dry weight)-h (1). At higher growthrates the oxygen supply is limiting, and glucose cannot befully oxidized to CO2. By-product secretion is observed as ameans of eliminating surplus redox from the extra glucose.Acetate is the first by-product secreted as oxygen becomeslimiting. At slightly higher growth rates formate is alsosecreted (Fig. 3). At very high glucose uptake rates ethanolis also secreted in the optimal growth solution.The computations show a piece-wise linear relationship
between by-product secretion and growth rate (Fig. 3). Thisrelationship can be expressed in mathematical form as:
O if < PCV = v{(p. - P.C) if p > P.C
where v is the by-product formation rate in units of grams ofby-product per gram (dry weight)-hour. The values for theparameters in equation 7 for the various by-products areshown in Table 1. The values in Table 1 correspond to amaximum oxygen uptake rate of 20 mmol of 02 per g (dryweight)-h. An inability to supply this oxygen requirement tothe culture would result in acetate secretion at lower growthrates, resulting in different parameter values, as discussedbelow.
Linear relationships between acetate secretion and growthrate have been observed under a variety of experimentalconditions (2, 5, 10). The values reported for the twoparameters vary; the p., values vary from 0.14 to 0.52 h-',and the v1 values vary from 0.645 to 1.6 g of acetate per g(dry weight) (2, 10, 16). The variety of parameter values isperhaps an indication of different oxygen uptake limitations,as discussed below.The sequence of optimal by-product secretion can perhaps
be best explained by considering the energy and redox valueof the by-products. Table 2 shows the energy value per unitof redox for various by-products. Acetate has the lowestenergy-to-redox ratio and should therefore be secretedsolely on the basis of this criterion during oxygen limitation.As oxygen limitation becomes more severe, we also have toconsider the redox balance. Formate secretion during thedegradation of pyruvate to acetyl coenzyme A is a direct andsimple means for eliminating surplus redox. Table 2 alsoshows the energy and redox generated while the by-productsare produced. Although acetate secretion provides the max-imum energy from substrate level phosphorylation, it alsogenerates surplus redox. Ethanol and succinate are the onlyby-products that provide a suitable redox sink. While etha-nol secretion generates net energy, succinate secretion re-quires energy. It is therefore not surprising that in theoptimal growth solution ethanol secretion is used as a meansfor eliminating surplus redox.Growth on glucose with oxygen limitations. We used linear
optimization to determine the optimal growth rates withdifferent oxygen supply rates, varying from completely
VOL. 59, 1993
(7)

APPL. ENvIRON. MICROBIOL.
TABLE 2. Aerobic energy values for different by-products perunit of oxygen consumed; also listed are the energy and redox
generated by anaerobic catabolism of glucose intothe by-products
Energy content Anaerobic produc-(mol) per mol Ratio of tion (molmol of
By-product of by-product ATP to 02 glucose) of:
ATP 02 ATP NADHa
Acetate 4.67 2 2.33 4.00 2.00Formate 1.33 0.5 2.67Ethanol 8.33 3 2.78 2.00 -2.00Lactate 8.33 3 2.78 2.00 0.00Succinate 9.00 3.5 2.57 -2.33 -2.00Glucose 18.67 6.0 3.11 0.00 0.00
a Production of the by-products acetate and ethanol was accompanied bythe concomitant production of 2 mol of formate per mol of glucose.
anaerobic to fully aerobic conditions. The optimal growthrate was computed to be a piece-wise linearly increasingfunction with increasing oxygen uptake rate (Fig. 4). Aglucose uptake rate of 10 mmol of Glc per g (dry weight)-hwas arbitrarily chosen for these computations; however, theresults are consistent with other glucose uptake rates, asdescribed below. There are four breakpoints in the curve,which divide metabolic behavior into five phases. Table 3shows the shadow prices for several metabolites in the fivephases. Below we discuss the five phases individually anddiscuss changes in metabolic behavior.
(i) Phase I. Under completely anaerobic conditions anoptimal growth rate of 0.26 h-1 was obtained, assuming aglucose uptake rate of 10 mmol of Glc per g (dry weight)-h,
1.0.
5-1
C-1
I-
S A
0>_
-.5,I5-rnI
PhasesI I[ m IV V
0 5 10 15 20Oxygen Supply (mmollg DW-hr)
FIG. 4. Optimal by-product secretion and growth for the com-plete range of oxygenation rates. Five distinct phases of oxygen-ation were identified on the basis of the growth characteristics andby-product secretion patterns. A glucose uptake rate of 10 mmol ofGlc per g (dry weight)-h was used for the computations. DW, dryweight.
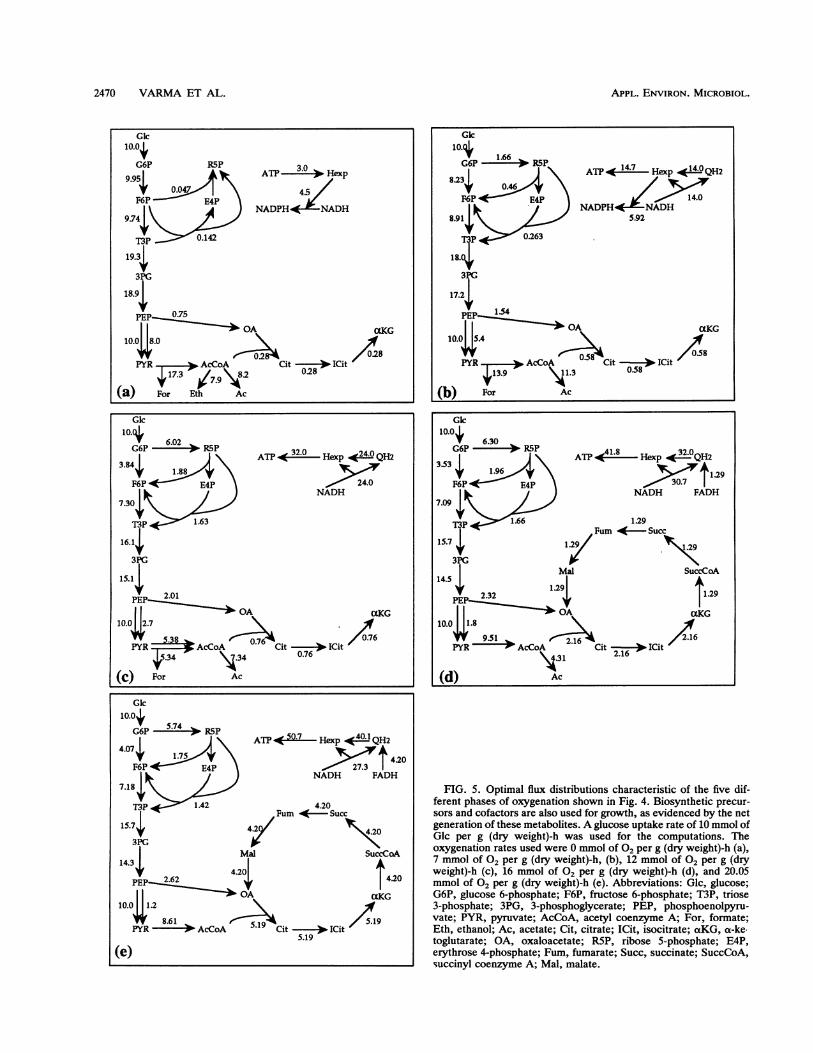
resulting in a biomass yield of 0.026 g of biomass per mmolof glucose. The flux distribution exhibited the well-acceptedanaerobic pattern of pathway utilization, including the use ofanaerobic pyruvate formate lyase (Fig. 5a). The non-use ofthe tricarboxylic acid cycle in the optimal anaerobic solutionhas also been observed experimentally. We also observedthat the majority of the biosynthetic redox potential wasproduced by transhydrogenation from NADH to NADPH.The three by-products acetate, ethanol, and formate weresecreted. Experimentally obtained by-product secretion pat-terns vary considerably depending on the culture conditions(3, 4). Table 4 shows experimentally observed by-productsecretion rates, as well as the optimal by-product secretionpattern along with the corresponding biomass yield. Theoptimal by-product secretions and the experimental obser-vations were very similar, indicating that anaerobicallygrowing E. coli is capable of stoichiometric optimality. Theexperimentally observed variation in by-product secretion isprobably a function of the ecological niche of the organism,as well as a response to specific culture conditions.An interpretation of optimal metabolic behavior under
anaerobic conditions can be obtained by using the shadowprices shown in Table 3. The three secreted by-products(acetate, ethanol, and formate) were found to have a shadowprice of zero, indicating that they cannot be used to improvegrowth. Succinate and lactate have positive shadow pricesand are therefore not secreted in the optimal growth solu-tion. The three redox carriers, NADH, FADH, and QH2,have negative shadow prices, indicating a desire to eliminatesurplus redox.
It is interesting, however, that biosynthetic redox,NADPH, is desirable, as indicated by its positive shadowprice. In the metabolic network biosynthetic redox can beproduced from NADH by transhydrogenation, a processthat utilizes the energy of the proton gradient. Since trans-hydrogenation is indeed used in the optimal solution (Fig.5a), we found that the shadow price of NADPH was the sumof the shadow prices ofNADH and two protons translocated(2. Hexp) (equation 8). As the energetic value of NADPH isgreater than its redox undesirability, we found that NADPHhas a net utility to the cell.
'YNADPH = 'YNADH + (2.0 x YHe,:)
0.0018 = - 0.0054 + (2.0 x 0.0036) (8)
(ii) Phase II. The next phase is typified by the cessation ofethanol secretion (Fig. 4). Acetate and formate are the onlyby-products secreted. The corresponding flux distribution isshown in Fig. 5b. The cytochromes are used for the terminaltransfer of electrons to oxygen. In this phase we observedthe contribution of the pentose phosphate pathway to bio-synthetic redox generation, although transhydrogenationwas still the major pathway for biosynthetic redox genera-tion.The ATP shadow prices in Table 3 decreased with increas-
ing aerobiosis, indicating that ATP has greater importanceunder anaerobic conditions. Except for biosynthetic redoxpotential, other redox potentials are still undesirable forgrowth, as indicated by their negative shadow prices. Of thesecretable products shown in Table 3, we observed thatethanol has value to the cell and therefore is not secreted. Itis surprising that ethanol has value to the cell since ethanolsecretion provides the means for eliminating NADH, whichhas negative value to the cell. This observation is explained
2468 VARMA ET AL.

E. COLI BY-PRODUCT SECRETION 2469
TABLE 3. Shadow prices computed by using dual optimization for selected metabolites under different oxygenation conditionsa
Shadow price (g of biomass/mmol of metabolite) at an oxygen uptake rate of:Metabolite
0 mmol/g (dry wt)-h 7 mmol/g (dry wt )-h 12 mmol/g (dry wt)-h 16 mmol/g (dry wt)-h 20.05 mmol/g (dry wt)-h
02 0.0399 0.0370 0.0283 0.0257 0.000ATP 0.0109 0.0107 0.0106 0.0104 0.0049Hexb 0.0036 0.0036 0.0035 0.0035 0.0016NADPH 0.0018 0.0029 0.0035 0.0038 0.0079NADH -0.0054 -0.0043 0.000 0.0010 0.0065FADH -0.0127 -0.0114 -0.0071 -0.0059 0.0033QH2 -0.0127 -0.0114 -0.0071 -0.0059 0.0033Acetate 0.0000 0.0000 0.0000 0.0000 0.0242Ethanol 0.0000 0.0021 0.0106 0.0125 0.0422Formate 0.0000 0.0000 0.0000 0.0010 0.0065Lactate 0.0054 0.0064 0.0106 0.0125 0.0422Succinate 0.0109 0.0128 0.0177 0.0170 0.0504
a Shadow prices measure the marginal importance of a metabolite toward accelerating growth. The values are the shadow prices determined under theoxygenation conditions of Fig. 5. The specific growth rates for oxygen uptakes rates of 0, 7, 12, 16, and 20.05 mmol/g (dry weight)-h were 0.262, 0.538, 0.701,0.809, and 0.913 h 1, respectively.
b He,Cp represents the energy of the transmembrane proton gradient as the translocation (export) of one proton across the membrane.
by considering acetate secretion (producing one ATP mole-cule) as an alternative to ethanol secretion. Thus, the posi-tive shadow price of ethanol is the sum of the shadow pricesof one ATP molecule and two NADH molecules (equation9). In other words, the usefulness of generating energy fromacetate secretion outweighs the usefulness of ethanol secre-tion to eliminate redox:
'Yethanol = YATP + (2.0 X YNADH)
0.0021 = 0.0107 + (2.0 x - 0.0043) (9)
(iii) Phase IH. At an oxygen supply rate of 12 mmol of 02per g (dry weight)-h we observed another phase of oxygen-ation, although secretion of acetate and formate still oc-curred. This phase is characterized by an NADH shadowprice of zero (Table 3), indicating that the cell is not forcedto eliminate NADH. The energy-poor redox carriers FADHand QH2 are however still undesirable for growth. Thecorresponding flux distribution in Fig. 5c shows that bothpyruvate dehydrogenase and pyruvate formate lyase areutilized for the conversion of pyruvate to acetyl coenzymeA. Thus, the cell deliberately produces NADH in thisconversion rather than eliminating redox as formate. Weobserved the first utilization of the aerobic pyruvate dehy-drogenase in this phase. We also found that transhydroge-nation is not used for biosynthetic redox generation andalmost all of the biosynthetic redox requirements are met bythe pentose phosphate pathway.
(iv) Phase IV. By increasing the oxygen supply to 16 mmolof 02 per g (dry weight)-h we observed the aerobic phase.The optimal flux distribution corresponding to this oxygensupply is shown in Fig. Sd. In this phase we observed theutilization of the complete tricarboxylic acid cycle for energygeneration. The anaerobic pyruvate formate lyase is notused. Acetate is the only by-product secreted. The corre-sponding shadow prices shown in Table 3 indicate thatacetate, with a shadow price of zero, is the only nondesirableby-product. Formate and NADH have positive utility forgrowth. The low-energy redox carriers FADH and QH2 arestill undesirable and have negative shadow prices.
(v) Phase V. The last phase of oxygenation is the phase ofadequate oxygen supply. Figure Se shows the optimal fluxdistribution corresponding to an oxygen uptake rate of 20.05mmol Of 02 per (dry weight)-h. No by-product is formed, and
the entire substrate is utilized for growth. The tricarboxylicacid cycle is the major source of energy through oxidativephosphorylation. Almost equal amounts of biosynthetic re-dox are produced by isocitrate dehydrogenase and thepentose phosphate pathway. The corresponding shadowprices shown in Table 3 are positive for all of the metabo-lites, indicating that there are no surpluses. Oxygen has ashadow price of zero, indicating that there is an adequatesupply of this element. All redox molecules have positiveshadow prices, indicating their utility for growth in propor-tion to their conversion to energy by the respiratory chain.Although in the computations of the five oxygenation
states described above we used a glucose supply rate of 10mmol of Glc per g (dry weight)-h, similar results can beobtained for other glucose supply rates. Figure 6 shows thedifferent phases of oxygenation as a function of the glucosesupply rate. The oxygenation condition is determined by thecombination of the glucose and oxygen supply rates.
Relationship of cell concentration, glucose, and oxygensupply to by-product secretion. We return now to the ques-tion raised in the Introduction. Namely, what is the balancebetween glucose and oxygen supply rates and the cellconcentration at which by-product secretion occurs? Oxy-genation in typical cell culture equipment is subject toconstraints, as determined by the mass transfer coefficient(k,a). On the other hand, glucose supply is a variable that anexperimenter can easily control. For a fixed glucose supply,when oxygen demand increases because of cell growth andexceeds the oxygen supply, by-product secretion is ob-served.
Figure 7 summarizes the relationship of the three quanti-ties (oxygen supply, glucose supply, and biomass concentra-tion). It shows the conditions under which by-product secre-tion occurs. In general, acetate is the first by-product to besecreted, followed by formate and finally ethanol. At highglucose uptake rates, such as 10 and 20 mmol of Glc per g(dry weight)-h, oxygen consumption is enzymatically lim-ited. Therefore by-product secretion occurs at all oxygensupply constraints, as indicated by the by-product secretionlines merging with the x axis in Fig. 7. To give a specificexample, if the glucose supply rate is 10 mmol of Glc per g(dry weight)-h and oxygenation is limited to 0.02 mol/literper h, then acetate is always secreted, formate is secreted at
VOL. 59, 1993
APPL. ENvIRON. MICROBIOL.
FIG. 5. Optimal flux distributions characteristic of the five dif-ferent phases of oxygenation shown in Fig. 4. Biosynthetic precur-sors and cofactors are also used for growth, as evidenced by the netgeneration of these metabolites. A glucose uptake rate of 10 mmol ofGlc per g (dry weight)-h was used for the computations. Theoxygenation rates used were 0 mmol of 02 per g (dry weight)-h (a),7 mmol of 02 per g (dry weight)-h, (b), 12 mmol Of ° 2 per g (dryweight)-h (c), 16 mmol of 02 per g (dry weight)-h (d), and 20.05mmol of 02 per g (dry weight)-h (e). Abbreviations: Glc, glucose;G6P, glucose 6-phosphate; F6P, fructose 6-phosphate; T3P, triose3-phosphate; 3PG, 3-phosphoglycerate; PEP, phosphoenolpyru-vate; PYR, pyruvate; AcCoA, acetyl coenzyme A; For, formate;Eth, ethanol; Ac, acetate; Cit, citrate; ICit, isocitrate; aKG, a-ketoglutarate; OA, oxaloacetate; R5P, ribose 5-phosphate; E4P,erythrose 4-phosphate; Fum, fumarate; Succ, succinate; SuccCoA,succinyl coenzyme A; Mal, malate.
Gkc10.0+
G6P R5P 3.09.941 0 ATP --*> Hexp
F6P E4PNADPH - NADH
T3P 0.14219.313PG
18.9
0.75OA OCKG
10.0 8.0 \
PYR-t-/AcCoA Ct -17.3Fo.9 0.2
(a) For Eth Ac
) ATP < 14.7 Hexp <140QH2
JNADPH j NAH5.92
QOA aKG
8Cit - 4ICit/058<, 11- 05
(b)Gkc
10.4 .0G6P 6-2 R.P 3.
RP\ ATP Hexp < QH23.84> 1.88
F6P E4P\ 24.07.34 NADH7.308 \
TI P 1.63
16.14,3PG
15.1
PE 2.0110.04,,2 QA OCKG
10.0 2.7 \i
PYR AcCoA Cit - > ICit.5.34 \4.34 0.76
(C) For Ac
G6For - P ikr ATP 41.8 323533 . Hexp 4<.'QH2
*6P 1.96 \> 3 t1 .29F6P < ~E4P37.04'|,;' /NADH FADH
1.1.66 1.29I5.7~ Fum < Succ
15.7 1.29/ 29
Mal SuccCoA14.5 1.291 t1.29
PEP49A OKG
Py9.YR AcCoA Cit -C ICit /.16
\A.31 2.16
(d) Ac
Gkc10.0+
G6P -574* R5P AAT 50.7 Hexp *40.1 QH24.074, >1.75 4.20
F6P E4P7.14 NADH FADH7.18 \
1,p 1.42 4.2015.3d1,, // Fum <- Succ15.7> 4.29 42
Mal SuccCoA14.4
2.2 4.201 4.20
OA OaKG10.0 , 1.2 86 AG
py8.61 A5o19
t O ct//5PYR > AcCoA * Cit - > ICit5.19
(e)
2470 VARMA ET AL.
3

E. COLI BY-PRODUCT SECRETION 2471
TABLE 4. Comparison of experimental and optimal by-productsecretion rates for anaerobic growth of E. coli on glucosea
Secretion rate (mmollmmol of Glc)Product
Optimal Exptlb
Acetate 0.815 0.75Ethanol 0.786 0.87Formate 1.73 1.13Lactate 0.00 trSuccinate 0.00 0.12
a The biomass yields under optimal and experimental conditions were 0.026and 0.03 g (dry weight) per mmol of Glc, respectively.
b Data from reference 3.
a cell concentration of 1.5 g (dry weight) per liter, andethanol is secreted at a cell concentration of 3.5 g (dryweight) per liter.What are the limits of anaerobic growth? An interesting
question concerning the limits of anaerobic growth ariseswhen the results described above are examined. The answercan be found by examining Fig. 3. The computations for Fig.3 assumed the maximal uptake rate of oxygen, and weobserved critical growth rates (,uy) above which by-productsecretion occurred. These critical growth rates did vary withthe oxygen uptake rate.Computation of the critical growth rates with varying
oxygen uptake rates demonstrated that there is a linearrelationship for the three by-products (Fig. 8). Interestingly,the critical growth rate for ethanol reaches zero at a finiteoxygen uptake rate (0.88 mmol of 02 per g [dry weight]-h).This result means that for any oxygen supply below thisoxygen uptake rate all three by-products are secreted. Thus,this condition can be defined as the limit of anaerobicgrowth.
DISCUSSIONIn this study we focused on the optimal performance of the
E. coli catabolic network based solely on metabolic stoichi-ometry. Linear optimization was used to locate the meta-bolic flux distribution that resulted in optimal growth withinthe set of allowable flux distributions. The results obtainedthus reflect a stoichiometric optimality of growth.With growth defined on the basis of composition-based
metabolite requirements, the maintenance requirementswere determined from the established relationship betweenglucose uptake rate and growth rate. We obtained a growth-associated maintenance value of 23 mmol of ATP per g (dryweight) and a non-growth-associated maintenance value of5.87 mmol of ATP per g (dry weight)-h. These values formaintenance are based on growth data obtained at 30° C andprobably vary with temperature (8, 15).The growth-associated maintenance costs can be com-
pared with the 41.26 mmol of ATP that is stoichiometricallyrequired to synthesize 1 g of biomass from biosyntheticprecursors (13). Thus, ATP maintenance requirements forgrowth are approximately 50% of the amounts required forbiosynthesis and polymerization. Under normal growth con-ditions the non-growth-associated maintenance value of 5.87mmol ofATP per g (dry weight)-h represents a small fractionof the energy requirements for growth. These ATP mainte-nance requirements compare well with the previously re-ported values of 6.8 mmol of ATP per g (dry weight)-h fornon-growth-associated maintenance and 71 mmol of ATPper g of biomass for the growth-associated total ATP re-
cn =
oA =
0 5 10 15 20Oxygen Supply (mmollg DW-hr)
FIG. 6. Five phases of oxygenation shown as a function glucosesupply and oxygen supply. A minimum glucose supply of about 0.31mmol of Glc per g (dry weight)-h is required to fulfill the non-growth-associated maintenance energy requirements. DW, dry weight.
quirement for the anaerobically growing organism Aero-bacter aerogenes (25).Using both growth-associated and non-growth-associated
maintenance requirements, we can compute the stoichiomet-rically optimal patterns of metabolic by-product secretionunder oxygen limitations. At various levels of glucose up-take we observed optimal secretion of by-products. Secre-tion is linear with growth rate, occurring above a criticalgrowth rate. Within experimental ranges of cell culturessimilar experimental observations for acetate secretion havebeen reported (2, 5, 10), and the possibility of a restriction ineither the respiratory system or a key tricarboxylic acidcycle enzyme has been suggested (16). Increasing the oxy-gen limitation results in optimal secretion of acetate, for-mate, and ethanol, in that order. The sequence of secretionis explained on the basis of the energy-to-redox ratios of theby-products, as well as their capability to provide a sink forredox potential.The critical growth rate determined for the by-products
acetate, formate, and ethanol increases linearly with theoxygen supply rate. Above the critical growth rate forethanol we observed the secretion of all by-products typicalof an anaerobic culture. Interestingly, at values below acritical oxygen supply level of 0.88 mmol of 02 per g (dryweight)-h we observed all by-products secreted at all growthrates. This critical oxygen supply level corresponds to thenon-growth-associated maintenance energy requirements ofthe bacterium.Oxygenation in a typical cell culture experiment is often
limited by mass transfer constraints. Typical mass transferlimits of oxygenation fall in the range from 0.05 to 0.1 mol of02 per liter-h. Thus, a growing culture provided with suffi-cient glucose faces external limits on its oxygen supply.Above a critical cell concentration the oxygen demand of theculture outstrips supply, and by-product secretion results.Therefore, depending on the cell concentration, a glucose-limited culture may face limits on the oxygen mass transferand thus become oxygen limited. Using the flux balanceapproach, we were able to predict oxygen limitations and thesecretion of by-products.An optimal growth solution under a variety of oxygenation
conditions exhibits several shifts in metabolic behavior.These phases of oxygenation are defined by changes in thevalues of different redox carriers. Since the redox balance iscoupled to several pathways in the metabolic network, we
VOL. 59, 1993

APPL. ENVIRON. MICROBIOL.
Q10
-~Acetate-- - Formate.--------Ethanol
0.08 0.10
Oxygen Supply
(moi/l-hr)
FIG. 7. By-product secretion shown as a function of cell concen-tration, glucose supply, and oxygen supply. Cell concentrations thatexceed the concentrations shown by the by-product secretion linesresult in the production of by-product. Fully aerobic cultures may befound only below the acetate secretion line. At high glucose supplyrates enzymatic limitations prevent a sufficient oxygen uptake rate,and by-products are secreted at all cell concentrations, as illustratedby the acetate and formate lines merging with the x axis at a glucoselevel of 20 mmol of Glc per g (dry weight)-h. DW, dry weight.
also observed shifts in metabolic pathway utilization. Sev-eral physiological observations are also related to the supplyof carbon source and oxygen. In the presence of plentifulglucose, flux redistribution occurs, resulting in the inhibitionof oxidative phosphorylation. It is probable that changes inthe value of redox carriers, as illustrated by the flux balanceapproach, are responsible for actuating the regulatory mech-anisms that cause the observed changes in pathway utiliza-tion. Some effects on metabolic regulation have been ob-served during the transition from fully aerobic to partiallyaerobic fermentation at different glucose uptake rates (6, 12).The shifts of metabolic behavior are externally observable inthe form of changing by-product secretion patterns.
In conclusion, we found that physiological observations ofmetabolic behavior are consistent with optimization ofgrowth rate within stoichiometric constraints. We thereforeexpect the general principle of stoichiometric optimality to
1.2
oP'; 5 10 15 20
Oxygen Supply (mmol/g DW-hr)FIG. 8. Variation in the critical growth rate (>c) for various
by-products at different oxygenation rates. DW, dry weight.
provide a physiological basis for the objectives of metabolicregulatory mechanisms. Stoichiometrically optimal metabo-lism provides a common basis for the interpretation ofobserved metabolic by-product secretion patterns under avariety of culture conditions and in the presence of limitingnutrient concentrations.
REFERENCES1. Anderson, K. B., and K. von Meyenburg. 1980. Are growth rates
of Eschenchia coli in batch cultures limited by respiration. J.Bacteriol. 144:114-123.
2. Bajpai, R. 1987. Control of bacterial fermentations. Ann. N. Y.Acad. Sci. 506:446-458.
3. Belaich, A., and J. P. Belaich. 1976. Microcalorimetric study ofthe anaerobic growth of Escherichia coli: growth thermogramsin a synthetic medium. J. Bacteriol. 125:14-18.
4. Blackwood, A. C., A. C. Neish, and G. A. Ledingham. 1956.Dissimilation of glucose at controlled pH values by pigmentedand non-pigmented strains of Escherichia coli. J. Bacteriol.72:497-499.
5. Brittan, R. J. 1954. Extracellular metabolic products of Esche-richia coli during rapid growth. Science 119:578.
6. Doelle, H. W., and N. W. Hollywood. 1978. Bioenergetic aspectsof aerobic glucose metabolism of Escherichia coli k-12 undervarying specific growth rates and glucose concentrations. Mi-crobios 21:47-60.
7. Domach, M. M., S. K. Leung, G. G. Cahn, and M. L. Shuler.1984. Computer model for glucose-limited growth of a single cellof Eschenichia coli Br-A. Biotechnol. Bioeng. 26:203-216.
8. Farmer, I. S., and C. W. Jones. 1976. The effect of temperatureon the molar growth yield and maintenance requirement ofEscherichia coli w during aerobic growth in continuous culture.FEBS Lett. 67:359-363.
9. Fell, D. A., and J. A. Small. 1986. Fat synthesis in adiposetissue. An examination of stoichiometric constraints. Biochem.J. 238:781-786.
10. Fieschko, J., and T. Ritch. 1986. Production of human alphaconsensus interferon in recombinant Escherichia coli. Chem.Eng. Commun. 45:229-240.
11. Gyr, M. 1978. Linear optimization using the simplex algorithm(simple). CERN Computer Center Program Library, CERN,Geneva, Switzerland.
12. Hollywood, N., and H. W. Doelle. 1976. Effect of specific growthrate and glucose concentration on growth and glucose metabo-lism of Eschenichia coli k-12. Microbios 17:23-33.
13. Ingraham, J. L., 0. Maale, and F. C. Neidhardt. 1983. Growthof the bacterial cell. Sinauer Associates, Inc., Sunderland,Mass.
14. Joshi, A., and B. 0. Palsson. 1989. Metabolic dynamics in thehuman red cell. I. A comprehensive model. J. Theor. Biol.141:515-528.
15. Mainzer, S. E., and W. P. Hempfling. 1976. Effects of growthtemperature on yield and maintenance during glucose-limitedcontinuous culture of Escherichia coli. J. Bacteriol. 126:251-256.
16. Majewski, R. A., and M. M. Domach. 1990. Simple constrained-optimization view of acetate overflow in E. coli. Biotechnol.Bioeng. 35:732-738.
17. Marr, A. G., E. H. Nilson, and D. J. Clark 1963. The mainte-nance requirement of Escherichia coli. Ann. N. Y. Acad. Sci.102:536-548.
18. Murty, K G. 1983. Linear programming. John Wiley & Sons,New York.
19. Neissel, 0. M., and D. W. Tempest. 1976. Bioenergetic aspectsof aerobic growth of Kiebsiella aerogenes NCTC 418 in carbon-limited and carbon-sufficient chemostat culture. Arch. Micro-biol. 107:215-221.
20. Pirt, S. J. 1965. The maintenance energy of bacteria in growingcultures. Proc. R. Soc. London Biol. Sci. B 163:224-231.
21. Pirt, S. J. 1982. Maintenance energy: a general model forenergy-limited and energy-sufficient growth. Arch. Microbiol.133:300-302.
2472 VARMA ET AL.
E. COLI BY-PRODUCr SECRETION 2473
22. Savinell, J. M., and B. 0. Palsson. 1992. Network analysis ofintermediary metabolism using linear optimization. I. Develop-ment of mathematical formalism. J. Theor. Biol. 154:421-454.
23. Schulze, K. L., and R. S. Lipe. 1964. Relationship betweensubstrate concentration, growth rate, and respiration rate ofEscherichia coli in continuous culture. Arch. Microbiol. 48:1-20.
24. Shuler, M. L., S. Leung, and C. C. Dick. 1979. A mathematicalmodel for the growth of a single bacterial cell. Ann. N. Y. Acad.Sci. 326:35-55.
25. Stouthamer, A. H., and C. W. Bettenhaussen. 1975. Determina-tion of the efficiency of oxidative phosphorylation in continuous
cultures ofAerobacter aerogenes. Arch. Microbiol. 102:187-192.26. Stouthamer, A. H., and C. W. Bettenhaussen. 1976. Energetic
aspects of anaerobic growth of Aerobacter aerogenes in com-plex medium. Arch. Microbiol. 111:21-23.
27. Varma, A., and B. 0. Palsson. Metabolic capabilities of Esche-richia coli. I. Synthesis of biosynthetic precursors and cofac-tors. J. Theor. Biol., in press.
28. Varma, A., and B. 0. Paisson. Metabolic capabilities of Esche-richia coli. II. Optimal growth patterns. J. Theor. Biol., inpress.
29. Watson, M. R. 1986. A discrete model of bacterial metabolism.Comput. Appl. Biosci. 2:23-27.
VOL. 59, 1993