Stock Trading Parameters
12
1 Table of Contents Stock Exchange Parameters ............................................................................................................. 1 Fundamental Stock Analysis ................................................................................................... 3 Stock Fundamental Analysis (Value, Growth, Income, GARP, Quality) .................. 3 Quantitative Stock Fundamental Analysis – Buying Based on Numbers.................................. 5 Arguments Against Quantitative Fundamental Stock Analysis ................................................ 6 Technical Stock Analysis .................................................................................................................... 7 Moving average .................................................................................................................................. 8 MACD .................................................................................................................................................. 3 Stochastic ............................................................................................................................................ 10 RSI ....................................................................................................................................................... 11 Average Directional Index (ADX) ................................................................................................. 11 Conclusion ............................................................................................................................................. 12 References .............................................................................................................................................. 13
-
Upload
firoz-hossen -
Category
Documents
-
view
24 -
download
0
description
Stock Trading Parameters
Transcript of Stock Trading Parameters

1
Table of Contents
Stock Exchange Parameters ............................................................................................................. 1
Fundamental Stock Analysis ................................................................................................... 3
Stock Fundamental Analysis (Value, Growth, Income, GARP, Quality) .................. 3
Quantitative Stock Fundamental Analysis – Buying Based on Numbers .................................. 5
Arguments Against Quantitative Fundamental Stock Analysis ................................................ 6
Technical Stock Analysis .................................................................................................................... 7
Moving average .................................................................................................................................. 8
MACD .................................................................................................................................................. 3
Stochastic ............................................................................................................................................ 10
RSI ....................................................................................................................................................... 11
Average Directional Index (ADX) ................................................................................................. 11
Conclusion ............................................................................................................................................. 12
References .............................................................................................................................................. 13
2
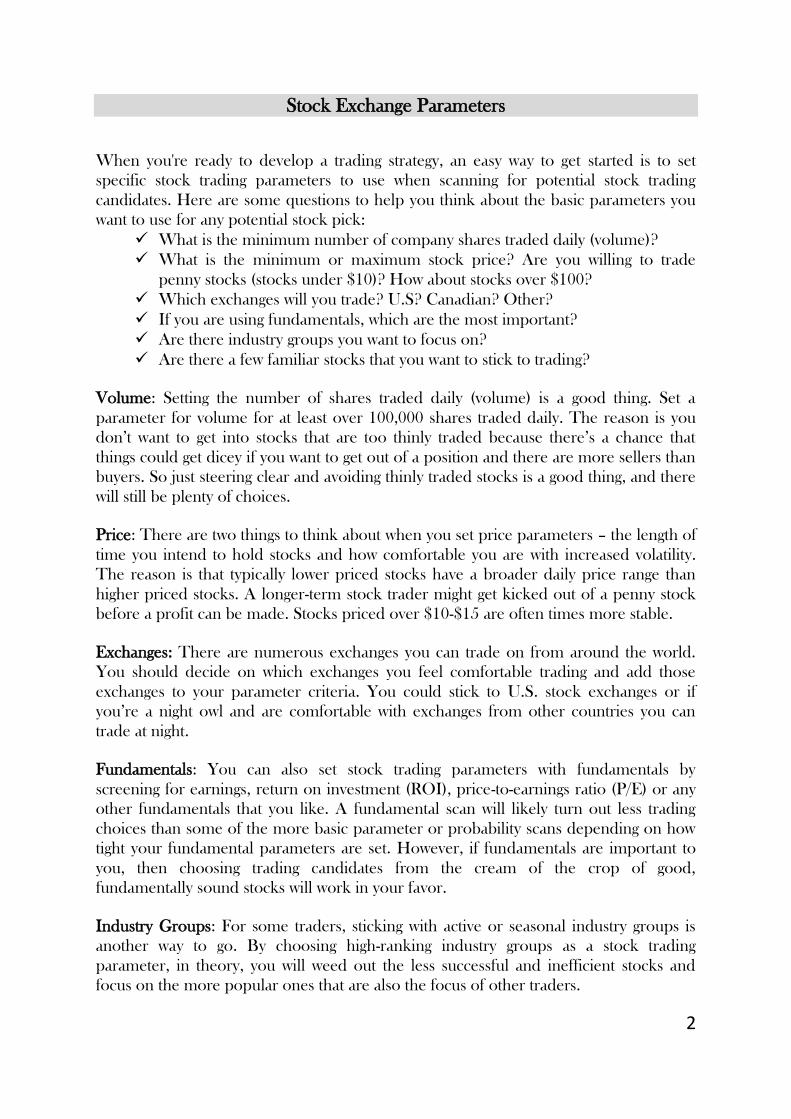
Stock Exchange Parameters
When you're ready to develop a trading strategy, an easy way to get started is to set
specific stock trading parameters to use when scanning for potential stock trading
candidates. Here are some questions to help you think about the basic parameters you
want to use for any potential stock pick:
What is the minimum number of company shares traded daily (volume)?
What is the minimum or maximum stock price? Are you willing to trade
penny stocks (stocks under $10)? How about stocks over $100?
Which exchanges will you trade? U.S? Canadian? Other?
If you are using fundamentals, which are the most important?
Are there industry groups you want to focus on?
Are there a few familiar stocks that you want to stick to trading?
Volume: Setting the number of shares traded daily (volume) is a good thing. Set a
parameter for volume for at least over 100,000 shares traded daily. The reason is you
don’t want to get into stocks that are too thinly traded because there’s a chance that
things could get dicey if you want to get out of a position and there are more sellers than
buyers. So just steering clear and avoiding thinly traded stocks is a good thing, and there
will still be plenty of choices.
Price: There are two things to think about when you set price parameters – the length of
time you intend to hold stocks and how comfortable you are with increased volatility.
The reason is that typically lower priced stocks have a broader daily price range than
higher priced stocks. A longer-term stock trader might get kicked out of a penny stock
before a profit can be made. Stocks priced over $10-$15 are often times more stable.
Exchanges: There are numerous exchanges you can trade on from around the world.
You should decide on which exchanges you feel comfortable trading and add those
exchanges to your parameter criteria. You could stick to U.S. stock exchanges or if
you’re a night owl and are comfortable with exchanges from other countries you can
trade at night.
Fundamentals: You can also set stock trading parameters with fundamentals by
screening for earnings, return on investment (ROI), price-to-earnings ratio (P/E) or any
other fundamentals that you like. A fundamental scan will likely turn out less trading
choices than some of the more basic parameter or probability scans depending on how
tight your fundamental parameters are set. However, if fundamentals are important to
you, then choosing trading candidates from the cream of the crop of good,
fundamentally sound stocks will work in your favor.
Industry Groups: For some traders, sticking with active or seasonal industry groups is
another way to go. By choosing high-ranking industry groups as a stock trading
parameter, in theory, you will weed out the less successful and inefficient stocks and
focus on the more popular ones that are also the focus of other traders.

3
Another strategy that falls into a set parameter is to choose a group of stocks that you
like and put them into a ―stable‖ from which to trade. For example, that is what is done
in a rolling stocks strategy.
If you want to bring back a shorter list of trading candidates you can also incorporate
higher than usual trading volume, 52-week highs in your scan criteria or any other
parameters that you think will be successful.
Stock trading parameters are just a part of stock trading strategies and a complete stock
trading plan.
After the general parameters have been set, a second round of criteria needs to be
identified. This next group of criteria is based on probabilities that a stock will do
something.
Fundamental Stock Analysis
Fundamental Stock Analysis is typically more closely tied to buy and hold investors,
whereby day traders use solely technical analysis and most swing traders use both
fundamental and technical stock analysis. Technical analysis is specifically important for
swing traders with a very short time horizon (that is, a couple of days or just a few
weeks). Most swing trading software uses only technical analysis but the Stock nod
neural network uses a blended custom recipe of both technician’s and fundamentals.
Stock fundamental analysis can answer questions that are beyond the scope of technical
analysis, such as ―Why is this security price moving?‖
Stock Fundamental Analysis (Value, Growth, Income, GARP, Quality)
Many people rightly believe that when you buy a share of stock you are buying a
proportional share in a business. As a consequence, to figure out how much the stock is
worth, you should determine how much the business is worth. Investors generally do
this by assessing the company’s financials in terms of per-share values in order to
calculate how much the proportional share of the business is worth. This is known as
―fundamental‖ analysis by some, and most who use it view it as the only kind of rational
stock analysis.
Although analyzing a business might seem like a straightforward activity, there are many
flavors of fundamental analysis. Investors often create oppositions and subcategories in
order to better understand their specific investing philosophy. In the end, most investors
come up with an approach that is a blend of a number of different approaches. Many of
the distinctions are more academic inventions than actual practical differences. For
instance, value and growth have been codified by economists who study the stock
market even though market practitioners do not find these labels to be quite as useful.
In the following descriptions, we will focus on what most investors mean when they use
these labels, although you always have to be careful to double-check what someone
using them really means.

4
Value: A cynic, as the saying goes, is someone who knows the price of everything and
the value of nothing. An investor’s purpose, though, should be to know both the price
and the value of a company’s stock. The goal of the value investor is to purchase
companies at a large discount to their intrinsic value – what the business would be worth
if it were sold tomorrow. In a sense, all investors are ―value‖ investors – they want to buy
a stock that is worth more than what they paid. Typically those who describe themselves
as value investors are focused on the liquidation value of a company, or what it might be
worth if all of its assets were sold tomorrow. However, value can be a very confusing
label as the idea of intrinsic value is not specifically limited to the notion of liquidation
value. Novices should understand that although most value investors believe in certain
things, not all who use the word ―value‖ mean the same thing.
The person viewed as providing the foundation for modern value investing is Benjamin
Graham, whose 1934 book Security Analysis (co-written with David Dodd) is still widely
used today. Other investors viewed as serious practitioners of the value approach
include Sir John Templeton and Michael Price. These value investors tend to have very
strict, absolute rules governing how they purchase a company’s stock. These rules are
usually based on relationships between the current market price of the company and
certain business fundamentals. A few examples include:
Price/earnings ratios (P/E)
Dividend yields above a certain absolute limit
Book value per share relative to the share price
Total sales at a certain level relative to the company’s market capitalization of
market value
Growth: Growth investing is the idea that you should buy stock in companies whose
potential for growth in sales and earnings is excellent. Growth investors tend to focus
more on the company’s value as an ongoing concern. Many plan to hold these stocks
for long periods of time, although this is not always the case. At a certain point, ―growth‖
as a label is as dysfunctional as ―value,‖ given that very few people want to buy
companies that are not growing.
Growth investors look at the underlying quality of the business and the rate at which it is
growing in order to analyze whether to buy it. Excited by new companies, new
industries, and new markets, growth investors normally buy companies that they believe
are capable of increasing sales, earnings, and other important business metrics by a
minimum amount each year. Growth is often discussed in opposition to value, but
sometimes the lines between the two approaches become quite fuzzy in practice.
Income: Although today common stocks are widely purchased by people who expect
the shares to increase in value, there are still many people who buy stocks primarily
because of the stream of dividends they generate. Called income investors, these
5
individuals often entirely forego companies whose shares have the possibility of capital
appreciation for high-yielding dividend-paying companies in slow-growth industries.
These investors focus on companies that pay high dividends like utilities and real estate
investment trusts (REITs), although many times they may invest in companies
undergoing significant business problems whose share prices have sunk so low that the
dividend yield is consequently very high.
Quality: Most investors today use a hybrid of value, growth, and GARP approaches.
These investors are looking for high-quality businesses selling for ―reasonable‖ prices.
Although they do not have any shorthand rules for what kind of numerical relationships
there should be between the share price and business fundamentals, they do share a
similar philosophy of looking at the company’s valuation and at the inherent quality of
the company as measured both quantitatively by concepts like Return on Equity (ROE)
and qualitatively by the competence of management. Many of them describe themselves
as value investors, although they concentrate much more on the value of the company
as an ongoing concern rather than on liquidation value.
Warren Buffett of Berkshire Hathaway is probably the most famous practitioner of this
approach. He studied under Benjamin Graham at Columbia Business School but was
eventually swayed by his partner, Charlie Munger, to also pay attention to Phil Fisher’s
message of growth and quality.
GARP: Aside from being the name of the title character played by Robin Williams in
John Irving’s The World According to Garp, is an acronym for growth at a reasonable
price. The world according to GARP investors combines the value and growth
approaches and adds a numerical slant. Practitioners look for companies with solid
growth prospects and current share prices that do not reflect the intrinsic value of the
business, getting a ―double play‖ as earnings increase and the price/earnings (P/E) ratios
at which those earnings are valued increase as well.
One of the most common GARP approaches is to buy stocks when the P/E ratio is
lower than the rate at which earnings per share can grow in the future. As the company’s
earnings per share grow, the P/E of the company will fall if the share price remains
constant. Since fast-growing companies normally can sustain high P/Es, the GARP
investor is buying a company that will be cheap tomorrow if the growth occurs as
expected. If the growth does not come, however, the GARP investor’s perceived
bargain can disappear very quickly.
Quantitative Stock Fundamental Analysis – Buying Based on Numbers
Pure quantitative analysts look only at numbers with almost no regard for the underlying
business. The more you find yourself talking about numbers, the more likely you are to
be using a purely quantitative approach. Although even fundamental analysis requires
some numerical inputs, the primary concern is always the underlying business, focusing
on things like management’s expertise, the competitive environment, the market

6
potential for new products, and the like. Quantitative analysts view these things as
subjective judgments, and instead focus on the incontrovertible objective data that can
be analyzed.
In recent years as computers have been used to do a lot of number crunching, many
―quants,‖ as they like to call themselves, have gone completely native and will only buy
and sell companies on a purely quantitative basis, without regard for the actual business
or the current valuation – a radical departure from fundamental analysis. ―Quants‖ will
often mix in ideas like a stock’s relative strength, a measure of how well the stock has
performed relative to the market as a whole. Many investors believe that if they just find
the right kinds of numbers, they can always find winning investments.
Company Size. Some investors purposefully narrow their range of investments to only
companies of a certain size, measured either by market capitalization or by revenues.
The most common way to do this is to break up companies by market capitalization
and call them micro-caps, small-caps, mid-caps, and large-caps, with ―cap‖ being short
for ―capitalization.‖ Different-size companies have shown different returns over time,
with the returns being higher the smaller the company. Others believe that because a
company’s market capitalization is as much a factor of the market’s excitement about
the company as it is the size, revenues are a much better way to break up the company
universe. Although there is no set breakdown used by all investors, most distinctions
look something like this:
MICRO - $100 million or less SMALL - $100 million to $500 million MID - $500 million to $5 billion LARGE - $5 billion or more
Arguments Against Quantitative Fundamental Stock Analysis.
Because quantitative analysis hinges on screens that anyone can use, as computing
horsepower becomes cheaper and cheaper many of the pricing inefficiencies
quantitative analysis finds are wiped out soon after they are discovered. If a particular
screen has generated 40% returns per year and becomes widely known, and if lots of
money flows into the companies that the screen identifies, the returns will start to suffer.
As ―fuzzy‖ as fundamental analysis might be, there are often times that knowing even a
little about the company you are buying can help a lot. For instance, if you are using a
high-relative-strength screen, you should always check and see if the companies you find
have risen in price because of a merger or an acquisition. If this is the case, then the
price will probably stay right where it is, even if the ―screen‖ you used to pick this
company has generated high annual returns in the past. All Stock nod fundamental and
technical analysis filters this ―fuzzy‖ data which allows pinpointed buy and entry signals
for any market.

7
Stock Technical Analysis- What would you do if you truly believed that all information
about publicly traded companies was efficiently distributed and that nobody could get
an edge on anyone else by either understanding the business or analyzing the numbers?
You might consider simply giving up on beating the market’s returns by buying an index
fund. Some investors have taken an alternate route to find this technical stock analysis.
There are several technical analysis software programs available, but all require a steep
learning curve and long hours of tedious homework.
Technical Stock Analysis
If you find yourself asking – what do I need to be successful in the stock market – the
answer is technical analysis. It doesn’t matter if you’re a long-term investor or a short-
term trader. Technical analysis will make you a better trader.
Technical analysis is the study of how the price of a share of stock or index is moving
on a stock market chart. It usually involves the use of an indicator or oscillator to
measure various aspects of price, including trends, price ranges, price and volume
combinations, rate of change, etc. The idea for using technical analysis is that prices are
not completely random, but rather, they follow price patterns.
If you look at a chart you'll see that daily prices for the most part, connect from day to
day. The daily price of a stock has a relationship with the prior day’s action and so on.
Even stocks with volatile price movements have a day-to-day relationship and
subsequently, create a pattern of movement.
If we go a little deeper, technical analysis is also a way to read true trader sentiment
about a stock because what makes the price of a stock go up or down is whether the
majority of traders want to buy it or sell it. And so, price patterns are created when
buyers and sellers react/respond to price action.
Some of the most used technical indicators are:
Moving average
MACD
Stochastic
RSI
Average Directional Index (ADX)
Moving average
A moving average (MA) is an average of price over a defined period of time for a stock
or index. The line generated by this formula will signal a trending (upward or
downward) or a non-trending price direction of a stock or index.
You’ll frequently see a combination of two time periods applied to a chart. Popular
combinations are:

8
10 and 30
20 and 50
50 and 200
These lines will give you significant information about how price is moving. For
example, when both lines are simultaneously moving in a direction or crossing over one
another. There are two common, but slightly different MA calculations – simple and
exponential.
Simple Moving Average (SMA)
The SMA is calculated by taking the closing price of a stock or an index for a number
of days, adding them up and dividing the figure by that number of days to get a SMA of
price.
In the example below of the $NYA (NYSE Composite Index), the 20-day (red line) and
50-day (blue line) SMA overlays are applied to the chart.
MACD (Moving Average Convergence Divergence)
A trend-following momentum indicator that shows the relationship between two moving
averages of prices. The MACD is calculated by subtracting the 26-day exponential
moving average (EMA) from the 12-day EMA. A nine-day EMA of the MACD, called
the "signal line", is then plotted on top of the MACD, functioning as a trigger for buy
and sell signals.

9
Explains 'Moving Average Convergence Divergence - MACD'
There are three common methods used to interpret the MACD:
1. Crossovers - As shown in the chart above, when the MACD falls below the signal
line, it is a bearish signal, which indicates that it may be time to sell. Conversely, when
the MACD rises above the signal line, the indicator gives a bullish signal, which suggests
that the price of the asset is likely to experience upward momentum. Many traders wait
for a confirmed cross above the signal line before entering into a position to avoid
getting getting "faked out" or entering into a position too early, as shown by the first
arrow.
2. Divergence - When the security price diverges from the MACD. It signals the end of
the current trend.
3. Dramatic rise - When the MACD rises dramatically - that is, the shorter moving
average pulls away from the longer-term moving average - it is a signal that the security is
overbought and will soon return to normal levels.
Traders also watch for a move above or below the zero line because this signals the
position of the short-term average relative to the long-term average. When the MACD is
above zero, the short-term average is above the long-term average, which signals upward
momentum. The opposite is true when the MACD is below zero. As you can see from
the chart above, the zero line often acts as an area of support and resistance for the
indicator.
Stochastic
A technical momentum indicator that compares a security's closing price to its price
range over a given time period. The oscillator's sensitivity to market movements can be
reduced by adjusting the time period or by taking a moving average of the result. This
indicator is calculated with the following formula:
%K = 100[(C - L14)/(H14 - L14)]
C = the most recent closing price
L14 = the low of the 14 previous trading sessions
H14 = the highest price traded during the same 14-day period.
%D = 3-period moving average of %K

10
Relative Strength Index - RSI
A technical momentum indicator that compares the magnitude of recent gains to
recent losses in an attempt to determine overbought and oversold conditions of an
asset. It is calculated using the following formula:
RSI = 100 - 100/(1 + RS*)
*Where RS = Average of x days' up closes / Average of x days' down closes.
Relative Strength Index (RSI)
As you can see from the chart, the RSI ranges from 0 to 100. An asset is deemed to
be overbought once the RSI approaches the 70 level, meaning that it may be getting
overvalued and is a good candidate for a pullback. Likewise, if the RSI approaches
30, it is an indication that the asset may be getting oversold and therefore likely to
become undervalued.
Explains 'Relative Strength Index - RSI'
A trader using RSI should be aware that large surges and drops in the price of an asset
will affect the RSI by creating false buy or sell signals. The RSI is best used as a
valuable complement to other stock-picking tools
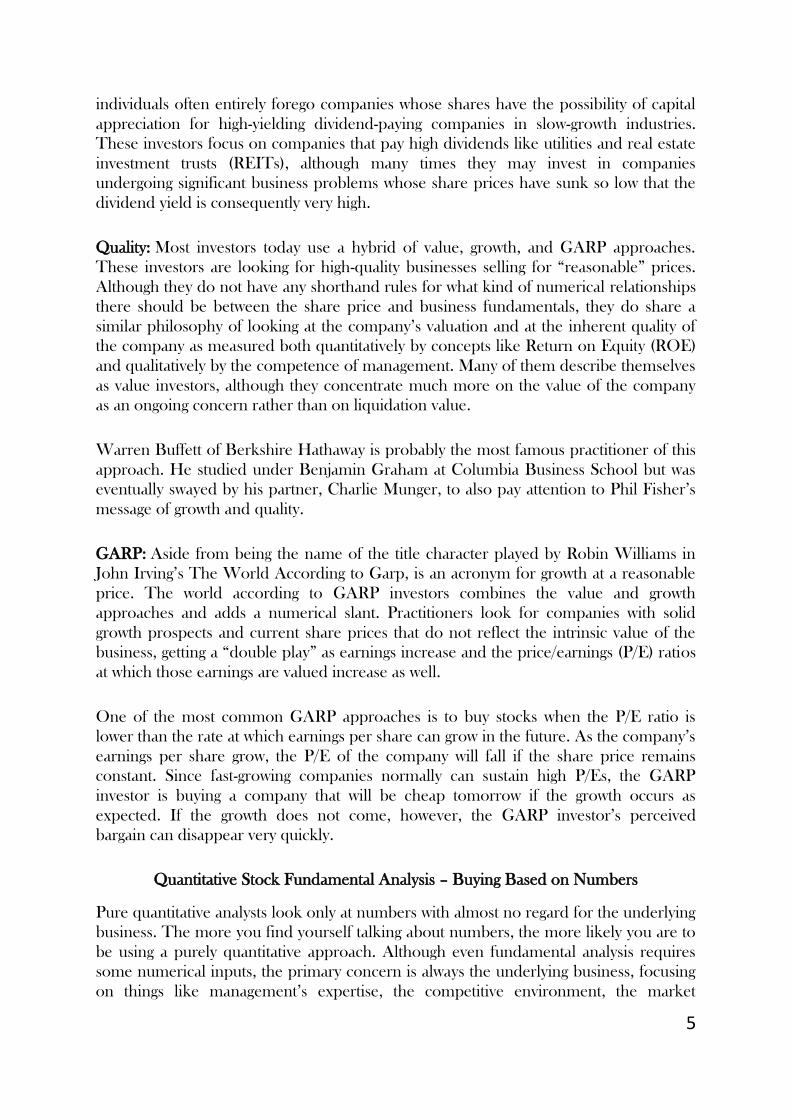
Average Directional Index Indicator (ADX)
The average directional index (ADX) is the king of trend indicators and can
absolutely work to determine trend. It gives a clear, easy-to-read picture of what is
happening with the market by providing a value to trend strength and insight to
whether a trend is strengthening or weakening.
11
This is the indicator I personally use to determine whether to enter long or short
positions or to stand aside in cash. It also helps me to see if I should tighten my stops
when trends begin to weaken.
The next two indicators, Moving Averages (MAs) and Parabolic SAR can help with
determining trend or confirm a move.
Conclusion
In this complex task of stock market prediction input parameters plays an important
factor as the choice of improper input variable may lead to lower accuracy.
Some parameters have big influence on stock price while some have less influence and
hence it is important to select correct set of inputs. Mostly Technical analysis variables
are used predominantly in machine learning techniques. Some tried to use different
variable like fundamental variables, microeconomic indicators, news articles, etc. We
found that while predicting stock market index microeconomic indicators have major
influence over other. On the other hand while predicting stock price other factors have
major influence. In case of using news articles it is important to find correct meaning
that news article otherwise it will worsen prediction ability.

12
From this survey we can conclude that hybridized parameters like combination of
technical and fundamental variable give better prediction accuracy over application of
standalone parameters.
References
i
stock-trading-warrior http://www.stock-trading-warrior.com/Stock-Trading-Parameters.html online
Available 09/02/2014
investinganswers.com http://www.investinganswers.com/financial-dictionary/technical-analysis/relative-
strength-index-rsi-850 online Available 09/02/2014
Robert D. Edwards ,John Magee and W.H.C. Bassetti.—Technical Analysis of Stock Trends‖, 8th Edition 2001
chapter
Sneha Soni ―Applications of ANNs in Stock Market Prediction: A Survey‖, ISSN : 2229-3345 Vol. 2 No.
Zabir Haider Khan, Tasnim Sharmin Alin, Md. Akter Hussain,‖ Price Prediction of Share Market using
ArtificiaNeural Network (ANN)‖, International Journal of Computer Applications (0975 – 8887) Volume 22– No.2,
May 2011.
Kyoung-jae Kim A Won Boo Lee ― Stock market prediction using artificial neural networks with optimal feature
transformation‖ Springer-Verlag London Limited 2004.
Oleksandr Yefimochkin,‖ FUNDAMENTAL:Using Macroeconomic Indicators and Genetic Algorithms in
Stock Market Forecasting‖, Master thesis,O ctober 2011.