Stock Symbol: AEM (NYSE and TSX) Investor Relations (416 ...€¦ · AGNICO EAGLE REPORTS FOURTH...
77
Stock Symbol: AEM (NYSE and TSX) For further information: Investor Relations (416) 947-1212 (All amounts expressed in U.S. dollars (“$” or “US$”) unless otherwise noted) AGNICO EAGLE REPORTS FOURTH QUARTER AND FULL YEAR 2015 RESULTS – STRONG OPERATIONAL PERFORMANCE YIELDS RECORD ANNUAL PRODUCTION; UPDATED AMARUQ MINERAL RESOURCES AND INITIAL MINERAL RESOURCES DECLARED AT EL BARQUEÑO AND THE SISAR ZONE AT KITTILA Toronto (February 10, 2016) – Agnico Eagle Mines Limited (NYSE:AEM, TSX:AEM) ("Agnico Eagle" or the “Company”) today reported a quarterly net loss of $15.5 million, or a net loss of $0.07 per share for the fourth quarter of 2015. This result includes a non- cash foreign currency translation loss on deferred tax liabilities of $8.6 million ($0.04 per share), various mark-to-market adjustment losses of $5.0 million ($0.02 per share), unrealized losses on financial instruments of $3.3 million ($0.01 per share), non-cash foreign currency translation losses of $1.3 million ($0.01 per share), non-cash stock option expense of $3.6 million ($0.02 per share) and non-recurring gains of $2.4 million ($0.01). Excluding these items would result in adjusted net income of $3.9 million ($0.02 per share) for the fourth quarter of 2015. In the fourth quarter of 2014, the Company reported a net loss of $21.3 million or a net loss of $0.10 per share. Fourth quarter 2015 cash provided by operating activities was $140.7 million ($112.6 million before changes in non-cash components of working capital), this compares to cash provided by operating activities of $164.0 million in the fourth quarter of 2014 ($151.6 million before changes in non-cash components of working capital). The decrease in cash flow before changes in working capital during the current period was largely due to a tax adjustment in the fourth quarter of 2015. "In 2015, our operations continued to perform well, which allowed us to do better on both our production and cost guidance for the fourth consecutive year. Despite a volatile gold price environment, we doubled our exploration spending, continued to advance our pipeline of development projects, and reduced our net debt by approximately $190 million", said Sean Boyd, Agnico Eagle’s Chief Executive Officer. “Over the next three years, we are forecasting stable annual production and costs, which should allow us to continue to invest in our existing mines, maintain funding levels at our key exploration projects, advance our development pipeline in Nunavut at a steady and measured pace and maintain our history of continuous dividend payments to shareholders”, added Mr. Boyd. 1
Transcript of Stock Symbol: AEM (NYSE and TSX) Investor Relations (416 ...€¦ · AGNICO EAGLE REPORTS FOURTH...

Stock Symbol: AEM (NYSE and TSX) For further information: Investor Relations
(416) 947-1212
(All amounts expressed in U.S. dollars (“$” or “US$”) unless otherwise noted)
AGNICO EAGLE REPORTS FOURTH QUARTER AND FULL YEAR 2015 RESULTS – STRONG OPERATIONAL PERFORMANCE YIELDS RECORD ANNUAL
PRODUCTION; UPDATED AMARUQ MINERAL RESOURCES AND INITIAL MINERAL RESOURCES DECLARED AT EL BARQUEÑO AND THE SISAR ZONE AT KITTILA
Toronto (February 10, 2016) – Agnico Eagle Mines Limited (NYSE:AEM, TSX:AEM) ("Agnico Eagle" or the “Company”) today reported a quarterly net loss of $15.5 million, or a net loss of $0.07 per share for the fourth quarter of 2015. This result includes a non-cash foreign currency translation loss on deferred tax liabilities of $8.6 million ($0.04 per share), various mark-to-market adjustment losses of $5.0 million ($0.02 per share), unrealized losses on financial instruments of $3.3 million ($0.01 per share), non-cash foreign currency translation losses of $1.3 million ($0.01 per share), non-cash stock option expense of $3.6 million ($0.02 per share) and non-recurring gains of $2.4 million ($0.01). Excluding these items would result in adjusted net income of $3.9 million ($0.02 per share) for the fourth quarter of 2015. In the fourth quarter of 2014, the Company reported a net loss of $21.3 million or a net loss of $0.10 per share. Fourth quarter 2015 cash provided by operating activities was $140.7 million ($112.6 million before changes in non-cash components of working capital), this compares to cash provided by operating activities of $164.0 million in the fourth quarter of 2014 ($151.6 million before changes in non-cash components of working capital). The decrease in cash flow before changes in working capital during the current period was largely due to a tax adjustment in the fourth quarter of 2015. "In 2015, our operations continued to perform well, which allowed us to do better on both our production and cost guidance for the fourth consecutive year. Despite a volatile gold price environment, we doubled our exploration spending, continued to advance our pipeline of development projects, and reduced our net debt by approximately $190 million", said Sean Boyd, Agnico Eagle’s Chief Executive Officer. “Over the next three years, we are forecasting stable annual production and costs, which should allow us to continue to invest in our existing mines, maintain funding levels at our key exploration projects, advance our development pipeline in Nunavut at a steady and measured pace and maintain our history of continuous dividend payments to shareholders”, added Mr. Boyd.
1
Fourth quarter and full year 2015 highlights include:
• Guidance exceeded for fourth consecutive year – Payable production1 in 2015 was 1,671,340 ounces of gold at total cash costs2 per ounce on a by-product basis of $567, compared to guidance of 1,650,000 ounces at total cash costs per ounce on a by-product basis of $600. All-in sustaining costs per ounce3 (“AISC”) on a by-product basis for 2015 were $810, compared to guidance of $850 per ounce
• Stable production and costs expected through 2018 – Average annual
production from 2016 to 2018 is forecast to be approximately 1.53 million ounces of gold. Production for 2016 is forecast to be between 1.525 and 1.565 million ounces of gold with total cash costs per ounce on a by-product basis of between $590 and $630 per ounce. AISC for 2016 are forecast to be between $850 and $890 per ounce. Costs were calculated using a US$/C$ exchange rate of 1.30, EURO$/US$ exchange rate of 1.10 and a US$/MXP exchange rate of 16.00
• Increased gold reserve grades at key mines, significant increase in year-end
2015 gold resources, slight decline in gold reserves after mining depletion – Gold reserve grades increased at the LaRonde, Canadian Malartic, Goldex and La India mines. Measured and indicated mineral resources were up 1%, while
1Payable production of a mineral means the quantity of mineral produced during a period contained in products that are sold by the Company whether such products are shipped during the period or held as inventory at the end of the period. 2Total cash costs per ounce is a Non-GAAP measure. For a reconciliation to production costs, see “Reconciliation of Non-GAAP Financial Performance Measures” below. Total cash costs per ounce of gold produced is presented on both a by-product basis (deducting by-product metal revenues from production costs) and co-product basis (before by-product metal revenues). Total cash costs per ounce of gold produced on a by-product basis is calculated by adjusting production costs as recorded in the consolidated statements of income (loss) for by-product revenues, unsold concentrate inventory production costs, smelting, refining and marketing charges and other adjustments, and then dividing by the number of ounces of gold produced. Total cash costs per ounce of gold produced on a co-product basis is calculated in the same manner as total cash costs per ounce of gold produced on a by-product basis except that no adjustment for by-product metal revenues is made. See “Note Regarding Certain Measures of Performance”. For information about the Company’s total cash costs per ounce on a co-product basis please see “Reconciliation of Non-GAAP Performance Measures”. 3All-in-sustaining costs per ounce is a Non-GAAP measure and is used to show the full cost of gold production from current operations. For a reconciliation to production costs, see “Reconciliation of Non-GAAP Financial Performance Measures – Reconciliation of Production Costs to All-In Sustaining Costs per Ounce of Gold Produced” below. The Company calculates all-in sustaining costs per ounce of gold produced as the aggregate of total cash costs per ounce on a by-product basis, sustaining capital expenditures (including capitalized exploration), general and administrative expenses (including stock option expense) and reclamation expenses divided by the amount of gold produced. All-in sustaining costs per ounce of gold produced on a co-product basis is calculated in the same manner as all-in sustaining costs per ounce of gold produced on a by-product basis except that no adjustment for by-product metal revenues is made. The Company's methodology for calculating all-in sustaining costs per ounce may not be similar to the methodology used by other producers that disclose all-in sustaining costs per ounce. See "Note Regarding Certain Measures of Performance". The Company may change the methodology it uses to calculate all-in sustaining costs per ounce in the future, including in response to the adoption of formal industry guidance regarding this measure by the World Gold Council.
2
inferred mineral resources increased by 23%. Mineral reserves declined by only 5% (0.9 million ounces) to 19.1 million ounces due to mine depletion of approximately 1.8 million ounces
• Gold resources increased by 67% at Amaruq - Inferred mineral resources at
Amaruq now total 3.3 million ounces (16.9 million tonnes grading 6.05 grams per tonne (“g/t”) gold). The 2016 Phase 1 drill program (approximately 75,000 metres) is now underway with a focus on expanding and upgrading mineral resources and outlining a second open pit deposit
• Initial inferred gold resources declared at El Barqueño and the Sisar Zone at
Kittilla – At El Barqueño, initial inferred mineral resources are estimated to be 0.61 million ounces (19.7 million tonnes grading 0.96 g/t gold), while at Kittila the recently discovered Sisar Zone contains inferred mineral resources of 0.65 million ounces (3.4 million tonnes grading 5.91 g/t gold)
• Moderate 2016 capital spending preserves production optionality in Nunavut – Expenditures at Amaruq are designed to expand and upgrade the gold resources and outline a second source of open pit ore for the project. Planned spending levels at Meliadine for 2016 are expected to be sufficient to keep critical path elements moving forward. However, decreased spending as compared with previous internal forecasts is expected to delay the potential project start-up by approximately one year to 2020
• Improved financial flexibility – In 2015, net debt was reduced by $190 million,
further strengthening the Company’s investment grade balance sheet
• A quarterly dividend of $0.08 per share declared
New Three-Year Guidance Plan - Stable Production and Cost Profile The Company is announcing its production and cost guidance for 2016 through 2018. The Company expects average annual production of approximately 1.53 million ounces of gold over the next three years with a stable cost profile. Highlights from the new production and cost guidance for 2016 through 2018 include:
• In 2016, payable production is expected to be between 1.525 million and 1.565 million ounces of gold. Total cash costs per ounce on a by-product basis in 2016 are expected to be between $590 and $630 using a US$/C$ exchange rate assumption of 1.30. Previous guidance for 2016 (from the February 2015 forecast) was 1.60 million ounces. The change from previous guidance is primarily due to the expansion of the Vault pit, which increased overall production from Meadowbank but deferred ounces from 2016 to 2017 and 2018, thereby extending the mine life
3
• Consolidated AISC for 2016 are expected to be between $850 and $890 per ounce. In 2017 and 2018, the Company’s goal is to reduce AISC below this range
• The estimated production level in 2017 is currently forecast to be approximately
1.55 million ounces of gold (up from 1.50 million ounces in its February 2015 forecast), while production in 2018 is forecast to be approximately 1.50 million ounces of gold. However, the Company is evaluating potential optimizations and opportunities (none of which have yet been approved for construction) at a number of existing operations to further enhance the production profile in 2018 and beyond. These include:
LaRonde optimization potential
− Bousquet Zone 5 − Lapa Zone 8 - Upper mine and Zulapa 7 - Deep 2 Zone
Goldex optimization potential
− Increased throughput from Deep Zone 1 − Potential for accelerated development of Deep Zone 2 − Potential development of the Akasaba West satellite deposit
Kittila optimization potential
− Upper Rimpi Zone development − Potential development of the new Sisar Zone
Mexican optimization potential
− Satellite zones at Pinos Altos and Creston Mascota − Potential to expand reserves at La India
Development Pipeline Expected to Provide Further Production Growth in 2019 and Beyond
The Amaruq and Meliadine projects in Nunavut, the El Barqueño project in Mexico, the Odyssey Zone and near pit/underground opportunities at Canadian Malartic (these opportunities are near or below the existing mining infrastructure), and a possible expansion of the LaRonde mine at depth have the potential to further add to the Company’s production profile in 2019 and beyond. Fourth Quarter and Full Year 2015 Financial and Production Highlights
In the fourth quarter of 2015, strong operational performance continued at the Company's mines. Payable production in the fourth quarter of 2015 was 422,328 ounces of gold compared to 387,535 ounces in the fourth quarter of 2014. A detailed description of the production and cost performance of each mine is set out below. Total cash costs per ounce on a by-product basis for the fourth quarter of 2015 were $547 compared to $662 per ounce for the fourth quarter 2014. The decrease in total
4
cash costs per ounce on a by-product basis in the fourth quarter of 2015 is mainly due to higher production levels at the LaRonde, Canadian Malartic, Meadowbank, Kittila, Pinos Altos and Creston Mascota mines and favourable foreign exchange rates. In the fourth quarter of 2015, the average value of the Canadian dollar, Euro and Mexican Peso were 10%, 7%, and 17% lower, respectively, than the Company’s 2015 currency price assumptions (see February 11, 2015 news release). For the full year 2015, the Company recorded net income of $24.6 million, or $0.11 per share. In 2014, Agnico Eagle recorded net income of $83.0 million, or $0.43 per share. Compared with the prior year, 2015 earnings were affected by lower realized gold and silver prices (down 8% and 14%, respectively, period over period) and increased exploration expenses (up 97%, period over period). In 2015, exploration drilling yielded a significant increase in inferred mineral resources at the Amaruq project in Nunavut, an initial inferred mineral resource at the El Barqueño project in Mexico and a maiden inferred mineral resource at the Sisar Zone at Kittila. The decrease in realized gold and silver prices and increase in exploration expenses were partially offset by higher gold production and favourable foreign exchange rates. For the full year 2015, cash provided by operating activities was $616.2 million ($660.0 million before changes in non-cash components of working capital). This represents a decrease over 2014, when cash provided by operating activities totalled $668.3 million ($624.4 million before changes in non-cash components of working capital). The decrease was primarily due to increased inventory positions. For the fourth consecutive year, Agnico Eagle has reported annual gold production in excess of annual guidance. The Company's payable production for the full year 2015 was 1,671,340 ounces of gold at total cash costs per ounce on a by-product basis of $567, compared to guidance of 1,650,000 ounces at total cash costs per ounce on a by-product basis of $590 to $610. In 2014, full year production was 1,429,288 ounces at total cash costs per ounce on a by-product basis of $637. The improvement in gold production in 2015 was a result of strong operating results from all of the mines, particularly Canadian Malartic as a result of the full year inclusion of production, LaRonde as a result of the higher grades from mining in more gold rich areas of the lower areas of the mine (below the 215 level), Goldex due to better productivity, increased throughput at Kittila from the ramp up of the mill expansion, increased stacking capacity at La India, and higher grades from Pinos Altos. The decrease in total cash costs per ounce on a by-product basis in 2015 was primarily due to higher gold production for 2015, strong cost control initiatives at all of the mines and the positive effect of foreign exchange rates. For the full year 2015, the average value of the Canadian dollar, Euro and Mexican Peso were 5%, 4%, and 18% lower, respectively than the Company’s 2015 currency price assumptions (see February 11, 2015 news release).
5

AISC for 2015 on a by-product basis was $810 per ounce, which is below the previous 2015 guidance between $840 and $860 per ounce. The lower AISC is primarily due to lower than forecast total cash costs per ounce on a by-product basis in 2015 and a reduction in sustaining capital expenditures through a strong emphasis on sustaining capital expenditure controls. Quarterly Dividend Declared Agnico Eagle's Board of Directors has declared a quarterly cash dividend of $0.08 per common share, payable on March 15, 2016 to shareholders of record as of March 1, 2016. Agnico Eagle has now declared a cash dividend every year since 1983. Expected Dividend Record and Payment Dates for 2016 Record Date Payment Date March 1* March 16* June 1 June 15 September 1 September 15 December 1 December 15 *Declared Dividend Reinvestment Plan Please follow the link below for information on the Company's dividend reinvestment plan. Dividend Reinvestment Plan Conference Call Tomorrow The Company's senior management will host a conference call on Thursday, February 11, 2016 at 11:00 AM (E.S.T.) to discuss financial and operating results. Via Webcast: A live audio webcast of the conference call will be available on the Company's website www.agnicoeagle.com. Via Telephone: For those preferring to listen by telephone, please dial 416-260-0113 or toll-free 1-800-524-8950. To ensure your participation, please call approximately five minutes prior to the scheduled start of the call. Replay Archive:
6

Please dial 1-647-436-0148 or toll-free 1-888-203-1112, access code 8252919. The conference call replay will expire on March 15, 2016 at 2:00 PM (E.S.T.). The webcast along with presentation slides will be archived for 180 days on www.agnicoeagle.com. Liquidity - Existing Cash and Credit Facility Provide Flexibility Cash and cash equivalents and short term investments decreased to $131.6 million at December 31, 2015, from the September 30, 2015 balance of $208.1 million partly as a result of using cash to repay outstanding balances on the Company’s credit facility. The outstanding balance on the Company’s $1.2 billion credit facility was reduced from $350 million at September 30, 2015 to $265 million at December 31, 2015, resulting in availability under its credit lines of approximately $935 million, not including the $300 million accordion facility. Total capital expenditures made by the Company in the fourth quarter of 2015 were $133.0 million, including $22.2 million at Meliadine, $20.0 million at Pinos Altos, $18.0 million at Meadowbank, $18.0 million at Kittila, $16.7 million at LaRonde, $13.6 million at Canadian Malartic (50% basis), $13.6 million at Goldex, $7.9 million at La India, $2.6 million at Creston Mascota and $1.0 million at Lapa. Total capital expenditures for the full year 2015 were $449.8 million including $67.3 million at LaRonde, $66.7 million at Meliadine, $65.2 million at Meadowbank, $61.8 million at Pinos Altos, $56.4 million at Kittila, $48.8 million at Goldex, $43.4 million at Canadian Malartic (50% basis), $23.4 million at La India, $6.5 million at Lapa and $4.2 million at Creston Mascota. Total sustaining capital expenditures made by the Company in the fourth quarter of 2015 were $90.4 million, including $18.0 million at Meadowbank, $16.7 million at LaRonde, $15.1 million at Kittila, $13.6 million at Canadian Malartic (50% basis), $11.4 million at Pinos Altos, $7.9 million at La India, $4.1 million at Goldex, $2.6 million at Creston Mascota and $1.0 million at Lapa. Total sustaining capital expenditures for the full year 2015 were $305.1 million including $67.3 million at LaRonde, $65.2 million at Meadowbank, $45.7 million at Kittila, $41.6 million at Canadian Malartic (50% basis), $35.5 million at Pinos Altos, $23.4 million at La India, $15.7 million at Goldex, $6.5 million at Lapa, and $4.2 million at Creston Mascota.
7
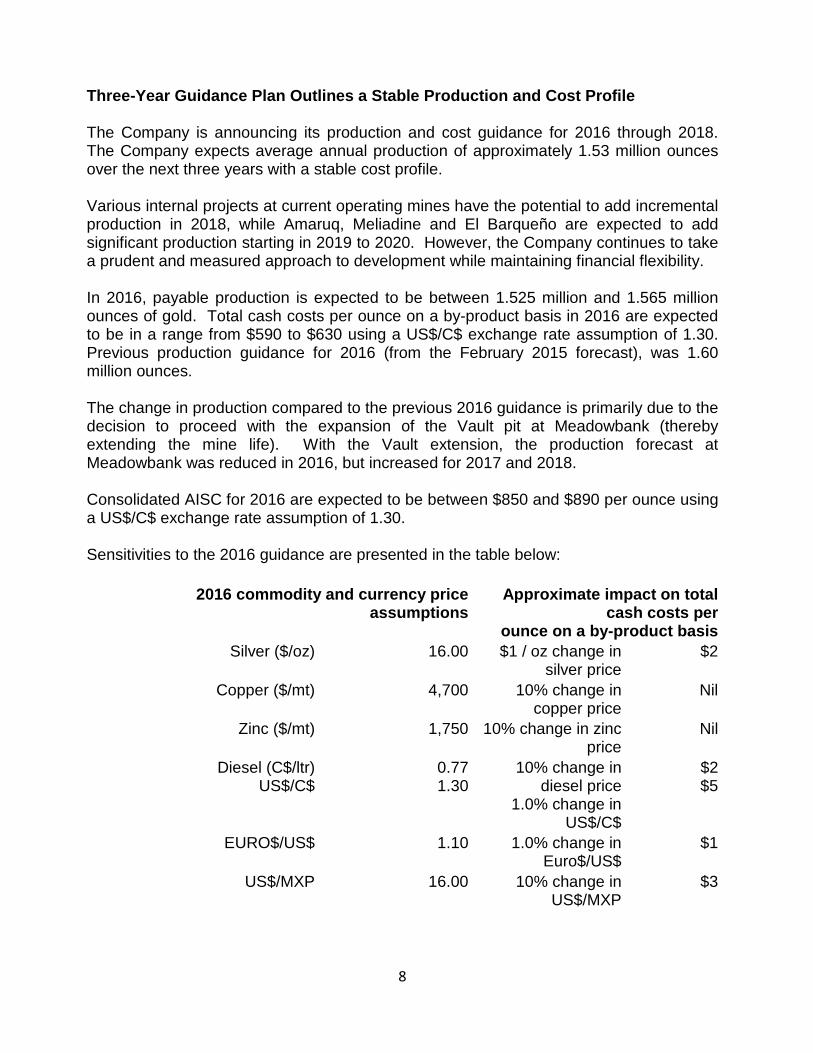
Three-Year Guidance Plan Outlines a Stable Production and Cost Profile The Company is announcing its production and cost guidance for 2016 through 2018. The Company expects average annual production of approximately 1.53 million ounces over the next three years with a stable cost profile. Various internal projects at current operating mines have the potential to add incremental production in 2018, while Amaruq, Meliadine and El Barqueño are expected to add significant production starting in 2019 to 2020. However, the Company continues to take a prudent and measured approach to development while maintaining financial flexibility. In 2016, payable production is expected to be between 1.525 million and 1.565 million ounces of gold. Total cash costs per ounce on a by-product basis in 2016 are expected to be in a range from $590 to $630 using a US$/C$ exchange rate assumption of 1.30. Previous production guidance for 2016 (from the February 2015 forecast), was 1.60 million ounces. The change in production compared to the previous 2016 guidance is primarily due to the decision to proceed with the expansion of the Vault pit at Meadowbank (thereby extending the mine life). With the Vault extension, the production forecast at Meadowbank was reduced in 2016, but increased for 2017 and 2018. Consolidated AISC for 2016 are expected to be between $850 and $890 per ounce using a US$/C$ exchange rate assumption of 1.30. Sensitivities to the 2016 guidance are presented in the table below:
2016 commodity and currency price
assumptions Approximate impact on total
cash costs per ounce on a by-product basis
Silver ($/oz) 16.00 $1 / oz change in silver price
$2
Copper ($/mt) 4,700 10% change in copper price
Nil
Zinc ($/mt) 1,750 10% change in zinc price
Nil
Diesel (C$/ltr) US$/C$
0.77 1.30
10% change in diesel price
1.0% change in US$/C$
$2 $5
EURO$/US$ 1.10 1.0% change in Euro$/US$
$1
US$/MXP 16.00 10% change in US$/MXP
$3
8

Estimated Payable Gold Production
Northern
Business 2015 Actual 2016
Forecast*
2017 Forecast
2018 Forecast
LaRonde 267,921 275,000 320,000 375,000 Canadian
Malartic (50%) Lapa
285,809 90,967
280,000 60,000
295,000 0
305,000 0
Goldex 115,426 105,000 105,000 130,000 Kittila 177,374 200,000 190,000 200,000 Meadowbank 381,804 305,000 320,000 155,000 1,319,301 1,225,000 1,235,000 1,165,000 Southern
Business
Pinos Altos 192,974 175,000 175,000 180,000 Creston Mascota 54,703 45,000 40,000 40,000 La India 104,362 100,000 105,000 115,000 352,039 320,000 320,000 335,000 Total Gold
Production 1,671,340 1,545,000 1,550,000 1,500,000
9

Total Cash Costs Per Ounce
2015 Actual 2016 Forecast*
Northern Business LaRonde $590 $592 Canadian Malartic Lapa
596 590
593 640
Goldex 538 601 Kittila 709 646 Meadowbank 613 750 609 644 Southern Business Pinos Altos 387 443 Creston Mascota 430 604 La India 436 470 408 474 Total $567 $608 *midpoint of expected ranges In 2017, payable production is expected to be approximately 1.55 million ounces of gold. Previous guidance for 2017 (from the February 2015 forecast), was 1.50 million ounces. The increase in production compared to the previous 2017 guidance is primarily due to the Vault extension at Meadowbank, and increased production expected at Goldex and La India. The increased production levels at Goldex and La India are largely due to the forecast of improved operating efficiencies at the mines. In 2018, payable production is expected to be approximately 1.50 million ounces of gold. However, the Company is evaluating potential optimizations (none of which have yet been approved for construction) at a number of existing operations to further enhance the Company’s production profile. These potential optimizations are discussed in more detail below. Total cash costs per ounce on a by-product basis for 2017 and 2018 are expected to be similar to the 2016 forecast. In 2017 and 2018, the Company’s goal is to reduce AISC below the level forecast for 2016. Stable Three-Year Gold Production Forecast Since the prior three-year production guidance of February 11, 2015 ("Previous Guidance"), there have been several operating developments resulting in changes to the overall three-year production profile. Descriptions of these changes are detailed below. Northern Business
10
LaRonde 2016 Forecast
Ore Milled ('000 tonnes)
Gold (g/t), Mill Recovery
Silver (g/t), Mill Recovery
Zinc (%), Mill Recovery
Copper (%), Mill Recovery
Minesite Costs Per Tonne4
2,106 4.28, 94.9%
20.0, 76.0%
0.35, 56.1% 0.3, 80.8% C$114
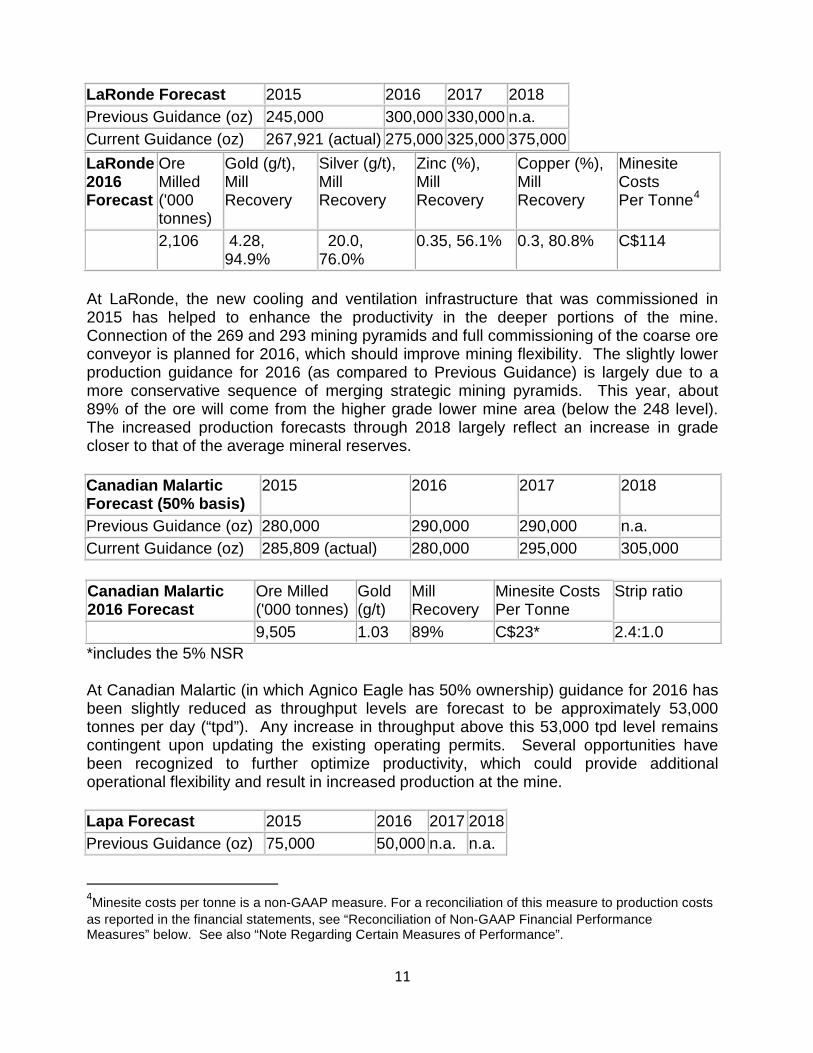
At LaRonde, the new cooling and ventilation infrastructure that was commissioned in 2015 has helped to enhance the productivity in the deeper portions of the mine. Connection of the 269 and 293 mining pyramids and full commissioning of the coarse ore conveyor is planned for 2016, which should improve mining flexibility. The slightly lower production guidance for 2016 (as compared to Previous Guidance) is largely due to a more conservative sequence of merging strategic mining pyramids. This year, about 89% of the ore will come from the higher grade lower mine area (below the 248 level). The increased production forecasts through 2018 largely reflect an increase in grade closer to that of the average mineral reserves. Canadian Malartic Forecast (50% basis)
2015 2016 2017 2018
Previous Guidance (oz) 280,000 290,000 290,000 n.a. Current Guidance (oz) 285,809 (actual) 280,000 295,000 305,000 Canadian Malartic 2016 Forecast
Ore Milled ('000 tonnes)
Gold (g/t)
Mill Recovery
Minesite Costs Per Tonne
Strip ratio
9,505 1.03 89% C$23* 2.4:1.0 *includes the 5% NSR At Canadian Malartic (in which Agnico Eagle has 50% ownership) guidance for 2016 has been slightly reduced as throughput levels are forecast to be approximately 53,000 tonnes per day (“tpd”). Any increase in throughput above this 53,000 tpd level remains contingent upon updating the existing operating permits. Several opportunities have been recognized to further optimize productivity, which could provide additional operational flexibility and result in increased production at the mine.
4Minesite costs per tonne is a non-GAAP measure. For a reconciliation of this measure to production costs as reported in the financial statements, see “Reconciliation of Non-GAAP Financial Performance Measures” below. See also “Note Regarding Certain Measures of Performance”.
LaRonde Forecast 2015 2016 2017 2018 Previous Guidance (oz) 245,000 300,000 330,000 n.a. Current Guidance (oz) 267,921 (actual) 275,000 325,000 375,000
Lapa Forecast 2015 2016 2017 2018 Previous Guidance (oz) 75,000 50,000 n.a. n.a.
11
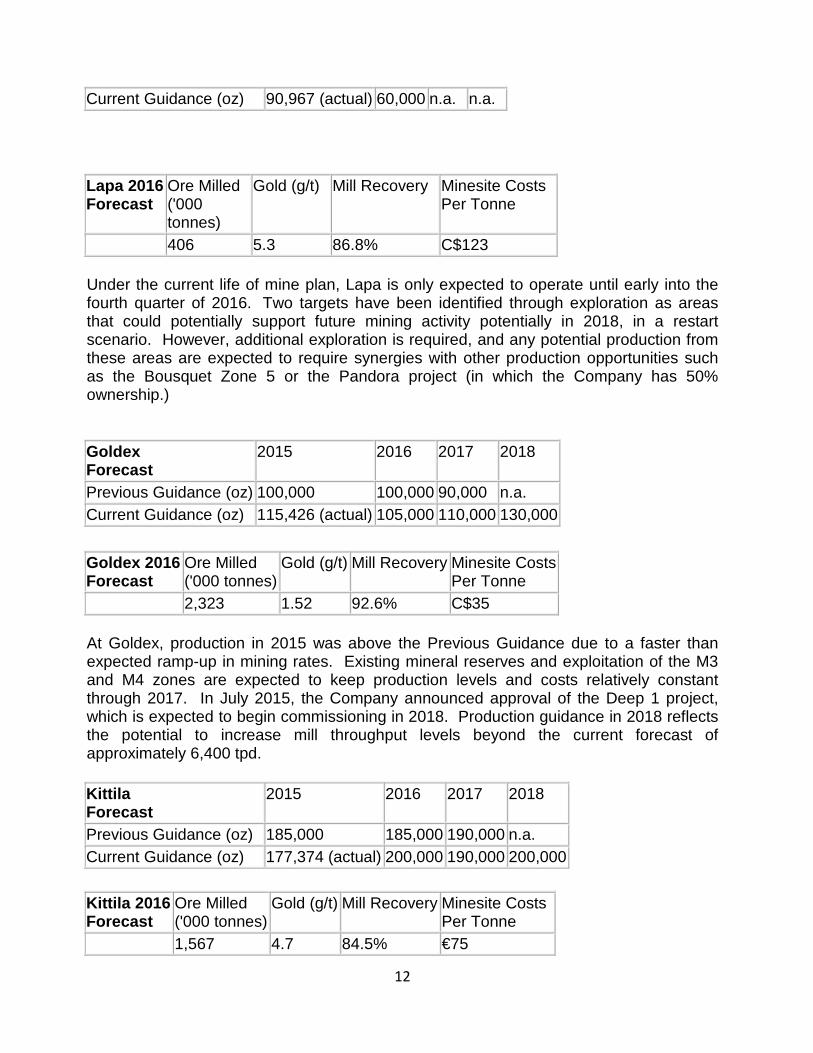
Lapa 2016 Forecast
Ore Milled ('000 tonnes)
Gold (g/t) Mill Recovery Minesite Costs Per Tonne
406 5.3 86.8% C$123 Under the current life of mine plan, Lapa is only expected to operate until early into the fourth quarter of 2016. Two targets have been identified through exploration as areas that could potentially support future mining activity potentially in 2018, in a restart scenario. However, additional exploration is required, and any potential production from these areas are expected to require synergies with other production opportunities such as the Bousquet Zone 5 or the Pandora project (in which the Company has 50% ownership.)
Goldex 2016 Forecast
Ore Milled ('000 tonnes)
Gold (g/t) Mill Recovery Minesite Costs Per Tonne
2,323 1.52 92.6% C$35 At Goldex, production in 2015 was above the Previous Guidance due to a faster than expected ramp-up in mining rates. Existing mineral reserves and exploitation of the M3 and M4 zones are expected to keep production levels and costs relatively constant through 2017. In July 2015, the Company announced approval of the Deep 1 project, which is expected to begin commissioning in 2018. Production guidance in 2018 reflects the potential to increase mill throughput levels beyond the current forecast of approximately 6,400 tpd.
Kittila 2016 Forecast
Ore Milled ('000 tonnes)
Gold (g/t) Mill Recovery Minesite Costs Per Tonne
1,567 4.7 84.5% €75
Current Guidance (oz) 90,967 (actual) 60,000 n.a. n.a.
Goldex Forecast
2015 2016 2017 2018
Previous Guidance (oz) 100,000 100,000 90,000 n.a. Current Guidance (oz) 115,426 (actual) 105,000 110,000 130,000
Kittila Forecast
2015 2016 2017 2018
Previous Guidance (oz) 185,000 185,000 190,000 n.a. Current Guidance (oz) 177,374 (actual) 200,000 190,000 200,000
12
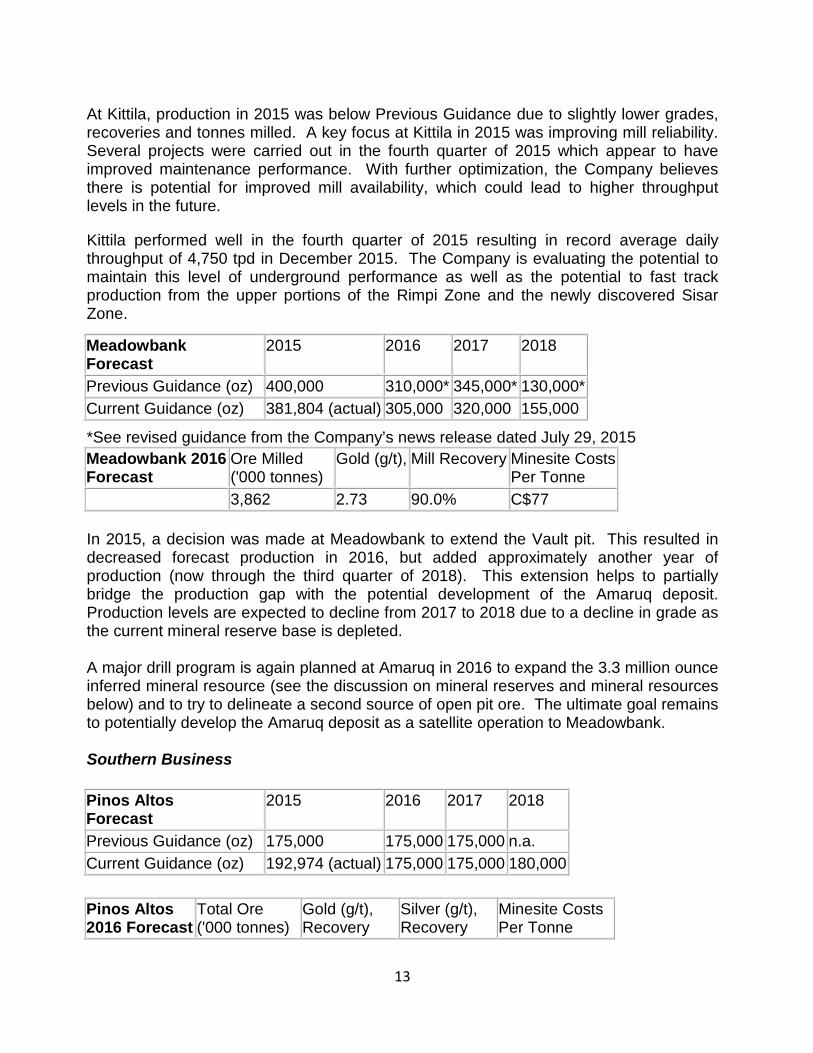
At Kittila, production in 2015 was below Previous Guidance due to slightly lower grades, recoveries and tonnes milled. A key focus at Kittila in 2015 was improving mill reliability. Several projects were carried out in the fourth quarter of 2015 which appear to have improved maintenance performance. With further optimization, the Company believes there is potential for improved mill availability, which could lead to higher throughput levels in the future.
Kittila performed well in the fourth quarter of 2015 resulting in record average daily throughput of 4,750 tpd in December 2015. The Company is evaluating the potential to maintain this level of underground performance as well as the potential to fast track production from the upper portions of the Rimpi Zone and the newly discovered Sisar Zone.
*See revised guidance from the Company’s news release dated July 29, 2015 Meadowbank 2016 Forecast
Ore Milled ('000 tonnes)
Gold (g/t), Mill Recovery Minesite Costs Per Tonne
3,862 2.73 90.0% C$77 In 2015, a decision was made at Meadowbank to extend the Vault pit. This resulted in decreased forecast production in 2016, but added approximately another year of production (now through the third quarter of 2018). This extension helps to partially bridge the production gap with the potential development of the Amaruq deposit. Production levels are expected to decline from 2017 to 2018 due to a decline in grade as the current mineral reserve base is depleted. A major drill program is again planned at Amaruq in 2016 to expand the 3.3 million ounce inferred mineral resource (see the discussion on mineral reserves and mineral resources below) and to try to delineate a second source of open pit ore. The ultimate goal remains to potentially develop the Amaruq deposit as a satellite operation to Meadowbank. Southern Business
Pinos Altos 2016 Forecast
Total Ore ('000 tonnes)
Gold (g/t), Recovery
Silver (g/t), Recovery
Minesite Costs Per Tonne
Meadowbank Forecast
2015 2016 2017 2018
Previous Guidance (oz) 400,000 310,000* 345,000* 130,000* Current Guidance (oz) 381,804 (actual) 305,000 320,000 155,000
Pinos Altos Forecast
2015 2016 2017 2018
Previous Guidance (oz) 175,000 175,000 175,000 n.a. Current Guidance (oz) 192,974 (actual) 175,000 175,000 180,000
13

2,054 2.77, 95.5% 74.1, 43.2% $54 At Pinos Altos, production in 2015 significantly beat Previous Guidance, primarily due to higher grades and slightly better mill throughput and recovery. Going forward, throughput, grades and recoveries are expected to remain relatively stable. Commissioning of the Pinos Altos shaft in 2016 will allow better matching of the future mining capacity with the mill once the open pit mining operation begins to wind down, as planned over, the next several years.
Creston Mascota 2016 Forecast
Total Ore ('000 tonnes)
Gold (g/t), Recovery
Silver (g/t), Recovery
Minesite Costs Per Tonne
2,000 1.17, 60.0% 12.5, 13.4% $15 At Creston Mascota, production in 2015 was slightly better than Previous Guidance due to additional ore being encountered outside the block model, which resulted in more tonnes stacked on the leach pad. Infill drilling has encountered higher grade mineralization below the Creston Mascota pit. Work is underway to evaluate the impact of this mineralization on the pit design and production planning. In 2016, further work is planned on the Bravo deposit to evaluate it as a potential source of additional production. La India Forecast 2015 2016 2017 2018 Previous Guidance (oz) 90,000 90,000 95,000 n.a. Current Guidance (oz) 104,362 (actual) 100,000 105,000 115,000 La India 2016 Forecast
Total Ore ('000 tonnes)
Gold (g/t), Recovery
Silver (g/t), Recovery
Minesite Costs Per Tonne
5,341 0.92, 63.4% 6.85, 11.0% $9 At La India, production in 2015 was above Previous Guidance primarily due to favourable block model variances. The 2015 exploration program resulted in a 28% increase in mineral reserves year-over-year, and a 21% increase in measured and indicated mineral resources. The Company is evaluating near pit potential with a goal of further expanding the mineral reserves at the Main and North Zones and will consider opportunities to increase production at La India based on the success of that program. Near-term Mine Optimization Projects Could Potentially Enhance 2018 Production Over the next three years (2016 through 2018) annual production is forecast to average approximately 1.53 million ounces. The estimated production level in 2018 is currently
Creston Mascota Forecast
2015 2016 2017 2018
Previous Guidance (oz) 50,000 45,000 40,000 n.a. Current Guidance (oz) 54,703 (actual) 45,000 40,000 40,000
14

forecast to be approximately 1.50 million ounces. However, the Company is evaluating potential optimizations and opportunities (none of which have yet been approved for construction) at a number of existing operations to further enhance the Company’s production profile in 2018 and beyond. LaRonde Optimization In 2003, the Company acquired the Bousquet gold property from Barrick Gold. The property adjoins the LaRonde mining complex to the east and hosts the Bousquet Zone 5, which previous operators had partly exploited by open pit. The Company is evaluating the potential to initially mine the Bousquet Zone 5 from a depth of 90 to 330 metres below surface via an underground ramp. This portion of the deposit contains indicated mineral resources of approximately 566,000 ounces of gold (9.3 million tonnes grading 1.90 g/t gold) and inferred gold mineral resources of approximately 109,000 ounces of gold (1.47 million tonnes grading 2.31 g/t gold). The mining method is likely to be similar to that employed at Goldex, and processing could utilize excess capacity from the Lapa circuit at LaRonde. Dewatering of the old pit is underway and permit applications to collect a bulk sample will be submitted shortly. An internal technical study is expected to be completed by the end of 2016. At the Lapa mine two areas (Zone 8 East - Upper mine and the Zulapa 7- Deep 2 Zone) have been identified through exploration (see Lapa mine discussion) as areas that could potentially support future mining activity. Further exploration and internal studies are underway to look at synergies with other production opportunities such as the Bousquet Zone 5. In addition, Canadian Malartic Corporation (“CMC”, owned 50% by Agnico Eagle and 50% by Yamana Gold Inc. “Yamana”) is continuing to explore the Pandora project, which adjoins the Lapa mine to the west (for additional details see the Canadian Malartic section of this news release). Should the exploration efforts be successful, Pandora could potentially have synergies with the other opportunities currently being evaluated at the Lapa mine. Goldex Optimization
At present, the Goldex mill has about 25% excess capacity (rated capacity is 8,000 tpd, but forecast to process approximately 6,400 tpd in 2016). As such, the Company is evaluating opportunities to potentially increase throughput from the Deep 1 Zone, and the potential to mine a portion of the Deep 2 Zone. These opportunities, and the potential development of the Akasaba West deposit (see below), could enhance production levels or extend the current mine life and reduce operating costs. In January 2014, Agnico Eagle acquired the Akasaba West gold-copper deposit from Alexandria Minerals. Located less than 30 km from Goldex, the Akasaba West deposit could create flexibility and synergies for the Company's operations in the Abitibi region by utilizing extra milling capacity at both Goldex and LaRonde, while reducing overall costs. Akasaba West currently hosts a probable mineral reserve of 141,000 ounces of gold and
15
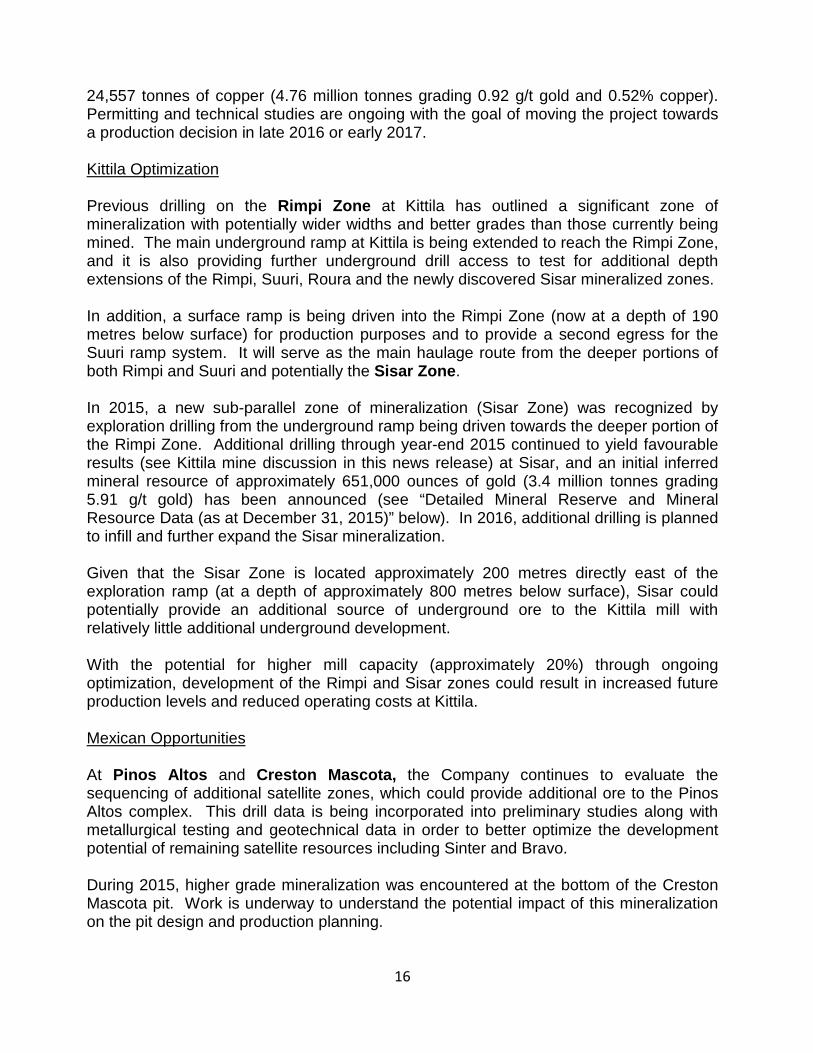
24,557 tonnes of copper (4.76 million tonnes grading 0.92 g/t gold and 0.52% copper). Permitting and technical studies are ongoing with the goal of moving the project towards a production decision in late 2016 or early 2017. Kittila Optimization Previous drilling on the Rimpi Zone at Kittila has outlined a significant zone of mineralization with potentially wider widths and better grades than those currently being mined. The main underground ramp at Kittila is being extended to reach the Rimpi Zone, and it is also providing further underground drill access to test for additional depth extensions of the Rimpi, Suuri, Roura and the newly discovered Sisar mineralized zones. In addition, a surface ramp is being driven into the Rimpi Zone (now at a depth of 190 metres below surface) for production purposes and to provide a second egress for the Suuri ramp system. It will serve as the main haulage route from the deeper portions of both Rimpi and Suuri and potentially the Sisar Zone.
In 2015, a new sub-parallel zone of mineralization (Sisar Zone) was recognized by exploration drilling from the underground ramp being driven towards the deeper portion of the Rimpi Zone. Additional drilling through year-end 2015 continued to yield favourable results (see Kittila mine discussion in this news release) at Sisar, and an initial inferred mineral resource of approximately 651,000 ounces of gold (3.4 million tonnes grading 5.91 g/t gold) has been announced (see “Detailed Mineral Reserve and Mineral Resource Data (as at December 31, 2015)” below). In 2016, additional drilling is planned to infill and further expand the Sisar mineralization. Given that the Sisar Zone is located approximately 200 metres directly east of the exploration ramp (at a depth of approximately 800 metres below surface), Sisar could potentially provide an additional source of underground ore to the Kittila mill with relatively little additional underground development. With the potential for higher mill capacity (approximately 20%) through ongoing optimization, development of the Rimpi and Sisar zones could result in increased future production levels and reduced operating costs at Kittila. Mexican Opportunities At Pinos Altos and Creston Mascota, the Company continues to evaluate the sequencing of additional satellite zones, which could provide additional ore to the Pinos Altos complex. This drill data is being incorporated into preliminary studies along with metallurgical testing and geotechnical data in order to better optimize the development potential of remaining satellite resources including Sinter and Bravo. During 2015, higher grade mineralization was encountered at the bottom of the Creston Mascota pit. Work is underway to understand the potential impact of this mineralization on the pit design and production planning.
16

At La India, additional drilling was carried out in 2015 with a focus on extending mineralization in the Main Zone and the La India Zone, and conversion of sulfide mineralization into mineral reserves and mineral resources. In addition, drilling was also carried out on a portion of the El Realito property. The 2015 exploration program and new ore model resulted in a 28% increase in mineral reserves, and a 21% increase in measured and indicated mineral resources (see “Detailed Mineral Reserve and Mineral Resource Data (as at December 31, 2015)” below). The Company is looking at near pit potential for further mineral reserve expansion and will consider opportunities to increase production at La India based on the success of that program. Development/Expansion Projects in the Abitibi, Nunavut and Mexico Expected to Provide Longer-term Growth Opportunities beyond 2019 The expansion and development projects set out below, which have not yet been approved for construction, have the potential to add to the Company’s production profile in 2019 and beyond. Amaruq – Expanding the Mineral Resource Base and Locating a Second Open Pit Deposit is the Key Focus in 2016 The 100% owned Amaruq property consists of 114,760 hectares of Inuit and federal crown land. Agnico Eagle acquired its initial interest in April 2013 pursuant to a mineral exploration agreement with Nunavut Tunngavik Incorporated. In 2015, a $37.7 million exploration program (378 drill holes totalling approximately 108,000 metres) was carried out at the Amaruq project, which is located approximately 50 kilometres northwest of the Meadowbank mine in Nunavut. A large portion of last year’s drill program was focused on the Whale Tail Zone, where drilling has outlined up to five mineralized lenses along a strike length of 2.3 kilometres and to a depth of up to 600 metres below surface. Mineralization at Whale Tail remains open in all directions. Significant mineralization has also been outlined in the IVR area. As a result of the 2015 exploration program, the inferred mineral resource at Amaruq increased by approximately 67% compared to the inferred mineral resource of 2.0 million ounces of gold (see the Company’s August 19, 2015 news release for comparison) to 3.3 million ounces of gold (16.9 million tonnes grading 6.05 g/t gold) at December 31, 2015 (for additional details see the mineral reserve and mineral resource discussion in this news release). The first phase of a planned 75,000 metre drill program (costing approximately $19 million) began with two drills in early February 2016. The goals of this program are to infill and expand the known mineral resource areas and test other favourable targets (for additional details see the exploration section below). A mineral resource update is expected in the second half of 2016.
17

In late 2015, the Company received approvals for the construction of an all-weather access road linking the Amaruq exploration site to the Meadowbank mine. In 2016 the Company expects to carry out additional engineering and begin road preparation from the Vault pit at Meadowbank. The Company expects to ultimately develop Amaruq as a satellite operation to Meadowbank, with the potential to begin production in 2019. Given that the initial mineral resource grade at Amaruq is well in excess of the mineral reserve grade at Meadowbank, the Company believes that there is good potential for Amaruq to have similar annual output to Meadowbank in its peak production years. Permitting activities and engineering studies for the construction of an initial open pit mine and an underground exploration ramp at Amaruq are ongoing. Meliadine – Moderate 2016 Capital Expenditures Preserves Production Optionality Located near Rankin Inlet, Nunavut, Canada, the Meliadine project was acquired in July 2010, and is one of Agnico Eagle's largest gold projects in terms of mineral resources. The Company owns 100% of the 111,757 hectare property. The updated technical study for Meliadine released last year (see March 12, 2015 news release) forecast average annual production of approximately 350,000 ounces at a life-of-mine total cash costs per ounce on a by-product basis of approximately $531 over a nine-year mine life. The study used a gold price of C$1,495 per ounce (as compared to a current spot price of approximately C$1,657 per ounce on February 8, 2016). The technical study was based on extracting only the 3.3 million ounces of gold in proven and probable mineral reserves at December 31, 2014 (13.9 million tonnes of ore grading 7.44 g/t gold), which is all contained in the Tiriganiaq and Wesmeg deposits. At December 31, 2015, the Meliadine property hosted 3.4 million ounces of proven and probable mineral reserves (14.5 million tonnes of ore grading 7.32 g/t gold), 3.31 million ounces of measured and indicated mineral resources (20.8 million tonnes of ore grading 4.95 g/t gold), and 3.55 million ounces of inferred mineral resources (14.7 million tonnes of ore grading 7.51 g/t gold). In addition, there are numerous other known gold occurrences in the 80-kilometre-long greenstone belt that require further evaluation. The capital budget for 2016 is $96 million with activities focused on further underground development (approximately 3,000 metres), detailed engineering and procurement, construction of essential surface infrastructure and acquisition of a used camp facility. The goal of the 2016 capital program is to ensure that the project remains on track for a potential 2020 production start-up, which is approximately a one year delay from previous expectations.
Internal studies are ongoing to evaluate the potential to extract additional ounces of gold from the Tiriganiaq and Wesmeg/Normeg deposits that could potentially extend the mine life, increase annual production and improve the project economics and the after-tax
18

internal rate of return. These studies are expected to be completed in the third quarter of 2016.
On October 5, 2015, the Nunavut Water Board issued the permit (License B) for Meliadine pre-development work. License A, which is required for production activities, is expected to be granted in the second quarter of 2016. The timing of future capital expenditures on the Meliadine project beyond 2016 and the determination of whether to build a mine at Meliadine are subject to approval by Agnico Eagle's Board of Directors which will be based on prevailing market conditions and outcomes of the various potential scenarios being evaluated. El Barqueño – Initial Mineral Resource Announced, Significant Drilling Planned in 2016 The El Barqueño property in Jalisco State, Mexico covers a land position with known strike extent for mineralization larger than both the La India and Pinos Altos properties combined. Previous property owners outlined several mineralized zones through surface exploration and diamond drilling. In 2015, the Company completed approximately 69,500 metres of drilling at a cost of $17 million on the El Barqueño property The primary focus of the 2015 program was to define the limits of the Azteca-Zapoteca, Angostura and Peña de Oro prospects, and delineate an initial mineral resource estimate for these deposits. Several other prospects were also under evaluation.
Based on the 2015 exploration results and previous work programs, the Company has estimated initial total inferred in-pit mineral resources of approximately 0.61 million ounces (19.7 million tonnes grading 0.96 g/t gold) from the Azteca-Zapoteca, Angostura and Peña de Oro areas to open-pit mineable depths. An additional 11,000 metres of drilling has been completed since the estimation of the inferred mineral resource. Further details on the El Barqueño inferred mineral resource can be found in “Detailed Mineral Reserve and Mineral Resource Data (as at December 31, 2015)” below.
In 2016, Agnico Eagle plans to carry out a $13 million exploration program to further expand and infill the known mineral resource areas and evaluate other prospective targets such as: Olmeca, Zapote, Mixteca, El Rayo, and Pilarica. At present there are 14 drills operating on the project.
While it is too early to estimate the full extent of the mineral resources and the number of deposits with economic potential at El Barqueño, the Company has the experience of developing cost-efficient mining operations in Mexico and increasing their size through successful exploration as well as metallurgical innovation. This body of knowledge will be applied as El Barqueño continues to be explored and studied. Agnico Eagle believes that El Barqueño ultimately has the potential to be developed into a series of open pits utilizing heap leach processing, similar to the Creston Mascota and
19
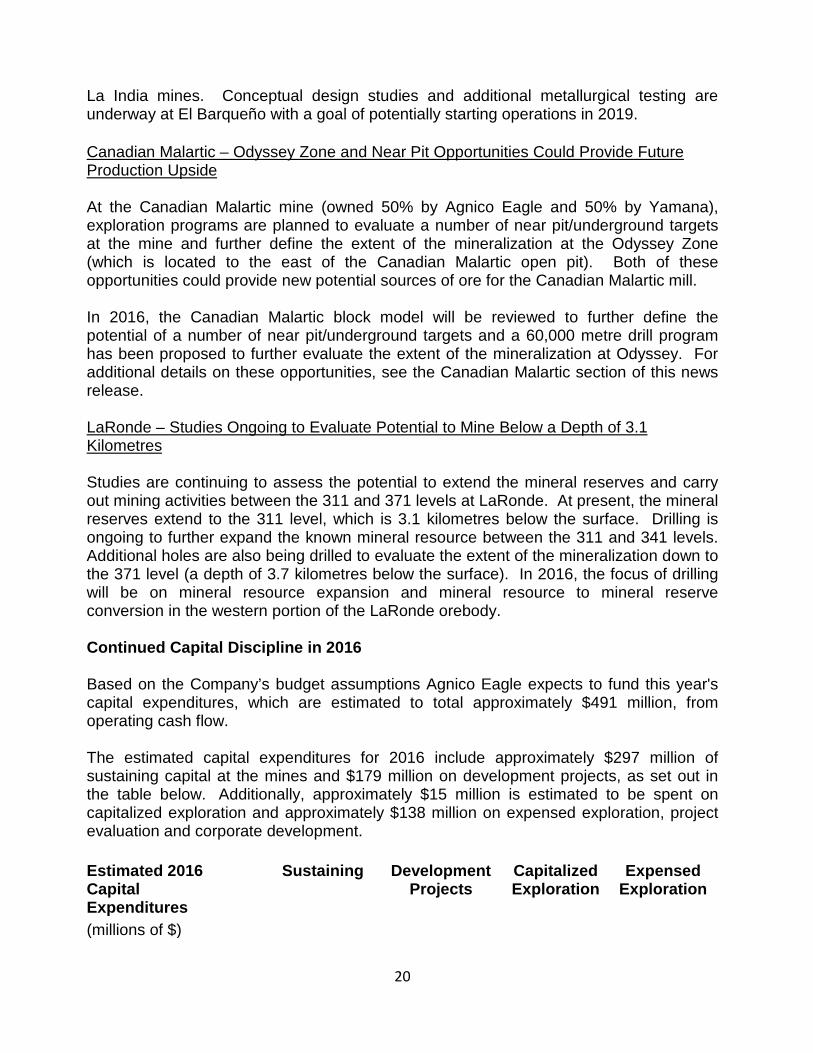
La India mines. Conceptual design studies and additional metallurgical testing are underway at El Barqueño with a goal of potentially starting operations in 2019. Canadian Malartic – Odyssey Zone and Near Pit Opportunities Could Provide Future Production Upside At the Canadian Malartic mine (owned 50% by Agnico Eagle and 50% by Yamana), exploration programs are planned to evaluate a number of near pit/underground targets at the mine and further define the extent of the mineralization at the Odyssey Zone (which is located to the east of the Canadian Malartic open pit). Both of these opportunities could provide new potential sources of ore for the Canadian Malartic mill. In 2016, the Canadian Malartic block model will be reviewed to further define the potential of a number of near pit/underground targets and a 60,000 metre drill program has been proposed to further evaluate the extent of the mineralization at Odyssey. For additional details on these opportunities, see the Canadian Malartic section of this news release. LaRonde – Studies Ongoing to Evaluate Potential to Mine Below a Depth of 3.1 Kilometres Studies are continuing to assess the potential to extend the mineral reserves and carry out mining activities between the 311 and 371 levels at LaRonde. At present, the mineral reserves extend to the 311 level, which is 3.1 kilometres below the surface. Drilling is ongoing to further expand the known mineral resource between the 311 and 341 levels. Additional holes are also being drilled to evaluate the extent of the mineralization down to the 371 level (a depth of 3.7 kilometres below the surface). In 2016, the focus of drilling will be on mineral resource expansion and mineral resource to mineral reserve conversion in the western portion of the LaRonde orebody. Continued Capital Discipline in 2016 Based on the Company’s budget assumptions Agnico Eagle expects to fund this year's capital expenditures, which are estimated to total approximately $491 million, from operating cash flow. The estimated capital expenditures for 2016 include approximately $297 million of sustaining capital at the mines and $179 million on development projects, as set out in the table below. Additionally, approximately $15 million is estimated to be spent on capitalized exploration and approximately $138 million on expensed exploration, project evaluation and corporate development. Estimated 2016 Capital Expenditures
Sustaining Development Projects
Capitalized Exploration
Expensed Exploration
(millions of $)
20

Northern Business LaRonde 62 - 2 2 Lapa - - - 1 Goldex 10 64 3 - Kittila 56 10 3 9 Meadowbank 41 - - - Amaruq - - - 43 Meliadine - 96 - - Canadian Malartic 59 2 - 8 228 172 8 63 Southern Business
Pinos Altos 54 7 2 - La India 8 - 2 2 Creston Mascota 7 - 1 - 69 7 5 2 Project Eval/Corp Dev 36 Other Exploration 2 37 Total Expenditures 297 179 15 138
21
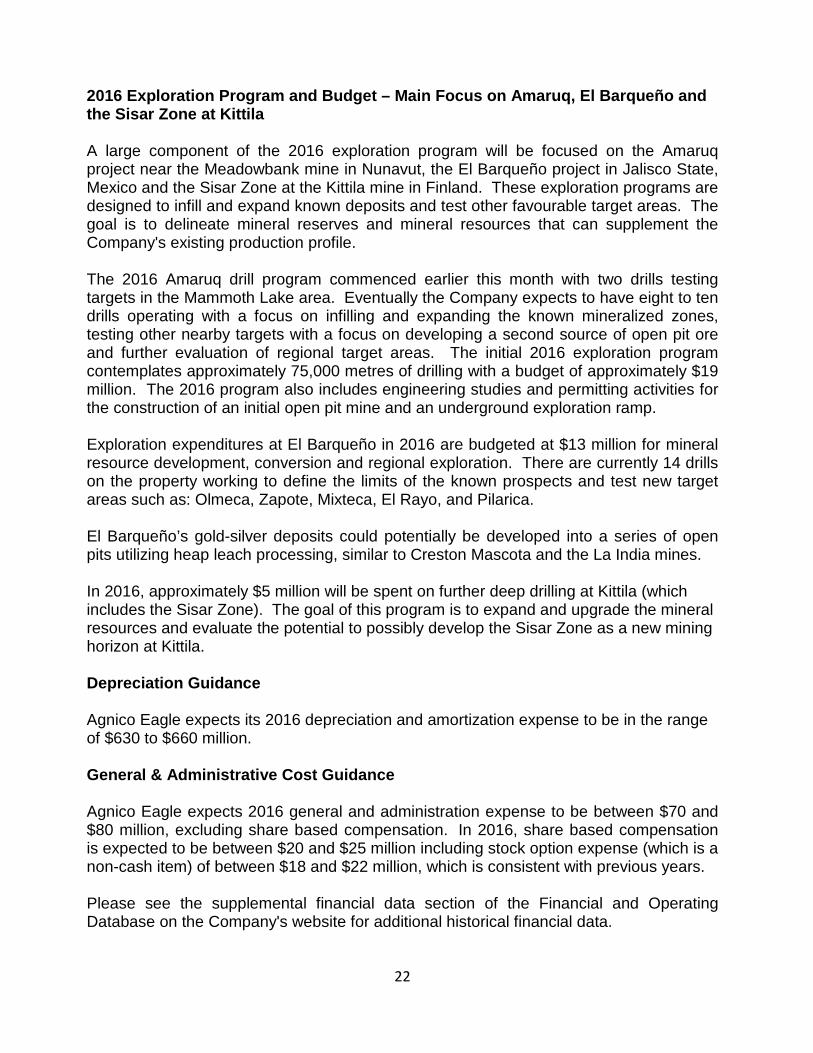
2016 Exploration Program and Budget – Main Focus on Amaruq, El Barqueño and the Sisar Zone at Kittila A large component of the 2016 exploration program will be focused on the Amaruq project near the Meadowbank mine in Nunavut, the El Barqueño project in Jalisco State, Mexico and the Sisar Zone at the Kittila mine in Finland. These exploration programs are designed to infill and expand known deposits and test other favourable target areas. The goal is to delineate mineral reserves and mineral resources that can supplement the Company's existing production profile. The 2016 Amaruq drill program commenced earlier this month with two drills testing targets in the Mammoth Lake area. Eventually the Company expects to have eight to ten drills operating with a focus on infilling and expanding the known mineralized zones, testing other nearby targets with a focus on developing a second source of open pit ore and further evaluation of regional target areas. The initial 2016 exploration program contemplates approximately 75,000 metres of drilling with a budget of approximately $19 million. The 2016 program also includes engineering studies and permitting activities for the construction of an initial open pit mine and an underground exploration ramp. Exploration expenditures at El Barqueño in 2016 are budgeted at $13 million for mineral resource development, conversion and regional exploration. There are currently 14 drills on the property working to define the limits of the known prospects and test new target areas such as: Olmeca, Zapote, Mixteca, El Rayo, and Pilarica. El Barqueño’s gold-silver deposits could potentially be developed into a series of open pits utilizing heap leach processing, similar to Creston Mascota and the La India mines. In 2016, approximately $5 million will be spent on further deep drilling at Kittila (which includes the Sisar Zone). The goal of this program is to expand and upgrade the mineral resources and evaluate the potential to possibly develop the Sisar Zone as a new mining horizon at Kittila. Depreciation Guidance Agnico Eagle expects its 2016 depreciation and amortization expense to be in the range of $630 to $660 million. General & Administrative Cost Guidance Agnico Eagle expects 2016 general and administration expense to be between $70 and $80 million, excluding share based compensation. In 2016, share based compensation is expected to be between $20 and $25 million including stock option expense (which is a non-cash item) of between $18 and $22 million, which is consistent with previous years. Please see the supplemental financial data section of the Financial and Operating Database on the Company's website for additional historical financial data.
22

Tax Guidance for 2016 For 2016, the jurisdictional tax rates are expected to be: Canada - 40% to 50% Mexico - 35% to 40% Finland - 20% The Company's overall tax rate is expected to be between 40% and 45%. Gold Reserves Decrease Slightly to Approximately 19.1M Ounces, Reserve Grade Increased at Key Operations To estimate the 2015 year-end mineral reserves, the Company continued to use conservative assumptions: $1,100/ounce gold and $16/ounce silver, US$/C$, €/US$ and US$/MPX exchange rates of 1.16, 1.20 and 14.00, respectively for all mines and projects, other than Lapa, Meadowbank, Creston Mascota and the Santo Niño pit at Pinos Altos. Due to the shorter mine life of these mining operations, the Company used exchange rate assumptions for US$/C$ and US$/MXP of 1.30 and 16.00, respectively (other assumptions unchanged). At year-end 2015, the Company’s proven and probable mineral reserves (net of 2015 production) totaled 251 million tonnes of ore grading 2.37 g/t gold, containing approximately 19.1 million ounces of gold. This is a decrease of approximately 0.9 million ounces of gold (5%) compared with a year earlier. The decrease in the Company’s mineral reserves is largely due to the 1,671,340 ounces of payable gold production in 2015 (1,910,000 ounces of in-situ gold mined), partially offset by successful conversion of measured and indicated mineral resources to mineral reserves at several operations. Highlights from the December 31, 2015 Mineral Reserve Statement include:
• Increased mineral reserve grades at LaRonde (5.31 g/t gold versus 5.20 g/t gold), Canadian Malartic (1.08 g/t gold versus 1.06 g/t gold), Goldex (1.61 g/t gold versus 1.49 g/t gold), and La India (0.90 g/t gold versus 0.85 g/t gold)
• At Goldex, the mineral reserves almost doubled to 668,000 ounces of gold with an 8% increase in the mineral reserve grade
• At the Akasaba project, initial mineral reserves of 141,000 ounces of gold are reported (4.8 million tonnes grading 0.92 g/t gold and 0.52% copper)
• At La India, the mineral reserves increased by 28% (188,000 ounces) to 867,000 ounces of gold (30.0 million tonnes of ore grading 0.90 g/t gold and 4.23 g/t silver)
The Company's year-end 2015 gold reserves are set out below: Gold Mineral Reserves Proven & Probable Average Gold
23

By Mine Mineral Reserve (000s gold ounces)
Mineral Reserve Grade (g/t)
2015 2014 Change 2015 2014 Change Northern Business LaRonde 3,109 3,432 -323 5.31 5.20 0.11 Canadian Malartic (50%) 3,863 4,329 -466 1.08 1.06 0.02 Lapa 78 170 -92 5.49 5.84 -0.35 Goldex 668 340 328 1.61 1.49 0.12 Akasaba 141 0 141 0.92 - Kittila 4,353 4,524 -171 4.80 4.93 -0.13 Meadowbank 943 1,168 -225 2.72 3.08 -0.36 Meliadine 3,417 3,335 82 7.32 7.44 -0.12 Subtotal/Average 16,572 17,299 -726 2.57 2.57 - Southern Business Pinos Altos 1,459 1,763 -304 2.88 3.01 -0.13 Creston Mascota 176 236 -59 1.30 1.25 0.05 La India 867 679 188 0.90 0.85 0.05 Subtotal/Average 2,502 2,678 -175 1.56 1.70 -0.14 Total Mineral Reserves 19,075 19,976 -902 2.37 2.40 -0.03 Amounts presented in the table and in this news release have been rounded to the nearest thousand. See "Detailed Mineral Reserve and Mineral Resource Data (as at December 31, 2015)" set out at the end of this news release for more details. In prior years, economic parameters used to model mineral reserves for all properties were calculated using historic three-year average metals prices and foreign exchange rates in accordance with the U.S. Securities and Exchange Commission (the “SEC”) guidelines. These guidelines require the use of prices that reflect current economic conditions at the time of mineral reserve estimation, which the SEC has interpreted to mean historic three-year average prices. Given the current lower commodity price environment, Agnico Eagle has decided to continue to use more conservative gold and silver prices of $1,100 per ounce and $16 per ounce, respectively, for the December 2015 mineral reserve estimates. These prices are well below the three-year historic gold and silver price averages (from January 1, 2013 to December 31, 2015) of approximately $1,279 per ounce and $19.54 per ounce, respectively. The assumptions used for the December 2015 mineral reserves and mineral resources estimate at all mines and advanced projects reported by the Company (other than the Canadian Malartic mine) were $1,100 per ounce gold, $16 per ounce silver, $0.90 per pound zinc, $2.50 per pound copper and exchange rates of C$1.16 per $1.00, 14.00 Mexican pesos per $1.00 and $1.20 per €1.00 for all mines and projects other than the Lapa and Meadowbank mines in Canada, and the Creston Mascota mine and Santo Niño pit at the Pinos Altos mine in Mexico; due to the shorter mine life for the Lapa and
24

Meadowbank mines in Canada, and the Creston Mascota mine and Santo Niño pit at the Pinos Altos mine in Mexico, the exchange rates used were C$1.30 per $1.00 and 16.00 Mexican pesos per $1.00. The Canadian Malartic General Partnership (the “Partnership”), owned by Agnico Eagle (50%) and Yamana (50%), which owns and operates the Canadian Malartic mine, has estimated the mine’s December 2015 mineral reserves and mineral resources using the following assumptions: $1,150 per ounce gold, a cut-off grade between 0.30 g/t and 0.33 g/t gold (depending on the deposit) and an exchange rate of C$1.24 per $1.00.
Details of the economic parameters used in generating the December 2015 mineral reserves are shown with the “Detailed Mineral Reserve and Mineral Resource Data (as at December 31, 2015)” tables below. While the gold price (in U.S. dollars) and currency exchange rates have changed, the gold price has remained relatively stable over the past 36 months, when reported in the Canadian dollar, Euro or Mexican peso. The following table shows the changes in gold price (in various currencies) and exchange rates used in the assumptions over the past three years, using the exchange rate assumptions of the long-life mines for the 2015 estimate. Comparison of assumptions used to estimate mineral reserves and the gold price in local currencies in 2013, 2014 and 2015
December 31 2015 2014 2013
Currency exchange rate US$/C$ 1.16 1.08 1.03 Euro/US$ 1.2 1.3 1.32 US$/MXP 14 13 12.75 Gold price per ounce in local currencies US$ US$1,100 US$1,150 US$1,200 C$ C$1,276 C$1,242 C$1,236 Euros € 917 € 885 € 909 Mexican pesos MPX15,400 MPX14,950 MPX15,300
The Company’s overall mineral reserve gold grade has decreased slightly to 2.37 g/t from 2.40 g/t. This is the result of a reduction in the cut-off grades at each operation because of a slight increase of the assumed gold price when converted to local currencies (shown in the table above). Agnico Eagle has one of the highest mineral reserve grades among its North American peers.
25

In the Northern Business, gold contained in mineral reserves decreased by 726,000 ounces (4%) in 2015; during the year this business segment produced 1,319,301 ounces of gold (1,451,000 ounces of in-situ gold mined). The largest mineral reserve increase in the Northern Business was at the Goldex mine, where the amount contained in mineral reserves increased by 328,000 ounces of gold (96%), year-over-year, to 668,000 ounces of gold, with an 8% increase in the mineral reserve grade to 1.61 g/t gold from 1.49 g/t gold. The increase is largely due to the successful conversion of mineral resources to mineral reserves, mainly in the D Zone as well as in the M and E zones. These are the initial D Zone probable mineral reserves (354,000 ounces of gold in 6.3 million tonnes of ore grading 1.75 g/t gold), related to the approval of mining the Deep 1 project announced in the Company’s news release dated July 29, 2015. This increase was offset by the 2015 production of 115,426 ounces of gold (123,000 ounces of in-situ gold mined). At the nearby Akasaba project, initial probable mineral reserves reported are 141,000 ounces of gold (4.8 million tonnes grading 0.92 g/t gold and 0.52% copper), the result of conversion of indicated mineral resources to mineral reserves. Canadian Malartic had the largest decline in mineral reserves; its mineral reserves decreased by 466,000 ounces of gold, mainly due to 2015 gold production of 285,809 ounces (322,000 ounces of in-situ gold mined). The remainder of the decline was due to a slight reduction in the pit shells related to the incorporation of the 5% net smelter return royalty payable to Osisko Gold Royalties Ltd. and the termination of the Gouldie open pit. All numbers shown for Canadian Malartic reflect Agnico Eagle’s 50% ownership in the mine. The decrease in the Meadowbank mine’s mineral reserves by mine depletion was partially offset by the conversion of mineral resources to mineral reserves for the Vault pit extension, announced in the Company’s news release dated July 29, 2015. At Kittila, the mining depletion was partially offset by successful conversion of mineral resources to mineral reserves. In the Southern Business, the gold contained in mineral reserves decreased by approximately 175,000 ounces (7%) in 2015. This business segment had production of 352,039 ounces of gold (459,000 ounces of in-situ gold mined) in 2015. There was a large increase at the La India mine where the gold mineral reserves increased by 28% (188,000 ounces) to 867,000 ounces of gold (30.0 million tonnes of ore grading 0.90 g/t gold and 4.23 g/t silver) compared with a year ago. The mine depletion was more than offset by the addition of new oxide reserves and by conversion of sulphide mineral resources to mineral reserves in the Main pit, the result of successful metallurgical investigations in 2015 and field-proven experience with the North Zone sulphide material.
26
The 304,000-ounce decline in mineral reserves at Pinos Altos was due to 2015 production of 192,974 ounces of gold (205,000 ounces of in-situ gold mined) as well as a change to the Cerro Colorado block model based on information gained from geological mapping and mining development. It is the Company's goal to maintain its global mineral reserves at approximately 10 to 15 times its annual gold production rate. The current mineral reserves are within this range when compared to the Company's projected annual 2016 production rate. In addition to gold, Agnico Eagle's proven and probable mineral reserves include by-product metals of approximately 55 million ounces of silver at the Pinos Altos, LaRonde, La India and Creston Mascota mines (68.2 million tonnes of ore grading an average of 25.0 g/t silver), plus 147,927 tonnes of zinc and 43,357 tonnes of copper at the LaRonde mine (18.2 million tonnes of ore grading 0.81% zinc and 0.24% copper) and 24,557 tonnes of copper at the Akasaba project (4.8 million tonnes grading 0.52% copper). At a gold price of $1,200 per ounce (leaving all other assumptions unchanged), there would be an approximate 5.4% increase in the gold contained in proven and probable mineral reserves. Conversely, using a gold price of $1,000 (leaving all other assumptions unchanged), there would be an estimated 5.4% decrease in the gold contained in proven and probable mineral reserves. Measured and Indicated Mineral Resources Grow by Approximately 1%, While Inferred Mineral Resources Increase by Approximately 23% Highlights from the December 31, 2015 Mineral Resource Statement include:
• Measured and indicated mineral resources now total approximately 309 million tonnes of ore grading 1.52 g/t gold, or approximately 15.1 million ounces of gold. This represents an increase of approximately 1% over the 2014 estimate
• Inferred mineral resources total approximately 230 million tonnes of ore grading 2.24 g/t gold, or approximately 16.5 million ounces of gold. This represents an increase of approximately 23% over the 2014 estimate
• At Amaruq, inferred mineral resources increased by approximately 67% to 3.3 million ounces of gold (16.9 million tonnes grading 6.05 g/t gold)
• There was a 43% increase (approximately 533,000 ounces of gold) in inferred mineral resources at Kittila, which includes initial mineral resources in the Sisar Zone discovered in 2015
• An initial inferred mineral resource of 608,000 ounces of gold and 3.7 million ounces of silver (19.7 million tonnes grading 0.96 g/t gold and 5.78 g/t silver) was estimated at the El Barqueño project in Mexico
• At Canadian Malartic, the approach of tripling the cut-off grade of the out-pit mineral resources had the effect of removing 343,000 ounces from the measured and indicated mineral resources, leaving 625,000 ounces (12.8 million tonnes of ore grading 1.51 g/t gold) in measured and indicated mineral resources. The same approach resulted in removing 344,000 ounces from the inferred mineral resource base, leaving 213,000 ounces (4.5 million tonnes of ore grading 1.47 g/t
27
gold) of inferred mineral resources. The cut-off grade used for the calculation of mineral resources at Canadian Malartic is now similar to that used at Goldex
The Company's measured and indicated mineral resources now total approximately 309 million tonnes of ore grading 1.52 g/t gold, or 15.1 million ounces of gold. This represents approximately a 1% increase in ounces and a slight increase in grade over the December 2014 measured and indicated mineral resource (see the April 30, 2015 news release for comparison). Two of the Kirkland Lake properties of CMC (50% owned by Agnico Eagle) reported increased indicated mineral resources: the Upper Beaver project increased by 179,000 ounces of gold to 901,000 ounces (4.4 million tonnes grading 6.36 g/t gold), while the Amalgamated Kirkland (“AK”) project reported initial indicated mineral resources of 133,000 ounces of gold (0.63 million tonnes grading 6.51 g/t gold) (these amounts represent Agnico Eagle’s 50% interest). Measured and indicated mineral resources at Kittila increased by 198,000 ounces of gold. La India’s measured and indicated mineral resources increased by 143,000 ounces of gold. These increases were offset by the successful conversion drilling from inferred mineral resources at several of the operations, particularly Akasaba and Meadowbank. At Canadian Malartic, the gold in all mineral resource categories declined as the result of adjusting the approach to the out-pit material (adjacent to or below the pit outline) throughout the property. The approach of tripling the cut-off grade of the out-pit mineral resources had the effect of removing 343,000 ounces from the measured and indicated mineral resources, leaving 625,000 ounces (12.8 million tonnes of ore grading 1.51 g/t gold) in measured and indicated mineral resources. The same approach resulted in removing 344,000 ounces from the inferred mineral resource base, leaving 213,000 ounces (4.5 million tonnes of ore grading 1.47 g/t gold) of inferred mineral resources. The cut-off grade used for the calculation of mineral resources at Canadian Malartic is now similar to that used at Goldex. All data shown for Canadian Malartic represent Agnico Eagle’s 50% ownership. The Company's inferred mineral resources now total 230 million tonnes of ore grading 2.24 g/t, or approximately 16.5 million ounces of gold. This represents an increase of 23% or approximately 3.1 million ounces of gold in inferred mineral resources (see the Company’s April 30, 2015 news release for comparison). The largest part of this increase is the significant updated inferred mineral resource of 16.9 million tonnes grading 6.05 g/t gold (approximately 3.3 million ounces of gold) at the higher-grade Amaruq discovery, which is 50 kilometres from the Meadowbank mine in Nunavut. This is an increase of 1.8 million ounces of gold compared with a year ago. Approximately 56% of the Amaruq mineral resources are near-surface. A portion of the 2015 exploration program at Amaruq involved drill testing portions of the Whale Tail deposit from the north to the south to gain a better understanding of the geological controls on the mineralization. This drilling led to the modelling of thicker, but
28

slightly lower grade zones of mineralization, which resulted in a modest decline in the grade of the inferred mineral resources reachable by open pit. As at December 31, 2015, an initial inferred mineral resource of 608,000 ounces of gold and 3.7 million ounces of silver (19.7 million tonnes grading 0.96 g/t gold and 5.78 g/t silver) was estimated at the El Barqueño project in Mexico. This maiden mineral resource consists of inferred mineral resources from the Azteca-Zapoteca, Angostura and Peña de Oro zones based on preliminary open pit designs. Exploration drilling at depth was responsible for a 43% increase (approximately 533,000 ounces of gold) in inferred mineral resources at Kittila, which includes initial mineral resources in the Sisar Zone, which was discovered in 2015. More details about Sisar can be found in the Kittila operations section of this news release. The Upper Beaver and AK properties in the Kirkland Lake area (50% owned by Agnico Eagle) also reported increased inferred mineral resources, the result of new drilling programs on these projects. The Upper Beaver project increased inferred mineral resources by 136,000 ounces of gold to 659,000 ounces (3.45 million tonnes grading 5.94 g/t gold), while the AK project reported initial inferred mineral resources of 203,000 ounces of gold (1.19 million tonnes grading 5.32 g/t gold) (in each case, representing Agnico Eagle’s 50% interest). Successful conversion drilling at depth at the Goldex mine resulted in approximately 329,000 ounces of gold from the inferred mineral resource category to mineral reserves. The distribution of mineral resources by property is set out in the following table. For full details including tonnage and grade, see the “Detailed Mineral Reserve and Mineral Resource Data (as at December 31, 2015)” below. December 31, 2015 Mineral Resources Measured & Indicated Inferred Mineral Resources Mineral Resources (000 oz gold) (000 oz gold) Northern Business LaRonde 767 1,251 Canadian Malartic (50%) 625 213 Lapa 155 302 Goldex 2,075 1,211 Kittila 1,548 1,764 Meadowbank 720 441 Meliadine 3,306 3,552 Amaruq - 3,283 Bousquet/Ellison 969 917 Hammond Reef (50%) 2,250 6
29

Upper Beaver (Kirkland Lake) (50%) 901 659 Akasaba 54 - AK (Kirkland Lake) (50%) 133 203 Other 31 420 Subtotal 13,535 14,221 Southern Business Creston Mascota 70 145 Pinos Altos 655 505 La India 828 1,068 El Barqueño - 608 Subtotal 1,553 2,325 Total Mineral Resources 15,089 16,546 NORTHERN BUSINESS REVIEW ABITIBI REGION, QUEBEC Agnico Eagle is currently Quebec’s largest gold producer with a 100% interest in three mines (LaRonde, Goldex and Lapa) and a 50% interest in the Canadian Malartic mine. These mines are located within 50 kilometres of each other, which provides operating synergies and allows for the sharing of technical expertise. LaRonde Mine – Increased Tonnage From Lower Mine Drives Record Quarterly Production The 100% owned LaRonde mine in northwestern Quebec achieved commercial production in 1988. The LaRonde mill processed an average of 6,128 tpd in the fourth quarter of 2015, compared with an average of 5,847 tpd in the corresponding period of 2014. Minesite costs per tonne were approximately C$94 in the fourth quarter of 2015, lower than the C$97 per tonne experienced in the fourth quarter of 2014. Throughput in the 2014 period was lower and costs were higher due to ten days of unscheduled shutdown related to a production hoist drive failure at shaft #4 (the internal winze) in December 2014. Milling performance for the full year 2015 was approximately 6,141 tpd, compared to 5,713 tpd in 2014. Throughput in the 2014 period was lower due primarily to the planned shutdowns for the installation of new hoist drives to replace obsolete production and service hoist equipment in the Penna shaft. Minesite costs per tonne for the full year 2015 were approximately C$99, unchanged from C$99 per tonne in 2014. LaRonde's total cash costs per ounce on a by-product basis were $510 in the fourth quarter of 2015 on payable production of 73,161 ounces of gold. This compares with the fourth quarter of 2014 when total cash costs per ounce on a by-product basis were $590
30
on production of 59,316 ounces of gold. The decrease in total cash costs per ounce in the 2015 period was largely due to higher production (due to higher gold grades from the lower mine area and the improved recoveries from the CIP circuit) and favourable foreign exchange rates. For the full year 2015, LaRonde's total cash costs per ounce on a by-product basis were $590 on gold production of 267,921 ounces. This compares to total cash costs per ounce on a by-product basis of $668 on gold production of 204,652 ounces in 2014. The higher production and lower costs in the 2015 period are primarily due to the reasons outlined above. In 2015, the LaRonde mine also produced approximately 3,501 tonnes of zinc (67% less than in 2014), 0.9 million ounces of silver (28% less than in 2014), and 4,941 tonnes of copper (1% less than in 2014) as by-products to the gold production. These totals are consistent with the change in the metals mix as the mine goes deeper and becomes more gold rich as opposed to zinc/silver rich in the upper levels. In 2016, approximately 89% of production is expected to come from the lower mine area (below the 248 level). In 2015, work was completed on the installation of the coarse ore conveyor system that extends from the 293 level to the crusher on the 280 level. The new conveyor was commissioned in the fourth quarter and a new ore pass and silo designed to feed the conveyor system are expected to be commissioned in the second quarter of 2016. This new conveyor should help improve mining flexibility and reduce congestion in the deeper portions of the mine. Studies are ongoing to assess the potential to extend the mineral reserve base and carry out mining activities between the 311 and 371 levels at LaRonde. At present, the mineral reserve base extends to the 311 level, which is 3.1 kilometres below the surface. In 2015, exploration drilling focused on the eastern portion of the LaRonde orebody down to the 371 level. As underground development progresses to the west, a key exploration focus in 2016 will be drill testing the western portion of the LaRonde orebody from the 311 to the 371 level. The Company is also evaluating the potential to develop and mine the Bousquet Zone 5 on the adjoining Bousquet property. Previous property owners had partly exploited the Bousquet Zone 5 by open pit and underground, and Agnico Eagle is evaluating the potential to initially mine the Bousquet Zone 5 from a depth of 90 to 330 metres below surface via an underground ramp. The mining method is likely to be similar to that employed at Goldex, and processing could utilize excess capacity from the Lapa circuit at LaRonde. Dewatering of the old pit is underway and permit applications to collect a bulk sample will be submitted shortly. An internal technical study is expected to be completed by the end of 2016. Canadian Malartic Mine – Annual Records Set for Ounces Produced and Tonnes Milled
31
In June 2014, Agnico Eagle and Yamana acquired all of the issued and outstanding common shares of Osisko Mining Corporation (“Osisko”) and created the Partnership. The Partnership owns and operates the Canadian Malartic mine in northwestern Quebec through a joint management committee. Each of Agnico Eagle and Yamana has an indirect 50% ownership interest in the Partnership. During the fourth quarter of 2015, the Canadian Malartic mill processed an average of 52,780 tpd (on a 100% basis) compared with an average of 53,232 tpd in the corresponding period of 2014. Minesite costs per tonne were approximately C$25 (C$21.76 excluding royalties) compared to the C$21 (C$19.32 excluding royalties) per tonne experienced in the fourth quarter of 2014. In the 2015 period, throughput was lower and costs were higher primarily due to a longer than planned mill shutdown in December 2015. During this shutdown additional costs were incurred to repair the eccentric at the crusher and for the alignment of the ring gear at the #2 ball mill. The average stripping ratio in the fourth quarter of 2015 was 1.86 to 1.0. For the full year 2015, the Canadian Malartic mill processed an average of 52,300 tpd compared with an average of 51,248 tpd in 2014 (on a 100% basis). Minesite costs per tonne were approximately C$23 (C$20.24 excluding royalties) compared to the C$22 (C$19.76 excluding royalties) per tonne experienced in 2014. The 2014 tonnage and costs are not considered to be representative as they only reflect the period from the acquisition date of June 16 through December 31. For the fourth quarter of 2015, Agnico Eagle’s share of production at the Canadian Malartic mine was 72,872 ounces of gold at total cash costs per ounce on a by-product basis of $606. This compares with the fourth quarter of 2014 when total cash costs per ounce on a by-product basis were $684 on production of 66,369 ounces of gold. Production was higher in the 2015 period primarily due to higher grades. Costs in the 2015 period were lower due to lower costs for fuel and explosives, increased production and favourable foreign exchange rates, partially offset by higher shutdown costs for the planned mill maintenance. For the full year 2015, Agnico Eagle’s share of production at the Canadian Malartic mine was 285,809 ounces of gold at total cash costs per ounce on a by-product basis of $596. This is in contrast with production from June 16 to December 31, 2014, which only included 143,008 ounces of gold at total cash costs per ounce on a by-product basis of $701 from Canadian Malartic. Future Opportunities – Continuing to Look to Further Optimize Operations Since acquiring the mine in June 2014, the Partnership has been looking at a variety of ways to optimize the operations. In parallel with the Barnat permitting (see below), the Partnership is currently working on the permitting necessary for improving the efficiency and environmental performance of the existing mobile crusher. At this point, milling levels are expected to be approximately 53,000 tpd through year-end 2016.
32
Several other opportunities have been identified to further optimize productivity, including:
• Improvements to SAG mill liners in order to reduce the number of major shutdowns to three from four
• Higher North Zone performance with the purchase of an additional remote control production back hoe. This should result in higher grade ore being brought to the mill
• Cost savings opportunities: primarily on explosives and contractors • Ongoing continuous improvement projects
Ounce reconciliation with the block model continues to be positive (approximately 5% higher) and is an opportunity to provide additional production flexibility going forward.
Permitting activities for the Barnat extension and deviation of Highway 117 are continuing on schedule. An Environmental Impact Assessment (“EIA”) for this project was submitted in February 2015. A second series of questions from the Quebec government was received by the Partnership in December 2015, and final responses were submitted in January 2016.
Public hearings are expected to be held later in 2016. Granting of final permits is expected to occur after the completion of the public consultation process. In parallel, the Partnership is currently working on permitting for improving the efficiency and environmental performance of the existing mobile crusher.
Odyssey and Near Pit Targets Could Provide Future Production Upside
At the Canadian Malartic mine, exploration programs are planned to evaluate a number of near pit/underground targets at the mine and further define the extent of the mineralization at the Odyssey zone (which is located to the east of the Canadian Malartic open pit). Both of these opportunities could provide new potential sources of ore for the Canadian Malartic mill. At Odyssey, 44 holes (a total of 35,870 metres) were drilled in 2015. Exploration to date has outlined two mineralized zones: Odyssey North and Odyssey South. Odyssey North has been traced from a depth of 550 to 1,200 metres below the surface and along approximately 1,500 metres of strike length. Odyssey South is approximately 200 to 550 metres below surface with an approximate strike length of 1,500 metres. Gold occurs along the margins of a porphyry body in both zones. Plan and three dimensional views of the Odyssey mineralization are shown below. [Plan View Showing Odyssey Zones and Near Pit/Underground opportunities at Canadian Malartic]
33

In 2016, the Canadian Malartic block model will be reviewed to further define the potential of the near pit targets and a 60,000 metre drill program has been proposed to further evaluate the extent of the mineralization at Odyssey.
CMC Exploration Activities – Pandora and Kirkland Lake are focus areas
In addition to joint, indirect ownership of the Canadian Malartic mine, Agnico Eagle and Yamana are also jointly exploring a portfolio of properties in the Kirkland Lake area and the Pandora and Wood-Pandora properties in the Abitibi region of Quebec. Agnico Eagle and Yamana, indirectly through Canadian Malartic Corporation (CMC) each hold a 50% interest in the Kirkland Lake and Pandora properties, while the Wood-Pandora property is a joint venture between Globex Mining Enterprises Inc. (50%) and CMC.
In 2015, approximately 960 metres of underground drifting was carried out on the Pandora project from a track drift developed from the Lapa mine. In addition, 34 surface holes (a total of 19,200 metres) and 13 underground holes (a total of approximately 7,900 metres) were drilled to test the C Zone and Branch Zone targets. Results have been encouraging, and additional underground development and 10,400 metres of drilling is planned in 2016.
The proposed budget for Pandora in 2016 (100% basis) is approximately C$4.1 million.
In Kirkland Lake, a total of approximately C$7.4 million (100%) was spent in 2015. This work included 58 drill holes (a total of 15,140 metres) on the AK, Upper Canada, Skead-MacGregor and Northland properties. In addition, an Airborne Gravity survey was completed.
This new drilling has been incorporated into a new mineral resource estimate for the AK property which is included in Agnico Eagle’s December 31, 2015 mineral reserve and mineral resource update (see “Detailed Mineral Reserve and Mineral Resource Data (as at December 31, 2015)” below).
34

The proposed budget for Kirkland Lake in 2016 (100% basis) is approximately C$5.2 million. This program will include 3,000 metres of drilling and further data compilation.
Lapa – Strong 2015 Performance, Limited Mine Life in 2016 but Exploration Could Provide Additional Upside The 100% owned Lapa mine in northwestern Quebec achieved commercial production in May 2009. The Lapa circuit, located at the LaRonde mill, processed an average of 1,478 tpd in the fourth quarter of 2015. This compares with an average of 1,760 tpd in the fourth quarter of 2014. The reduced throughput in the 2015 period was largely due to lower mill availability resulting from electrical and mechanical issues with the Lapa ball mill. Minesite costs per tonne were C$111 in the fourth quarter of 2015, compared to the C$109 realized in the fourth quarter of 2014. Costs in the 2015 period were higher due to the reasons above. Milling performance for the full year 2015 was approximately 1,534 tpd compared to 1,750 tpd in 2014. Throughput in the 2015 period was lower primarily due to downtime related to repairs carried out on the Lapa ball mill in the third and fourth quarters. Full-year minesite costs in 2015 were C$117 per tonne, higher than the C$107 in 2014. Costs were higher in 2015 largely due to the reasons outlined above. Payable production in the fourth quarter of 2015 was 19,929 ounces of gold at total cash costs per ounce on a by-product basis of $620. This compares with the fourth quarter of 2014, when production was 25,611 ounces of gold at total cash costs per ounce on a by-product basis of $607. In the 2015 period, production was lower and costs were higher due to a combination of lower throughput and lower grades compared to the 2014 period. For the full year 2015, payable production was 90,967 ounces of gold at total cash costs per ounce on a by-product basis of $590. The prior year production was 92,622 ounces of gold at total cash costs per ounce on a by-product basis of $667. Production in 2015 was lower due to lower throughput, while costs were lower primarily due to favourable foreign exchange rates. Under the current life of mine plan, Lapa is only expected to operate until early into the fourth quarter of 2016. Two areas (Zone 8 East - Upper mine and the Zulapa 7 - Deep 2 Zone) have been identified through exploration as areas that could potentially support future mining activity post 2017. However, additional exploration is required, and any potential production from these areas would likely require synergies with other production opportunities such as the Bousquet Zone 5 or the Pandora project. The LaRonde mine has now assumed responsibilities for the management and administration of the Lapa mine and progressive transfers of Agnico Eagle personnel from Lapa are now underway throughout the Company.
35
Goldex – Record Underground Ore Hoisting in Q4 2015, Trend Could Continue into 2016 The 100% owned Goldex mine in northwestern Quebec began operation in 2008 but mining operations in the original orebody, the Goldex Extension Zone (“GEZ”), were suspended in October 2011. In July 2012, the M and E satellite zones were approved for development. Mining operations resumed on the M and E satellite zones in September 2013. Mining operations at GEZ remain suspended. During the fourth quarter of 2015, the Goldex mine had record underground ore hoisting of 7,273 tpd. Although not currently built into the 2016 production forecast, the Company believes that there is potential for continued strong underground performance in 2016. Should this performance be sustainable, the Company will evaluate the potential to increase mill throughput (current mill capacity is approximately 8,000 tpd). The Goldex mill processed an average of 6,213 tpd in the fourth quarter of 2015 compared to 6,251 tpd in the fourth quarter of 2014, which was similar to prior-year levels. Minesite costs per tonne were approximately C$31 in the fourth quarter of 2015, lower than the C$34 per tonne experienced in the fourth quarter of 2014. The 2015 decrease in costs over the prior-year period is primarily due to the strong underground performance outlined above. For the full year 2015, the Goldex mill averaged 6,336 tpd, which compares to 5,799 tpd in the corresponding period of 2014. The higher throughput in the 2015 period was largely due to accelerated mining levels compared to the 2014 period. Full-year minesite costs per tonne in 2015 were C$33, the same in 2014. Payable production in the fourth quarter of 2015 was 27,646 ounces of gold at total cash costs per ounce on a by-product basis of $513. This compares with the fourth quarter of 2014, when production was 29,463 ounces of gold at total cash costs per ounce on a by-product basis of $583. Production in the 2014 period was higher due to slightly higher grades and marginally more ore processed compared to the 2015 period. Costs were lower in the 2015 period due to lower unit costs and favourable exchange rates as compared to the same period in 2014. For the full year 2015, payable production was 115,426 ounces of gold at total cash costs per ounce on a by-product basis of $538. The prior year production was 100,433 ounces of gold at total cash costs per ounce on a by-product basis of $638. Production in 2015 was higher and costs were lower than in 2014 due to higher tonnage, grade and recoveries. Rehabilitation of the surface ramp has been completed which provides increased operational flexibility. This ramp also provides access to the M2 and M5 satellite zones for conversion drilling and development later this year.
The exploration ramp into the DX Zone (the top of the Deep Zone) has reached the 120 level, which is the proposed bottom of the Deep 1 development phase. Underground
36
development in the Deep 1 Zone will now shift to excavation of the various sublevels needed for mining development and excavation of the conveyor ramp.
Studies are underway to evaluate the potential to increase throughput from the Deep 1 Zone, and the potential to mine a portion of the Deep 2 Zone, both of which could enhance production levels or extend the current mine life at Goldex and reduce operating costs. In January 2014, Agnico Eagle acquired the Akasaba West gold-copper deposit from Alexandria Minerals. Located less than 30 km from Goldex, the Akasaba West deposit could potentially create flexibility and synergies for the Company's operations in the Abitibi region by utilizing extra milling capacity at both Goldex and LaRonde, while reducing overall costs. Permitting and technical studies are ongoing with the goal of moving the project towards a production decision in late 2016 or early 2017. FINLAND AND SWEDEN
Agnico Eagle’s Kittila mine in Finland is the largest primary gold producer in Europe and hosts the Company’s largest mineral reserves. Exploration activities continue to expand the mineral resources and studies are underway to evaluate the potential to cost-effectively increase production. Kittila – Strong Mining Performance in Q4 2015 and Available Mill Capacity Provide Potential for Increased Future Production The 100% owned Kittila mine in northern Finland achieved commercial production in 2009. The focus at Kittila in 2015 was on improving mill reliability. Several projects were carried out in the fourth quarter of 2015 which appear to have improved maintenance performance. With further optimization, the Company believes that there is potential for improved mill availability, which could lead to higher throughput levels (possibly up to 20% higher) in the future. The Kittila mill processed an average of 4,100 tpd in the fourth quarter of 2015 compared to the 3,980 tpd in the fourth quarter of 2014. The underground performed very well in the fourth quarter resulting in record average daily throughput of 4,750 tpd in December 2015. Minesite costs per tonne at Kittila were approximately €80 in the fourth quarter of 2015, compared to €75 in the fourth quarter of 2014. Costs increased in the fourth quarter of 2015 due to the increased usage of consumables, higher contractor costs and increased underground development costs when compared with the 2014 period. For the full year 2015, the mill processed an average of 4,011 tpd, as compared with 2014 when the mill processed an average of 3,168 tpd. The increase in throughput was a result of the completion of the mill expansion at the end of September 2014. For the
37

full year 2015, the minesite costs per tonne were €76, compared to €78 in 2014. The slight decrease in minesite costs per tonne in the 2015 period are primarily due to efficiencies related to increased mill capacity. Fourth quarter 2015 payable production at Kittila was 44,279 ounces of gold with total cash costs per ounce on a by-product basis of $747. In the fourth quarter of 2014, the mine produced 43,130 ounces at total cash costs per ounce on a by-product basis of $809. The higher production and lower costs in the 2015 period were a result of the completion of the mill expansion which continues to ramp-up to design capacity and favourable exchange rates. For the full year 2015, payable production from Kittila was 177,374 ounces of gold at total cash costs per ounce on a by-product basis of $709. In 2014, the mine produced 141,742 ounces of gold at total cash costs per ounce on a by-product basis of $845. The lower production in 2014 was largely due to the planned mill shutdown in September 2014 to tie-in the expansion. The lower total cash costs per ounce in the 2015 period are largely due to increased production and favourable foreign exchange rates. Previous drilling on the Rimpi Zone at Kittila has outlined a significant zone of mineralization with potentially wider widths and better grades than those currently being mined. The main underground ramp at Kittila is being extended to reach the deeper portions of the Rimpi Zone and it is also providing further underground drill access to test for additional depth extensions of the Rimpi, Suuri, Roura and the newly discovered Sisar mineralized zones. In addition, a surface ramp is being driven into the Rimpi Zone (now at a depth of 190 metres below surface) for production purposes and to provide a second egress for the Suuri ramp system. It will serve as the main haulage route from the deeper portions of both Rimpi and Suuri and, potentially, the Sisar Zone.
At the Kuotko deposit, located approximately 15 kilometres north of Kittila, approximately 7,300 metre of drilling was completed in 2015. New mineralized zones have been identified outside of the known mineral resource areas. Metallurgical testing is also ongoing and studies are being carried out to assess the viability of mining the deposit as a satellite open pit. In 2015, a new zone of mineralization, known as the Sisar Zone, was discovered by exploration drilling from the underground ramp being driven towards the deeper portion of the Rimpi Zone The Sisar Zone is located to the east of the main Kittila ore zone, and in close proximity to existing underground infrastructure. The Sisar Zone could potentially provide an additional source of underground ore to the Kittila mill with relatively little additional underground development, should further drilling outline an economic deposit. This new zone is discussed in further detail below. Inferred mineral resources at Kittila as of December 31, 2015 include the initial inferred mineral resources reported for the Sisar zone. As the table below sets out, 37% (approximately 651,000 ounces of gold) of the current inferred resources at Kittila are
38

within the Sisar zone. Note that all of the inferred resources at Kittila, including Sisar, are above 1,400 metres depth.
Inferred mineral resources at the Kittila mine as of December 31, 2015
Category Gold Gold (oz) Tonnes (g/t) (x000) (x000)
Inferred Mineral Resources (Underground)
Sisar Zone 5.91 651 3,423 Main and all other zones 4.12 1,113 8,409
Total Inferred Mineral Resources 4.64 1,764 11,833 With the potential for higher mill capacity through ongoing optimization, development of the Rimpi and Sisar Zones could result in increased future production levels and reduced operating costs at Kittila. New Parallel Sisar Zone Extends Above and Below Previous Intercepts Recent holes drilled from the exploration ramp have extended the Sisar Zone upward, downward and to the north, including two intercepts that are lower than any previous intercepts on the Kittila property. The table below shows the intercepts of three new holes and two previously released holes. Pierce points for all these holes are shown on the Kittila composite longitudinal section and two cross sections (100 metres apart). All intercepts reported for the Kittila mine show uncapped grades over estimated true widths, based on a current geological interpretation that is being updated as new information becomes available with further drilling.
39
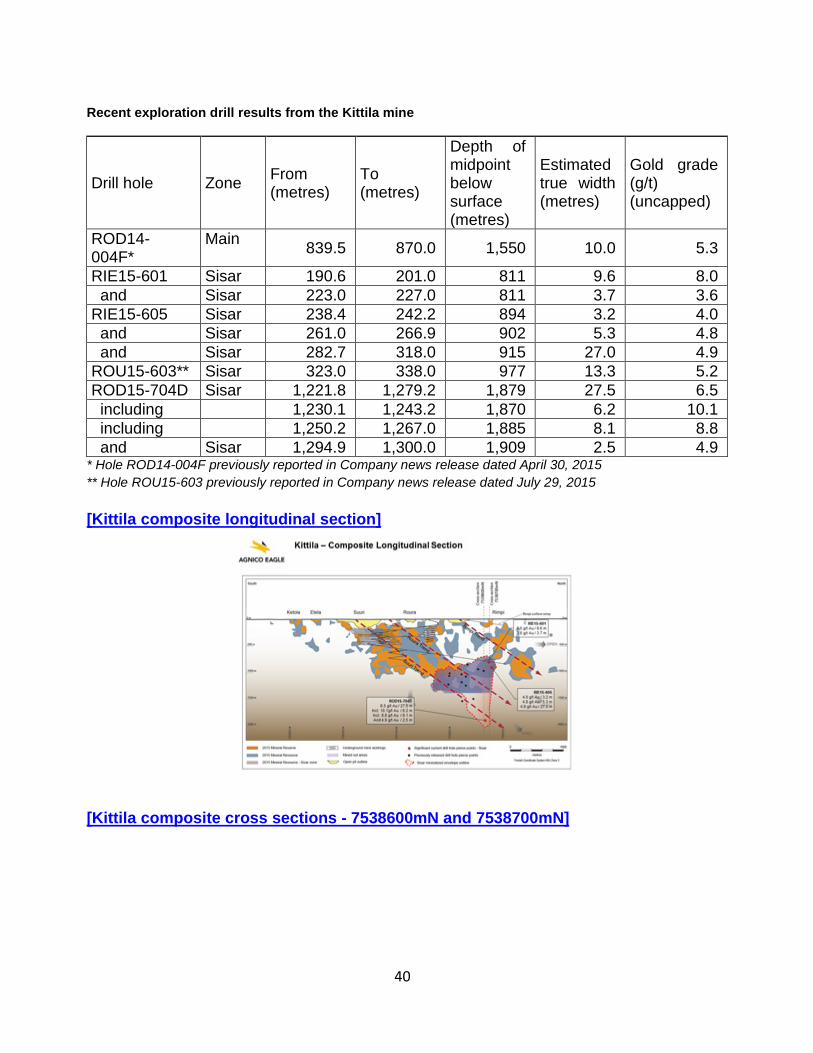
Recent exploration drill results from the Kittila mine
Drill hole Zone From (metres)
To (metres)
Depth of midpoint below surface (metres)
Estimated true width (metres)
Gold grade (g/t) (uncapped)
ROD14-004F*
Main 839.5 870.0 1,550 10.0 5.3
RIE15-601 Sisar 190.6 201.0 811 9.6 8.0 and Sisar 223.0 227.0 811 3.7 3.6 RIE15-605 Sisar 238.4 242.2 894 3.2 4.0 and Sisar 261.0 266.9 902 5.3 4.8 and Sisar 282.7 318.0 915 27.0 4.9 ROU15-603** Sisar 323.0 338.0 977 13.3 5.2 ROD15-704D Sisar 1,221.8 1,279.2 1,879 27.5 6.5 including 1,230.1 1,243.2 1,870 6.2 10.1 including 1,250.2 1,267.0 1,885 8.1 8.8 and Sisar 1,294.9 1,300.0 1,909 2.5 4.9
* Hole ROD14-004F previously reported in Company news release dated April 30, 2015 ** Hole ROU15-603 previously reported in Company news release dated July 29, 2015 [Kittila composite longitudinal section]
[Kittila composite cross sections - 7538600mN and 7538700mN]
40
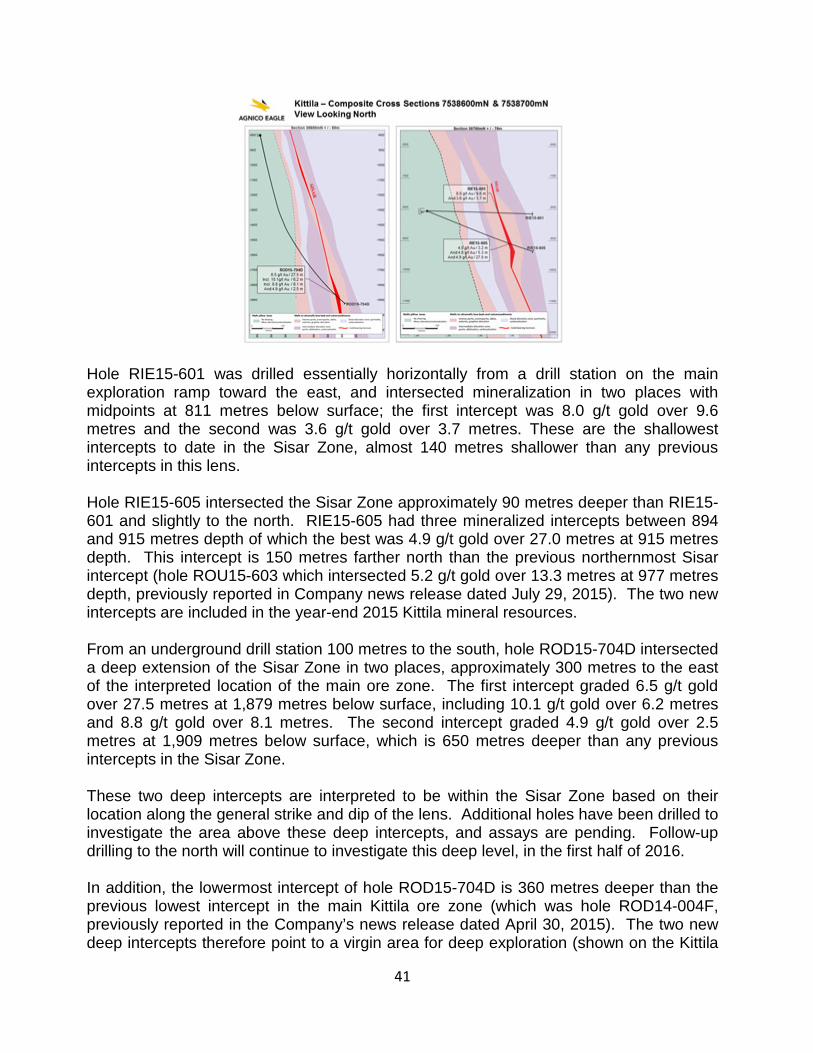
Hole RIE15-601 was drilled essentially horizontally from a drill station on the main exploration ramp toward the east, and intersected mineralization in two places with midpoints at 811 metres below surface; the first intercept was 8.0 g/t gold over 9.6 metres and the second was 3.6 g/t gold over 3.7 metres. These are the shallowest intercepts to date in the Sisar Zone, almost 140 metres shallower than any previous intercepts in this lens. Hole RIE15-605 intersected the Sisar Zone approximately 90 metres deeper than RIE15-601 and slightly to the north. RIE15-605 had three mineralized intercepts between 894 and 915 metres depth of which the best was 4.9 g/t gold over 27.0 metres at 915 metres depth. This intercept is 150 metres farther north than the previous northernmost Sisar intercept (hole ROU15-603 which intersected 5.2 g/t gold over 13.3 metres at 977 metres depth, previously reported in Company news release dated July 29, 2015). The two new intercepts are included in the year-end 2015 Kittila mineral resources. From an underground drill station 100 metres to the south, hole ROD15-704D intersected a deep extension of the Sisar Zone in two places, approximately 300 metres to the east of the interpreted location of the main ore zone. The first intercept graded 6.5 g/t gold over 27.5 metres at 1,879 metres below surface, including 10.1 g/t gold over 6.2 metres and 8.8 g/t gold over 8.1 metres. The second intercept graded 4.9 g/t gold over 2.5 metres at 1,909 metres below surface, which is 650 metres deeper than any previous intercepts in the Sisar Zone. These two deep intercepts are interpreted to be within the Sisar Zone based on their location along the general strike and dip of the lens. Additional holes have been drilled to investigate the area above these deep intercepts, and assays are pending. Follow-up drilling to the north will continue to investigate this deep level, in the first half of 2016. In addition, the lowermost intercept of hole ROD15-704D is 360 metres deeper than the previous lowest intercept in the main Kittila ore zone (which was hole ROD14-004F, previously reported in the Company’s news release dated April 30, 2015). The two new deep intercepts therefore point to a virgin area for deep exploration (shown on the Kittila
41

composite longitudinal secion) that could prove to be significant for the future of the Kittila mine. Barsele Project – Depth Extension Confirmed on the Central Zone On June 11, 2015, Agnico Eagle acquired a 55% interest in the Barsele project in Sweden. The Company can earn an additional 15% interest in the project through the completion of a pre-feasibility study. The Barsele property is known to contain intrusive-hosted gold mineralization (similar to Goldex) and gold-rich volcanogenic massive sulphide mineralization (similar to LaRonde). In 2015, the Company spent approximately $1.57 million on exploration to further evaluate the mineral potential of the property. In September 2015, trenching and mapping programs were carried out that confirmed that the known intrusive-hosted deposits plunge to the southeast. In the fourth quarter 2015, a 15 hole (8,350 metre) drill program was completed that successfully tested the depth extension of the Central Zone to 200 to 300 metres below surface. A $4.3 million exploration program consisting of 12,000 metres is planned to be carried out in 2016 to further evaluate the intrusive hosted mineralization. NUNAVUT REGION Agnico Eagle has identified Nunavut as a politically attractive and stable jurisdiction with enormous geological potential. With the Company’s largest producing mine (Meadowbank) and two significant development assets (Meliadine and Amaruq) and other exploration projects, Nunavut has the potential to be a strategic operating platform with the ability to generate strong production and cash flows over several decades. Meadowbank – Improved Mining Rates Could Provide Additional Flexibility Through 2018 The 100% owned Meadowbank mine in Nunavut, northern Canada, achieved commercial production in March 2010. The Meadowbank mill processed an average of 11,168 tpd in the fourth quarter of 2015, compared to the 11,160 tpd achieved in the fourth quarter of 2014. For the full year 2015, the Meadowbank mill processed an average of 11,049 tpd, compared to 11,313 tpd in the full year 2014. Mill throughput for the fourth quarter of 2015 was similar to the comparable period of 2014. Year-over-year mill throughput levels were slightly lower due to the hardness profile of the Vault ore processed. Minesite costs per tonne were a record low C$62 in the fourth quarter and C$70 for the full year of 2015. These costs were lower than the C$72 per tonne in the fourth quarter and C$73 full year 2014, respectively. The improvement in cost per tonne in the 2015 periods was primarily driven by improved productivity due to better mine planning and mechanical availability compared to the previous periods.
42
Payable production in the fourth quarter of 2015 was 102,580 ounces of gold at total cash costs per ounce on a by-product basis of $526. This compares with the fourth quarter of 2014 when 86,715 ounces were produced at total cash costs per ounce on a by-product basis of $757. The higher production and lower costs in the 2015 period compared to the 2014 period are primarily due to higher tonnage, grade and recoveries, and favourable foreign exchange rates. Full year 2015 payable production was 381,804 ounces of gold at total cash costs per ounce on a by-product basis of $613. In 2014, the mine produced 452,877 ounces of gold at total cash costs per ounce on a by-product basis of $599. The higher production and lower costs in the 2014 period is primarily due to the mining of higher than expected grades in the Goose pit in the first half of 2014, higher crusher throughput levels and slightly better recoveries. In July 2015, the Company decided to proceed with the expansion of the Vault pit. This expansion resulted in revised production guidance at Meadowbank for 2016 to 2018 (see guidance section above). The mine is now expected to close in the third quarter of 2018, which is approximately a year longer than previously forecast by Agnico Eagle in February 2015. Production levels are expected to gradually decline from 2016 to 2018 due to a decline in grade as the current mineral reserve base is depleted. The Company is actively exploring the Amaruq deposit (see section below) with the goal of potentially developing the deposit as a satellite operation to Meadowbank. Amaruq Project – Inferred Mineral Resources Expanded 67%; Final 2015 Drilling Extends Whale Tail Deposit at Depth in Two Directions
Agnico Eagle has a 100% interest in the Amaruq project. The large property consists of 114,761 hectares, approximately 50 kilometres northwest of the Meadowbank mine. The Amaruq drill program was completed in mid-October 2015. Total drilling at Amaruq for the year was 108,000 metres (378 holes), of which approximately 85,000 metres were in Whale Tail/Mammoth zones, approximately 17,000 metres in the IVR zone, and approximately 6,000 metres on regional targets and condemnation.
Results from all of the holes have been included in the 2015 inferred mineral resource estimate, but assays from several holes were received after the Company last reported drill results in its October 28, 2015 news release. A selection of the late 2015 drill results from several areas of the Amaruq deposit are discussed below, particularly in the Whale Tail Ore Shoot and the IVR Zone.
In August 2015, the Company announced an updated inferred mineral resource estimate as of June 30, 2015 of 2.0 million ounces of gold (9.7 million tonnes grading 6.47 g/t gold). The new inferred mineral resource estimate as of December 31, 2015 increased by 67% compared with the June 30, 2015 estimate (119% compared with the December 31, 2014
43

estimate) to 3.3 million ounces of gold (16.9 million tonnes grading 6.05 g/t gold). The Whale Tail deposit contains 89% of the gold in mineral resources; these mineral resources have been extended in two directions; along the east-plunging ore shoot to a depth of approximately 500 metres, and locally as deep as 600 metres in the central portion of Whale Tail. Since the June 30, 2015 estimate, the IVR inferred mineral resource has more than doubled to 208,635 ounces of gold (1.01 million tonnes grading 6.43 g/t gold), and there are initial resources under Mammoth Lake and in the former “gap” area between Whale Tail and Mammoth Lake. Selected late 2015 drill holes are set out in the table below, and their collars are located on the Amaruq Local Geology Map. The Whale Tail composite longitudinal section (below) shows the location of the resources in the Whale Tail as of December 31, 2015 and the pierce points for Whale Tail and Mammoth drill holes in the table below. Coordinates of the IVR drill holes are given in a second table. All intercepts reported for the Amaruq project show capped grades over estimated true widths, based on a preliminary geological interpretation that is being updated as new information becomes available with further drilling. [Amaruq local geology map]
[Whale Tail Deposit Composite Longitudinal Section]
44
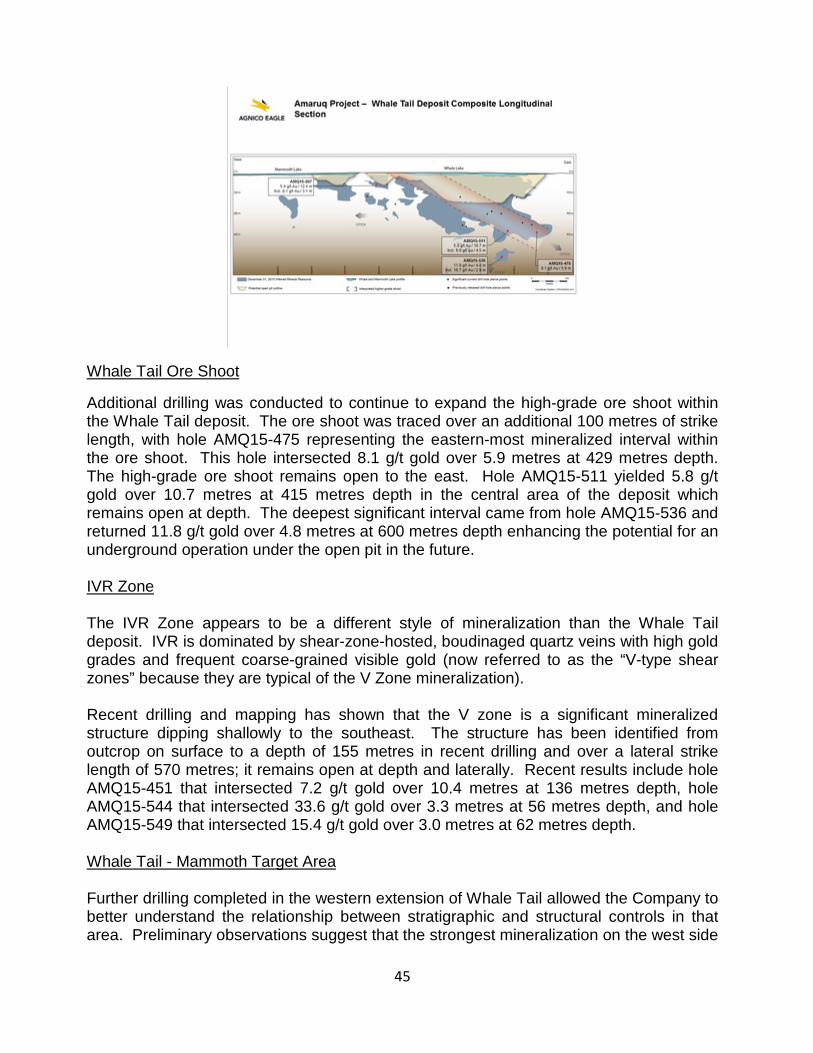
Whale Tail Ore Shoot
Additional drilling was conducted to continue to expand the high-grade ore shoot within the Whale Tail deposit. The ore shoot was traced over an additional 100 metres of strike length, with hole AMQ15-475 representing the eastern-most mineralized interval within the ore shoot. This hole intersected 8.1 g/t gold over 5.9 metres at 429 metres depth. The high-grade ore shoot remains open to the east. Hole AMQ15-511 yielded 5.8 g/t gold over 10.7 metres at 415 metres depth in the central area of the deposit which remains open at depth. The deepest significant interval came from hole AMQ15-536 and returned 11.8 g/t gold over 4.8 metres at 600 metres depth enhancing the potential for an underground operation under the open pit in the future. IVR Zone The IVR Zone appears to be a different style of mineralization than the Whale Tail deposit. IVR is dominated by shear-zone-hosted, boudinaged quartz veins with high gold grades and frequent coarse-grained visible gold (now referred to as the “V-type shear zones” because they are typical of the V Zone mineralization). Recent drilling and mapping has shown that the V zone is a significant mineralized structure dipping shallowly to the southeast. The structure has been identified from outcrop on surface to a depth of 155 metres in recent drilling and over a lateral strike length of 570 metres; it remains open at depth and laterally. Recent results include hole AMQ15-451 that intersected 7.2 g/t gold over 10.4 metres at 136 metres depth, hole AMQ15-544 that intersected 33.6 g/t gold over 3.3 metres at 56 metres depth, and hole AMQ15-549 that intersected 15.4 g/t gold over 3.0 metres at 62 metres depth. Whale Tail - Mammoth Target Area Further drilling completed in the western extension of Whale Tail allowed the Company to better understand the relationship between stratigraphic and structural controls in that area. Preliminary observations suggest that the strongest mineralization on the west side
45
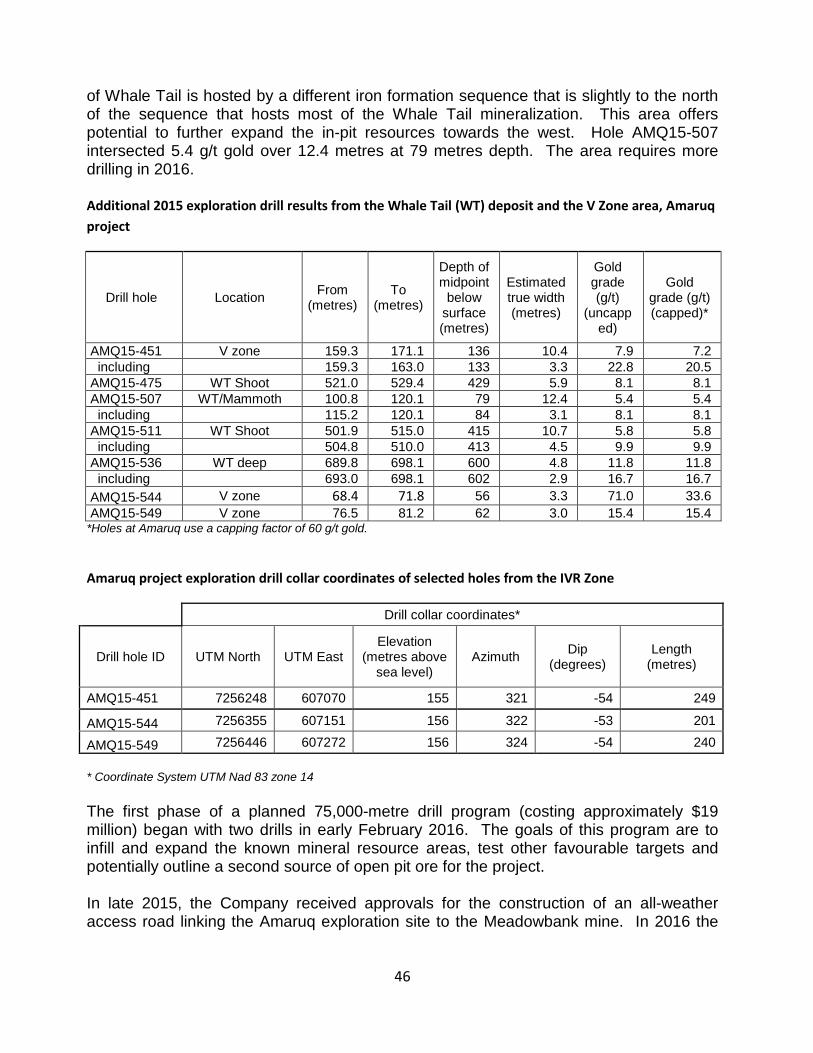
of Whale Tail is hosted by a different iron formation sequence that is slightly to the north of the sequence that hosts most of the Whale Tail mineralization. This area offers potential to further expand the in-pit resources towards the west. Hole AMQ15-507 intersected 5.4 g/t gold over 12.4 metres at 79 metres depth. The area requires more drilling in 2016. Additional 2015 exploration drill results from the Whale Tail (WT) deposit and the V Zone area, Amaruq project
Drill hole Location From (metres)
To (metres)
Depth of midpoint
below surface (metres)
Estimated true width (metres)
Gold grade (g/t)
(uncapped)
Gold grade (g/t) (capped)*
AMQ15-451 V zone 159.3 171.1 136 10.4 7.9 7.2 including 159.3 163.0 133 3.3 22.8 20.5 AMQ15-475 WT Shoot 521.0 529.4 429 5.9 8.1 8.1 AMQ15-507 WT/Mammoth 100.8 120.1 79 12.4 5.4 5.4 including 115.2 120.1 84 3.1 8.1 8.1 AMQ15-511 WT Shoot 501.9 515.0 415 10.7 5.8 5.8 including 504.8 510.0 413 4.5 9.9 9.9 AMQ15-536 WT deep 689.8 698.1 600 4.8 11.8 11.8 including 693.0 698.1 602 2.9 16.7 16.7 AMQ15-544 V zone 68.4 71.8 56 3.3 71.0 33.6 AMQ15-549 V zone 76.5 81.2 62 3.0 15.4 15.4
*Holes at Amaruq use a capping factor of 60 g/t gold.
Amaruq project exploration drill collar coordinates of selected holes from the IVR Zone
Drill collar coordinates*
Drill hole ID UTM North UTM East Elevation
(metres above sea level)
Azimuth Dip (degrees)
Length (metres)
AMQ15-451 7256248 607070 155 321 -54 249
AMQ15-544 7256355 607151 156 322 -53 201
AMQ15-549 7256446 607272 156 324 -54 240
* Coordinate System UTM Nad 83 zone 14 The first phase of a planned 75,000-metre drill program (costing approximately $19 million) began with two drills in early February 2016. The goals of this program are to infill and expand the known mineral resource areas, test other favourable targets and potentially outline a second source of open pit ore for the project. In late 2015, the Company received approvals for the construction of an all-weather access road linking the Amaruq exploration site to the Meadowbank mine. In 2016 the
46
Company expects to carry out additional engineering and begin road preparation from the Vault pit at Meadowbank. Engineering and environmental baseline studies are underway to support the permitting process for the Amaruq project as a potential satellite open pit operation to the Meadowbank mine. The most recent drilling at depth in Whale Tail also indicates that this deposit hosts high-grade intercepts below the preliminary ultimate pit shell, suggesting that Whale Tail has underground potential. As such, permit applications for an underground exploration ramp will also be submitted in 2016. Meliadine – Moderate 2016 Capital Expenditures Preserves Production Optionality Located near Rankin Inlet, Nunavut, Canada, the Meliadine project was acquired in July 2010, and is one of Agnico Eagle's largest gold projects in terms of mineral resources. The Company owns 100% of the 111,757 hectare property. In 2015, capital expenditures at Meliadine were approximately $67 million with a focus on additional ramp development, permitting, camp operation and completion of an updated National Instrument 43-101 – Standards of Disclosure for Mineral Projects (“NI 43-101”) technical study (see news release dated March 12, 2015). In 2015, approximately 2,084 metres of underground development were completed, with the ramp now extending to a vertical depth of approximately 300 metres below the surface. The technical study was based on extracting only the 3.3 million ounces of gold in proven and probable mineral reserves at December 31, 2014 (13.9 million tonnes of ore grading 7.44 g/t gold), which is all contained in the Tiriganiaq and Wesmeg deposits. At December 31, 2015, the Meliadine property hosted 3.4 million ounces of proven and probable mineral reserves (14.5 million tonnes of ore grading 7.32 g/t gold), 3.31 million ounces of measured and indicated mineral resources (20.78 million tonnes of ore grading 4.95 g/t gold), and 3.55 million ounces of inferred mineral resources (14.71 million tonnes of ore grading 7.51 g/t gold). In addition, there are numerous other known gold occurrences in the 80-kilometre-long greenstone belt that require further evaluation. The updated technical study forecast average annual production of approximately 350,000 ounces at a life-of-mine total cash costs per ounce on a by-product basis of approximately $531 over a nine year mine life. The study used a gold price of C$1,495 per ounce (as compared to a current spot price of approximately C$1,657 per ounce on February 8, 2016). The capital budget for 2016 is $96 million with activities focused on further underground development (approximately 3,000 metres), detailed engineering and procurement, construction of essential surface infrastructure, and acquisition of a used camp facility. The goal of the 2016 capital program is to ensure that the project remains on track for a potential 2020 production start-up, which is approximately a one year delay from previous expectations.
47

Internal studies are ongoing to evaluate the potential to extract additional ounces of gold from the Tiriganiaq and Wesmeg/Normeg deposits, which could potentially extend the mine life, increase annual production, and improve the project economics and the after-tax internal rate of return. These studies are expected to be completed in the third quarter of 2016.
In July 2015, the Kivalliq Inuit Association and Agnico Eagle signed the Inuit Impact Benefit Agreement ("IIBA") for the Meliadine gold project. The IIBA addresses protection of Inuit values, culture and language, protection of the land, water and wildlife, provides financial compensation to Inuit over the mine life and contains provision for training, employment and contracting. On October 5, 2015, the Nunavut Water Board issued the permit (License B) for Meliadine pre-development work. License A, which is required for production activities, is expected to be granted in the second quarter of 2016. The timing of future capital expenditures on the Meliadine project beyond 2016 and the determination of whether to build a mine at Meliadine are subject to approval by Agnico Eagle's Board of Directors, which will be based on prevailing market conditions and outcomes of the various potential scenarios being evaluated.
48
Acquisition of New Properties in Nunavut Agnico Eagle is currently studying options and alternatives in Nunavut to capitalize on the large and growing mineral resource in the region. As part of this initiative, the Company has staked in 2015 new claims totaling 68,012 hectares on properties to the west-northwest of the project, on the continuation of the greenstone belt that hosts the Meliadine deposits. In summer 2015, an airborne VTEM magnetic and electromagnetic survey was flown over the new properties. A field crew initiated prospecting and sampling of areas with geophysical signatures typical of iron formation-hosted Archean/Proto-Proterozoic deposits, similar to those recognized at Meadowbank, Amaruq and Meliadine projects. Close to 800 rock samples have been collected from the properties. Initial results have identified a 2-kilometre-long structure from which 21 rock samples returned values above 1.0 g/t gold including seven values in excess of 10.0 g/t gold, with a maximum value of 42.0 g/t gold. The new properties appear to be geologically similar to the Meadowbank, Meliadine and Amaruq projects where the Company’s exploration team has demonstrated the effectiveness of a systematic exploration approach and the strong mineral potential of this part of Nunavut. Assembling and analyzing the data collected this summer will assist in preparing a drill program for 2016 to further investigate the higher potential areas on the new properties. SOUTHERN BUSINESS REVIEW Agnico Eagle’s Southern Business operations are focused in Mexico. These operations have been the source of growing precious metals production (gold and silver), stable operating costs and strong free cash flow since 2009. In the fourth quarter of 2015, the Mexican operations had record quarterly silver production of approximately 745,000 ounces. Pinos Altos – Shaft Commissioning Scheduled for H1 2016 The 100% owned Pinos Altos mine in northern Mexico achieved commercial production in November 2009. The Pinos Altos mill processed 4,940 tpd in the fourth quarter of 2015 compared to 5,466 tpd per day processed in the fourth quarter of 2014. During the fourth quarter of 2015, approximately 146,200 tonnes of ore were stacked on the leach pad at Pinos Altos, compared to 131,000 tonnes in the comparable 2014 period. Mill throughput in the 2015 period was negatively impacted by cold weather conditions and a higher percentage of clay in the ore. Minesite costs per tonne at Pinos Altos were $44 in the fourth quarter of 2015, lower than the $48 in the fourth quarter of 2014. The difference in minesite costs per tonne was
49

largely attributable to variations in the proportion of heap leach ore to milled ore and open pit ore to underground ore and routine fluctuations in the waste to ore stripping ratio in the open pit mines. In addition, the 2015 costs were favourably impacted by lower energy and fuel costs. For the full year 2015, the Pinos Altos mill processed an average of 5,462 tpd, compared to 5,350 tpd processed in 2014. In 2015, approximately 384,700 tonnes of ore were stacked on the leach pad at Pinos Altos, compared to approximately 567,800 tonnes in 2014. Minesite costs per tonne at Pinos Altos for the full year period in 2015 were approximately $45 compared to approximately $48 in 2014, with the difference due to the reasons mentioned above. Payable production in the fourth quarter of 2015 was 44,496 ounces of gold at total cash costs per ounce on a by-product basis of $417. This compares with production of 40,669 ounces at total cash costs per ounce on a by-product basis of $597 in the fourth quarter of 2014. Higher production in 2015 is largely due to higher grades processed compared to the same period last year. The decrease in the year over year total cash costs per ounce is largely due to higher silver production and favourable foreign exchange rates compared to the prior year period. For the full year 2015, Pinos Altos produced 192,974 ounces of gold at total cash costs per ounce on a by-product basis of $387. This is in contrast to 2014 when the mine produced 171,019 ounces of gold at total cash costs per ounce on a by-product basis of $533. The higher ounces produced and decrease in the cash costs per ounce on a year-over-year basis is largely due to the reasons mentioned above. The $106 million Pinos Altos shaft sinking project remains on schedule for completion in early 2016, with full commissioning expected during the first half of 2016. When the shaft is completed, it will allow better matching of the future mining capacity with the mill capacity at Pinos Altos once the open pit mining operation begins to wind down as planned over the next several years. Creston Mascota – Record Annual Tonnes Stacked The Creston Mascota heap leach has been operating as a satellite operation to the Pinos Altos mine since late 2010. Approximately 529,000 tonnes of ore were stacked on the Creston Mascota leach pad during the fourth quarter of 2015, compared to approximately 550,800 tonnes stacked in the fourth quarter of 2014. In the 2015 period, crusher throughput was slightly lower due to cold weather conditions which created minor ore handling issues. Minesite costs per tonne at Creston Mascota were $13 in the fourth quarter of 2015 compared to $14 in the fourth quarter of 2014. Costs were slightly lower in the 2015 period due to lower fuel consumption, favourable fuel price variance and lower equipment rental charges.
50
For the full year 2015, approximately 2,098,800 tonnes of ore were stacked on the Creston Mascota leach pad, compared to approximately 1,793,800 tonnes stacked in the full year 2014. In the 2015 period, additional ore was encountered outside the block model, which resulted in more tonnes being stacked in the first half of the year compared to the 2014 period. Minesite costs per tonne at Creston Mascota were $12 for the full year 2015, compared to $16 in 2014. The increase in tonnes stacked in the 2015 period resulted in lower costs compared to the 2014 period. Payable production at Creston Mascota in the fourth quarter of 2015 was 13,933 ounces of gold at total cash costs per ounce on a by-product basis of $445. This compares to 12,989 ounces of gold at total cash costs per ounce on a by-product basis of $556 during the fourth quarter of 2014. Production was higher in the 2015 period due to higher grades. Costs in the 2015 period were lower primarily due to increased production and favourable exchange rates. Payable production for the full year 2015 totaled 54,703 ounces of gold at total cash costs per ounce on a by-product basis of $430, compared to 47,842 ounces of gold at total cash costs per ounce on a by-product basis of $578 in 2014. The higher production in 2015 is primarily due to more tonnes stacked at slightly higher grades. Costs were lower in the 2015 period primarily due to more ounces produced and favourable exchange rates. In fourth quarter of 2015, work on the Phase 4 leach pad advanced with construction activities focused on earthworks, drainages, peripheral roads and water diversion channels. Overall, the project is 50% constructed with full completion expected later in 2016. As reported in the Company's July 29, 2015 news release, infill drilling has encountered higher grade mineralization at the Creston Mascota deposit. In the fourth quarter of 2015, five holes totaling approximately 600 metres were completed which showed structural continuity of the mineralization down dip. Work is underway to evaluate the impact of these results on the pit design and production planning. La India – Increased Mineral Reserves and Mineral Resources at Year-End 2015 The La India mine in Sonora, Mexico, located approximately 70 kilometres from the Company's Pinos Altos mine, was acquired in November 2011 through the purchase of Grayd Resources Inc., which held a 56,000 hectare land position in the Mulatos gold belt. Commissioning of the mine commenced ahead of schedule in the third quarter of 2014. Design, permitting, construction and start-up of the La India mine were completed within 22 months of the acquisition. In 2014, the mine reported 3,180 ounces of pre-commercial production, and commercial production was declared as at February 1, 2014. Approximately 1,439,500 tonnes of ore were stacked on the La India leach pad during the fourth quarter of 2015, compared to approximately 1,426,700 tonnes stacked in the fourth quarter of 2014. Minesite costs per tonne at La India were $8 in the fourth quarter
51
of 2015, compared to $9 in the fourth quarter of 2014. The slightly lower costs in the 2015 period are primarily due to lower costs for fuel, consumables and labour. For the full year 2015, approximately 5,371,400 tonnes of ore were stacked on the La India leach pad compared to approximately 4,773,200 tonnes stacked in the full year 2014. Minesite costs per tonne at La India were $9 for the full year 2015, compared to $8 in 2014. The increase in tonnes stacked in the 2015 period reflects a full year of stacking versus 11 months (the commercial production period) in 2014. Costs were slightly higher due to higher maintenance and contractor costs. Payable production at La India in the fourth quarter of 2015 was 23,432 ounces of gold at total cash costs per ounce on a by-product basis of $485. This compares to 23,273 ounces at total cash costs per ounce on a by-product basis of $496 during the fourth quarter of 2014. Costs were slightly better in the 2015 period due to favourable foreign exchange rates. Payable production for the full year 2015 totaled 104,362 ounces of gold at total cash costs per ounce on a by-product basis of $436, compared to 75,093 ounces of gold at total cash costs per ounce on a by-product basis of $487 in 2014. The higher production in 2015 is primarily due to more ore tonnes stacked compared to the 2014 period. Costs were lower in the 2015 period due to more ounces produced and favourable foreign exchange rates. In the fourth quarter of 2015, construction for the leach pad expansion (earthworks and liner installation) was finished within budget and haul road construction and preparation activities for the start-up of mining at the Main Zone pit were also completed. Additional drilling was carried out at La India in 2015, with a focus on extending mineralization in the Main Zone and the La India Zone and conversion of sulfide mineralization into mineral reserves and mineral resources. In addition, drilling was also carried out on a portion of the El Realito property. The 2015 exploration program resulted in a 28% increase in mineral reserves, and a 21% increase in measured and indicated mineral resources (see “Detailed Mineral Reserve and Mineral Resource Data (as at December 31, 2015)” below). With the increased mineral reserves and mineral resources, the Company is undertaking studies to consider the potential for expanding production at the mine. El Barqueño – Drilling Continues with a Focus on Mineral Resource Delineation and Defining New Target Areas Agnico Eagle has a 100% interest in the El Barqueño project. The 32,840-hectare property is in the Guachinango gold-silver mining district, Jalisco State, Mexico, approximately 150 kilometres west of the state capital of Guadalajara. It consists of three blocks of land: the original El Barqueño package (El Barqueño I, II and III) acquired from Cayden Resources in November 2014, and two adjacent blocks acquired from Soltoro
52

Limited in June 2015 (El Rayo and El Tecolote). The Company last reported on this project in a news release dated October 28, 2015. The El Barqueño project contains a number of known mineralized zones and several prospects that require further evaluation. The project was a major exploration focus for the Company in 2015, with a total of 279 holes (a total of 69,522 metres) drilled in the $17 million exploration program. Using these results, an initial inferred mineral resource at El Barqueño is being reported in this news release: 19.7 million tonnes grading 0.96 g/t gold and 5.78 g/t silver (containing 608,000 ounces of gold and 3.7 million ounces of silver) at the Azteca-Zapoteca, Angostura and Peña de Oro zones. Exploration expenditures at El Barqueño in 2016 are budgeted at $13 million for mineral resource development, conversion and regional exploration. There are currently 14 drills working to define the limits of the known prospects and test new target areas such as: Olmeca, Zapote, Mixteca, El Rayo and Pilarica. The project’s gold-silver deposits could potentially be developed into a series of open pits utilizing heap leach processing, similar to Creston Mascota and the La India mine. Annual General Meeting Friday, April 29, 2016 at 11:00 am (E.D.T.) Sheraton Centre Toronto Hotel (Dominion Ballroom) 123 Queen Street West Toronto, ON M5H 2M9 About Agnico Eagle Agnico Eagle is a senior Canadian gold mining company that has produced precious metals since 1957. Its eight mines are located in Canada, Finland and Mexico, with exploration and development activities in each of these countries as well as in the United States and Sweden. The Company and its shareholders have full exposure to gold prices due to its long-standing policy of no forward gold sales. Agnico Eagle has declared a cash dividend every year since 1983. Further Information For further information regarding Agnico Eagle, contact Investor Relations at [email protected] or call (416) 947-1212. Note Regarding Certain Measures of Performance This news release discloses certain measures, including ‘‘total cash costs per ounce’’ and ‘‘minesite costs per tonne’’, “all-in sustaining costs per ounce” and “adjusted net income” that are not recognized measures under IFRS. These data may not be comparable to data presented by other gold producers. For a reconciliation of these
53

measures to the most directly comparable financial information presented in the consolidated financial statements prepared in accordance with IFRS and for an explanation of how management uses these measures, other than adjusted net income, see “Reconciliation of Non-GAAP Financial Performance Measures” below. The total cash costs per ounce of gold produced is reported on both a by-product basis (deducting by-product metal revenues from production costs) and co-product basis (before by-product metal revenues). The total cash costs per ounce of gold produced on a by-product basis is calculated by adjusting production costs as recorded in the consolidated statements of income (loss) for by-product revenues, unsold concentrate inventory production costs, smelting, refining and marketing charges and other adjustments, and then dividing by the number of ounces of gold produced. The total cash costs per ounce of gold produced on a co-product basis is calculated in the same manner as the total cash costs per ounce of gold produced on a by-product basis except that no adjustment is made for by-product metal revenues. Accordingly, the calculation of total cash costs per ounce of gold produced on a co-product basis does not reflect a reduction in production costs or smelting, refining and marketing charges associated with the production and sale of by-product metals. The total cash costs per ounce of gold produced is intended to provide information about the cash-generating capabilities of the Company’s mining operations. Management also uses these measures to monitor the performance of the Company’s mining operations. As market prices for gold are quoted on a per ounce basis, using the total cash costs per ounce of gold produced on a by-product basis measure allows management to assess a mine’s cash-generating capabilities at various gold prices. All-in sustaining costs per ounce is used to show the full cost of gold production from current operations. The Company calculates all-in sustaining costs per ounce of gold produced on a by-product basis as the aggregate of total cash costs per ounce on a by-product basis, sustaining capital expenditures (including capitalized exploration), general and administrative expenses (including stock options) and reclamation expenses divided by the amount of gold produced. The all-in sustaining costs per ounce of gold produced on a co-product basis is calculated in the same manner as the all-in sustaining costs per ounce of gold produced on a by-product basis except that the total cash costs per ounce on a co-product basis is used, meaning no adjustment is made for by-product metal revenues. The Company's methodology for calculating all-in sustaining costs per ounce may differ from to the methodology used by other producers that disclose all-in sustaining costs per ounce. The Company may change the methodology it uses to calculate all-in sustaining costs per ounce in the future, including in response to the adoption of formal industry guidance regarding this measure by the World Gold Council. Management is aware that these per ounce measures of performance can be affected by fluctuations in exchange rates and, in the case of total cash costs per ounce of gold produced on a by-product basis, by-product metal prices. Management compensates for these inherent limitations by using these measures in conjunction with minesite costs per tonne (discussed below) as well as other data prepared in accordance with IFRS. Management also performs sensitivity analyses in order to quantify the effects of fluctuating exchange rates and metal prices. This news release also contains information as to estimated future total cash costs per ounce, all-in sustaining costs per ounce and minesite costs per tonne. The estimates are based upon the total cash costs per ounce,
54
all-in sustaining costs per ounce and minesite costs per tonne that the Company expects to incur to mine gold at its mines and projects and, consistent with the reconciliation of these actual costs referred to above, do not include production costs attributable to accretion expense and other asset retirement costs, which will vary over time as each project is developed and mined. It is therefore not practicable to reconcile these forward-looking non-GAAP financial measures to the most comparable IFRS measure.
55
Forward-Looking Statements The information in this news release has been prepared as at February 10, 2016. Certain statements contained in this document constitute “forward-looking statements” within the meaning of the United States Private Securities Litigation Reform Act of 1995 and “forward-looking information” under the provisions of Canadian provincial securities laws and are referred to herein as “forward-looking statements”. When used in this document, the words “anticipate”, “estimate”, “expect”, “forecast”, “planned”, “will”, “could”, “potential” and similar expressions are intended to identify forward-looking statements. Such statements include without limitation: the Company's forward-looking production guidance, including estimated ore grades, project timelines, drilling results, metal production, life of mine estimates, production, total cash costs per ounce, minesite costs per tonne, all-in sustaining costs per ounce and cash flows; the estimated timing and conclusions of technical reports and other studies; the methods by which ore will be extracted or processed; statements concerning expansion projects, recovery rates, mill throughput, optimization, and projected exploration expenditures, including costs and other estimates upon which such projections are based; estimates of depreciation expense, general and administrative expense and tax rates; the impact of maintenance shutdowns; statements regarding timing and amounts of capital expenditures and other assumptions; estimates of future mineral reserves, mineral resources, mineral production, optimization efforts and sales; estimates of mine life; estimates of future mining costs, total cash costs per ounce, minesite costs per tonne, all-in sustaining costs per ounce and other expenses; estimates of future capital expenditures and other cash needs, and expectations as to the funding thereof; statements as to the projected development of certain ore deposits, including estimates of exploration, development and production and other capital costs and estimates of the timing of such exploration, development and production or decisions with respect to such exploration, development and production; estimates of mineral reserves and mineral resources, and statements and information regarding anticipated future exploration; the anticipated timing of events with respect to the Company’s mine sites and statements and information regarding the sufficiency of the Company’s cash resources and other statements and information regarding anticipated trends with respect to the Company's operations, exploration and the funding thereof. Such statements and information reflect the Company’s views as at the date of this document and are subject to certain risks, uncertainties and assumptions, and undue reliance should not be placed on such statements and information. Forward-looking statements are necessarily based upon a number of factors and assumptions that, while considered reasonable by Agnico Eagle as of the date of such statements, are inherently subject to significant business, economic and competitive uncertainties and contingencies. The material factors and assumptions used in the preparation of the forward looking statements contained herein, which may prove to be incorrect, include, but are not limited to, the assumptions set forth herein and in management's discussion and analysis (“MD&A”) and the Company's Annual Information Form (“AIF”) for the year ended December 31, 2014 filed with Canadian securities regulators and that are included in its Annual Report on Form 40-F for the year ended December 31, 2014 (“Form 40-F”) filed with the SEC as well as: that there are no significant disruptions affecting operations; that production, permitting and expansion at each of Agnico Eagle's properties proceeds on a basis consistent with current expectations and plans; that the relevant metal prices,
56

exchange rates and prices for key mining and construction supplies will be consistent with Agnico Eagle's expectations; that Agnico Eagle's current estimates of mineral reserves, mineral resources, mineral grades and metal recovery are accurate; that there are no material delays in the timing for completion of ongoing growth projects; that the Company's current plans to optimize production are successful; and that there are no material variations in the current tax and regulatory environment. Many factors, known and unknown, could cause the actual results to be materially different from those expressed or implied by such forward looking statements and information. Such risks include, but are not limited to: the volatility of prices of gold and other metals; uncertainty of mineral reserves, mineral resources, mineral grades and mineral recovery estimates; uncertainty of future production, project development, capital expenditures, and other costs; currency fluctuations; financing of additional capital requirements; cost of exploration and development programs; mining risks; community protests; risks associated with foreign operations; governmental and environmental regulation; the volatility of the Company’s stock price; and risks associated with the Company’s currency, fuel and by-product metal derivative strategies. For a more detailed discussion of such risks and other factors that may affect the Company’s ability to achieve the expectations set forth in the forward-looking statements contained in this document, see the AIF and MD&A filed on SEDAR at www.sedar.com and included in the Form 40-F filed on EDGAR at www.sec.gov, as well as the Company’s other filings with the Canadian securities regulators and the SEC. Other than as required by law, the Company does not intend, and does not assume any obligation, to update these forward-looking statements and information. Notes to Investors Regarding the Use of Mineral Resources Cautionary Note to Investors Concerning Estimates of Measured and Indicated Mineral Resources This document uses the terms “measured mineral resources” and “indicated mineral resources”. Investors are advised that while those terms are recognized and required by Canadian regulations, the SEC does not recognize them. Investors are cautioned not to assume that any part or all of mineral deposits in these categories will ever be converted into mineral reserves. Cautionary Note to Investors Concerning Estimates of Inferred Mineral Resources This document also uses the term “inferred mineral resources”. Investors are advised that while this term is recognized and required by Canadian regulations, the SEC does not recognize it. “Inferred mineral resources” have a great amount of uncertainty as to their existence, and great uncertainty as to their economic and legal feasibility. It cannot be assumed that all or any part of an inferred mineral resource will ever be upgraded to a higher category. Under Canadian rules, estimates of inferred mineral resources may not form the basis of feasibility or pre-feasibility studies, except in rare cases. Investors are cautioned not to assume that part or all of an inferred mineral resource exists, or is economically or legally mineable.
57

58
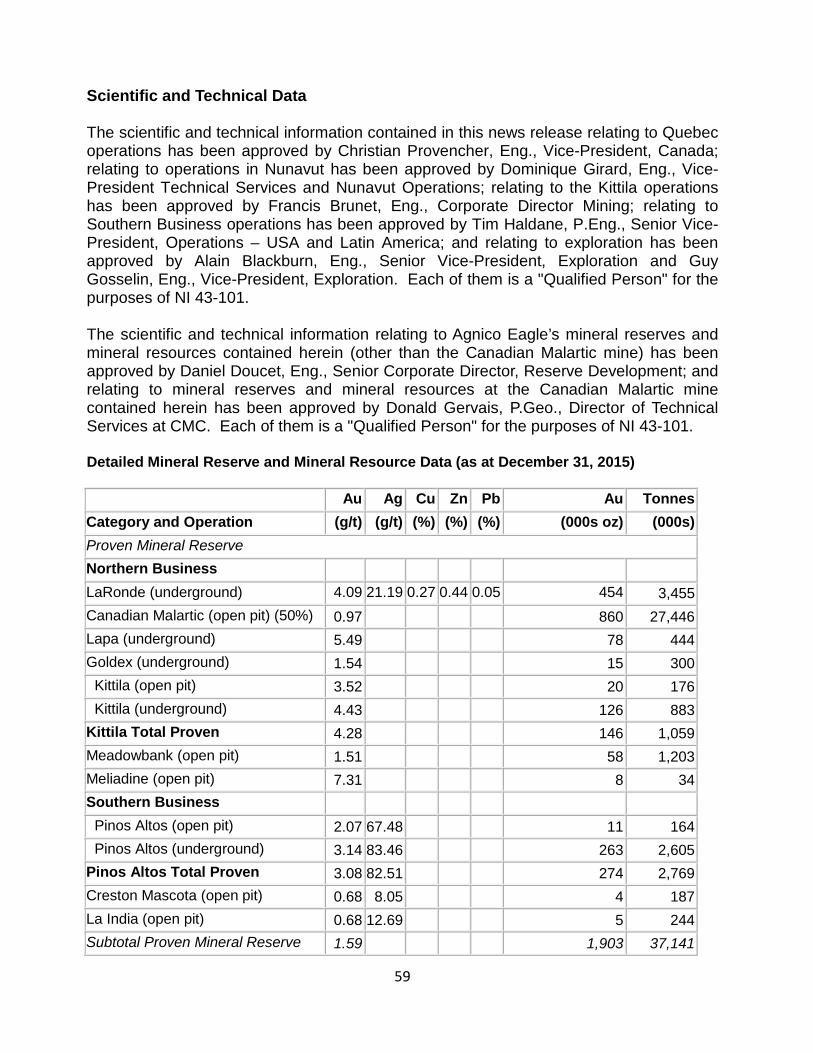
Scientific and Technical Data The scientific and technical information contained in this news release relating to Quebec operations has been approved by Christian Provencher, Eng., Vice-President, Canada; relating to operations in Nunavut has been approved by Dominique Girard, Eng., Vice-President Technical Services and Nunavut Operations; relating to the Kittila operations has been approved by Francis Brunet, Eng., Corporate Director Mining; relating to Southern Business operations has been approved by Tim Haldane, P.Eng., Senior Vice-President, Operations – USA and Latin America; and relating to exploration has been approved by Alain Blackburn, Eng., Senior Vice-President, Exploration and Guy Gosselin, Eng., Vice-President, Exploration. Each of them is a "Qualified Person" for the purposes of NI 43-101. The scientific and technical information relating to Agnico Eagle’s mineral reserves and mineral resources contained herein (other than the Canadian Malartic mine) has been approved by Daniel Doucet, Eng., Senior Corporate Director, Reserve Development; and relating to mineral reserves and mineral resources at the Canadian Malartic mine contained herein has been approved by Donald Gervais, P.Geo., Director of Technical Services at CMC. Each of them is a "Qualified Person" for the purposes of NI 43-101. Detailed Mineral Reserve and Mineral Resource Data (as at December 31, 2015) Au Ag Cu Zn Pb Au Tonnes Category and Operation (g/t) (g/t) (%) (%) (%) (000s oz) (000s) Proven Mineral Reserve Northern Business LaRonde (underground) 4.09 21.19 0.27 0.44 0.05 454 3,455 Canadian Malartic (open pit) (50%) 0.97 860 27,446 Lapa (underground) 5.49 78 444 Goldex (underground) 1.54 15 300 Kittila (open pit) 3.52 20 176 Kittila (underground) 4.43 126 883 Kittila Total Proven 4.28 146 1,059 Meadowbank (open pit) 1.51 58 1,203 Meliadine (open pit) 7.31 8 34 Southern Business Pinos Altos (open pit) 2.07 67.48 11 164 Pinos Altos (underground) 3.14 83.46 263 2,605 Pinos Altos Total Proven 3.08 82.51 274 2,769 Creston Mascota (open pit) 0.68 8.05 4 187 La India (open pit) 0.68 12.69 5 244 Subtotal Proven Mineral Reserve 1.59 1,903 37,141
59
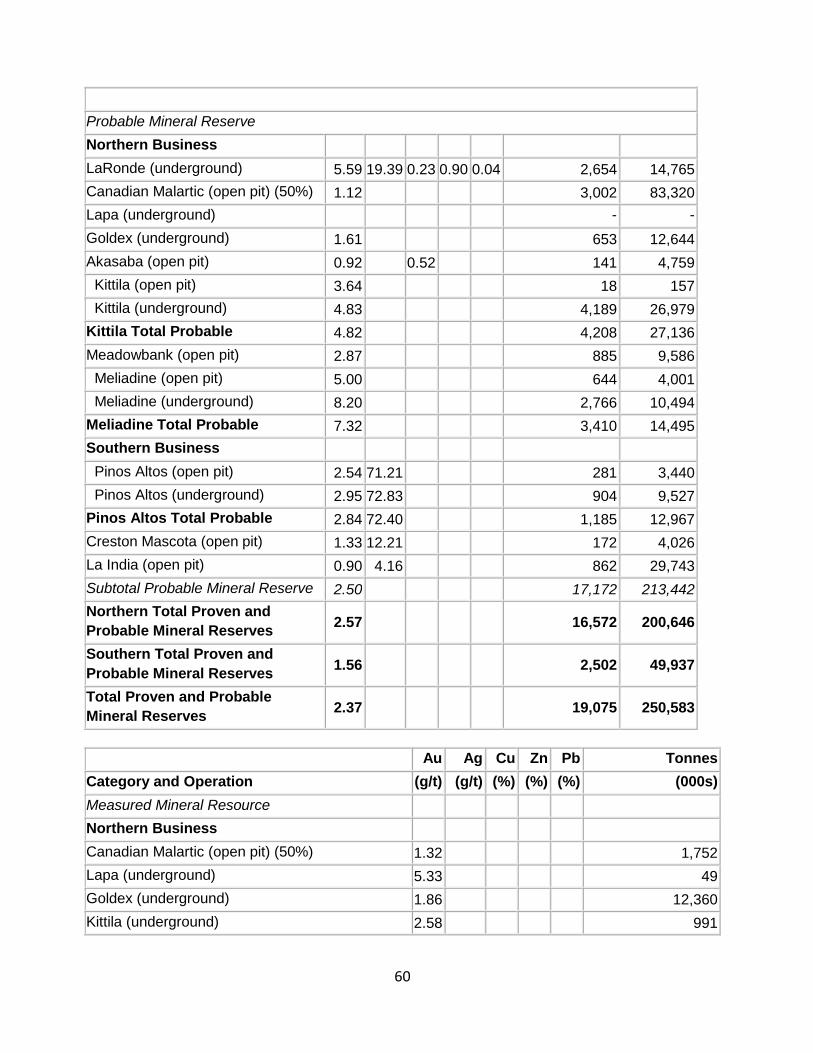
Probable Mineral Reserve Northern Business LaRonde (underground) 5.59 19.39 0.23 0.90 0.04 2,654 14,765 Canadian Malartic (open pit) (50%) 1.12 3,002 83,320 Lapa (underground) - - Goldex (underground) 1.61 653 12,644 Akasaba (open pit) 0.92 0.52 141 4,759 Kittila (open pit) 3.64 18 157 Kittila (underground) 4.83 4,189 26,979 Kittila Total Probable 4.82 4,208 27,136 Meadowbank (open pit) 2.87 885 9,586 Meliadine (open pit) 5.00 644 4,001 Meliadine (underground) 8.20 2,766 10,494 Meliadine Total Probable 7.32 3,410 14,495 Southern Business Pinos Altos (open pit) 2.54 71.21 281 3,440 Pinos Altos (underground) 2.95 72.83 904 9,527 Pinos Altos Total Probable 2.84 72.40 1,185 12,967 Creston Mascota (open pit) 1.33 12.21 172 4,026 La India (open pit) 0.90 4.16 862 29,743 Subtotal Probable Mineral Reserve 2.50 17,172 213,442 Northern Total Proven and Probable Mineral Reserves 2.57 16,572 200,646
Southern Total Proven and Probable Mineral Reserves 1.56 2,502 49,937
Total Proven and Probable Mineral Reserves 2.37 19,075 250,583
Au Ag Cu Zn Pb Tonnes Category and Operation (g/t) (g/t) (%) (%) (%) (000s) Measured Mineral Resource Northern Business Canadian Malartic (open pit) (50%) 1.32 1,752 Lapa (underground) 5.33 49 Goldex (underground) 1.86 12,360 Kittila (underground) 2.58 991
60

Meadowbank (open pit) 1.01 738 Hammond Reef (open pit) (50%) 0.70 82,831 Southern Business La India (open pit) 0.25 2.48 8,339 Subtotal Measured Mineral Resource 0.83 107,059 Indicated Mineral Resource Northern Business LaRonde (underground) 3.49 18.25 0.24 0.82 0.07 6,842 Canadian Malartic (open pit) (50%) 1.55 11,079 Lapa (underground) 4.21 1,086 Goldex (underground) 1.88 22,069 Akasaba 0.60 0.33 2,828 Kittila (open pit) 2.90 72 Kittila (underground) 3.05 14,863 Kittila Total Indicated 3.05 14,935 Meadowbank (open pit) 2.65 3,891 Meadowbank (underground) 4.85 2,341 Meadowbank Total Indicated 3.48 6,232 Meliadine (open pit) 4.24 7,867 Meliadine (underground) 5.38 12,911 Meliadine Total Indicated 4.95 20,778 Bousquet (underground) 2.47 11,380 Ellison (underground) 3.25 646 Hammond Reef (open pit) (50%) 0.57 21,377 AK (underground) (50%) 6.51 634 Upper Beaver (underground) (50%) 6.36 0.36 4,404 Swanson (open pit) 1.93 504 Southern Business Pinos Altos (open pit) 1.04 20.78 224 Pinos Altos (underground) 1.85 42.87 10,916 Pinos Altos Total Indicated 1.83 42.43 11,141 Creston Mascota (open pit) 0.51 5.14 4,264 La India (open pit) 0.38 0.55 61,950 Subtotal Indicated Mineral Resource 1.88 202,147 Northern Total Measured and Indicated Mineral Resources 1.88 223,513
Southern Total Measured and Indicated 0.56 85,693
61
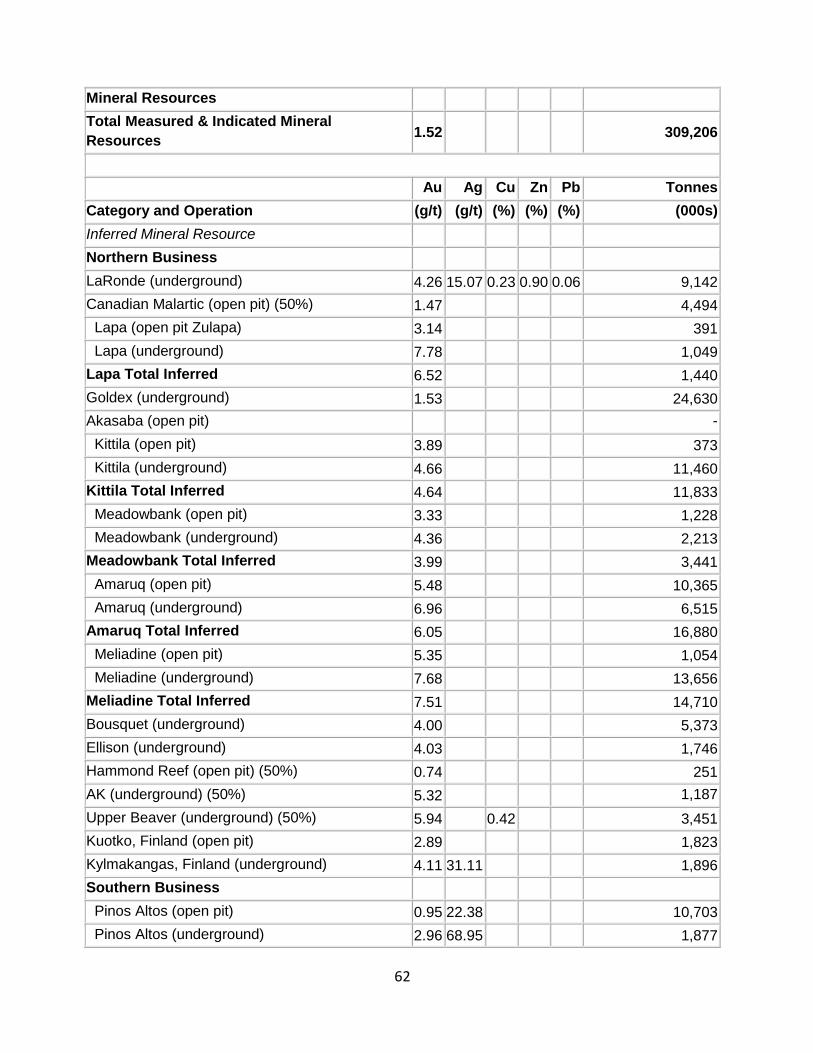
Mineral Resources Total Measured & Indicated Mineral Resources 1.52 309,206
Au Ag Cu Zn Pb Tonnes Category and Operation (g/t) (g/t) (%) (%) (%) (000s) Inferred Mineral Resource Northern Business LaRonde (underground) 4.26 15.07 0.23 0.90 0.06 9,142 Canadian Malartic (open pit) (50%) 1.47 4,494 Lapa (open pit Zulapa) 3.14 391 Lapa (underground) 7.78 1,049 Lapa Total Inferred 6.52 1,440 Goldex (underground) 1.53 24,630 Akasaba (open pit) - Kittila (open pit) 3.89 373 Kittila (underground) 4.66 11,460 Kittila Total Inferred 4.64 11,833 Meadowbank (open pit) 3.33 1,228 Meadowbank (underground) 4.36 2,213 Meadowbank Total Inferred 3.99 3,441 Amaruq (open pit) 5.48 10,365 Amaruq (underground) 6.96 6,515 Amaruq Total Inferred 6.05 16,880 Meliadine (open pit) 5.35 1,054 Meliadine (underground) 7.68 13,656 Meliadine Total Inferred 7.51 14,710 Bousquet (underground) 4.00 5,373 Ellison (underground) 4.03 1,746 Hammond Reef (open pit) (50%) 0.74 251 AK (underground) (50%) 5.32 1,187 Upper Beaver (underground) (50%) 5.94 0.42 3,451 Kuotko, Finland (open pit) 2.89 1,823 Kylmakangas, Finland (underground) 4.11 31.11 1,896 Southern Business Pinos Altos (open pit) 0.95 22.38 10,703 Pinos Altos (underground) 2.96 68.95 1,877
62
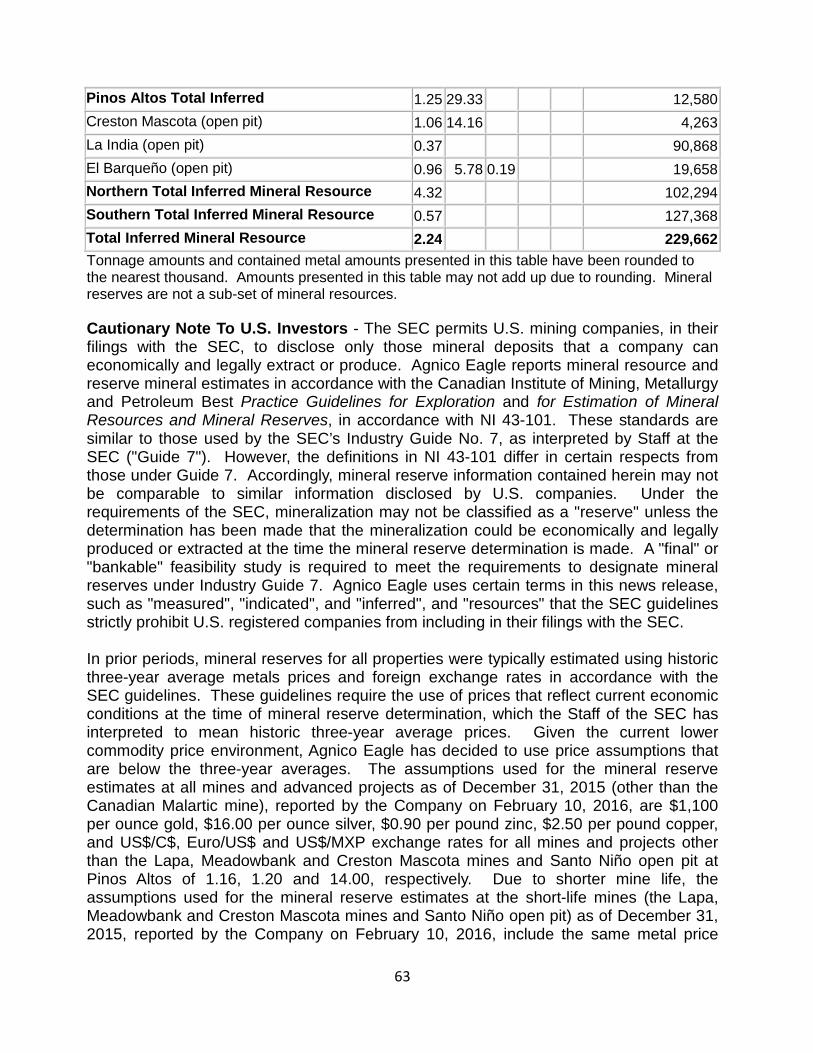
Pinos Altos Total Inferred 1.25 29.33 12,580 Creston Mascota (open pit) 1.06 14.16 4,263 La India (open pit) 0.37 90,868 El Barqueño (open pit) 0.96 5.78 0.19 19,658 Northern Total Inferred Mineral Resource 4.32 102,294 Southern Total Inferred Mineral Resource 0.57 127,368 Total Inferred Mineral Resource 2.24 229,662 Tonnage amounts and contained metal amounts presented in this table have been rounded to the nearest thousand. Amounts presented in this table may not add up due to rounding. Mineral reserves are not a sub-set of mineral resources. Cautionary Note To U.S. Investors - The SEC permits U.S. mining companies, in their filings with the SEC, to disclose only those mineral deposits that a company can economically and legally extract or produce. Agnico Eagle reports mineral resource and reserve mineral estimates in accordance with the Canadian Institute of Mining, Metallurgy and Petroleum Best Practice Guidelines for Exploration and for Estimation of Mineral Resources and Mineral Reserves, in accordance with NI 43-101. These standards are similar to those used by the SEC’s Industry Guide No. 7, as interpreted by Staff at the SEC ("Guide 7"). However, the definitions in NI 43-101 differ in certain respects from those under Guide 7. Accordingly, mineral reserve information contained herein may not be comparable to similar information disclosed by U.S. companies. Under the requirements of the SEC, mineralization may not be classified as a "reserve" unless the determination has been made that the mineralization could be economically and legally produced or extracted at the time the mineral reserve determination is made. A "final" or "bankable" feasibility study is required to meet the requirements to designate mineral reserves under Industry Guide 7. Agnico Eagle uses certain terms in this news release, such as "measured", "indicated", and "inferred", and "resources" that the SEC guidelines strictly prohibit U.S. registered companies from including in their filings with the SEC. In prior periods, mineral reserves for all properties were typically estimated using historic three-year average metals prices and foreign exchange rates in accordance with the SEC guidelines. These guidelines require the use of prices that reflect current economic conditions at the time of mineral reserve determination, which the Staff of the SEC has interpreted to mean historic three-year average prices. Given the current lower commodity price environment, Agnico Eagle has decided to use price assumptions that are below the three-year averages. The assumptions used for the mineral reserve estimates at all mines and advanced projects as of December 31, 2015 (other than the Canadian Malartic mine), reported by the Company on February 10, 2016, are $1,100 per ounce gold, $16.00 per ounce silver, $0.90 per pound zinc, $2.50 per pound copper, and US$/C$, Euro/US$ and US$/MXP exchange rates for all mines and projects other than the Lapa, Meadowbank and Creston Mascota mines and Santo Niño open pit at Pinos Altos of 1.16, 1.20 and 14.00, respectively. Due to shorter mine life, the assumptions used for the mineral reserve estimates at the short-life mines (the Lapa, Meadowbank and Creston Mascota mines and Santo Niño open pit) as of December 31, 2015, reported by the Company on February 10, 2016, include the same metal price
63

assumptions, and US$/C$ and US$/MXP exchange rates of 1.30 and 16.00, respectively. The assumptions used for the mineral reserves estimate at the Canadian Malartic mine as of December 31, 2015, reported by the Company on February 10, 2016, are $1,150 per ounce gold, a cut-off grade between 0.30 g/t and 0.33 g/t gold (depending on the deposit) and a US$/C$ exchange rate of 1.24. NI 43-101 requires mining companies to disclose mineral reserves and mineral resources using the subcategories of "proven mineral reserves”, "probable mineral reserves”, "measured mineral resources”, "indicated mineral resources” and "inferred mineral resources”. Mineral resources that are not mineral reserves do not have demonstrated economic viability. A mineral reserve is the economically mineable part of a measured and/or indicated mineral resource. It includes diluting materials and allowances for losses, which may occur when the material is mined or extracted and is defined by studies at pre-feasibility or feasibility level as appropriate that include application of modifying factors. Such studies demonstrate that, at the time of reporting, extraction could reasonably be justified. Modifying factors are considerations used to convert mineral resources to mineral reserves. These include, but are not restricted to, mining, processing, metallurgical, infrastructure, economic, marketing, legal, environmental, social and governmental factors. A proven mineral reserve is the economically mineable part of a measured mineral resource. A proven mineral reserve implies a high degree of confidence in the modifying factors. A probable mineral reserve is the economically mineable part of an indicated and, in some circumstances, a measured mineral resource. The confidence in the modifying factors applying to a probable mineral reserve is lower than that applying to a proven mineral reserve. A mineral resource is a concentration or occurrence of solid material of economic interest in or on the Earth's crust in such form, grade or quality and quantity that there are reasonable prospects for eventual economic extraction. The location, quantity, grade or quality, continuity and other geological characteristics of a mineral resource are known, estimated or interpreted from specific geological evidence and knowledge, including sampling. A measured mineral resource is that part of a mineral resource for which quantity, grade or quality, densities, shape and physical characteristics are estimated with confidence sufficient to allow the application of modifying factors to support detailed mine planning and final evaluation of the economic viability of the deposit. Geological evidence is derived from detailed and reliable exploration, sampling and testing and is sufficient to confirm geological and grade or quality continuity between points of observation. An indicated mineral resource is that part of a mineral resource for which quantity, grade or
64
quality, densities, shape and physical characteristics are estimated with sufficient confidence to allow the application of modifying factors in sufficient detail to support mine planning and evaluation of the economic viability of the deposit. Geological evidence is derived from adequately detailed and reliable exploration, sampling and testing and is sufficient to assume geological and grade or quality continuity between points of observation. An inferred mineral resource is that part of a mineral resource for which quantity and grade or quality are estimated on the basis of limited geological evidence and sampling. Geological evidence is sufficient to imply but not verify geological and grade or quality continuity. Investors are cautioned not to assume that part or all of an inferred mineral resource exists, or is economically or legally mineable. A feasibility study is a comprehensive technical and economic study of the selected development option for a mineral project that includes appropriately detailed assessments of applicable modifying factors together with any other relevant operational factors and detailed financial analysis that are necessary to demonstrate, at the time of reporting, that extraction is reasonably justified (economically mineable). The results of the study may reasonably serve as the basis for a final decision by a proponent or financial institution to proceed with, or finance, the development of the project. The confidence level of the study will be higher than that of a Pre-Feasibility Study.
65

The mineral reserves presented in this news release are separate from and not a portion of the mineral resources. Property/Project name and location
Date of most recent Technical Report (NI 43-101) filed on SEDAR
LaRonde, Bousquet & Ellison, Quebec, Canada
March 23, 2005
Canadian Malartic, Quebec, Canada June 16, 2014 Kittila, Kuotko and Kylmakangas, Finland
March 4, 2010
Meadowbank, Nunavut, Canada
February 15, 2012
Goldex, Quebec, Canada October 14, 2012 Lapa, Quebec, Canada June 8, 2006 Meliadine, Nunavut, Canada
February 11, 2015
Hammond Reef, Ontario, Canada July 2, 2013 Upper Beaver (Kirkland Lake project), Ontario, Canada
November 5, 2012
Pinos Altos and Creston Mascota, Mexico
March 25, 2009
La India, Mexico August 31, 2012
Additional information about each of the mineral projects that is required by NI 43-101, sections 3.2 and 3.3 and paragraphs 3.4 (a), (c) and (d) can be found in Technical Reports, which may be found at www.sedar.com. Other important operating information can be found in the Company's AIF and Form 40-F.
66
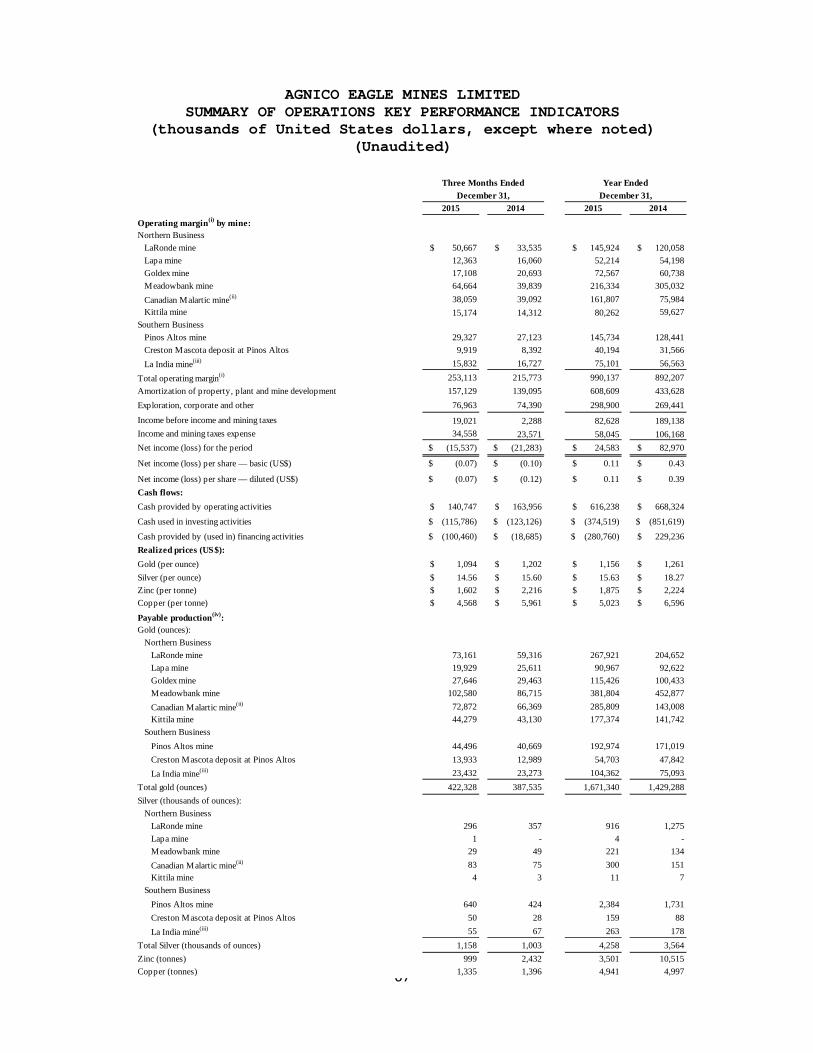
AGNICO EAGLE MINES LIMITED SUMMARY OF OPERATIONS KEY PERFORMANCE INDICATORS
(thousands of United States dollars, except where noted) (Unaudited)
67
2015 2014 2015 2014
Operating margin(i) by mine:Northern Business
LaRonde mine $ 50,667 $ 33,535 $ 145,924 $ 120,058 Lapa mine 12,363 16,060 52,214 54,198Goldex mine 17,108 20,693 72,567 60,738Meadowbank mine 64,664 39,839 216,334 305,032Canadian Malartic mine(ii) 38,059 39,092 161,807 75,984Kittila mine 15,174 14,312 80,262 59,627
Southern BusinessPinos Altos mine 29,327 27,123 145,734 128,441Creston Mascota deposit at Pinos Altos 9,919 8,392 40,194 31,566La India mine(iii) 15,832 16,727 75,101 56,563
Total operating margin(i) 253,113 215,773 990,137 892,207Amortization of property, plant and mine development 157,129 139,095 608,609 433,628Exploration, corporate and other 76,963 74,390 298,900 269,441
Income before income and mining taxes 19,021 2,288 82,628 189,138Income and mining taxes expense 34,558 23,571 58,045 106,168Net income (loss) for the period $ (15,537) $ (21,283) $ 24,583 $ 82,970
Net income (loss) per share — basic (US$) $ (0.07) $ (0.10) $ 0.11 $ 0.43
Net income (loss) per share — diluted (US$) $ (0.07) $ (0.12) $ 0.11 $ 0.39 Cash flows:Cash provided by operating activities $ 140,747 $ 163,956 $ 616,238 $ 668,324
Cash used in investing activities $ (115,786) $ (123,126) $ (374,519) $ (851,619)
Cash provided by (used in) financing activities $ (100,460) $ (18,685) $ (280,760) $ 229,236 Realized prices (US$):Gold (per ounce) $ 1,094 $ 1,202 $ 1,156 $ 1,261 Silver (per ounce) $ 14.56 $ 15.60 $ 15.63 $ 18.27 Zinc (per tonne) $ 1,602 $ 2,216 $ 1,875 $ 2,224 Copper (per tonne) $ 4,568 $ 5,961 $ 5,023 $ 6,596
Payable production(iv):Gold (ounces):
Northern BusinessLaRonde mine 73,161 59,316 267,921 204,652 Lapa mine 19,929 25,611 90,967 92,622 Goldex mine 27,646 29,463 115,426 100,433 Meadowbank mine 102,580 86,715 381,804 452,877 Canadian Malartic mine(ii) 72,872 66,369 285,809 143,008 Kittila mine 44,279 43,130 177,374 141,742
Southern BusinessPinos Altos mine 44,496 40,669 192,974 171,019 Creston Mascota deposit at Pinos Altos 13,933 12,989 54,703 47,842 La India mine(iii) 23,432 23,273 104,362 75,093
Total gold (ounces) 422,328 387,535 1,671,340 1,429,288Silver (thousands of ounces):
Northern BusinessLaRonde mine 296 357 916 1,275Lapa mine 1 - 4 - Meadowbank mine 29 49 221 134Canadian Malartic mine(ii) 83 75 300 151Kittila mine 4 3 11 7
Southern BusinessPinos Altos mine 640 424 2,384 1,731Creston Mascota deposit at Pinos Altos 50 28 159 88La India mine(iii) 55 67 263 178
Total Silver (thousands of ounces) 1,158 1,003 4,258 3,564 Zinc (tonnes) 999 2,432 3,501 10,515Copper (tonnes) 1,335 1,396 4,941 4,997
Three Months Ended Year EndedDecember 31, December 31,

Notes: (i) Operating margin is calculated as revenues from mining operations less production costs.
(ii) On June 16, 2014, Agnico Eagle and Yamana jointly acquired 100.0% of Osisko by way of a statutory plan of arrangement (the “Arrangement”). As a result of the Arrangement, Agnico Eagle and Yamana each indirectly own 50.0% of Osisko (now Canadian Malartic Corporation) and Canadian
Payable metal sold:Gold (ounces):
Northern BusinessLaRonde mine 65,067 56,844 254,529 202,338 Lapa mine 23,278 28,054 90,877 92,089Goldex mine 27,875 31,702 116,092 100,326 Meadowbank mine 103,667 87,741 385,757 452,023Canadian Malartic mine(ii)(v) 71,982 66,219 271,416 142,689 Kittila mine 43,499 42,609 178,936 139,766
Southern BusinessPinos Altos mine 41,418 45,457 186,580 176,468Creston Mascota deposit at Pinos Altos 14,997 12,940 55,844 46,698La India mine(iii) 25,366 24,019 105,050 72,941
Total gold (ounces) 417,149 395,585 1,645,081 1,425,338Silver (thousands of ounces):
Northern BusinessLaRonde mine 308 367 958 1,278 Meadowbank mine 32 49 225 133 Canadian Malartic mine(ii)(v) 98 68 285 140 Kittila mine 3 2 10 6
Southern BusinessPinos Altos mine 607 456 2,289 1,823 Creston Mascota deposit at Pinos Altos 49 34 156 84 La India mine(iii) 56 67 261 169
Total Silver (thousands of ounces): 1,153 1,043 4,184 3,633Zinc (tonnes) 949 2,468 3,596 10,535Copper (tonnes) 1,354 1,399 4,947 5,003
Total cash costs per ounce of gold produced - co-product basis (US$)(vi):Northern Business
LaRonde mine $ 668 $ 898 $ 760 $ 1,055 Lapa mine 622 609 591 667 Goldex mine 513 583 538 638 Meadowbank mine 530 766 623 604 Canadian Malartic mine(ii) 623 702 613 721 Kittila mine 748 810 710 846
Southern BusinessPinos Altos mine 623 755 578 718 Creston Mascota deposit at Pinos Altos 496 589 474 611 La India mine(iii) 518 541 475 532
Weighted average total cash costs per ounce of gold produced $ 604 $ 735 $ 626 $ 721
Total cash costs per ounce of gold produced - by-product basis (US$)(vi):Northern Business
LaRonde mine $ 510 $ 590 $ 590 $ 668 Lapa mine 620 607 590 667 Goldex mine 513 583 538 638 Meadowbank mine 526 757 613 599 Canadian Malartic mine(ii) 606 684 596 701 Kittila mine 747 809 709 845
Southern BusinessPinos Altos mine 417 597 387 533 Creston Mascota deposit at Pinos Altos 445 556 430 578 La India mine(iii) 485 496 436 487
Weighted average total cash costs per ounce of gold produced $ 547 $ 662 $ 567 $ 637
68

Malartic GP, which now holds the Canadian Malartic mine. The information set out in this table reflects the Company’s 50.0% interest in the Canadian Malartic mine since the date of acquisition.
(iii) The La India mine achieved commercial production on February 1, 2014. 3,492 ounces of payable gold production were excluded from the calculation of total cash costs per ounce produced in the year ended December 31, 2014 as they were produced prior to the achievement of commercial production.
(iv) Payable production (a non-GAAP non-financial performance measure) is the quantity of mineral produced during a period contained in products that are or will be sold by the Company, whether such products are sold during the period or held as inventories at the end of the period.
(v) The Canadian Malartic mine’s payable metal sold excludes the 5.0% net smelter royalty held by Osisko Gold Royalties Ltd.
(vi) Total cash costs per ounce of gold produced is not a recognized measure under IFRS and this data may not be comparable to data reported by other gold producers. Total cash costs per ounce of gold produced is reported on both a by-product basis (deducting by-product metal revenues from production costs) and co-product basis (before by-product metal revenues). Total cash costs per ounce of gold produced on a by-product basis is calculated by adjusting production costs as recorded in the consolidated statements of income (loss) for by-product metal revenues, unsold concentrate inventory production costs, smelting, refining and marketing charges and other adjustments, and then dividing by the number of ounces of gold produced. Total cash costs per ounce of gold produced on a co-product basis is calculated in the same manner as total cash costs per ounce of gold produced on a by-product basis except that no adjustment for by-product metal revenues is made. The calculation of total cash costs per ounce of gold produced on a co-product basis does not reflect a reduction in production costs or smelting, refining and marketing charges associated with the production and sale of by-product metals. The Company believes that these generally accepted industry measures provide a realistic indication of operating performance and provide useful comparison points between periods. Total cash costs per ounce of gold produced is intended to provide information about the cash generating capabilities of the Company’s mining operations. Management also uses these measures to monitor the performance of the Company’s mining operations. As market prices for gold are quoted on a per ounce basis, using the total cash costs per ounce of gold produced on a by-product basis measure allows management to assess a mine’s cash generating capabilities at various gold prices. Management is aware that these per ounce measures of performance can be affected by fluctuations in exchange rates and, in the case of total cash costs of gold produced on a by-product basis, by-product metal prices. Management compensates for these inherent limitations by using these measures in conjunction with minesite costs per tonne as well as other data prepared in accordance with IFRS. Management also performs sensitivity analyses in order to quantify the effects of fluctuating metal prices and exchange rates.
69
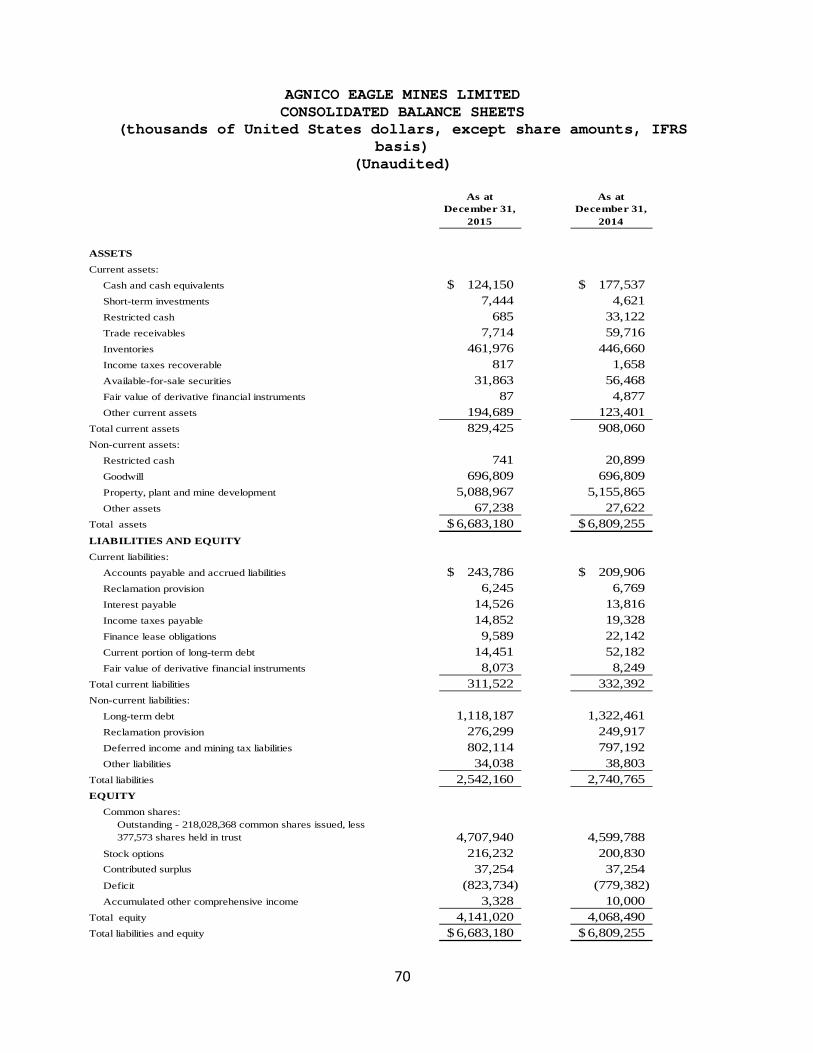
AGNICO EAGLE MINES LIMITED CONSOLIDATED BALANCE SHEETS
(thousands of United States dollars, except share amounts, IFRS basis)
(Unaudited)
As at December 31,
As at December 31,
2015 2014
ASSETS
Current assets:
Cash and cash equivalents 124,150$ 177,537$ Short-term investments 7,444 4,621 Restricted cash 685 33,122 Trade receivables 7,714 59,716 Inventories 461,976 446,660 Income taxes recoverable 817 1,658 Available-for-sale securities 31,863 56,468 Fair value of derivative financial instruments 87 4,877 Other current assets 194,689 123,401
Total current assets 829,425 908,060 Non-current assets:
Restricted cash 741 20,899 Goodwill 696,809 696,809 Property, plant and mine development 5,088,967 5,155,865 Other assets 67,238 27,622
Total assets 6,683,180$ 6,809,255$ LIABILITIES AND EQUITY
Current liabilities:
Accounts payable and accrued liabilities 243,786$ 209,906$ Reclamation provision 6,245 6,769 Interest payable 14,526 13,816 Income taxes payable 14,852 19,328 Finance lease obligations 9,589 22,142 Current portion of long-term debt 14,451 52,182 Fair value of derivative financial instruments 8,073 8,249
Total current liabilities 311,522 332,392 Non-current liabilities:
Long-term debt 1,118,187 1,322,461 Reclamation provision 276,299 249,917 Deferred income and mining tax liabilities 802,114 797,192 Other liabilities 34,038 38,803
Total liabilities 2,542,160 2,740,765 EQUITY
Common shares:Outstanding - 218,028,368 common shares issued, less 377,573 shares held in trust 4,707,940 4,599,788
Stock options 216,232 200,830 Contributed surplus 37,254 37,254 Deficit (823,734) (779,382) Accumulated other comprehensive income 3,328 10,000
Total equity 4,141,020 4,068,490 Total liabilities and equity 6,683,180$ 6,809,255$
70

AGNICO EAGLE MINES LIMITED CONSOLIDATED STATEMENTS OF INCOME (LOSS)
(thousands of United States dollars, except share amounts, IFRS basis)
(Unaudited)
2015 2014 2015 2014
REVENUESRevenues from mining operations 482,932$ 503,090$ 1,985,432$ 1,896,766$
COSTS, EXPENSES AND OTHER INCOMEProduction (i) 229,819 287,317 995,295 1,004,559 Exploration and corporate development 26,001 14,436 110,353 56,002 Amortization of property, plant and mine development 157,129 139,095 608,609 433,628 General and administrative 22,505 25,995 96,973 118,771 Impairment loss on available-for-sale securities 3,929 12,882 12,035 15,763 Finance costs 17,887 18,144 75,228 73,393 Loss on derivative financial instruments 3,318 2,512 19,608 6,156 Gain on sale of available-for-sale securities (1) (263) (24,600) (5,635) Environmental remediation 1,666 (949) 2,003 8,214 Foreign currency translation loss (gain) 1,281 6,951 (4,728) 3,781 Other expenses (income) 377 (5,318) 12,028 (7,004) Income before income and mining taxes 19,021 2,288 82,628 189,138 Income and mining taxes expense 34,558 23,571 58,045 106,168 Net income (loss) for the period (15,537)$ (21,283)$ 24,583$ 82,970$
Net income (loss) per share - basic (0.07)$ (0.10)$ 0.11$ 0.43$ Net income (loss) per share - diluted (0.07)$ (0.12)$ 0.11$ 0.39$
Weighted average number of common shares outstanding (in thousands):Basic 217,484 212,401 216,168 195,223 Diluted 217,484 213,273 217,101 196,202
Note:(i) Exclusive of amortization, which is shown separately.
Year EndedDecember 31,
Three Months Ended December 31,
71

AGNICO EAGLE MINES LIMITED
CONSOLIDATED STATEMENTS OF CASH FLOWS (thousands of United States dollars, IFRS basis)
(Unaudited)
2015 2014 2015 2014
OPERATING ACTIVITIESNet income (loss) for the period (15,537)$ (21,283)$ 24,583$ 82,970$ Add (deduct) items not affecting cash:
Amortization of property, plant and mine development 157,129 139,095 608,609 433,628 Deferred income and mining taxes (36,853) 10,869 6,550 37,058
(1) (263) (24,600) (5,635) Stock-based compensation 7,045 7,533 35,822 37,565 Impairment loss on available-for-sale securities 3,929 12,882 12,035 15,763 Foreign currency translation loss (gain) 1,281 6,951 (4,728) 3,781 Other (3,862) (3,541) 3,145 23,430
Adjustment for settlement of reclamation provision (533) (669) (1,385) (4,160) Changes in non-cash working capital balances:
Trade receivables (1,815) 2,012 52,019 17,237 Income taxes 64,315 5,783 (2,333) 30,771 Inventories 8,928 23,705 (40,547) (1,354) Other current assets (25,322) 1,102 (74,106) 787 Accounts payable and accrued liabilities (11,348) (13,101) 20,464 (3,391) Interest payable (6,609) (7,119) 710 (126)
Cash provided by operating activities 140,747 163,956 616,238 668,324
INVESTING ACTIVITIESAdditions to property, plant and mine development (132,958) (133,353) (449,758) (475,412) Acquisitions, net of cash and cash equivalents acquired - 3,477 (12,983) (400,032) Net (purchases) sales of short-term investments (1,300) 2,200 (2,823) (2,404) Net proceeds from sale of available-for-sale securities and warrants 40 4,057 61,075 44,692 Purchase of available-for-sale securities and warrants (382) - (19,815) (27,246) Decrease in restricted cash 18,814 493 49,785 8,783 Cash used in investing activities (115,786) (123,126) (374,519) (851,619)
FINANCING ACTIVITIESDividends paid (14,940) (14,606) (59,512) (54,065) Repayment of finance lease obligations (6,122) (7,087) (23,657) (21,453) Sale-leaseback financing - - - 1,027 Proceeds from long-term debt 111,000 50,000 436,000 1,010,000 Repayment of long-term debt (196,000) (49,410) (697,086) (724,050) Note issuance - - 50,000 - Long-term debt financing (196) - (1,689) (2,127) Repurchase of common shares for restricted share unit plan - - (11,899) (7,518) Proceeds on exercise of stock options 3,662 - 17,672 16,994 Common shares issued 2,136 2,418 9,411 10,428 Cash (used in) provided by financing activities (100,460) (18,685) (280,760) 229,236 Effect of exchange rate changes on cash and cash equivalents (2,315) (3,431) (14,346) (7,505) Net (decrease) increase in cash and cash equivalents during the period (77,814) 18,714 (53,387) 38,436 Cash and cash equivalents, beginning of period 201,964 158,823 177,537 139,101 Cash and cash equivalents, end of period 124,150$ 177,537$ 124,150$ 177,537$
SUPPLEMENTAL CASH FLOW INFORMATIONInterest paid 23,158$ 23,663$ 69,414$ 67,632$
Income and mining taxes paid 33,756$ 13,070$ 81,112$ 51,302$
Three Months Ended December 31,
Gain on sale of available-for-sale securities
Year Ended December 31,
72

AGNICO EAGLE MINES LIMITED RECONCILIATION OF NON-GAAP FINANCIAL PERFORMANCE MEASURES (thousands of United States dollars, except where noted)
(Unaudited)
Total Production Costs by MineThree Months Ended Three Months Ended Year Ended Year EndedDecember 31, 2015 December 31, 2014 December 31, 2015 December 31, 2014
(thousands of United States dollars)LaRonde mine 32,041$ 47,629$ 172,283$ 188,736$ Lapa mine 12,652 17,463 52,571 61,056 Goldex mine 13,378 17,350 61,278 64,836 Meadowbank mine 49,177 67,099 230,564 270,824 Canadian Malartic mine(i) 46,093 47,701 171,473 113,916 Kittila mine 32,203 36,546 126,095 116,893 Pinos Altos mine 24,351 32,690 105,175 123,342 Creston Mascota deposit at Pinos Altos 7,070 7,729 26,278 28,007 La India mine(ii) 12,854 13,110 49,578 36,949 Production costs per the consolidated statements of income (loss) 229,819$ 287,317$ 995,295$ 1,004,559$
Reconciliation of Production Costs to Total Cash Costs per Ounce of Gold Produced(iii) by Mine and Reconciliation of Production Costs to Minesite Costs per Tonne(iv) by Mine
LaRonde Mine - Total Cash Costs per Ounce of Gold Produced(iii)
Three Months Ended Three Months Ended Year Ended Year Ended(thousands of United States dollars, except as noted) December 31, 2015 December 31, 2014 December 31, 2015 December 31, 2014Production costs 32,041$ 47,629$ 172,283$ 188,736$ Adjustments:
Inventory and other adjustments(v ) 16,847 5,633 31,417 27,070 Cash operating costs (co-product basis) 48,888$ 53,262$ 203,700$ 215,806$
By-product metal revenues (11,553) (18,293) (45,678) (79,015) Cash operating costs (by-product basis) 37,335$ 34,969$ 158,022$ 136,791$ Gold production (ounces) 73,161 59,316 267,921 204,652 Total cash costs per ounce of gold produced ($ per ounce)(iii):
Co-product basis 668$ 898$ 760$ 1,055$ By-product basis 510$ 590$ 590$ 668$
LaRonde Mine - Minesite Costs per Tonne(iv )
Three Months Ended Three Months Ended Year Ended Year Ended(thousands of United States dollars, except as noted) December 31, 2015 December 31, 2014 December 31, 2015 December 31, 2014Production costs 32,041$ 47,629$ 172,283$ 188,736$ Inventory and other adjustments(v i) 2,316 (1,837) 2,582 (1,511) Minesite operating costs 34,357$ 45,792$ 174,865$ 187,225$ Minesite operating costs (thousands of C$) 53,119C$ 52,073C$ 222,799C$ 206,858C$ Tonnes of ore milled (thousands of tonnes) 563 538 2,241 2,085 Minesite costs per tonne (C$)(iv ) 94C$ 97C$ 99C$ 99C$
Lapa Mine - Total Cash Costs per Ounce of Gold Produced(iii)
Three Months Ended Three Months Ended Year Ended Year Ended(thousands of United States dollars, except as noted) December 31, 2015 December 31, 2014 December 31, 2015 December 31, 2014Production costs 12,652$ 17,463$ 52,571$ 61,056$ Adjustments:
Inventory and other adjustments(v ) (247) (1,858) 1,161 750 Cash operating costs (co-product basis) 12,405$ 15,605$ 53,732$ 61,806$
By-product metal revenues (42) (55) (62) (61) Cash operating costs (by-product basis) 12,363$ 15,550$ 53,670$ 61,745$ Gold production (ounces) 19,929 25,611 90,967 92,622 Total cash costs per ounce of gold produced ($ per ounce)(iii):
Co-product basis 622$ 609$ 591$ 667$ By-product basis 620$ 607$ 590$ 667$
Lapa Mine - Minesite Costs per Tonne(iv )
Three Months Ended Three Months Ended Year Ended Year Ended(thousands of United States dollars, except as noted) December 31, 2015 December 31, 2014 December 31, 2015 December 31, 2014Production costs 12,652$ 17,463$ 52,571$ 61,056$ Inventory and other adjustments(v i) (1,297) (1,999) (1,000) 545 Minesite operating costs 11,355$ 15,464$ 51,571$ 61,601$ Minesite operating costs (thousands of C$) 15,076C$ 17,636C$ 65,686C$ 68,128C$ Tonnes of ore milled (thousands of tonnes) 136 162 560 639 Minesite costs per tonne (C$)(iv ) 111C$ 109C$ 117C$ 107C$
Goldex Mine - Total Cash Costs per Ounce of Gold Produced(iii)
Three Months Ended Three Months Ended Year Ended Year Ended(thousands of United States dollars, except as noted) December 31, 2015 December 31, 2014 December 31, 2015 December 31, 2014Production costs 13,378$ 17,350$ 61,278$ 64,836$ Adjustments:
Inventory and other adjustments(v ) 812 (161) 878 (720) Cash operating costs (co-product basis) 14,190$ 17,189$ 62,156$ 64,116$
By-product metal revenues (8) (4) (23) (20) Cash operating costs (by-product basis) 14,182$ 17,185$ 62,133$ 64,096$ Gold production (ounces) 27,646 29,463 115,426 100,433 Total cash costs per ounce of gold produced ($ per ounce)(iii):
Co-product basis 513$ 583$ 538$ 638$ By-product basis 513$ 583$ 538$ 638$
73
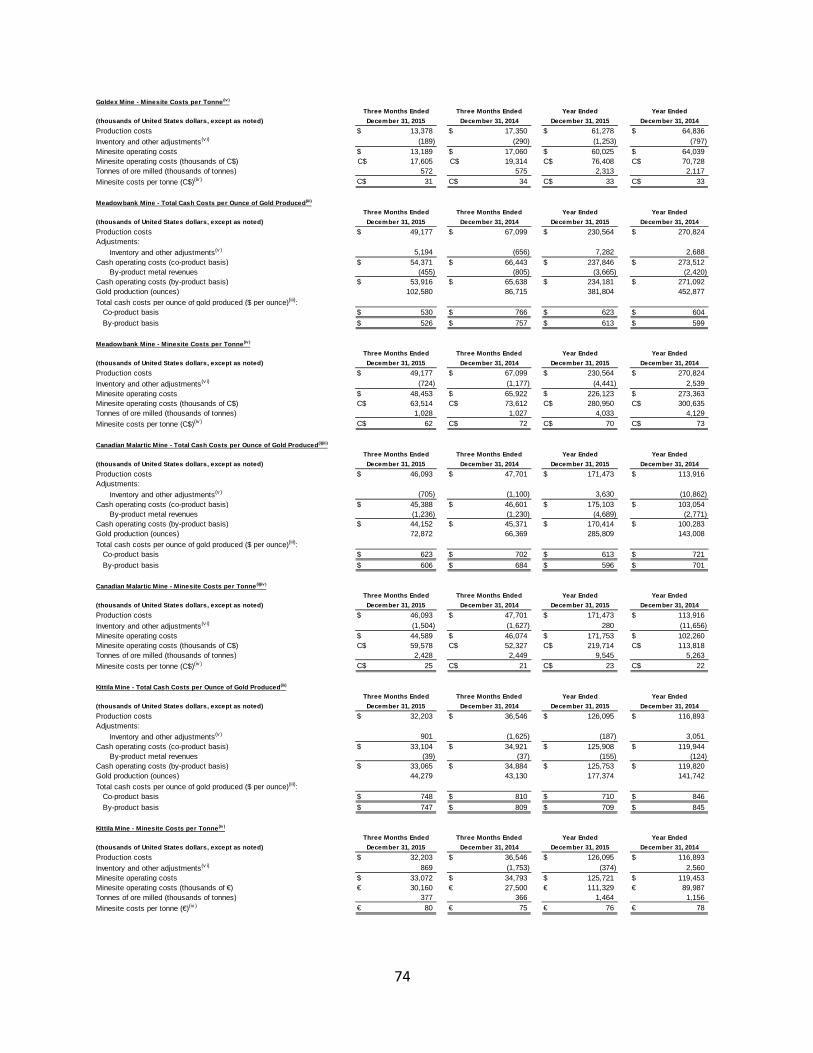
Goldex Mine - Minesite Costs per Tonne(iv )
Three Months Ended Three Months Ended Year Ended Year Ended(thousands of United States dollars, except as noted) December 31, 2015 December 31, 2014 December 31, 2015 December 31, 2014Production costs 13,378$ 17,350$ 61,278$ 64,836$ Inventory and other adjustments(v i) (189) (290) (1,253) (797) Minesite operating costs 13,189$ 17,060$ 60,025$ 64,039$ Minesite operating costs (thousands of C$) 17,605C$ 19,314C$ 76,408C$ 70,728C$ Tonnes of ore milled (thousands of tonnes) 572 575 2,313 2,117 Minesite costs per tonne (C$)(iv ) 31C$ 34C$ 33C$ 33C$
Meadowbank Mine - Total Cash Costs per Ounce of Gold Produced(iii)
Three Months Ended Three Months Ended Year Ended Year Ended(thousands of United States dollars, except as noted) December 31, 2015 December 31, 2014 December 31, 2015 December 31, 2014Production costs 49,177$ 67,099$ 230,564$ 270,824$ Adjustments:
Inventory and other adjustments(v ) 5,194 (656) 7,282 2,688 Cash operating costs (co-product basis) 54,371$ 66,443$ 237,846$ 273,512$
By-product metal revenues (455) (805) (3,665) (2,420) Cash operating costs (by-product basis) 53,916$ 65,638$ 234,181$ 271,092$ Gold production (ounces) 102,580 86,715 381,804 452,877 Total cash costs per ounce of gold produced ($ per ounce)(iii):
Co-product basis 530$ 766$ 623$ 604$ By-product basis 526$ 757$ 613$ 599$
Meadowbank Mine - Minesite Costs per Tonne(iv )
Three Months Ended Three Months Ended Year Ended Year Ended(thousands of United States dollars, except as noted) December 31, 2015 December 31, 2014 December 31, 2015 December 31, 2014Production costs 49,177$ 67,099$ 230,564$ 270,824$ Inventory and other adjustments(v i) (724) (1,177) (4,441) 2,539 Minesite operating costs 48,453$ 65,922$ 226,123$ 273,363$ Minesite operating costs (thousands of C$) 63,514C$ 73,612C$ 280,950C$ 300,635C$ Tonnes of ore milled (thousands of tonnes) 1,028 1,027 4,033 4,129 Minesite costs per tonne (C$)(iv ) 62C$ 72C$ 70C$ 73C$
Canadian Malartic Mine - Total Cash Costs per Ounce of Gold Produced(i)(iii)
Three Months Ended Three Months Ended Year Ended Year Ended(thousands of United States dollars, except as noted) December 31, 2015 December 31, 2014 December 31, 2015 December 31, 2014Production costs 46,093$ 47,701$ 171,473$ 113,916$ Adjustments:
Inventory and other adjustments(v ) (705) (1,100) 3,630 (10,862) Cash operating costs (co-product basis) 45,388$ 46,601$ 175,103$ 103,054$
By-product metal revenues (1,236) (1,230) (4,689) (2,771) Cash operating costs (by-product basis) 44,152$ 45,371$ 170,414$ 100,283$ Gold production (ounces) 72,872 66,369 285,809 143,008 Total cash costs per ounce of gold produced ($ per ounce)(iii):
Co-product basis 623$ 702$ 613$ 721$ By-product basis 606$ 684$ 596$ 701$
Canadian Malartic Mine - Minesite Costs per Tonne(i)(iv )
Three Months Ended Three Months Ended Year Ended Year Ended(thousands of United States dollars, except as noted) December 31, 2015 December 31, 2014 December 31, 2015 December 31, 2014Production costs 46,093$ 47,701$ 171,473$ 113,916$ Inventory and other adjustments(v i) (1,504) (1,627) 280 (11,656) Minesite operating costs 44,589$ 46,074$ 171,753$ 102,260$ Minesite operating costs (thousands of C$) 59,578C$ 52,327C$ 219,714C$ 113,818C$ Tonnes of ore milled (thousands of tonnes) 2,428 2,449 9,545 5,263 Minesite costs per tonne (C$)(iv ) 25C$ 21C$ 23C$ 22C$
Kittila Mine - Total Cash Costs per Ounce of Gold Produced(iii)
Three Months Ended Three Months Ended Year Ended Year Ended(thousands of United States dollars, except as noted) December 31, 2015 December 31, 2014 December 31, 2015 December 31, 2014Production costs 32,203$ 36,546$ 126,095$ 116,893$ Adjustments:
Inventory and other adjustments(v ) 901 (1,625) (187) 3,051 Cash operating costs (co-product basis) 33,104$ 34,921$ 125,908$ 119,944$
By-product metal revenues (39) (37) (155) (124) Cash operating costs (by-product basis) 33,065$ 34,884$ 125,753$ 119,820$ Gold production (ounces) 44,279 43,130 177,374 141,742 Total cash costs per ounce of gold produced ($ per ounce)(iii):
Co-product basis 748$ 810$ 710$ 846$ By-product basis 747$ 809$ 709$ 845$
Kittila Mine - Minesite Costs per Tonne(iv )
Three Months Ended Three Months Ended Year Ended Year Ended(thousands of United States dollars, except as noted) December 31, 2015 December 31, 2014 December 31, 2015 December 31, 2014Production costs 32,203$ 36,546$ 126,095$ 116,893$ Inventory and other adjustments(v i) 869 (1,753) (374) 2,560 Minesite operating costs 33,072$ 34,793$ 125,721$ 119,453$ Minesite operating costs (thousands of €) 30,160€ 27,500€ 111,329€ 89,987€ Tonnes of ore milled (thousands of tonnes) 377 366 1,464 1,156 Minesite costs per tonne (€)(iv ) 80€ 75€ 76€ 78€
74
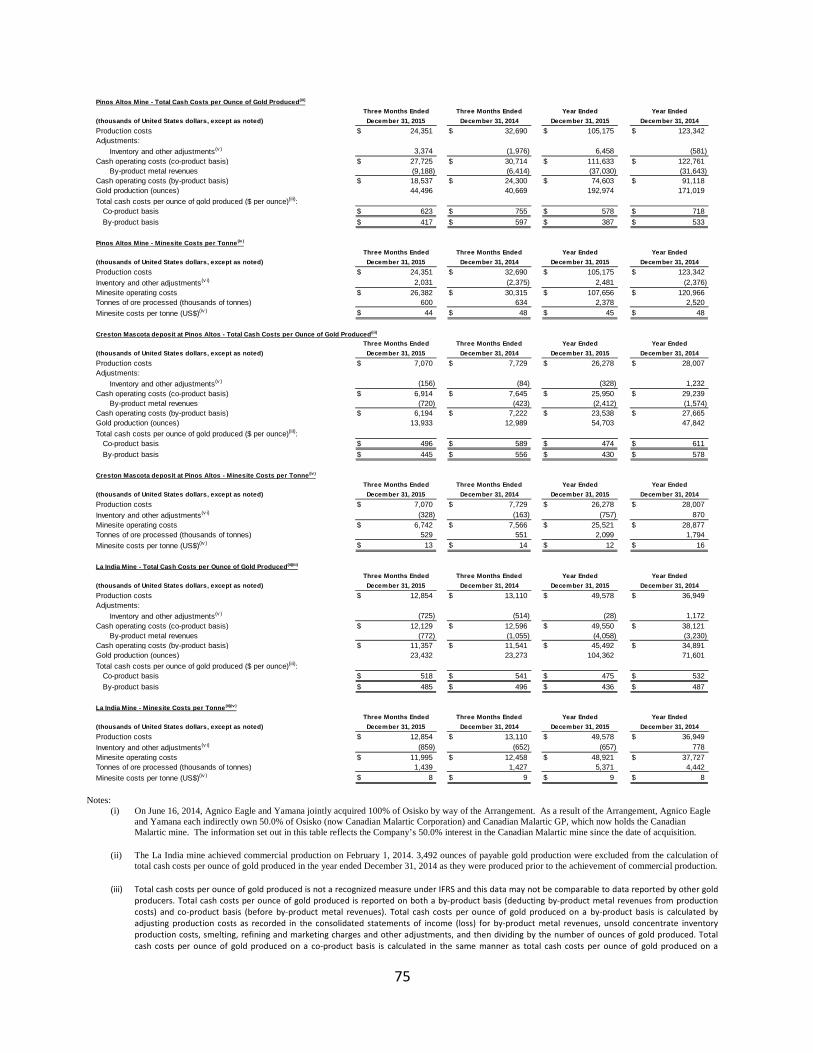
Notes:
(i) On June 16, 2014, Agnico Eagle and Yamana jointly acquired 100% of Osisko by way of the Arrangement. As a result of the Arrangement, Agnico Eagle and Yamana each indirectly own 50.0% of Osisko (now Canadian Malartic Corporation) and Canadian Malartic GP, which now holds the Canadian Malartic mine. The information set out in this table reflects the Company’s 50.0% interest in the Canadian Malartic mine since the date of acquisition.
(ii) The La India mine achieved commercial production on February 1, 2014. 3,492 ounces of payable gold production were excluded from the calculation of
total cash costs per ounce of gold produced in the year ended December 31, 2014 as they were produced prior to the achievement of commercial production.
(iii) Total cash costs per ounce of gold produced is not a recognized measure under IFRS and this data may not be comparable to data reported by other gold producers. Total cash costs per ounce of gold produced is reported on both a by-product basis (deducting by-product metal revenues from production costs) and co-product basis (before by-product metal revenues). Total cash costs per ounce of gold produced on a by-product basis is calculated by adjusting production costs as recorded in the consolidated statements of income (loss) for by-product metal revenues, unsold concentrate inventory production costs, smelting, refining and marketing charges and other adjustments, and then dividing by the number of ounces of gold produced. Total cash costs per ounce of gold produced on a co-product basis is calculated in the same manner as total cash costs per ounce of gold produced on a
Pinos Altos Mine - Total Cash Costs per Ounce of Gold Produced(iii)
Three Months Ended Three Months Ended Year Ended Year Ended(thousands of United States dollars, except as noted) December 31, 2015 December 31, 2014 December 31, 2015 December 31, 2014Production costs 24,351$ 32,690$ 105,175$ 123,342$ Adjustments:
Inventory and other adjustments(v ) 3,374 (1,976) 6,458 (581) Cash operating costs (co-product basis) 27,725$ 30,714$ 111,633$ 122,761$
By-product metal revenues (9,188) (6,414) (37,030) (31,643) Cash operating costs (by-product basis) 18,537$ 24,300$ 74,603$ 91,118$ Gold production (ounces) 44,496 40,669 192,974 171,019 Total cash costs per ounce of gold produced ($ per ounce)(iii):
Co-product basis 623$ 755$ 578$ 718$ By-product basis 417$ 597$ 387$ 533$
Pinos Altos Mine - Minesite Costs per Tonne(iv )
Three Months Ended Three Months Ended Year Ended Year Ended(thousands of United States dollars, except as noted) December 31, 2015 December 31, 2014 December 31, 2015 December 31, 2014Production costs 24,351$ 32,690$ 105,175$ 123,342$ Inventory and other adjustments(v i) 2,031 (2,375) 2,481 (2,376) Minesite operating costs 26,382$ 30,315$ 107,656$ 120,966$ Tonnes of ore processed (thousands of tonnes) 600 634 2,378 2,520 Minesite costs per tonne (US$)(iv ) 44$ 48$ 45$ 48$
Creston Mascota deposit at Pinos Altos - Total Cash Costs per Ounce of Gold Produced(iii)
Three Months Ended Three Months Ended Year Ended Year Ended(thousands of United States dollars, except as noted) December 31, 2015 December 31, 2014 December 31, 2015 December 31, 2014Production costs 7,070$ 7,729$ 26,278$ 28,007$ Adjustments:
Inventory and other adjustments(v ) (156) (84) (328) 1,232 Cash operating costs (co-product basis) 6,914$ 7,645$ 25,950$ 29,239$
By-product metal revenues (720) (423) (2,412) (1,574) Cash operating costs (by-product basis) 6,194$ 7,222$ 23,538$ 27,665$ Gold production (ounces) 13,933 12,989 54,703 47,842 Total cash costs per ounce of gold produced ($ per ounce)(iii):
Co-product basis 496$ 589$ 474$ 611$ By-product basis 445$ 556$ 430$ 578$
Creston Mascota deposit at Pinos Altos - Minesite Costs per Tonne(iv )
Three Months Ended Three Months Ended Year Ended Year Ended(thousands of United States dollars, except as noted) December 31, 2015 December 31, 2014 December 31, 2015 December 31, 2014Production costs 7,070$ 7,729$ 26,278$ 28,007$ Inventory and other adjustments(v i) (328) (163) (757) 870 Minesite operating costs 6,742$ 7,566$ 25,521$ 28,877$ Tonnes of ore processed (thousands of tonnes) 529 551 2,099 1,794 Minesite costs per tonne (US$)(iv ) 13$ 14$ 12$ 16$
La India Mine - Total Cash Costs per Ounce of Gold Produced(ii)(iii)
Three Months Ended Three Months Ended Year Ended Year Ended(thousands of United States dollars, except as noted) December 31, 2015 December 31, 2014 December 31, 2015 December 31, 2014Production costs 12,854$ 13,110$ 49,578$ 36,949$ Adjustments:
Inventory and other adjustments(v ) (725) (514) (28) 1,172 Cash operating costs (co-product basis) 12,129$ 12,596$ 49,550$ 38,121$
By-product metal revenues (772) (1,055) (4,058) (3,230) Cash operating costs (by-product basis) 11,357$ 11,541$ 45,492$ 34,891$ Gold production (ounces) 23,432 23,273 104,362 71,601 Total cash costs per ounce of gold produced ($ per ounce)(iii):
Co-product basis 518$ 541$ 475$ 532$ By-product basis 485$ 496$ 436$ 487$
La India Mine - Minesite Costs per Tonne(ii)(iv )
Three Months Ended Three Months Ended Year Ended Year Ended(thousands of United States dollars, except as noted) December 31, 2015 December 31, 2014 December 31, 2015 December 31, 2014Production costs 12,854$ 13,110$ 49,578$ 36,949$ Inventory and other adjustments(v i) (859) (652) (657) 778 Minesite operating costs 11,995$ 12,458$ 48,921$ 37,727$ Tonnes of ore processed (thousands of tonnes) 1,439 1,427 5,371 4,442 Minesite costs per tonne (US$)(iv ) 8$ 9$ 9$ 8$
75

by-product basis except that no adjustment for by-product metal revenues is made. The calculation of total cash costs per ounce of gold produced on a co-product basis does not reflect a reduction in production costs or smelting, refining and marketing charges associated with the production and sale of by-product metals. The Company believes that these generally accepted industry measures provide a realistic indication of operating performance and provide useful comparison points between periods. Total cash costs per ounce of gold produced is intended to provide information about the cash generating capabilities of the Company’s mining operations. Management also uses these measures to monitor the performance of the Company’s mining operations. As market prices for gold are quoted on a per ounce basis, using the total cash costs per ounce of gold produced on a by-product basis measure allows management to assess a mine’s cash generating capabilities at various gold prices. Management is aware that these per ounce measures of performance can be affected by fluctuations in exchange rates and, in the case of total cash costs of gold produced on a by-product basis, by-product metal prices. Management compensates for these inherent limitations by using these measures in conjunction with minesite costs per tonne (discussed below) as well as other data prepared in accordance with IFRS. Management also performs sensitivity analyses in order to quantify the effects of fluctuating metal prices and exchange rates.
(iv) Minesite costs per tonne is not a recognized measure under IFRS and this data may not be comparable to data reported by other gold producers. This measure is calculated by adjusting production costs as shown in the consolidated statements of income (loss) for unsold concentrate inventory production costs, and then dividing by tonnes of ore milled. As the total cash costs per ounce of gold produced measure can be affected by fluctuations in by-product metal prices and exchange rates, management believes that the minesite costs per tonne measure provides useful additional information regarding the performance of mining operations, eliminating the impact of varying production levels. Management also uses this measure to determine the economic viability of mining blocks. As each mining block is evaluated based on the net realizable value of each tonne mined, in order to be economically viable the estimated revenue on a per tonne basis must be in excess of the minesite costs per tonne. Management is aware that this per tonne measure of performance can be affected by fluctuations in processing levels and compensates for this inherent limitation by using this measure in conjunction with production costs prepared in accordance with IFRS.
(v) Under the Company’s revenue recognition policy, revenue is recognized on concentrates when legal title and risk is transferred. As total cash costs per ounce of gold produced are calculated on a production basis, an inventory adjustment is made to reflect the sales margin on the portion of concentrate production not yet recognized as revenue. Other adjustments include the addition of smelting, refining and marketing charges to production costs.
(vi) This inventory and other adjustment reflects production costs associated with unsold concentrates.
Notes:
(i) The La India mine achieved commercial production on February 1, 2014. 3,492 ounces of payable gold production were excluded from the calculation of total cash costs per ounce of gold produced for the year ended December 31, 2014 as they were produced prior to the achievement of commercial production.
(ii) Under the Company’s revenue recognition policy, revenue is recognized on concentrates when legal title and risk is transferred. As total cash costs per ounce of gold produced are calculated on a production basis, an inventory adjustment is made to reflect the sales margin on the portion of concentrate production not yet recognized as revenue. Other adjustments include the addition of smelting, refining and marketing charges to production costs.
(iii) Total cash costs per ounce of gold produced is not a recognized measure under IFRS and this data may not be comparable to data reported by other gold producers. Total cash costs per ounce of gold produced is reported on both a by-product basis (deducting by-product metal revenues from production costs) and co-product basis (before by-product metal revenues). Total cash costs per ounce of gold produced on a by-product basis is calculated by adjusting production costs as recorded in the consolidated statements of income (loss) for by-product metal revenues, unsold concentrate inventory production costs, smelting, refining and marketing charges and other adjustments, and then dividing by the number of ounces of gold produced. Total cash costs per ounce of gold produced on a co-product basis is calculated in the same manner as total cash costs per ounce of gold produced on a by-product basis except that no adjustment for by-product metal revenues is made. Accordingly, the calculation of total cash costs per ounce of gold produced on a co-product basis does not reflect a reduction in production costs or smelting, refining and marketing charges associated with the production and sale of by-product metals. The Company believes that these generally accepted industry measures provide a realistic indication of operating performance and provide useful comparison points between periods. Total cash costs per ounce of gold produced is intended to provide information about the cash generating capabilities of the Company’s mining operations. Management also uses these measures to monitor the performance of the Company’s mining operations. As market prices for gold are quoted on a per ounce basis, using the total cash costs per ounce of gold produced on a by-product basis measure allows management to assess a mine’s cash generating capabilities at various gold prices. Management is aware that these per ounce measures of performance can be affected by fluctuations in exchange rates and, in the case of total cash
Reconciliation of Production Costs to All-in Sustaining Costs per Ounce of Gold Produced
Three Months Ended Three Months Ended Year Ended Year Ended(United States dollars per ounce of gold produced, except where noted) December 31, 2015 December 31, 2014 December 31, 2015 December 31, 2014
229,819$ 287,317$ 995,295$ 1,004,559$ Adjusted gold production (ounces)(i) 422,328 387,535 1,671,340 1,425,796 Production costs per ounce of adjusted gold production(i) 544$ 741$ 596$ 705$ Adjustments:
Inventory and other adjustments(ii) 60 (6) 30 16 Total cash costs per ounce of gold produced (co-product basis)(iii) 604$ 735$ 626$ 721$
By-product metal revenues (57) (73) (59) (84) Total cash costs per ounce of gold produced (by-product basis)(iii) 547$ 662$ 567$ 637$ Adjustments:
Sustaining capital expenditures (including capitalized exploration) 214 240 183 230 General and administrative expenses (including stock options) 53 67 58 83 Non-cash reclamation provision and other 3 4 2 4
All-in sustaining costs per ounce of gold produced (by-product basis) 817$ 973$ 810$ 954$ By-product metal revenues 57 73 59 84
All-in sustaining costs per ounce of gold produced (co-product basis) 874$ 1,046$ 869$ 1,038$
Production costs per the consolidated statements of income (loss)(thousands of United States dollars)
76

costs of gold produced on a by-product basis, by-product metal prices. Management compensates for these inherent limitations by using these measures in conjunction with minesite costs per tonne as well as other data prepared in accordance with IFRS. Management also performs sensitivity analyses in order to quantify the effects of fluctuating metal prices and exchange rates.
77