Stock Symbol: AEM (NYSE and TSX) (416) 947-1212 …€¦ · 1 . Stock Symbol: AEM (NYSE and TSX)...
38
1 Stock Symbol: AEM (NYSE and TSX) For further information: Investor Relations (416) 947-1212 (All amounts expressed in U.S. dollars unless otherwise noted) AGNICO EAGLE REPORTS SECOND QUARTER 2016 OPERATING AND FINANICAL RESULTS; OPERATIONS CONTINUE TO DELIVER STRONG PERFORMANCE; POSITIVE GUIDANCE REVISION; FURTHER REDUCTION IN NET DEBT; AND DIVIDEND INCREASED BY 25% Toronto (July 27, 2016) – Agnico Eagle Mines Limited (NYSE:AEM, TSX:AEM) ("Agnico Eagle" or the “Company”) today reported quarterly net income of $19.0 million, or net income of $0.09 per share for the second quarter of 2016 (on an undiluted basis). This result includes a non-cash foreign currency translation loss on deferred tax liabilities of $7.0 million ($0.03 per share), various mark-to-market and other adjustment losses of $5.8 million ($0.03 per share), non-cash foreign currency translation losses of $5.5 million ($0.02 per share), non-cash stock option expense of $3.1 million ($0.01 per share), non-recurring gains of $4.4 million ($0.02 per share) and unrealized gains on financial instruments of $1.0 million (nil per share). Excluding these items would result in adjusted net income 1 of $35.0 million or $0.16 per share for the second quarter of 2016. In the second quarter of 2015, the Company reported net income of $10.1 million or net income of $0.05 per share. For the first six months of 2016, the Company reported net income of $46.8 million, or $0.21 per share. This compares with the first six months of 2015 when net income was $38.8 million, or $0.18 per share. Financial results in the 2016 period were positively affected by higher gold production and realized prices (approximately 2% and 3% higher, respectively) and higher by-product metals revenues. Second quarter 2016 cash provided by operating activities was $229.5 million ($192.7 million before changes in non-cash components of working capital). This compares to cash provided by operating activities of $188.3 million in the second quarter of 2015 ($152.8 million before changes in non-cash components of working capital). 1 Adjusted net income is a Non-GAAP measure. For a discussion regarding the Company’s use of non- GAAP measures, please see “Note Regarding Certain Measures of Performance”.
Transcript of Stock Symbol: AEM (NYSE and TSX) (416) 947-1212 …€¦ · 1 . Stock Symbol: AEM (NYSE and TSX)...
1
Stock Symbol: AEM (NYSE and TSX) For further information: Investor Relations
(416) 947-1212
(All amounts expressed in U.S. dollars unless otherwise noted) AGNICO EAGLE REPORTS SECOND QUARTER 2016 OPERATING AND FINANICAL
RESULTS; OPERATIONS CONTINUE TO DELIVER STRONG PERFORMANCE; POSITIVE GUIDANCE REVISION; FURTHER REDUCTION IN NET DEBT; AND
DIVIDEND INCREASED BY 25% Toronto (July 27, 2016) – Agnico Eagle Mines Limited (NYSE:AEM, TSX:AEM) ("Agnico Eagle" or the “Company”) today reported quarterly net income of $19.0 million, or net income of $0.09 per share for the second quarter of 2016 (on an undiluted basis). This result includes a non-cash foreign currency translation loss on deferred tax liabilities of $7.0 million ($0.03 per share), various mark-to-market and other adjustment losses of $5.8 million ($0.03 per share), non-cash foreign currency translation losses of $5.5 million ($0.02 per share), non-cash stock option expense of $3.1 million ($0.01 per share), non-recurring gains of $4.4 million ($0.02 per share) and unrealized gains on financial instruments of $1.0 million (nil per share). Excluding these items would result in adjusted net income1 of $35.0 million or $0.16 per share for the second quarter of 2016. In the second quarter of 2015, the Company reported net income of $10.1 million or net income of $0.05 per share. For the first six months of 2016, the Company reported net income of $46.8 million, or $0.21 per share. This compares with the first six months of 2015 when net income was $38.8 million, or $0.18 per share. Financial results in the 2016 period were positively affected by higher gold production and realized prices (approximately 2% and 3% higher, respectively) and higher by-product metals revenues. Second quarter 2016 cash provided by operating activities was $229.5 million ($192.7 million before changes in non-cash components of working capital). This compares to cash provided by operating activities of $188.3 million in the second quarter of 2015 ($152.8 million before changes in non-cash components of working capital).
1 Adjusted net income is a Non-GAAP measure. For a discussion regarding the Company’s use of non-GAAP measures, please see “Note Regarding Certain Measures of Performance”.
2
For the first six months of 2016, cash provided by operating activities was $375.2 million ($360.2 million before changes in non-cash components of working capital), as compared with the first half of 2015 when cash provided by operating activities was $331.8 million ($329.6 million before changes in non-cash components of working capital). The increase in cash provided by operating activities before changes in working capital during the second quarter 2016 and first six months of 2016 was mainly due to a combination of higher gold and by-product metals production, as described above. "The second quarter saw continued strong operating results from all of our mines coupled with record safety performance", said Sean Boyd, Agnico Eagle’s Chief Executive Officer. “Given these strong results and a more robust gold price environment, we have significantly improved our financial position, while continuing to make important investments in several of our growth projects. In addition, we have raised our dividend signaling our confidence in our business and growth plan", added Mr. Boyd. Second Quarter 2016 highlights include:
• Quarterly gold production – Payable gold production2 in the second quarter of 2016 was 408,932 ounces of gold at total cash costs3 per ounce on a by-product basis of $592 and all-in sustaining costs4 (“AISC”) on a by-product basis of $848 per ounce
2 Payable production of a mineral means the quantity of mineral produced during a period contained in products that are sold by the Company whether such products are shipped during the period or held as inventory at the end of the period. 3 Total cash costs per ounce is a Non-GAAP measure. For a reconciliation to production costs, see “Reconciliation of Non-GAAP Financial Performance Measures” below. Total cash costs per ounce of gold produced is presented on both a by-product basis (deducting by-product metal revenues from production costs) and co-product basis (before by-product metal revenues). Total cash costs per ounce of gold produced on a by-product basis is calculated by adjusting production costs as recorded in the consolidated statements of income (loss) for by-product revenues, unsold concentrate inventory production costs, smelting, refining and marketing charges and other adjustments, and then dividing by the number of ounces of gold produced. Total cash costs per ounce of gold produced on a co-product basis is calculated in the same manner as total cash costs per ounce of gold produced on a by-product basis except that no adjustment for by-product metal revenues is made. See also “Note Regarding Certain Measures of Performance”. For information about the Company’s total cash costs per ounce on a co-product basis please see “Reconciliation of Non-GAAP Performance Measures”. 4All-in-sustaining costs per ounce is a Non-GAAP measure and is used to show the full cost of gold production from current operations. For a reconciliation to production costs, see “Reconciliation of Non-GAAP Financial Performance Measures” below. The Company calculates all-in sustaining costs per ounce of gold produced as the aggregate of total cash costs per ounce on a by-product basis, sustaining capital expenditures (including capitalized exploration), general and administrative expenses (including stock option expense) and reclamation expenses divided by the number of ounces of gold produced. All-in sustaining costs per ounce of gold produced on a co-product basis is calculated in the same manner as all-in sustaining costs per ounce of gold produced on a by-product basis except that no adjustment for by-product metal revenues is made. For information about the Company’s AISC on a co-product basis please see “Reconciliation of Non-GAAP Performance Measures”. The Company's methodology for calculating all-in sustaining costs per ounce may not be similar to the methodology used by other producers that disclose all-in sustaining costs per ounce. See also "Note Regarding Certain Measures of
3
• 2016 production guidance increased and cost forecasts reduced – Expected
gold production for 2016 is now forecast to be approximately 1.58 to 1.6 million ounces (previously 1.565 million ounces) with total cash costs per ounce on a by-product basis of $580 to $620 (previously $590 to $630) and AISC of approximately $840 to $880 per ounce (previously $850 to $890)
• Investment grade balance sheet further enhanced – In the second quarter of 2016, the outstanding balance of $210 million was repaid under the Company’s credit facility, and C$20 million (reflecting the Company’s 50% interest) was repaid under the Canadian Malartic General Partnership’s (the “Partnership”) secured loan facility. Net debt was reduced by approximately $181 million, to $742 million, at June 30, 2016. For the seventh consecutive quarter, the Company has reduced net debt. The Company’s investment grade credit was re-confirmed by Dominion Bond Rating Service Ltd. (“DBRS”) with a stable trend
• Quarterly dividend increased by 25% - The Company has declared a $0.10 quarterly dividend. The previous quarterly dividend was $0.08
• Final permit received at the Meliadine Gold project - In May 2016, the Company received the Type A Water License, which is the final license necessary to commence construction activities
Second Quarter Financial and Production Highlights – Higher Gold Production, Lower Unit Costs
In the second quarter of 2016, strong operational performance continued at the Company's mines. Payable gold production in the second quarter of 2016 was 408,932 ounces compared to 403,678 ounces in the second quarter of 2015. The higher level of production in the 2016 period was primarily due to higher grades at LaRonde, increased throughput levels and higher grades at Goldex and increased throughput levels at Canadian Malartic. A detailed description of the production and cost performance of each mine is set out below. Total cash costs per ounce on a by-product basis for the second quarter of 2016 were lower at $592, as compared to $601 for the second quarter 2015. The reduction in total cash costs per ounce on a by-product basis in the second quarter of 2016 was a result of higher silver production, higher gold production at most of the Company’s mines and
Performance". The Company may change the methodology it uses to calculate all-in sustaining costs per ounce in the future, including in response to the adoption of formal industry guidance regarding this measure by the World Gold Council.
4
weaker local currencies in Canada and Mexico against the U.S. dollar compared to the second quarter of 2015. Payable gold production for the first half of 2016 was 820,268 ounces, compared to payable gold production of 807,888 ounces in the comparable 2015 period. For the first half of 2016, total cash costs per ounce on a by-product basis were $582, as compared to $595 for the first half of 2015. The lower costs in the 2016 period are due to the same reasons set out above. AISC on a by-product basis for the second quarter of 2016 were lower at $848 as compared to $864 per ounce for the second quarter 2015. The lower AISC on a by-product basis is primarily due to higher production, lower total cash costs per ounce on a by-product basis and timing of capital expenditures. For the first half of 2016, AISC on a by-product basis were $822 as compared to $835 per ounce for the 2015 period. The lower AISC on a by-product basis in the 2016 period are due to lower total cash costs per ounce on a by-product basis. Cash Position Remains Strong; Net Debt Reduced for Seventh Consecutive Quarter Cash and cash equivalents and short term investments increased to $473.7 million at June 30, 2016, from the March 31, 2016 balance of $168.0 million. The outstanding balance on the Company’s $1.2 billion credit facility was reduced from $210 million at March 31, 2016 to nil at June 30, 2016. This results in available credit lines of approximately $1.2 billion, not including the uncommitted $300 million accordion feature. In order to take advantage of historically low interest rates and improve term and liquidity, on June 30, 2016, the Company issued on a private placement basis an aggregate of $350 million of guaranteed senior unsecured notes due 2023, 2026 and 2028 (the “Notes”) with a weighted average maturity of 9.43 years and weighted average yield of 4.77%. Net proceeds from the sale of the Notes were used to reduce amounts outstanding under the Company’s credit facility and for general corporate purposes. During the quarter the Company’s investment grade credit was re-confirmed by DBRS with a stable trend. Total capital expenditures (including sustaining capital) made by the Company in the second quarter of 2016 were $131.6 million, including $28.2 million at Meliadine, $20.7 million at Goldex, $19.3 million at Canadian Malartic (50% basis), $18.8 million at Kittila, $15.4 million at LaRonde, $12.2 million at Pinos Altos, $10.6 million at Meadowbank, $3.3 million at La India and $2.2 million at Creston Mascota. Total capital expenditures (including sustaining capital) for the first six months of 2016 were $232.1 million, including $43.4 million at Meliadine, $35.9 million at Goldex, $33.0
5
million at Kittila, $29.8 million at Canadian Malartic (50% basis), $29.7 million at LaRonde, $28.2 million at Pinos Altos, $22.1 million at Meadowbank, $5.0 million at La India and $3.5 million at Creston Mascota. Total sustaining capital expenditures made by the Company in the second quarter of 2016 were $78.7 million, including $18.3 million at Canadian Malartic (50% basis), $15.8 million at Kittila, $15.4 million at LaRonde, $10.6 million at Meadowbank, $9.0 million at Pinos Altos, $4.1 million at Goldex, $3.3 million at La India and $2.2 million at Creston Mascota. Total sustaining capital expenditures for the first six months of 2016 were $145.1 million, including $29.7 million at LaRonde, $28.3 million at Canadian Malartic (50% basis), $27.5 million at Kittila, $22.1 million at Meadowbank, $19.8 million at Pinos Altos, $9.1 million at Goldex, $5.0 million at La India and $3.6 million at Creston Mascota. Total capital expenditures (including sustaining capital) in 2016 remain forecast at $491 million. Revised 2016 Guidance – Production Increased, Costs Lowered, Depreciation Decreased Production for 2016 is now forecast to be approximately 1.58 to 1.6 million ounces of gold (previously 1.565 million ounces) with total cash costs per ounce on a by-product basis of $580 to $620 (previously $590 to $630) and AISC of approximately $840 to $880 per ounce (previously $850 to $890). The Company expects depreciation and amortization expense to be in the range of $610 to $630 million. Previous guidance was $630 to $660 million. Second Quarter 2016 Results Conference Call and Webcast Tomorrow The Company's senior management will host a conference call on Thursday, July 28, 2016 at 10:00 AM (E.D.T.) to discuss financial results and provide an update of the Company’s operating activities. Via Webcast: A live audio webcast of the conference call will be available on the Company's website www.agnicoeagle.com. Via Telephone: For those preferring to listen by telephone, please dial 1-647-427-7450 or toll-free 1-888-231-8191. To ensure your participation, please call approximately ten minutes prior to the scheduled start of the call.

6
Replay Archive: Please dial 1-416-849-0833 or toll-free 1-855-859-2056, access code 38813014. The conference call replay will expire on August 25, 2016. The webcast, along with presentation slides, will be archived for 180 days on www.agnicoeagle.com.
7
NORTHERN BUSINESS OPERATING REVIEW
ABITIBI REGION, QUEBEC Agnico Eagle is currently Quebec’s largest gold producer with a 100% interest in three mines (LaRonde, Goldex and Lapa) and a 50% interest in the Canadian Malartic mine. These mines are located within 50 kilometres of each other, which provides operating synergies and allows for the sharing of technical expertise. LaRonde Mine – Higher Tonnage, Grades and Better Recoveries Drive Strong Production in the Second Quarter of 2016 The 100% owned LaRonde mine in northwestern Quebec achieved commercial production in 1988. The LaRonde mill processed an average of 6,241 tonnes per day (“tpd”) in the second quarter of 2016, compared with an average of 6,242 tpd in the corresponding period of 2015. Minesite costs per tonne5 were approximately C$106 in the second quarter of 2016, higher than the C$99 per tonne experienced in the second quarter of 2015. The increased costs in the 2016 period were primarily due to higher underground and mill maintenance costs compared to the prior-year period. In addition, costs in the 2015 period were lower than expected. For the first six months of 2016, the LaRonde mill processed an average of 6,295 tpd, compared to 6,223 tpd in the first six months of 2015. Minesite costs per tonne were approximately C$104, compared to C$101 per tonne in the first six months of 2015. Costs were higher in the 2016 period due to the reasons described above. LaRonde's total cash costs per ounce on a by-product basis were $543 in the second quarter of 2016 on payable production of 75,159 ounces of gold. This compares with the second quarter of 2015 when total cash costs per ounce on a by-product basis were $613 on payable production of 64,007 ounces of gold. Costs in the 2016 period were positively impacted by higher production driven by higher ore grades and favourable foreign exchange rates. In the first six months of 2016, LaRonde produced 150,496 ounces of gold at total cash costs per ounce on a by-product basis of $536. This is in contrast with the first six months of 2015 when the mine produced 122,900 ounces of gold at total cash costs per ounce on a by-product basis of $656. Costs were lower in the 2016 period due to the reasons outlined above.
5 Minesite costs per tonne is a non-GAAP measure. For a reconciliation of this measure to production costs as reported in the financial statements, see “Reconciliation of Non-GAAP Financial Performance Measures” below. See also “Note Regarding Certain Measures of Performance”.
8
Studies are continuing to assess the potential to extend the mineral reserve base and carry out mining activities between the 311 and 371 levels at LaRonde. At present, the mineral reserve base extends to the 311 level, which is 3.1 kilometres below the surface. An infill drill program is continuing from the 311 to the 371 levels with a focus on the western portion of the deposit. Infill drilling will also be carried out on the eastern portion of the deposit as underground development extends into that area. In the second quarter of 2016, site preparation activities continued at Bousquet Zone 5 on the Company’s adjoining Bousquet property. Previous property owners had partly exploited Bousquet Zone 5 using open pit and underground operations. The Company is evaluating the potential to mine Bousquet Zone 5 using underground ramp access. The mining method is likely to be similar to that employed at Goldex and processing could utilize excess capacity from the Lapa circuit at LaRonde. During the quarter, dewatering of the old pit was completed along with rehabilitation of the ramp portal and 92 metres of underground development was completed. A certificate of authorization was issued by the Quebec government to permit collection of a bulk sample. An internal technical study is expected to be completed by the end of 2016. Following the completion of technical studies and permitting, Bousquet Zone 5 could potentially be in production in the second half of 2018. Canadian Malartic Mine – Record Processing Rate Achieved in Second Quarter of 2016 In June 2014, Agnico Eagle and Yamana Gold Inc. ("Yamana") acquired all of the issued and outstanding common shares of Osisko Mining Corporation (“Osisko”) and created the Partnership that owns and operates the Canadian Malartic mine in northwestern Quebec through a joint management committee. Each of Agnico Eagle and Yamana has an indirect 50% ownership interest in the Partnership. During the second quarter of 2016, the Canadian Malartic mill (on a 100% basis) processed an average of 55,481 tpd, compared with an average of 50,705 tpd in the corresponding period of 2015. The record daily throughput in the 2016 period was primarily due to higher crusher availability, better crushing performance from the secondary crusher and better plant availability. Minesite costs per tonne in the second quarter of 2016 were approximately C$24 (C$20.50 excluding royalties) compared to the C$23 (C$19.71 excluding royalties) per tonne experienced in the second quarter of 2015. In the 2016 period costs were slightly higher primarily due to increased contractor use at both the mine and the mill and additional stripping costs which were not capitalized. The average stripping ratio in the second quarter of 2016 was 2.17 to 1.0 as compared to 2.64 to 1.0 in the prior period. For the first six months of 2016, the Canadian Malartic mill processed an average of 53,897 tpd, compared with an average of 51,343 tpd in the corresponding period of 2015. Minesite costs per tonne were approximately C$24 (C$20.87 excluding royalties)
9
compared to the C$23 (C$19.94 excluding royalties) per tonne in the first six months of 2016. Costs were higher due to the reasons outlined above. For the second quarter of 2016, Agnico Eagle’s 50% share of production at the Canadian Malartic mine was 72,502 ounces of gold at total cash costs per ounce on a by-product basis of $621. This compares with the second quarter of 2015 when total cash costs per ounce on a by-product basis were $609 on production of 68,441 ounces of gold. Costs in the 2016 period were higher due to a lower amount of stripping costs being capitalized compared to the 2015 period. In the first six months of 2016, Agnico Eagle’s 50% share of production at the Canadian Malartic mine was 146,115 ounces of gold at total cash costs per ounce on a by-product basis of $589. This compares with the first six months of 2015 when the mine produced 136,334 ounces of gold at total cash costs per ounce on a by-product basis of $621. Costs were lower in first six months of 2016 due to stronger cash cost performance in the first quarter 2016. Permitting activities for the Canadian Malartic pit extension and deviation of Highway 117 are continuing. As part of the Quebec environmental impact evaluation process, public hearings on the Canadian Malartic pit extension project took place on June 14 to 16 and July 12 and 13, 2016 in Malartic, Quebec. The Quebec Bureau des Audiences Publiques sur l’Environnement (BAPE) will now be reviewing the studies and documents submitted by the Partnership, information that was presented at the hearings and the written submissions received from intervenors. The BAPE is expected to issue its conclusions and recommendations on the acceptability of the project to the Quebec Minister of the Environment, Sustainable Development and Climate Change in October 2016. A decision from the Minister will then follow within the next several months. The Odyssey prospect lies on the east side of the Canadian Malartic property, approximately 1.5 kilometres east of the current limit of the Canadian Malartic open pit. In the second quarter of 2016, drilling was ongoing at Odyssey and a total of 57 holes (53,417 metres) were completed through June 30, 2016 by the Partnership. The Odyssey prospect is composed of multiple mineralized bodies spatially associated with a porphyritic intrusion close to the contact of the Pontiac Group sediments and the Piché Group of volcanic rocks. They are grouped into two elongated zones — the Odyssey North and Odyssey South zones — that strike east-southeast and dip steeply south. Odyssey North has been traced from a depth of 600 to 1,300 metres below surface along a strike length of approximately 1.5 kilometres. Odyssey South currently has a strike length of 0.5 kilometres, and has been located between approximately 200 and 550 metres below surface. Recent drilling has yielded significant intercepts such as 2.63 grams per tonne (“g/t”) gold (capped) over 33.5 metres estimated true width at 1,171 metres depth in drill hole ODY16-5039, showing similarities to the Goldex mine deposit. Additional details on the
10
2016 Odyssey drill program are reported in the Company’s exploration news release of July 27, 2016.
Lapa – Potential for Increased Production through Year End 2016 The 100% owned Lapa mine in northwestern Quebec achieved commercial production in May 2009. The Lapa circuit, located at the LaRonde mill, processed an average of 1,771 tpd in the second quarter of 2016. This compares with an average of 1,387 tpd in the second quarter of 2015. Throughput in the 2015 period was lower because of downtime related to the discovery of fatigue cracks in the feed head of the Lapa ball mill. Minesite costs per tonne were C$116 in the second quarter of 2016, compared to C$126 in the second quarter of 2015. Costs in the 2016 period were lower due to higher throughput compared to the same period in 2015. For the first six months of 2016, the Lapa mill processed an average of 1,767 tpd, compared to 1,538 tpd in the first six months of 2015. Minesite costs per tonne were approximately C$118, below the C$122 per tonne in the first six months of 2015 due to reasons explained above. Payable production in the second quarter of 2016 was 21,914 ounces of gold at total cash costs per ounce on a by-product basis of $658. This compares with the second quarter of 2015, when payable production was 19,450 ounces of gold at total cash costs per ounce on a by-product basis of $678. In the 2016 period, production was higher and costs were lower due to higher throughput levels and favourable foreign exchange rates. In the first six months of 2016, Lapa produced 43,623 ounces of gold at total cash costs per ounce on a by-product basis of $663. This compares to the first six months of 2015 when the mine produced 45,370 ounces of gold at total cash costs per ounce on a by-product basis of $615. The six month period in 2015 was positively affected by higher production and lower cash costs in the first quarter of 2015. At Lapa, 2016 is the last full year of production based on the current life of mine plan. Production was expected to show a gradual decline moving into the fourth quarter of this year with the full year expected to total 60,000 ounces of gold, as per February 2016 guidance. The Company is now evaluating a number of opportunities that could see production potentially extend through year end and exceed previous guidance. Goldex – Strong Underground Performance and Higher Grades Drive Increased Production and Lower Costs The 100% owned Goldex mine in northwestern Quebec began operation in 2008 but mining operations in the original orebody, the Goldex Extension Zone (“GEZ”), were suspended in October 2011 (see October 19, 2011 news release). In July 2012, the M and E satellite zones were approved for development. Mining operations resumed on the
11
M and E satellite zones in September 2013. Mining operations at GEZ remain suspended. The Goldex mill processed an average of 7,233 tpd in the second quarter of 2016. This compares with an average of 6,640 tpd in the second quarter of 2015. The higher throughput in the 2016 period was due to better underground hoisting performance and acceleration of the mining sequence compared to the 2015 period. Minesite costs per tonne were approximately C$32 in the second quarter of 2016, which was lower than the C$34 per tonne experienced in the second quarter of 2015. Costs in the 2016 period were lower primarily due to higher mill throughput levels and a higher proportion of rockfill to paste backfill during the period. For the first six months of 2016, the Goldex mill processed an average of 7,112 tpd, compared to 6,468 tpd in the first six months of 2015. Minesite costs per tonne were approximately C$33, slightly lower than the C$34 per tonne in the first six months of 2015. The lower costs in the 2016 period are due to the reasons set out above. Payable gold production in the second quarter of 2016 was 31,452 ounces of gold at total cash costs per ounce on a by-product basis of $513. This compares with the second quarter of 2015, when payable production was 26,462 ounces of gold at total cash costs per ounce on a by-product basis of $633. The decrease in total cash costs in the 2016 period was largely a result of increased production due to higher throughput, higher gold grades and favourable foreign exchange rates compared to the 2015 period. In the first six months of 2016, Goldex produced 63,792 ounces of gold at total cash costs per ounce on a by-product basis of $509. This compares to the first six months of 2015 when the mine produced 55,712 ounces of gold at total cash costs per ounce on a by-product basis of $585. The higher production and lower costs in the 2016 period are due to the same reasons as outlined above. Development of the Deep 1 Zone remains on time and on budget for startup in the first quarter of 2018. In the second quarter of 2016, the excavation of the second leg of the Rail-Veyor (conveyor system) ramp was completed and the initial components of the Rail-Veyor are now being installed. In January 2014, Agnico Eagle acquired the Akasaba West gold-copper deposit from Alexandria Minerals Corporation. Located less than 30 kilometres from Goldex, the Akasaba West deposit could potentially create flexibility and synergies for the Company's operations in the Abitibi region by using extra milling capacity at both Goldex and LaRonde, while reducing overall costs. The Akasaba West deposit currently hosts a mineral reserve of approximately 141,000 ounces of gold (4.8 million tonnes of ore grading 0.92 g/t gold and 0.52% copper). Permitting of the Akasaba project is progressing at both the provincial and federal levels. At the provincial level, following submission of the Environmental Impact Assessment (EIA) in August 2015, the Company responded to two series of questions
12
from the Quebec government agencies and ministries. Public consultation will also be scheduled. At the federal level, following submission of the EIA in September 2015, the Company received two sets of questions from federal agencies and ministries. Responses to the most recent set of questions will be submitted in August 2016. The federal environmental assessment agency will then proceed with a series of consultations with the public and the First Nations and is expected to potentially present its recommendations on the acceptability of the project to the Federal Minister of the Environment in the first half of 2017. In June 2016 the company purchased a property package of mining claims (approximately 840 hectares) adjacent to the Goldex mine from Wesdome Gold Mines Ltd for C$7.0 million. The acquisition was for exploration purposes. These claims, which are collectively referred to as Joubi, consist of three properties including the Joubi and Dubuisson Ouest properties and a portion of the Mine Ecole property. These properties cover the lateral and downdip extensions of the Goldex orebody. There are no mineral resources outlined on those properties. The transaction includes surface rights, infrastructure and certain equipment from the historical Joubi Mine. As part of the transaction, Agnico Eagle has granted to Wesdome a 2% net smelter royalty on the Mine Ecole property and a 3% net smelter royalty on the Joubi property. FINLAND AND SWEDEN Agnico Eagle’s Kittila mine in Finland is the largest primary gold producer in Europe, and hosts the Company’s largest mineral reserve base. Exploration activities continue to expand the mineral resource base and studies are underway to evaluate the potential to cost-effectively increase production. Kittila – Strong Mine and Mill Performance Continues; Optimization Studies Ongoing The 100% owned Kittila mine in northern Finland achieved commercial production in 2009. The Kittila mill processed an average of 4,274 tpd in the second quarter of 2016 compared to 4,170 tpd in the second quarter of 2015. The higher throughput in the 2016 period is a result of increased development leading to improved ore access and strong mining productivity. Minesite costs per tonne at Kittila were approximately €81 in the second quarter of 2016, compared to €75 in the second quarter of 2015. Costs increased in the second quarter of 2016 due to higher than expected maintenance costs associated with the scheduled
13
mill shutdown and increased contractor costs compared with the 2015 period. These costs more than offset the benefit of the increased throughput. For the first six months of 2016, the Kittila mill processed an average of 4,512 tpd, compared to 4,004 tpd in the first six months of 2015. Minesite costs per tonne were approximately €76 in the first six months of 2016, the same as in the comparable 2015 period as higher throughput was offset by higher operating costs, as described above. Second quarter 2016 payable gold production at Kittila was 46,209 ounces with total cash costs per ounce on a by-product basis of $756. In the second quarter of 2015, the mine produced 41,986 ounces at total cash costs per ounce on a by-product basis of $776. The higher production in the 2016 period is a result of higher throughput levels, gold grades and recoveries. Total cash costs per ounce decreased in the second quarter of 2016 primarily due to increased production. In the first six months of 2016, Kittila produced 94,336 ounces of gold at total cash costs per ounce on a by-product basis of $741. This compares with the first six months of 2015, when the mine produced 86,640 ounces of gold at total cash costs per ounce on a by-product basis of $727. Production was higher in the 2016 period primarily due to increased throughput. Costs were higher in the 2016 period primarily due to higher contractor costs compared to the 2015 period. The Kittila mine and mill have shown the ability to operate in excess of 4,000 tpd and efforts are ongoing to assess the optimal throughput rate. Studies are also underway to optimize underground mining rates and fully integrate the upper and lower Rimpi zones and the newly discovered Sisar Zone in a new Kittila mine plan. Unit costs are expected to improve once steady state operations are achieved. Drilling is ongoing to infill and extend the mineralization in the Sisar Zone. In addition, underground ramp construction began in March to access the upper portion of the Sisar Zone, which is located approximately 150 to 200 metres from existing underground infrastructure. During the second quarter of 2016, assay results were received from a number of drill holes. Significant results include: drill hole ROD16-700D that intersected 7.4 g/t gold (uncapped) over 9.6 metres estimated true width at 1,161 metres depth, and hole ROD16-700B that intersected 6.4 g/t gold (uncapped) over 6.5 metres estimated true width at 1,261 metres depth. Additional details on these holes are set out in the Company’s exploration news release of July 27, 2016. Barsele Project – Drilling Extends the Skirasen Zone In June 2015, Agnico Eagle acquired a 55% interest in the Barsele project in Vasterbotten County, northern Sweden, from Orex Minerals (Orex Minerals subsequently transferred its interest in the project to Barsele Minerals Corp.). The Company can earn an additional 15% interest in the project through the completion of a pre-feasibility study. Recent drilling at the Skiråsen Zone has extended the mineralization at depth and to the southeast. Highlights include hole SKI16-006 grading 1.31 g/t gold (capped) over an

14
estimated true width of 69.8 metres at 445 metres depth. This drill intercept is located roughly 850 metres southeast of the core of the Central Zone indicating that the current known mineralization could be part of a larger mineralized system. Additional details on these holes are set out in the Company’s exploration news release of July 27, 2016. NUNAVUT REGION Agnico Eagle has identified Nunavut as a politically attractive and stable jurisdiction with enormous geological potential. With the Company’s largest producing mine (Meadowbank), two significant development assets (Meliadine and Amaruq) and other exploration projects, Nunavut has the potential to be a strategic operating platform with the ability to generate strong production and cash flows over several decades. Meadowbank – Good Cost Performance Despite Lower Production Volumes in the Second Quarter of 2016 The 100% owned Meadowbank mine in Nunavut, northern Canada, achieved commercial production in March 2010. The Meadowbank mill processed an average of 10,918 tpd in the second quarter of 2016, compared to the 11,199 tpd achieved in the second quarter of 2015. Year-over-year, mill throughput levels were lower primarily due to harder ore being processed from the Vault pit. Minesite costs per tonne were approximately C$73 in the second quarter of 2016. These costs were lower than the C$74 per tonne in the second quarter of 2015. The lower costs per tonne in the 2016 period were primarily due to lower production costs (for drilling, blasting and fuel consumption) and an increase in deferred stripping compared to the 2015 period. For the first six months of 2016, the Meadowbank mill processed an average of 10,654 tpd, compared to 11,103 tpd in the first six months of 2015. Minesite costs per tonne were approximately C$75 in the first six months of 2016, which were higher than the C$73 per tonne in the comparable 2015 period. The higher costs per tonne were primarily due to lower throughput compared to the respective 2015 period. Payable production in the second quarter of 2016 was 72,402 ounces of gold at total cash costs per ounce on a by-product basis of $789. This compares with the second quarter of 2015 when 91,276 ounces were produced at total cash costs per ounce on a by-product basis of $688. The lower production and higher costs in the 2016 period compared to the 2015 period are primarily due to processing less tonnage at lower grades (down 18%) and lower recoveries. In the first six months of 2016, Meadowbank produced 144,713 ounces of gold at total cash costs per ounce on a by-product basis of $789. In the first six months of 2015 the mine produced 179,799 ounces of gold at total cash costs per ounce on a by-product
15
basis of $672. The lower production and higher costs in the 2016 period compared to the previous period are due to the reasons outlined above. Studies are ongoing to investigate additional opportunities to extend production at Meadowbank through year-end 2018. Potential opportunities include the development of the Phaser pit, which is located to the southwest of the Vault pit, and an additional pushback to access additional ore in the E3 pit at the Portage deposit. Amaruq Project – Exploration and Permitting Activities Progressing as Planned
Agnico Eagle has a 100% interest in the Amaruq project in Nunavut, northern Canada. The large property consists of 116,717 hectares of Inuit-owned and federal Crown land, located approximately 50 kilometres northwest of the Meadowbank mine. The Company is actively exploring the Amaruq deposit with the goal of potentially developing the deposit as a satellite operation to Meadowbank. During the quarter, exploration drilling continued at Amaruq. The goals of the 2016 exploration program were to infill and expand the known mineral resource areas and to test other favourable targets with a focus on identifying a second source of open pit ore. Drilling began at the end of January and continued through May based mainly on lake ice; the drilling since June has been land-based supported by helicopters. Exploration and conversion drilling to the end of June has totalled 77,517 metres (338 holes), using up to nine rigs, completing the initial 75,000-metre drill program. Almost half of this drilling was in the IVR deposit (36,545 metres, 152 holes), with 30% at Whale Tail (24,820 metres, 103 holes) and the rest at Mammoth (16,153 metres, 83 holes). In addition, there was 2,186 metres (nine holes) related to engineering studies (rock mechanics / geotechnical drilling and metallurgical testing) in this period. Exploration drilling has encountered a new vein structure in the V Zones, with results up to 15.5 g/t gold (capped) over 9.4 metres estimated true width at 18 metres depth in drill hole AMQ16-706. The V Zones have been shown to include multiple parallel structures. A recent lower intercept was 15.5 g/t gold (capped) over 5.4 metres estimated true width at 349 metres depth in drill hole AMQ16-833. The V Zones are being evaluated as a potential second source of open pit ore for Amaruq. Additional details from the 2016 Amaruq program are set out in the Company’s exploration news release of July 27, 2016. Construction of the Amaruq Exploration Access Road commenced in the first quarter of 2016. At the end of the second quarter of 2016, approximately 13.3 km of road had been completed. Construction is expected to resume this August with a focus on bridge installation. Completion of the 62 kilometre long road is expected by the end of 2017. An application for an amendment to the Amaruq Exploration Type B Water License was submitted on March 31, 2016 to allow for the development of an exploration ramp and the potential collection of a bulk sample. The permit approval process for the exploration ramp is expected to take approximately nine months.
16
In order to mine the Whale Tail deposit, a Project Certificate for this satellite pit must be obtained from the Nunavut Impact Review Board (the “NIRB”) along with an amendment of the existing Meadowbank Type A water license. A positive land use conformity determination was received from the Nunavut Planning Commission on June 17, 2016 for the Amaruq Whale Tail pit project confirming that the planned activity meets conformity with the existing land use plan. On June 30, 2016, the Company submitted an application and environmental impact statement for the Whale Tail satellite pit with both the NIRB and Nunavut Water Board. This application is currently undergoing screening by the NIRB which initiates the permitting process, a process that is expected to take place over a period of approximately two years. Meliadine Project – Final Permit Received May 2016; Optimization Studies Continuing The Meliadine gold project was acquired in July 2010 and is the Company’s largest development project based on mineral reserves and mineral resources. The Company has a 100% interest in the 111,757 hectare property, which is linked to the town of Rankin Inlet in Nunavut by a 25 kilometre all-weather access road. In March 2015, the Company completed an updated technical report on the Meliadine gold project. The updated technical report was based on extracting only the 3.3 million ounces of gold in proven and probable mineral reserves (13.9 million tonnes of ore at 7.44 g/t gold), which is all contained in the Tiriganiaq and Wesmeg deposits. The Meliadine property also hosts 3.3 million ounces of measured and indicated mineral resources (20.2 million tonnes at 5.06 g/t gold), and 3.5 million ounces of inferred mineral resources (14.1 million tonnes at 7.65 g/t gold). In addition, there are many other known gold occurrences in the 80 km long greenstone belt that require further evaluation. Internal studies are continuing to evaluate the potential to extract additional gold from the Tiriganiaq and Wesmeg/Normeg deposits, which could extend the potential mine life, increase annual production and improve project economics and the after-tax internal rate of return. These studies are expected to be completed by the end of 2016. In the second quarter of 2016, approximately 1,098 metres of underground development were completed. A total of approximately 4,302 metres of underground development is planned in 2016. On May 19, 2016, the Company received the Type A Water Licence, which is the final permit needed to commence construction activities. The timing of future capital expenditures at the Meliadine project beyond 2016 and the determination of whether to build a mine at Meliadine are subject to approval by Agnico Eagle's Board of Directors, which will be based on, among other things, prevailing market conditions and outcomes of the various plans being evaluated.
17
SOUTHERN BUSINESS OPERATING REVIEW Agnico Eagle’s Southern Business operations are focused in Mexico. These operations have been the source of growing precious metals production (gold and silver), stable operating costs and strong free cash flow since 2009. In the second quarter of 2016, the Mexican operations had new record quarterly silver production of approximately 788,000 ounces. Pinos Altos – Shaft Commissioning Continues, Ramp Up to Design Capacity Expected in Q3 2016 The 100% owned Pinos Altos mine in northern Mexico achieved commercial production in November 2009. The Pinos Altos mill processed 5,660 tpd in the second quarter of 2016, compared to 5,854 tpd in the second quarter of 2015. During the second quarter of 2016, approximately 90,000 tonnes of ore were stacked on the leach pad at Pinos Altos, compared to 114,800 tonnes in the comparable 2015 period. Minesite costs per tonne at Pinos Altos were $47 in the second quarter of 2016, which were higher than the $43 in the second quarter of 2015. The difference in minesite costs per tonne was largely attributable to variations in the proportion of heap leach ore to milled ore and open pit ore to underground ore, currency variations and routine fluctuations in the waste to ore stripping ratio in the open pit mines. For the first six months of 2016, the Pinos Altos mill processed an average of 5,297 tpd, compared to 5,758 tpd in the first six months of 2015. Approximately 143,200 tonnes of ore were stacked on the Pinos Altos leach pad during the first six months of 2016, compared to 189,200 tonnes in the prior year period. Minesite costs per tonne were approximately $48 compared to $45 per tonne in the first six months of 2015, with variance due to the proportion of heap leach to milled ore and the proportion of underground ore to open pit, variations in the proportion of waste to ore mined and variations in the currency exchange rate. Payable production in the second quarter of 2016 was 49,458 ounces of gold at total cash costs per ounce on a by-product basis of $348. This compares with payable production of 50,647 ounces at total cash costs per ounce on a by-product basis of $384 in the second quarter of 2015. Lower production in 2016 is largely due to lower throughput compared to the prior year period. The decrease in the year over year total cash costs per ounce is largely due to higher silver production and favourable foreign exchange rates compared to the prior year period. In the first six months of 2016, Pinos Altos produced 97,575 ounces of gold at total cash costs per ounce on a by-product basis of $346. This compares with the first six months of 2015 when the mine produced 100,753 ounces of gold at total cash costs per ounce on a by-product basis of $371. The decrease in cash costs for the first six months of 2016 is due to the reasons outlined above.
18
The Pinos Altos shaft project was completed and commissioned for hoisting in mid-June. Adjustments to ore-waste hoisting parameters and settings progressed through the second half of June. Ramp up to the design capacity will continue in July. The shaft completion will allow better matching of the mill capacity with the future mining capacity at Pinos Altos once the open pit mining operation begins to wind down as planned over the next several years. The Company continues to evaluate a number of regional opportunities. During the quarter, exploration drilling commenced at the Madrono prospect. Additional details from the Madrono drilling program are set out in the Company’s news release of July 27, 2016. Creston Mascota Deposit at Pinos Altos – Initial Madrono drilling Yields Positive Results The Creston Mascota deposit at Pinos Altos has been operating as a satellite operation to the Pinos Altos mine since late 2010. Approximately 573,000 tonnes of ore were stacked on the Creston Mascota leach pad during the second quarter of 2016, compared to approximately 608,500 tonnes stacked in the second quarter of 2015. In the 2016 period lower grades were stacked compared to the 2015 period. Minesite costs per tonne at Creston Mascota were $12 in the second quarter of 2016, compared to $11 in the second quarter of 2015. Costs in the 2016 period were slightly higher due to an increased stripping ratio and wet weather conditions related to the rainy season compared to the 2015 period. For the first six months of 2016, approximately 1,089,200 tonnes of ore were stacked on the Creston Mascota leach pad, compared to 1,135,500 tonnes in the prior year period. For the first six months of 2016, mine site costs per tonne at Creston Mascota were $12, compared to $11 per tonne in the first six months of 2015. Costs were higher in the 2016 period due to the reasons outlined above. Payable gold production at Creston Mascota in the second quarter of 2016 was 12,398 ounces at total cash costs per ounce on a by-product basis of $469. This compares to 15,606 ounces at total cash costs per ounce on a by-product basis of $402 during the second quarter of 2015. Production in the 2016 period was lower due to fewer tonnes stacked and lower grades compared to the 2015 period. Cash costs were higher in the 2016 period primarily due to higher minesite costs per tonne, and lower production partially offset by a favourable foreign exchange rate compared to the 2015 period. Payable gold production for the first six months of 2016 was 23,949 ounces at total cash costs per ounce on a by-product basis of $465. This compares to 28,054 ounces at total cash costs per ounce on a by-product basis of $421 in the first six months of 2015. The lower production and higher costs in the 2016 period are due to the reasons outlined above.
19
Infill drilling continues at Creston Mascota with several high grade intercepts encountered during the period suggesting potential for modest extension of the current mine life. During the first quarter of 2016, an agreement was signed that allows access to the 51-hectare Madrono property for exploration and mining. The Madrono property is located in an area with good access and infrastructure between the Company’s Pinos Altos and Creston Mascota operations and includes at least three gold-silver veins: Madrono, Santa Martha and La Curva. Previous mining in this area included small-scale bonanza production from underground mine development on three levels in the 1930s. In the second quarter of 2016, 12 drill holes totaling 2,978 metres were completed on preliminary target areas. Three of the first six holes drilled at Madrono encountered gold and silver mineralization with encouraging grades and widths. Highlights include: 4.1 g/t gold and 64.5 g/t silver (both grades uncapped) over 6.2 metres estimated true width at 45 metres depth in hole MAD16-005. Additional details are presented in the Company’s exploration news release of July 27, 2016. Permits were obtained in June 2016 to allow for the construction of an additional 75 exploration drill pads on the Madrono property. Further drilling is planned for Madrono through the balance of 2016. La India – Increased Gold and Silver Production Drive Lower costs The La India mine in Sonora, Mexico, located approximately 70 kilometres from the Company's Pinos Altos mine, was acquired in November 2011 through the purchase of Grayd Resources, which held a 56,000 hectare land position in the Mulatos Gold belt. Commissioning of the mine commenced ahead of schedule in the third quarter of 2013 and commercial production was declared as of February 1, 2014. Approximately 1,534,500 tonnes of ore were stacked on the La India leach pad during the second quarter of 2016, compared to approximately 1,359,500 tonnes stacked in the second quarter of 2015. Minesite costs per tonne at La India were $8 in the second quarter of 2016, compared to the $9 in the second quarter of 2015. The higher tonnage stacked in the 2016 period is a reflection of additional low-grade ore being encountered in areas previously thought to contain waste. The lower minesite costs reflect normal variations in the waste/ore stripping ratio. In the first six months of 2016, approximately 2,930,800 tonnes of ore were stacked on the La India leach pad, compared to approximately 2,738,000 stacked in the first six months of 2015. Minesite costs per tonne at La India were $8 in the first six months of 2016, compared to the $9 in the first six months of 2015. The increased tonnage stacked and lower costs in the 2016 period are due to the reasons outlined above. Payable gold production at La India in the second quarter of 2016 was 27,438 ounces at total cash costs per ounce on a by-product basis of $381. Payable production in the second quarter of 2015 was 25,803 ounces at total cash costs per ounce on a by-product basis of $410. Production was higher in the 2016 period due to higher tonnage stacked
20
and faster percolation rates from the new lifts on the phase 2 heap leach pad. Total cash costs in the 2016 period were positively impacted by slightly lower minesite costs per tonne, higher gold and silver production and favourable foreign exchange rates. For the first six months of 2016, La India produced 55,669 ounces of gold at total cash costs per ounce on a by-product basis of $371. This compares to 52,326 ounces at total cash costs per ounce on a by-product basis of $414 in the first six months of 2015. The increased production and lower costs are due to the reasons outlined above. Construction of the haul road to the Main Zone was completed during the second quarter of 2016. Mining activities on the Main Zone began in May 2016. During the quarter, several areas on the La India property were drill tested including the infill drilling at the Main Zone and exploration drilling at India East and El Cochi. Encouraging results were obtained from the Main Zone, which could have a positive impact on the year end mineral reserves and mineral resources at La India. At El Cochi, drilling on an outcropping area identified shallow oxidized mineralization and drilling will continue once the change of land use permit is obtained, which is expected in the second half of 2016. In late June 2016, the environmental permit for exploration at the El Realito area was obtained (permission for 40 drill pads), and drilling will be carried out later this year. On July 19, 2016, La India experienced an armed robbery. Employees at La India are safe and normal operations resumed later that same day. The Company is cooperating with federal, state and local authorities who are actively investigating the incident. The Company understands that all losses and damages will be covered by insurance. El Barqueno – Drilling Expands Known Deposits and Outlines New Mineralized Zones Agnico Eagle acquired its 100% interest in the El Barqueno project in November 2014 with the acquisition of Cayden Resources Inc. The 32,840-hectare property is in the Guachinango gold-silver mining district of Jalisco State in west-central, Mexico, approximately 150 kilometres west of the state capital of Guadalajara. The El Barqueno project contains a number of known mineralized zones and several prospects. As of December 31, 2015, the El Barqueno project had an inferred mineral resource of 19.7 million tonnes grading 0.96 g/t gold and 5.78 g/t silver (containing 608,000 ounces of gold and 3.7 million ounces of silver) at the Azteca-Zapoteca, Angostura and Peña de Oro zones. Year-to-date, 44,985 metres of drilling has been completed at El Barqueno in 2016. Drilling focused on expanding the known areas of mineralization (Angostura and Azteca-Zapoteca) and testing new target areas (Olmeca and Pena Blanca). Significant high-grade intercepts are reported at the new Olmeca prospect, which has been traced over 700 metres of strike length. Results from Olmeca include up to 4.5 g/t gold (capped) and 4.7 g/t silver (uncapped) over 11.0 metres estimated true width at 85 metres depth in drill
21
hole OLM16-010, and 9.4 g/t gold (capped) and 14.1 g/t silver (uncapped) over 5.1 metres estimated true width at 67 metres depth in drill hole in OLM16-003. Additional details on the El Barqueno drilling are set out in the Company’s exploration news release of July 27, 2016. In addition to the drilling activities, studies are underway to evaluate possible development scenarios for the project. It is currently envisioned that the project’s gold-silver deposits could potentially be developed into a series of open pits utilizing heap leach processing, similar to the Creston Mascota deposit at Pinos Altos and the La India mines. Dividend Record and Payment Dates for the Third Quarter of 2016 Agnico Eagle's Board of Directors has declared a quarterly cash dividend of $0.10 per common share, payable on September 15, 2016 to shareholders of record as of September 1, 2016. Agnico Eagle has declared a cash dividend every year since 1983. Other Expected Dividend and Record Dates for 2016 Record Date Payment Date December 1 December 15 Dividend Reinvestment Plan Please follow the link below for information on the Company's dividend reinvestment program. Dividend Reinvestment Plan About Agnico Eagle Agnico Eagle is a senior Canadian gold mining company that has produced precious metals since 1957. Its eight mines are located in Canada, Finland and Mexico, with exploration and development activities in each of these countries as well as in the United States and Sweden. The Company and its shareholders have full exposure to gold prices due to its long-standing policy of no forward gold sales. Agnico Eagle has declared a cash dividend every year since 1983. Further Information For further information regarding Agnico Eagle, contact Investor Relations at [email protected] or call (416) 947-1212. Note Regarding Certain Measures of Performance
This news release discloses certain measures, including “total cash costs per ounce”, “all-in sustaining costs per ounce”, “minesite costs per tonne” and “adjusted net income” that are not standardized measures under IFRS. These data may not be comparable to
22
data reported by other issuers. For a reconciliation of these measures to the most directly comparable financial information reported in the consolidated financial statements prepared in accordance with IFRS, other than adjusted net income, see “Reconciliation of Non-GAAP Financial Performance Measures” below. The total cash costs per ounce of gold produced is reported on both a by-product basis (deducting by-product metal revenues from production costs) and co-product basis (before by-product metal revenues). The total cash costs per ounce of gold produced on a by-product basis is calculated by adjusting production costs as recorded in the consolidated statements of income for by-product revenues, unsold concentrate inventory production costs, smelting, refining and marketing charges and other adjustments, and then dividing by the number of ounces of gold produced. The total cash costs per ounce of gold produced on a co-product basis is calculated in the same manner as the total cash costs per ounce of gold produced on a by-product basis except that no adjustment is made for by-product metal revenues. Accordingly, the calculation of total cash costs per ounce of gold produced on a co-product basis does not reflect a reduction in production costs or smelting, refining and marketing charges associated with the production and sale of by-product metals. The total cash costs per ounce of gold produced is intended to provide information about the cash-generating capabilities of the Company’s mining operations. Management also uses these measures to monitor the performance of the Company’s mining operations. As market prices for gold are quoted on a per ounce basis, using the total cash costs per ounce of gold produced on a by-product basis measure allows management to assess a mine’s cash-generating capabilities at various gold prices. All-in sustaining costs per ounce is used to show the full cost of gold production from current operations. The Company calculates all-in sustaining costs per ounce of gold produced on a by-product basis as the aggregate of total cash costs per ounce on a by-product basis, sustaining capital expenditures (including capitalized exploration), general and administrative expenses (including stock options) and reclamation expenses divided by the number of ounces of gold produced. The all-in sustaining costs per ounce of gold produced on a co-product basis is calculated in the same manner as the all-in sustaining costs per ounce of gold produced on a by-product basis, except that the total cash costs per ounce on a co-product basis is used, meaning no adjustment is made for by-product metal revenues. The Company's methodology for calculating all-in sustaining costs per ounce may differ from to the methodology used by other producers that disclose all-in sustaining costs per ounce. The Company may change the methodology it uses to calculate all-in sustaining costs per ounce in the future, including in response to the adoption of formal industry guidance regarding this measure by the World Gold Council. Management is aware that these per ounce measures of performance can be affected by fluctuations in exchange rates and, in the case of total cash costs per ounce of gold produced on a by-product basis, by-product metal prices. Management compensates for these inherent limitations by using these measures in conjunction with minesite costs per tonne (discussed below) as well as other data prepared in accordance with IFRS. Management uses adjusted net income to evaluate the underlying operating performance of the Company and to assist with the planning and forecasting of future operating results. Management believes that adjusted net income is a useful measure of performance because foreign currency translation gains and losses, mark-to-market adjustments, non-recurring gains and losses, stock option expense and unrealized gains
23
and losses on financial instruments do not reflect the underlying operating performance of the Company and may not be indicative of future operating results.
Management also performs sensitivity analyses in order to quantify the effects of fluctuating exchange rates and metal prices. This news release also contains information as to estimated future total cash costs per ounce, all-in sustaining costs per ounce and minesite costs per tonne. The estimates are based upon the total cash costs per ounce, all-in sustaining costs per ounce and minesite costs per tonne that the Company expects to incur to mine gold at its mines and projects and, consistent with the reconciliation of these actual costs referred to above, do not include production costs attributable to accretion expense and other asset retirement costs, which will vary over time as each project is developed and mined. It is therefore not practicable to reconcile these forward-looking non-GAAP financial measures to the most comparable IFRS measure.
Forward-Looking Statements
The information in this news release has been prepared as at July 27, 2016. Certain statements contained in this news release constitute “forward-looking statements” within the meaning of the United States Private Securities Litigation Reform Act of 1995 and “forward-looking information” under the provisions of Canadian provincial securities laws and are referred to herein as “forward-looking statements”. When used in this news release, the words “anticipate”, “could”, “estimate”, “expect”, “forecast”, “plan”, “potential”, “will” and similar expressions are intended to identify forward-looking statements. Such statements include, without limitation: the Company's forward-looking production guidance, including estimated ore grades, project timelines, drilling results, metal production, life of mine estimates, production, total cash costs per ounce, all-in sustaining costs per ounce, minesite costs per tonne, other expenses and cash flows; the estimated timing and conclusions of technical reports and other studies; the methods by which ore will be extracted or processed; statements concerning expansion projects, recovery rates, mill throughput, optimization and projected exploration expenditures, including costs and other estimates upon which such projections are based; statements regarding timing and amounts of capital expenditures and other assumptions; estimates of future mineral reserves, mineral resources, mineral production, optimization efforts and sales; estimates of mine life; estimates of future capital expenditures and other cash needs, and expectations as to the funding thereof; statements as to the projected development of certain ore deposits, including estimates of exploration, development and production and other capital costs and estimates of the timing of such exploration, development and production or decisions with respect to such exploration, development and production; estimates of mineral reserves and mineral resources, and statements regarding anticipated future exploration; the anticipated timing of events with respect to the Company’s mine sites and statements regarding the sufficiency of the Company’s cash resources and other statements regarding anticipated trends with respect to the Company's operations, exploration and the funding thereof. Such statements reflect the Company’s views as at the date of this news release and are subject to certain risks, uncertainties and assumptions, and undue reliance should not be placed on such statements. Forward-looking statements are necessarily based upon a number of factors
24
and assumptions that, while considered reasonable by Agnico Eagle as of the date of such statements, are inherently subject to significant business, economic and competitive uncertainties and contingencies. The material factors and assumptions used in the preparation of the forward looking statements contained herein, which may prove to be incorrect, include, but are not limited to, the assumptions set forth herein and in management's discussion and analysis (“MD&A”) and the Company's Annual Information Form (“AIF”) for the year ended December 31, 2015 filed with Canadian securities regulators and that are included in its Annual Report on Form 40-F for the year ended December 31, 2015 (“Form 40-F”) filed with the U.S. Securities and Exchange Commission (the "SEC") as well as: that there are no significant disruptions affecting operations; that production, permitting, development and expansion at each of Agnico Eagle's properties proceeds on a basis consistent with current expectations and plans; that the relevant metal prices, exchange rates and prices for key mining and construction supplies will be consistent with Agnico Eagle's expectations; that Agnico Eagle's current estimates of mineral reserves, mineral resources, mineral grades and metal recovery are accurate; that there are no material delays in the timing for completion of ongoing growth projects; that the Company's current plans to optimize production are successful; and that there are no material variations in the current tax and regulatory environment. Many factors, known and unknown, could cause the actual results to be materially different from those expressed or implied by such forward looking statements. Such risks include, but are not limited to: the volatility of prices of gold and other metals; uncertainty of mineral reserves, mineral resources, mineral grades and mineral recovery estimates; uncertainty of future production, project development, capital expenditures and other costs; exchange rate fluctuations; financing of additional capital requirements; cost of exploration and development programs; mining risks; community protests; risks associated with foreign operations; governmental and environmental regulation; the volatility of the Company’s stock price; and risks associated with the Company’s currency, fuel and by-product metal derivative strategies. For a more detailed discussion of such risks and other factors that may affect the Company’s ability to achieve the expectations set forth in the forward-looking statements contained in this news release, see the AIF and MD&A filed on SEDAR at www.sedar.com and included in the Form 40-F filed on EDGAR at www.sec.gov, as well as the Company’s other filings with the Canadian securities regulators and the SEC. Other than as required by law, the Company does not intend, and does not assume any obligation, to update these forward-looking statements.
Notes to Investors Regarding the Use of Mineral Resources
Cautionary Note to Investors Concerning Estimates of Measured and Indicated Mineral Resources
This news release uses the terms “measured mineral resources” and “indicated mineral resources”. Investors are advised that while those terms are recognized and required by Canadian regulations, the SEC does not recognize them. Investors are cautioned not to assume that any part or all of mineral deposits in these categories will ever be converted into mineral reserves.
25
Cautionary Note to Investors Concerning Estimates of Inferred Mineral Resources
This news release also uses the term “inferred mineral resources”. Investors are advised that while this term is recognized and required by Canadian regulations, the SEC does not recognize it. “Inferred mineral resources” have a great amount of uncertainty as to their existence, and great uncertainty as to their economic and legal feasibility. It cannot be assumed that all or any part of an inferred mineral resource will ever be upgraded to a higher category. Under Canadian rules, estimates of inferred mineral resources may not form the basis of feasibility or pre-feasibility studies, except in rare cases. Investors are cautioned not to assume that any part or all of an inferred mineral resource exists, or is economically or legally mineable.
Scientific and Technical Data
The scientific and technical information contained in this news release relating to Quebec operations has been approved by Christian Provencher, Eng., Vice-President, Canada; relating to Nunavut operations has been approved by Dominique Girard, Eng., Vice-President Nunavut Operations; relating to the Finland operations has been approved by Francis Brunet, Eng., Corporate Director Mining; relating to Southern Business operations has been approved by Tim Haldane, P.Eng., Senior Vice-President, Operations – USA and Latin America; and relating to exploration has been approved by Alain Blackburn, Eng., Senior Vice-President, Exploration and Guy Gosselin, Eng. and P.Geo., Vice-President, Exploration. Each of them is a "Qualified Person" for the purposes of National Instrument 43-101 Standards of Disclosure for Mineral Projects (“NI 43-101”).
The scientific and technical information relating to Agnico Eagle’s mineral reserves and mineral resources contained herein (other than the Canadian Malartic mine) has been approved by Daniel Doucet, Eng., Senior Corporate Director, Reserve Development; and relating to mineral reserves and mineral resources at the Canadian Malartic mine contained herein has been approved by Donald Gervais, P.Geo., Director of Technical Services at Canadian Malartic Corporation (“CMC”) a corporation 50% owned indirectly by each of Agnico and Yamana. Each of them is a "Qualified Person" for the purposes of NI 43-101.
Cautionary Note To U.S. Investors - The SEC permits U.S. mining companies, in their filings with the SEC, to disclose only those mineral deposits that a company can economically and legally extract or produce. Agnico Eagle reports mineral reserve and mineral resource estimates in accordance with the Canadian Institute of Mining, Metallurgy and Petroleum Best Practice Guidelines for Exploration and for Estimation of Mineral Resources and Mineral Reserves, in accordance with NI 43-101. These standards are similar to those used by the SEC’s Industry Guide No. 7, as interpreted by Staff at the SEC ("Guide 7"). However, the definitions in NI 43-101 differ in certain respects from those under Guide 7. Accordingly, mineral reserve information contained herein may not be comparable to similar information disclosed by U.S. companies. Under the requirements of the SEC, mineralization may not be classified as a "reserve" unless the determination has been made that the mineralization could be economically
26
and legally produced or extracted at the time the reserve determination is made. A "final" or "bankable" feasibility study is required to meet the requirements to designate mineral reserves under Industry Guide 7. Agnico Eagle uses certain terms in this news release, such as "measured", "indicated", "inferred", and "resources" that the SEC guidelines strictly prohibit U.S. registered companies from including in their filings with the SEC.
In prior periods, mineral reserves and mineral resources for all properties were typically estimated using historic three-year average metals prices and foreign exchange rates in accordance with the SEC guidelines. These guidelines require the use of prices that reflect current economic conditions at the time of mineral reserve determination, which the Staff of the SEC has interpreted to mean historic three-year average prices. Given the current lower commodity price environment, Agnico Eagle has decided to use price assumptions that are below the three-year averages. The assumptions used for the mineral reserve and mineral resource estimates at all mines and advanced projects as of December 31, 2015 (other than the Canadian Malartic mine), reported by the Company on February 10, 2016, were $1,100 per ounce gold, $16.00 per ounce silver, $0.90 per pound zinc, $2.50 per pound copper, and US$/C$, Euro/US$ and US$/MXP exchange rates for all mines and projects other than the Lapa, Meadowbank and Creston Mascota mines and Santo Niño open pit at Pinos Altos of 1.16, 1.20 and 14.00, respectively. Due to shorter mine life, the assumptions used for the mineral reserve and mineral resource estimates at the shorter-life mines (the Lapa, Meadowbank and Creston Mascota mines and Santo Niño open pit) as of December 31, 2015, reported by the Company on February 10, 2016, included the same metal price assumptions, and US$/C$ and US$/MXP exchange rates of 1.30 and 16.00, respectively.
The assumptions used for the mineral reserve and mineral resource estimates at the Canadian Malartic mine as of December 31, 2015, reported by the Company on February 10, 2016, were $1,150 per ounce gold, a cut-off grade between 0.30 g/t and 0.33 g/t gold (depending on the deposit) and a US$/C$ exchange rate of 1.24.
NI 43-101 requires mining companies to disclose mineral reserves and mineral resources using the subcategories of "proven mineral reserves”, "probable mineral reserves”, "measured mineral resources”, "indicated mineral resources” and "inferred mineral resources”. Mineral resources that are not mineral reserves do not have demonstrated economic viability.
A mineral reserve is the economically mineable part of a measured and/or indicated mineral resource. It includes diluting materials and allowances for losses, which may occur when the material is mined or extracted and is defined by studies at pre-feasibility or feasibility level as appropriate that include application of modifying factors. Such studies demonstrate that, at the time of reporting, extraction could reasonably be justified.
Modifying factors are considerations used to convert mineral resources to mineral reserves. These include, but are not restricted to, mining, processing, metallurgical, infrastructure, economic, marketing, legal, environmental, social and governmental factors.
27
A proven mineral reserve is the economically mineable part of a measured mineral resource. A proven mineral reserve implies a high degree of confidence in the modifying factors. A probable mineral reserve is the economically mineable part of an indicated and, in some circumstances, a measured mineral resource. The confidence in the modifying factors applying to a probable mineral reserve is lower than that applying to a proven mineral reserve.
A mineral resource is a concentration or occurrence of solid material of economic interest in or on the Earth's crust in such form, grade or quality and quantity that there are reasonable prospects for eventual economic extraction. The location, quantity, grade or quality, continuity and other geological characteristics of a mineral resource are known, estimated or interpreted from specific geological evidence and knowledge, including sampling.
A measured mineral resource is that part of a mineral resource for which quantity, grade or quality, densities, shape and physical characteristics are estimated with confidence sufficient to allow the application of modifying factors to support detailed mine planning and final evaluation of the economic viability of the deposit. Geological evidence is derived from detailed and reliable exploration, sampling and testing and is sufficient to confirm geological and grade or quality continuity between points of observation. An indicated mineral resource is that part of a mineral resource for which quantity, grade or quality, densities, shape and physical characteristics are estimated with sufficient confidence to allow the application of modifying factors in sufficient detail to support mine planning and evaluation of the economic viability of the deposit. Geological evidence is derived from adequately detailed and reliable exploration, sampling and testing and is sufficient to assume geological and grade or quality continuity between points of observation. An inferred mineral resource is that part of a mineral resource for which quantity and grade or quality are estimated on the basis of limited geological evidence and sampling. Geological evidence is sufficient to imply but not verify geological and grade or quality continuity.
Investors are cautioned not to assume that part or all of an inferred mineral resource exists, or is economically or legally mineable.
A feasibility study is a comprehensive technical and economic study of the selected development option for a mineral project that includes appropriately detailed assessments of applicable modifying factors together with any other relevant operational factors and detailed financial analysis that are necessary to demonstrate, at the time of reporting, that extraction is reasonably justified (economically mineable). The results of the study may reasonably serve as the basis for a final decision by a proponent or financial institution to proceed with, or finance, the development of the project. The confidence level of the study will be higher than that of a pre-feasibility study. Additional Information Additional information about each of the mineral projects that is required by NI 43-101, sections 3.2 and 3.3 and paragraphs 3.4 (a), (c) and (d) can be found in Technical
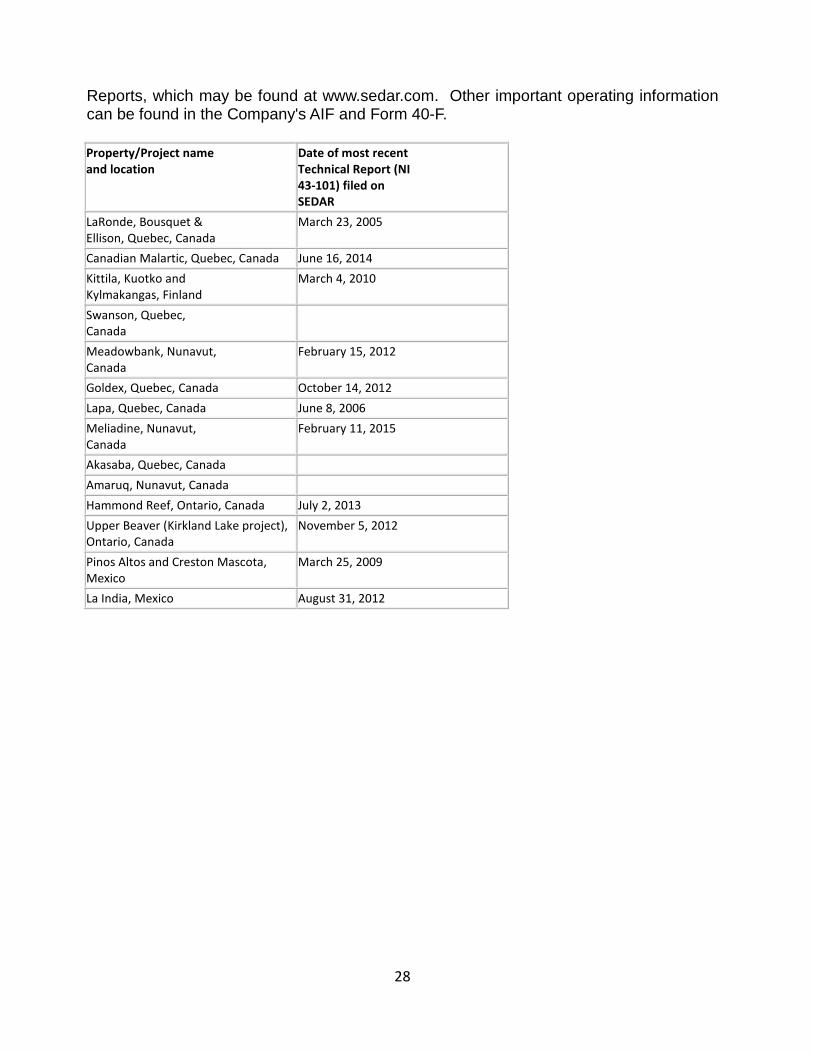
28
Reports, which may be found at www.sedar.com. Other important operating information can be found in the Company's AIF and Form 40-F. Property/Project name and location
Date of most recent Technical Report (NI 43-101) filed on SEDAR
LaRonde, Bousquet & Ellison, Quebec, Canada
March 23, 2005
Canadian Malartic, Quebec, Canada June 16, 2014 Kittila, Kuotko and Kylmakangas, Finland
March 4, 2010
Swanson, Quebec, Canada
Meadowbank, Nunavut, Canada
February 15, 2012
Goldex, Quebec, Canada October 14, 2012 Lapa, Quebec, Canada June 8, 2006 Meliadine, Nunavut, Canada
February 11, 2015
Akasaba, Quebec, Canada Amaruq, Nunavut, Canada Hammond Reef, Ontario, Canada July 2, 2013 Upper Beaver (Kirkland Lake project), Ontario, Canada
November 5, 2012
Pinos Altos and Creston Mascota, Mexico
March 25, 2009
La India, Mexico August 31, 2012
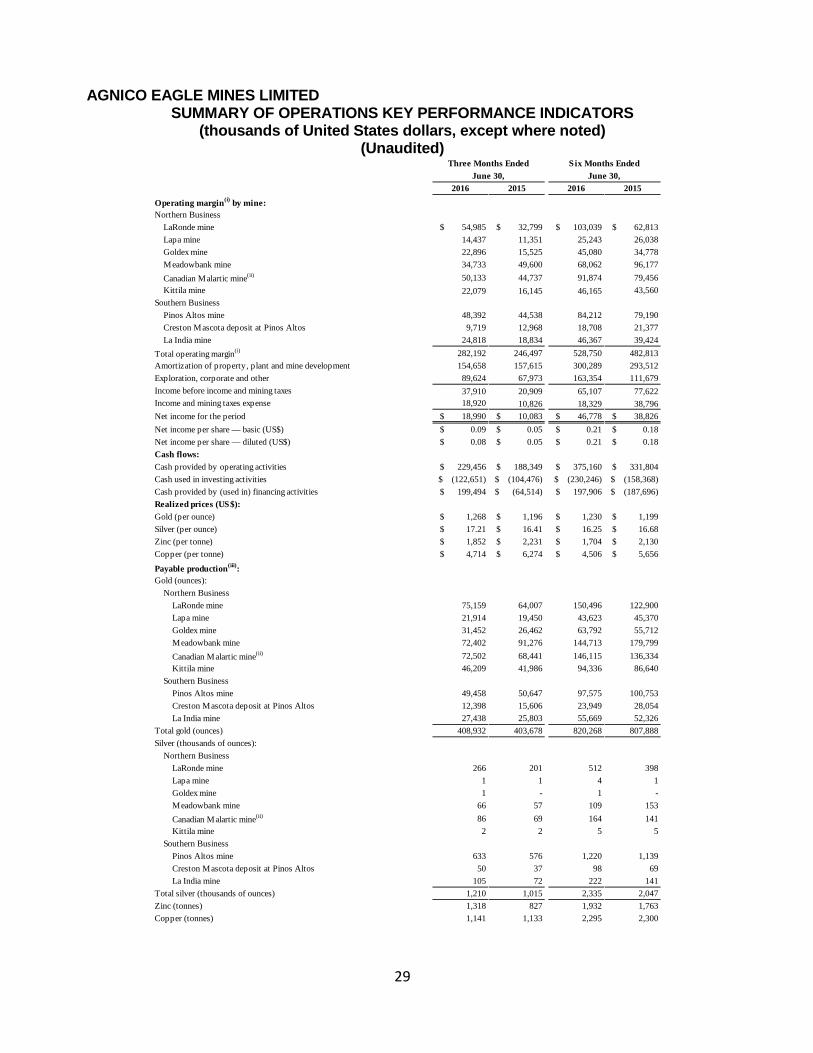
29
AGNICO EAGLE MINES LIMITED SUMMARY OF OPERATIONS KEY PERFORMANCE INDICATORS
(thousands of United States dollars, except where noted) (Unaudited)
2016 2015 2016 2015
Operating margin(i) by mine:Northern Business
LaRonde mine $ 54,985 $ 32,799 $ 103,039 $ 62,813 Lapa mine 14,437 11,351 25,243 26,038Goldex mine 22,896 15,525 45,080 34,778Meadowbank mine 34,733 49,600 68,062 96,177Canadian Malartic mine(ii) 50,133 44,737 91,874 79,456Kittila mine 22,079 16,145 46,165 43,560
Southern BusinessPinos Altos mine 48,392 44,538 84,212 79,190Creston Mascota deposit at Pinos Altos 9,719 12,968 18,708 21,377La India mine 24,818 18,834 46,367 39,424
Total operating margin(i) 282,192 246,497 528,750 482,813Amortization of property, plant and mine development 154,658 157,615 300,289 293,512Exploration, corporate and other 89,624 67,973 163,354 111,679Income before income and mining taxes 37,910 20,909 65,107 77,622Income and mining taxes expense 18,920 10,826 18,329 38,796Net income for the period $ 18,990 $ 10,083 $ 46,778 $ 38,826 Net income per share — basic (US$) $ 0.09 $ 0.05 $ 0.21 $ 0.18 Net income per share — diluted (US$) $ 0.08 $ 0.05 $ 0.21 $ 0.18 Cash flows:Cash provided by operating activities $ 229,456 $ 188,349 $ 375,160 $ 331,804 Cash used in investing activities $ (122,651) $ (104,476) $ (230,246) $ (158,368)Cash provided by (used in) financing activities $ 199,494 $ (64,514) $ 197,906 $ (187,696)Realized prices (US$):Gold (per ounce) $ 1,268 $ 1,196 $ 1,230 $ 1,199 Silver (per ounce) $ 17.21 $ 16.41 $ 16.25 $ 16.68 Zinc (per tonne) $ 1,852 $ 2,231 $ 1,704 $ 2,130 Copper (per tonne) $ 4,714 $ 6,274 $ 4,506 $ 5,656
Payable production(iii):Gold (ounces):
Northern BusinessLaRonde mine 75,159 64,007 150,496 122,900 Lapa mine 21,914 19,450 43,623 45,370 Goldex mine 31,452 26,462 63,792 55,712 Meadowbank mine 72,402 91,276 144,713 179,799 Canadian Malartic mine(ii) 72,502 68,441 146,115 136,334 Kittila mine 46,209 41,986 94,336 86,640
Southern BusinessPinos Altos mine 49,458 50,647 97,575 100,753 Creston Mascota deposit at Pinos Altos 12,398 15,606 23,949 28,054 La India mine 27,438 25,803 55,669 52,326
Total gold (ounces) 408,932 403,678 820,268 807,888Silver (thousands of ounces):
Northern BusinessLaRonde mine 266 201 512 398Lapa mine 1 1 4 1 Goldex mine 1 - 1 - Meadowbank mine 66 57 109 153Canadian Malartic mine(ii) 86 69 164 141Kittila mine 2 2 5 5
Southern BusinessPinos Altos mine 633 576 1,220 1,139Creston Mascota deposit at Pinos Altos 50 37 98 69La India mine 105 72 222 141
Total silver (thousands of ounces) 1,210 1,015 2,335 2,047 Zinc (tonnes) 1,318 827 1,932 1,763Copper (tonnes) 1,141 1,133 2,295 2,300
Three Months Ended Six Months EndedJune 30, June 30,
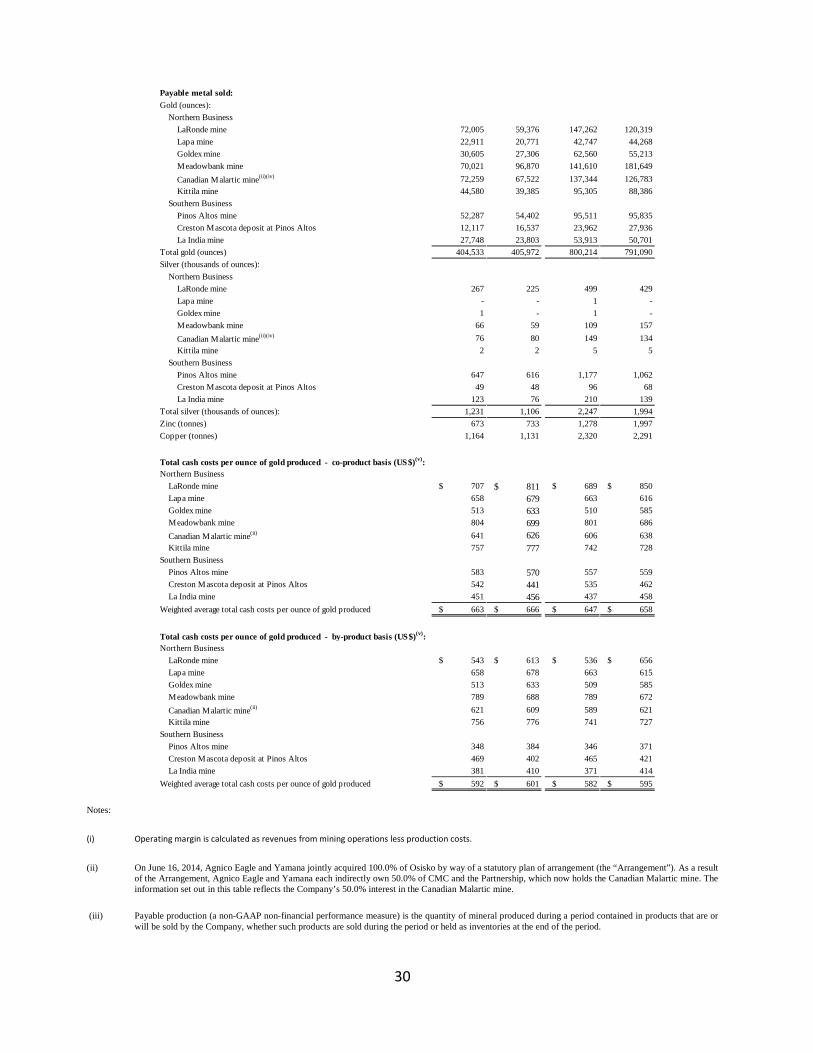
30
Notes: (i) Operating margin is calculated as revenues from mining operations less production costs.
(ii) On June 16, 2014, Agnico Eagle and Yamana jointly acquired 100.0% of Osisko by way of a statutory plan of arrangement (the “Arrangement”). As a result of the Arrangement, Agnico Eagle and Yamana each indirectly own 50.0% of CMC and the Partnership, which now holds the Canadian Malartic mine. The information set out in this table reflects the Company’s 50.0% interest in the Canadian Malartic mine.
(iii) Payable production (a non-GAAP non-financial performance measure) is the quantity of mineral produced during a period contained in products that are or will be sold by the Company, whether such products are sold during the period or held as inventories at the end of the period.
Payable metal sold:Gold (ounces):
Northern BusinessLaRonde mine 72,005 59,376 147,262 120,319 Lapa mine 22,911 20,771 42,747 44,268 Goldex mine 30,605 27,306 62,560 55,213 Meadowbank mine 70,021 96,870 141,610 181,649 Canadian Malartic mine(ii)(iv) 72,259 67,522 137,344 126,783 Kittila mine 44,580 39,385 95,305 88,386
Southern BusinessPinos Altos mine 52,287 54,402 95,511 95,835 Creston Mascota deposit at Pinos Altos 12,117 16,537 23,962 27,936 La India mine 27,748 23,803 53,913 50,701
Total gold (ounces) 404,533 405,972 800,214 791,090Silver (thousands of ounces):
Northern BusinessLaRonde mine 267 225 499 429 Lapa mine - - 1 - Goldex mine 1 - 1 - Meadowbank mine 66 59 109 157 Canadian Malartic mine(ii)(iv) 76 80 149 134 Kittila mine 2 2 5 5
Southern BusinessPinos Altos mine 647 616 1,177 1,062 Creston Mascota deposit at Pinos Altos 49 48 96 68 La India mine 123 76 210 139
Total silver (thousands of ounces): 1,231 1,106 2,247 1,994Zinc (tonnes) 673 733 1,278 1,997Copper (tonnes) 1,164 1,131 2,320 2,291
Total cash costs per ounce of gold produced - co-product basis (US$)(v):Northern Business
LaRonde mine $ 707 $ 811 $ 689 $ 850 Lapa mine 658 679 663 616 Goldex mine 513 633 510 585 Meadowbank mine 804 699 801 686 Canadian Malartic mine(ii) 641 626 606 638 Kittila mine 757 777 742 728
Southern BusinessPinos Altos mine 583 570 557 559 Creston Mascota deposit at Pinos Altos 542 441 535 462 La India mine 451 456 437 458
Weighted average total cash costs per ounce of gold produced $ 663 $ 666 $ 647 $ 658
Total cash costs per ounce of gold produced - by-product basis (US$)(v):Northern Business
LaRonde mine $ 543 $ 613 $ 536 $ 656 Lapa mine 658 678 663 615 Goldex mine 513 633 509 585 Meadowbank mine 789 688 789 672 Canadian Malartic mine(ii) 621 609 589 621 Kittila mine 756 776 741 727
Southern BusinessPinos Altos mine 348 384 346 371 Creston Mascota deposit at Pinos Altos 469 402 465 421 La India mine 381 410 371 414
Weighted average total cash costs per ounce of gold produced $ 592 $ 601 $ 582 $ 595
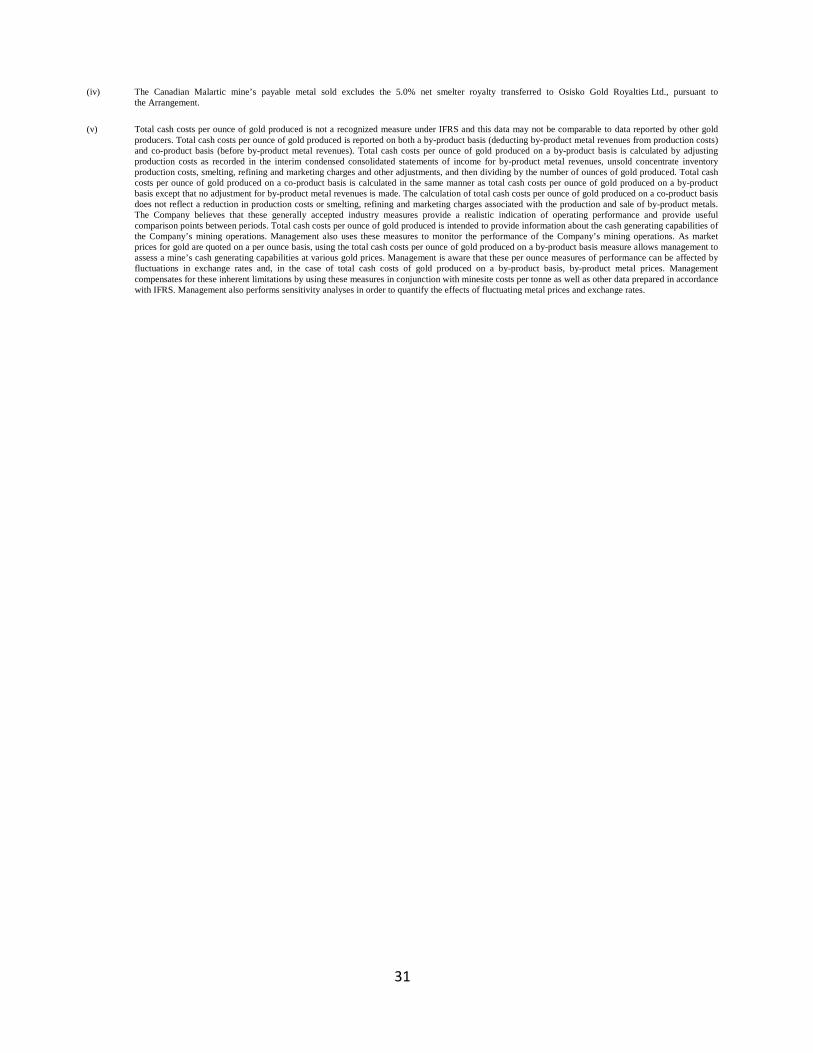
31
(iv) The Canadian Malartic mine’s payable metal sold excludes the 5.0% net smelter royalty transferred to Osisko Gold Royalties Ltd., pursuant to the Arrangement.
(v) Total cash costs per ounce of gold produced is not a recognized measure under IFRS and this data may not be comparable to data reported by other gold producers. Total cash costs per ounce of gold produced is reported on both a by-product basis (deducting by-product metal revenues from production costs) and co-product basis (before by-product metal revenues). Total cash costs per ounce of gold produced on a by-product basis is calculated by adjusting production costs as recorded in the interim condensed consolidated statements of income for by-product metal revenues, unsold concentrate inventory production costs, smelting, refining and marketing charges and other adjustments, and then dividing by the number of ounces of gold produced. Total cash costs per ounce of gold produced on a co-product basis is calculated in the same manner as total cash costs per ounce of gold produced on a by-product basis except that no adjustment for by-product metal revenues is made. The calculation of total cash costs per ounce of gold produced on a co-product basis does not reflect a reduction in production costs or smelting, refining and marketing charges associated with the production and sale of by-product metals. The Company believes that these generally accepted industry measures provide a realistic indication of operating performance and provide useful comparison points between periods. Total cash costs per ounce of gold produced is intended to provide information about the cash generating capabilities of the Company’s mining operations. Management also uses these measures to monitor the performance of the Company’s mining operations. As market prices for gold are quoted on a per ounce basis, using the total cash costs per ounce of gold produced on a by-product basis measure allows management to assess a mine’s cash generating capabilities at various gold prices. Management is aware that these per ounce measures of performance can be affected by fluctuations in exchange rates and, in the case of total cash costs of gold produced on a by-product basis, by-product metal prices. Management compensates for these inherent limitations by using these measures in conjunction with minesite costs per tonne as well as other data prepared in accordance with IFRS. Management also performs sensitivity analyses in order to quantify the effects of fluctuating metal prices and exchange rates.
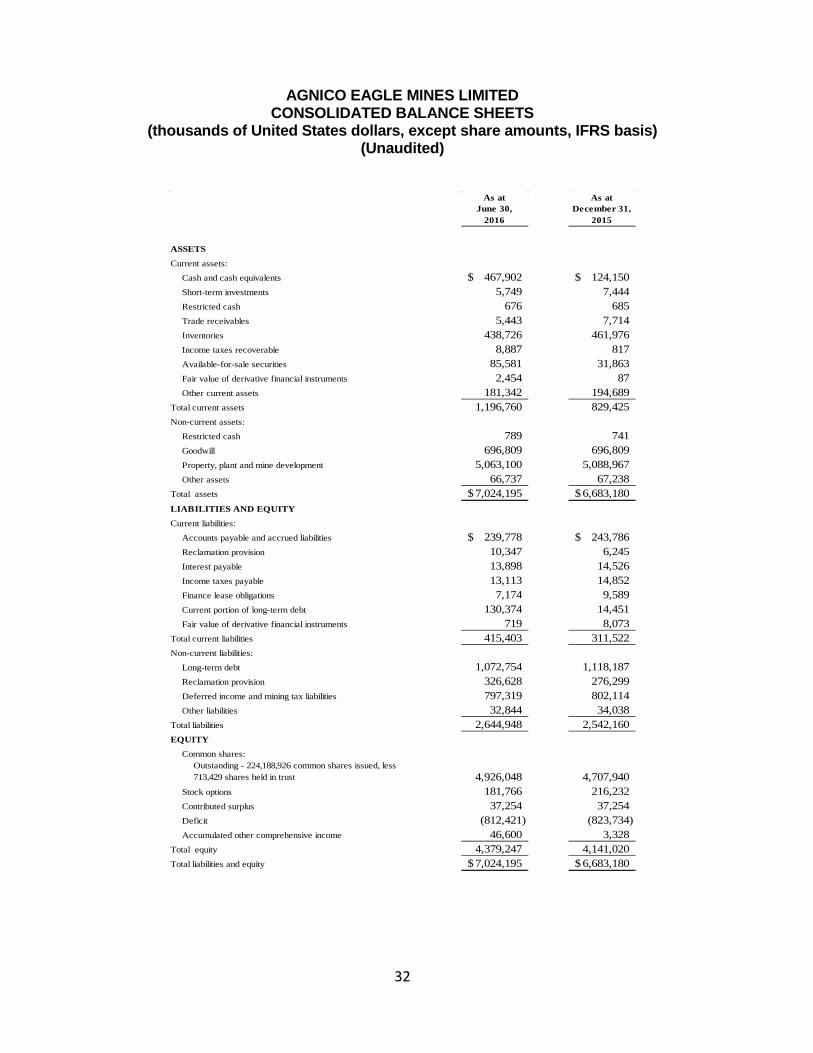
32
AGNICO EAGLE MINES LIMITED CONSOLIDATED BALANCE SHEETS
(thousands of United States dollars, except share amounts, IFRS basis) (Unaudited)
As at June 30,
As at December 31,
2016 2015
ASSETS
Current assets:
Cash and cash equivalents 467,902$ 124,150$ Short-term investments 5,749 7,444 Restricted cash 676 685 Trade receivables 5,443 7,714 Inventories 438,726 461,976 Income taxes recoverable 8,887 817 Available-for-sale securities 85,581 31,863 Fair value of derivative financial instruments 2,454 87 Other current assets 181,342 194,689
Total current assets 1,196,760 829,425 Non-current assets:
Restricted cash 789 741 Goodwill 696,809 696,809 Property, plant and mine development 5,063,100 5,088,967 Other assets 66,737 67,238
Total assets 7,024,195$ 6,683,180$ LIABILITIES AND EQUITY
Current liabilities:
Accounts payable and accrued liabilities 239,778$ 243,786$ Reclamation provision 10,347 6,245 Interest payable 13,898 14,526 Income taxes payable 13,113 14,852 Finance lease obligations 7,174 9,589 Current portion of long-term debt 130,374 14,451 Fair value of derivative financial instruments 719 8,073
Total current liabilities 415,403 311,522 Non-current liabilities:
Long-term debt 1,072,754 1,118,187 Reclamation provision 326,628 276,299 Deferred income and mining tax liabilities 797,319 802,114 Other liabilities 32,844 34,038
Total liabilities 2,644,948 2,542,160 EQUITY
Common shares:Outstanding - 224,188,926 common shares issued, less 713,429 shares held in trust 4,926,048 4,707,940
Stock options 181,766 216,232 Contributed surplus 37,254 37,254 Deficit (812,421) (823,734) Accumulated other comprehensive income 46,600 3,328
Total equity 4,379,247 4,141,020 Total liabilities and equity 7,024,195$ 6,683,180$
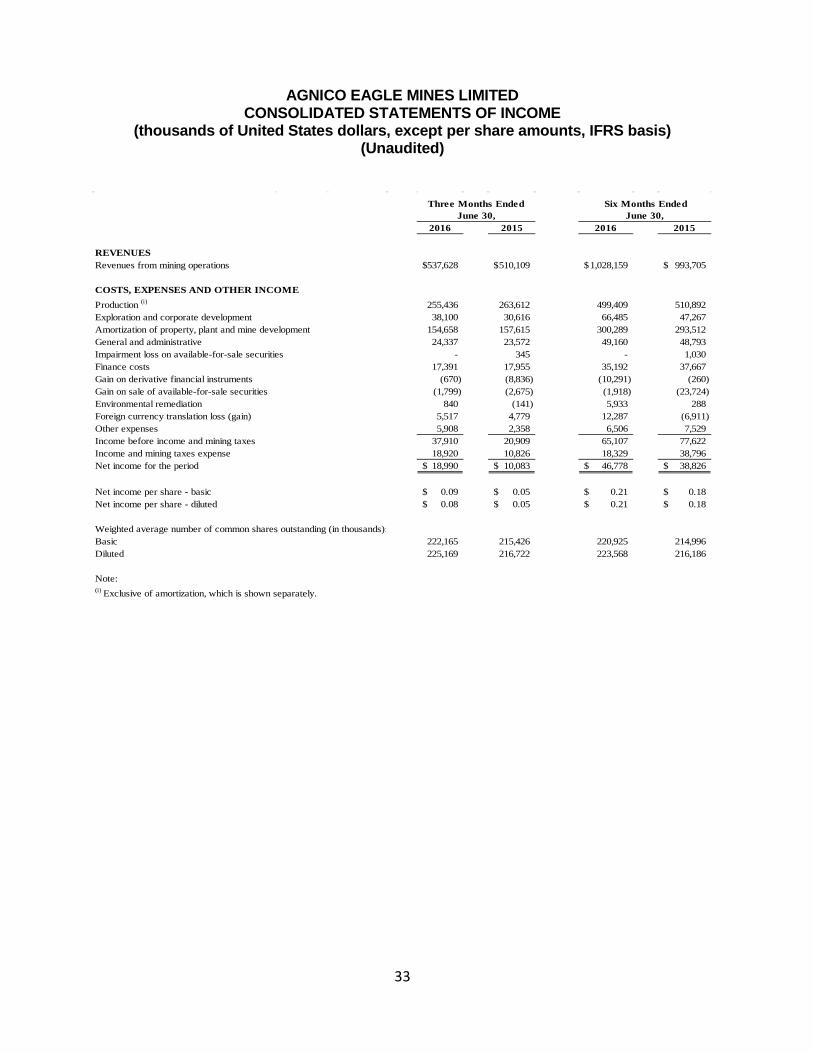
33
AGNICO EAGLE MINES LIMITED CONSOLIDATED STATEMENTS OF INCOME
(thousands of United States dollars, except per share amounts, IFRS basis) (Unaudited)
2016 2015 2016 2015
REVENUESRevenues from mining operations 537,628$ 510,109$ 1,028,159$ 993,705$
COSTS, EXPENSES AND OTHER INCOMEProduction (i) 255,436 263,612 499,409 510,892 Exploration and corporate development 38,100 30,616 66,485 47,267 Amortization of property, plant and mine development 154,658 157,615 300,289 293,512 General and administrative 24,337 23,572 49,160 48,793 Impairment loss on available-for-sale securities - 345 - 1,030 Finance costs 17,391 17,955 35,192 37,667 Gain on derivative financial instruments (670) (8,836) (10,291) (260) Gain on sale of available-for-sale securities (1,799) (2,675) (1,918) (23,724) Environmental remediation 840 (141) 5,933 288 Foreign currency translation loss (gain) 5,517 4,779 12,287 (6,911) Other expenses 5,908 2,358 6,506 7,529 Income before income and mining taxes 37,910 20,909 65,107 77,622 Income and mining taxes expense 18,920 10,826 18,329 38,796 Net income for the period 18,990$ 10,083$ 46,778$ 38,826$
Net income per share - basic 0.09$ 0.05$ 0.21$ 0.18$ Net income per share - diluted 0.08$ 0.05$ 0.21$ 0.18$
Weighted average number of common shares outstanding (in thousands):Basic 222,165 215,426 220,925 214,996 Diluted 225,169 216,722 223,568 216,186
Note: (i) Exclusive of amortization, which is shown separately.
Three Months Ended June 30,
Six Months EndedJune 30,
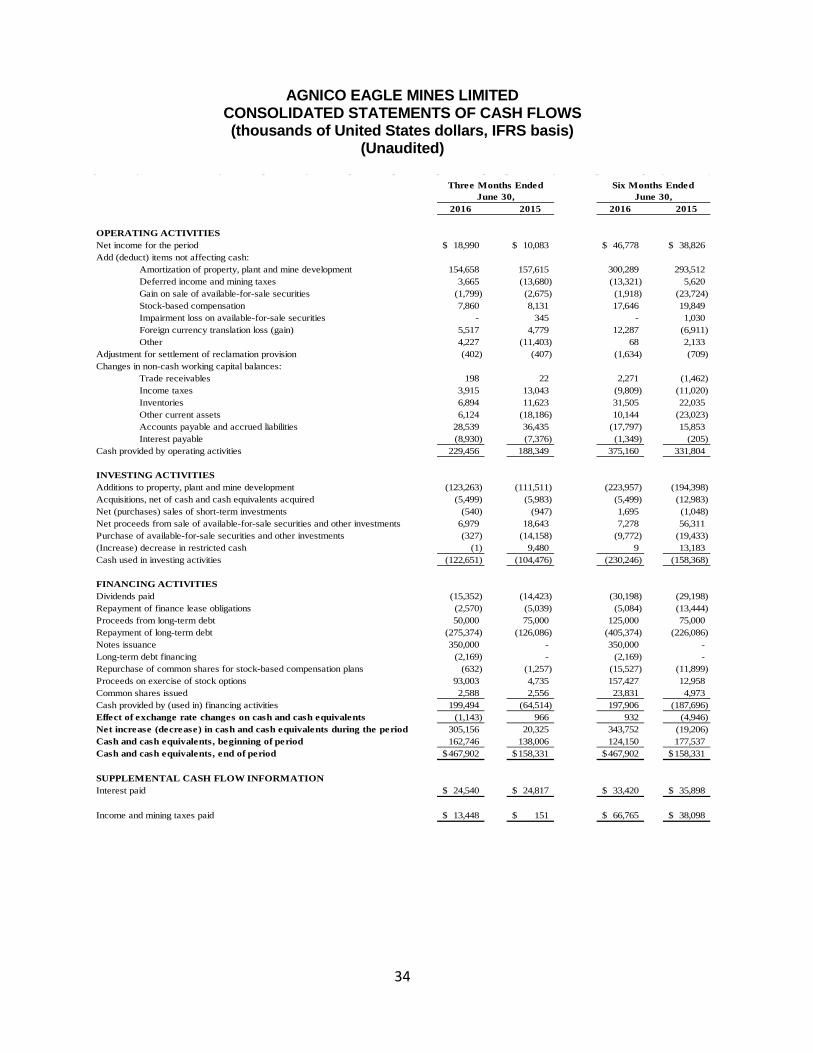
34
AGNICO EAGLE MINES LIMITED CONSOLIDATED STATEMENTS OF CASH FLOWS (thousands of United States dollars, IFRS basis)
(Unaudited)
2016 2015 2016 2015
OPERATING ACTIVITIESNet income for the period 18,990$ 10,083$ 46,778$ 38,826$ Add (deduct) items not affecting cash:
Amortization of property, plant and mine development 154,658 157,615 300,289 293,512 Deferred income and mining taxes 3,665 (13,680) (13,321) 5,620
(1,799) (2,675) (1,918) (23,724) Stock-based compensation 7,860 8,131 17,646 19,849 Impairment loss on available-for-sale securities - 345 - 1,030 Foreign currency translation loss (gain) 5,517 4,779 12,287 (6,911) Other 4,227 (11,403) 68 2,133
Adjustment for settlement of reclamation provision (402) (407) (1,634) (709) Changes in non-cash working capital balances:
Trade receivables 198 22 2,271 (1,462) Income taxes 3,915 13,043 (9,809) (11,020) Inventories 6,894 11,623 31,505 22,035 Other current assets 6,124 (18,186) 10,144 (23,023) Accounts payable and accrued liabilities 28,539 36,435 (17,797) 15,853 Interest payable (8,930) (7,376) (1,349) (205)
Cash provided by operating activities 229,456 188,349 375,160 331,804
INVESTING ACTIVITIESAdditions to property, plant and mine development (123,263) (111,511) (223,957) (194,398) Acquisitions, net of cash and cash equivalents acquired (5,499) (5,983) (5,499) (12,983) Net (purchases) sales of short-term investments (540) (947) 1,695 (1,048) Net proceeds from sale of available-for-sale securities and other investments 6,979 18,643 7,278 56,311 Purchase of available-for-sale securities and other investments (327) (14,158) (9,772) (19,433) (Increase) decrease in restricted cash (1) 9,480 9 13,183 Cash used in investing activities (122,651) (104,476) (230,246) (158,368)
FINANCING ACTIVITIESDividends paid (15,352) (14,423) (30,198) (29,198) Repayment of finance lease obligations (2,570) (5,039) (5,084) (13,444) Proceeds from long-term debt 50,000 75,000 125,000 75,000 Repayment of long-term debt (275,374) (126,086) (405,374) (226,086) Notes issuance 350,000 - 350,000 - Long-term debt financing (2,169) - (2,169) - Repurchase of common shares for stock-based compensation plans (632) (1,257) (15,527) (11,899) Proceeds on exercise of stock options 93,003 4,735 157,427 12,958 Common shares issued 2,588 2,556 23,831 4,973 Cash provided by (used in) financing activities 199,494 (64,514) 197,906 (187,696) Effect of exchange rate changes on cash and cash equivalents (1,143) 966 932 (4,946) Net increase (decrease) in cash and cash equivalents during the period 305,156 20,325 343,752 (19,206) Cash and cash equivalents, beginning of period 162,746 138,006 124,150 177,537 Cash and cash equivalents, end of period 467,902$ 158,331$ 467,902$ 158,331$
SUPPLEMENTAL CASH FLOW INFORMATIONInterest paid 24,540$ 24,817$ 33,420$ 35,898$
Income and mining taxes paid 13,448$ 151$ 66,765$ 38,098$
Three Months Ended June 30,
Six Months Ended June 30,
Gain on sale of available-for-sale securities
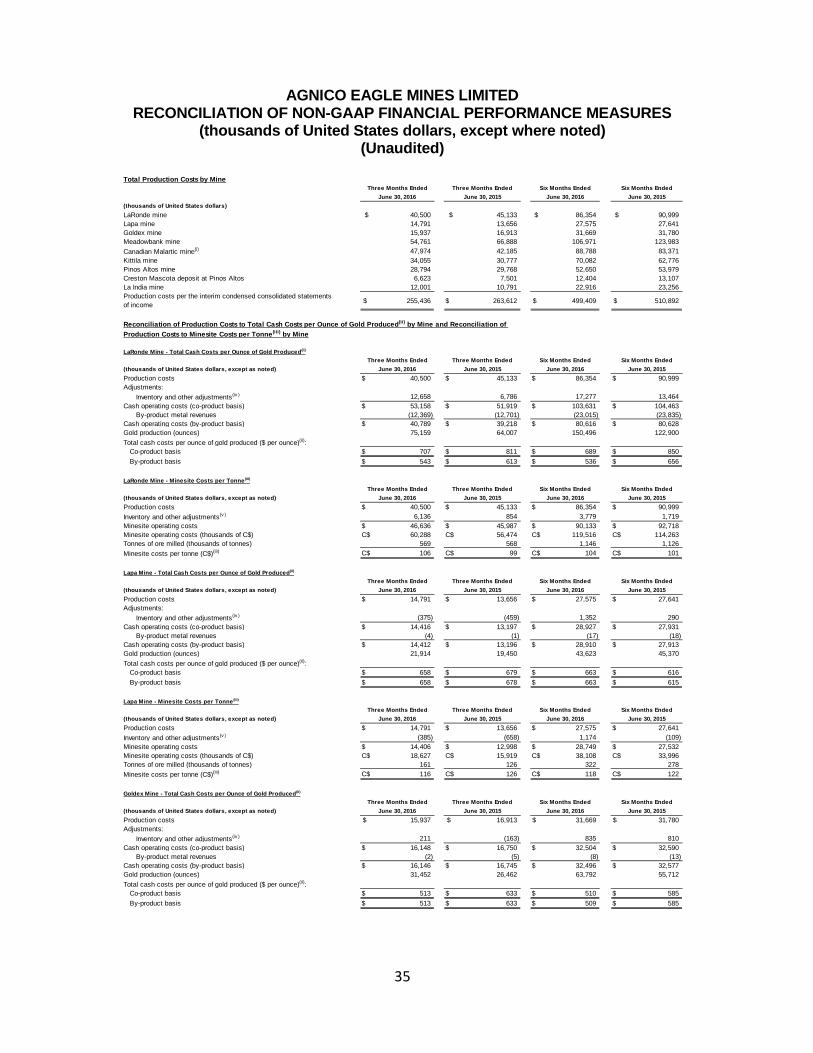
35
AGNICO EAGLE MINES LIMITED RECONCILIATION OF NON-GAAP FINANCIAL PERFORMANCE MEASURES
(thousands of United States dollars, except where noted) (Unaudited)
Total Production Costs by MineThree Months Ended Three Months Ended Six Months Ended Six Months Ended
June 30, 2016 June 30, 2015 June 30, 2016 June 30, 2015(thousands of United States dollars)LaRonde mine 40,500$ 45,133$ 86,354$ 90,999$ Lapa mine 14,791 13,656 27,575 27,641 Goldex mine 15,937 16,913 31,669 31,780 Meadowbank mine 54,761 66,888 106,971 123,983 Canadian Malartic mine(i) 47,974 42,185 88,788 83,371 Kittila mine 34,055 30,777 70,082 62,776 Pinos Altos mine 28,794 29,768 52,650 53,979 Creston Mascota deposit at Pinos Altos 6,623 7,501 12,404 13,107 La India mine 12,001 10,791 22,916 23,256 Production costs per the interim condensed consolidated statements of income 255,436$ 263,612$ 499,409$ 510,892$
LaRonde Mine - Total Cash Costs per Ounce of Gold Produced(ii)
Three Months Ended Three Months Ended Six Months Ended Six Months Ended(thousands of United States dollars, except as noted) June 30, 2016 June 30, 2015 June 30, 2016 June 30, 2015Production costs 40,500$ 45,133$ 86,354$ 90,999$ Adjustments:
Inventory and other adjustments(iv ) 12,658 6,786 17,277 13,464 Cash operating costs (co-product basis) 53,158$ 51,919$ 103,631$ 104,463$
By-product metal revenues (12,369) (12,701) (23,015) (23,835) Cash operating costs (by-product basis) 40,789$ 39,218$ 80,616$ 80,628$ Gold production (ounces) 75,159 64,007 150,496 122,900 Total cash costs per ounce of gold produced ($ per ounce)(ii):
Co-product basis 707$ 811$ 689$ 850$ By-product basis 543$ 613$ 536$ 656$
LaRonde Mine - Minesite Costs per Tonne(iii)
Three Months Ended Three Months Ended Six Months Ended Six Months Ended(thousands of United States dollars, except as noted) June 30, 2016 June 30, 2015 June 30, 2016 June 30, 2015Production costs 40,500$ 45,133$ 86,354$ 90,999$ Inventory and other adjustments(v ) 6,136 854 3,779 1,719 Minesite operating costs 46,636$ 45,987$ 90,133$ 92,718$ Minesite operating costs (thousands of C$) 60,288C$ 56,474C$ 119,516C$ 114,263C$ Tonnes of ore milled (thousands of tonnes) 569 568 1,146 1,126 Minesite costs per tonne (C$)(iii) 106C$ 99C$ 104C$ 101C$
Lapa Mine - Total Cash Costs per Ounce of Gold Produced(ii)
Three Months Ended Three Months Ended Six Months Ended Six Months Ended(thousands of United States dollars, except as noted) June 30, 2016 June 30, 2015 June 30, 2016 June 30, 2015Production costs 14,791$ 13,656$ 27,575$ 27,641$ Adjustments:
Inventory and other adjustments(iv ) (375) (459) 1,352 290 Cash operating costs (co-product basis) 14,416$ 13,197$ 28,927$ 27,931$
By-product metal revenues (4) (1) (17) (18) Cash operating costs (by-product basis) 14,412$ 13,196$ 28,910$ 27,913$ Gold production (ounces) 21,914 19,450 43,623 45,370 Total cash costs per ounce of gold produced ($ per ounce)(ii):
Co-product basis 658$ 679$ 663$ 616$ By-product basis 658$ 678$ 663$ 615$
Lapa Mine - Minesite Costs per Tonne(iii)
Three Months Ended Three Months Ended Six Months Ended Six Months Ended(thousands of United States dollars, except as noted) June 30, 2016 June 30, 2015 June 30, 2016 June 30, 2015Production costs 14,791$ 13,656$ 27,575$ 27,641$ Inventory and other adjustments(v ) (385) (658) 1,174 (109) Minesite operating costs 14,406$ 12,998$ 28,749$ 27,532$ Minesite operating costs (thousands of C$) 18,627C$ 15,919C$ 38,108C$ 33,996C$ Tonnes of ore milled (thousands of tonnes) 161 126 322 278 Minesite costs per tonne (C$)(iii) 116C$ 126C$ 118C$ 122C$
Goldex Mine - Total Cash Costs per Ounce of Gold Produced(ii)
Three Months Ended Three Months Ended Six Months Ended Six Months Ended(thousands of United States dollars, except as noted) June 30, 2016 June 30, 2015 June 30, 2016 June 30, 2015Production costs 15,937$ 16,913$ 31,669$ 31,780$ Adjustments:
Inventory and other adjustments(iv ) 211 (163) 835 810 Cash operating costs (co-product basis) 16,148$ 16,750$ 32,504$ 32,590$
By-product metal revenues (2) (5) (8) (13) Cash operating costs (by-product basis) 16,146$ 16,745$ 32,496$ 32,577$ Gold production (ounces) 31,452 26,462 63,792 55,712 Total cash costs per ounce of gold produced ($ per ounce)(ii):
Co-product basis 513$ 633$ 510$ 585$ By-product basis 513$ 633$ 509$ 585$
Reconciliation of Production Costs to Total Cash Costs per Ounce of Gold Produced(ii) by Mine and Reconciliation of Production Costs to Minesite Costs per Tonne(iii) by Mine
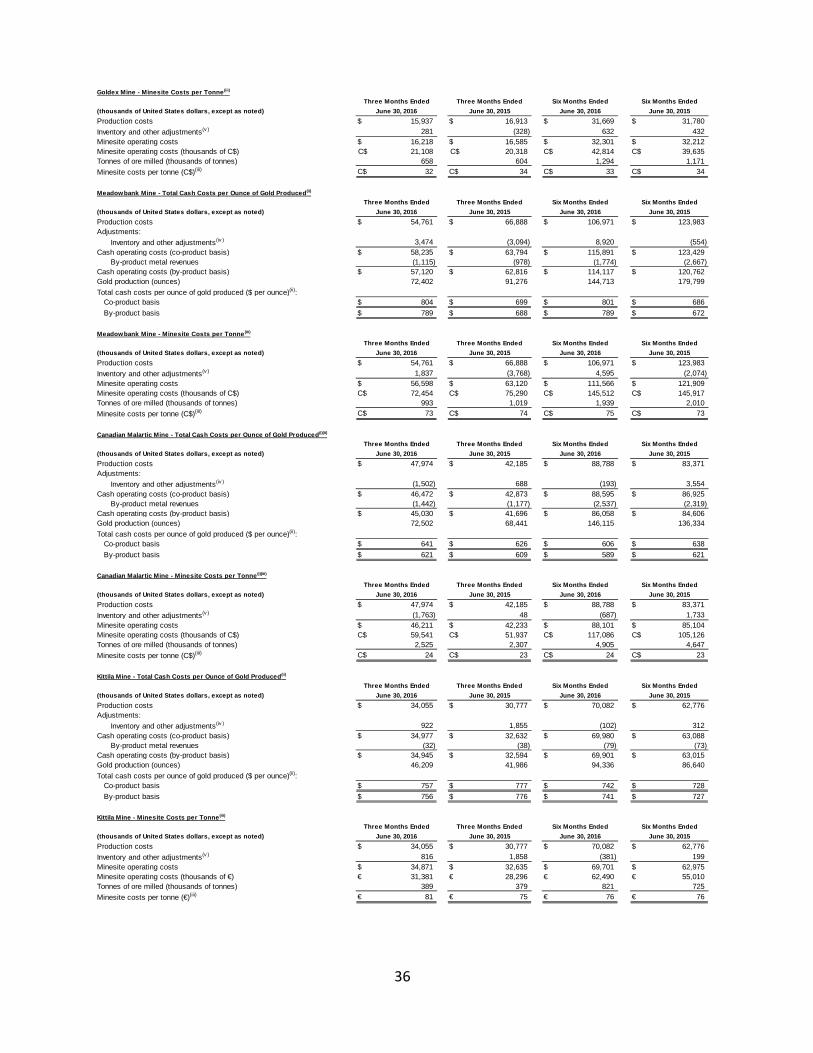
36
Goldex Mine - Minesite Costs per Tonne(iii)
Three Months Ended Three Months Ended Six Months Ended Six Months Ended(thousands of United States dollars, except as noted) June 30, 2016 June 30, 2015 June 30, 2016 June 30, 2015Production costs 15,937$ 16,913$ 31,669$ 31,780$ Inventory and other adjustments(v ) 281 (328) 632 432 Minesite operating costs 16,218$ 16,585$ 32,301$ 32,212$ Minesite operating costs (thousands of C$) 21,108C$ 20,318C$ 42,814C$ 39,635C$ Tonnes of ore milled (thousands of tonnes) 658 604 1,294 1,171 Minesite costs per tonne (C$)(iii) 32C$ 34C$ 33C$ 34C$
Meadowbank Mine - Total Cash Costs per Ounce of Gold Produced(ii)
Three Months Ended Three Months Ended Six Months Ended Six Months Ended(thousands of United States dollars, except as noted) June 30, 2016 June 30, 2015 June 30, 2016 June 30, 2015Production costs 54,761$ 66,888$ 106,971$ 123,983$ Adjustments:
Inventory and other adjustments(iv ) 3,474 (3,094) 8,920 (554) Cash operating costs (co-product basis) 58,235$ 63,794$ 115,891$ 123,429$
By-product metal revenues (1,115) (978) (1,774) (2,667) Cash operating costs (by-product basis) 57,120$ 62,816$ 114,117$ 120,762$ Gold production (ounces) 72,402 91,276 144,713 179,799 Total cash costs per ounce of gold produced ($ per ounce)(ii):
Co-product basis 804$ 699$ 801$ 686$ By-product basis 789$ 688$ 789$ 672$
Meadowbank Mine - Minesite Costs per Tonne(iii)
Three Months Ended Three Months Ended Six Months Ended Six Months Ended(thousands of United States dollars, except as noted) June 30, 2016 June 30, 2015 June 30, 2016 June 30, 2015Production costs 54,761$ 66,888$ 106,971$ 123,983$ Inventory and other adjustments(v ) 1,837 (3,768) 4,595 (2,074) Minesite operating costs 56,598$ 63,120$ 111,566$ 121,909$ Minesite operating costs (thousands of C$) 72,454C$ 75,290C$ 145,512C$ 145,917C$ Tonnes of ore milled (thousands of tonnes) 993 1,019 1,939 2,010 Minesite costs per tonne (C$)(iii) 73C$ 74C$ 75C$ 73C$
Canadian Malartic Mine - Total Cash Costs per Ounce of Gold Produced(i)(ii)
Three Months Ended Three Months Ended Six Months Ended Six Months Ended(thousands of United States dollars, except as noted) June 30, 2016 June 30, 2015 June 30, 2016 June 30, 2015Production costs 47,974$ 42,185$ 88,788$ 83,371$ Adjustments:
Inventory and other adjustments(iv ) (1,502) 688 (193) 3,554 Cash operating costs (co-product basis) 46,472$ 42,873$ 88,595$ 86,925$
By-product metal revenues (1,442) (1,177) (2,537) (2,319) Cash operating costs (by-product basis) 45,030$ 41,696$ 86,058$ 84,606$ Gold production (ounces) 72,502 68,441 146,115 136,334 Total cash costs per ounce of gold produced ($ per ounce)(ii):
Co-product basis 641$ 626$ 606$ 638$ By-product basis 621$ 609$ 589$ 621$
Canadian Malartic Mine - Minesite Costs per Tonne(i)(iii)
Three Months Ended Three Months Ended Six Months Ended Six Months Ended(thousands of United States dollars, except as noted) June 30, 2016 June 30, 2015 June 30, 2016 June 30, 2015Production costs 47,974$ 42,185$ 88,788$ 83,371$ Inventory and other adjustments(v ) (1,763) 48 (687) 1,733 Minesite operating costs 46,211$ 42,233$ 88,101$ 85,104$ Minesite operating costs (thousands of C$) 59,541C$ 51,937C$ 117,086C$ 105,126C$ Tonnes of ore milled (thousands of tonnes) 2,525 2,307 4,905 4,647 Minesite costs per tonne (C$)(iii) 24C$ 23C$ 24C$ 23C$
Kittila Mine - Total Cash Costs per Ounce of Gold Produced(ii)
Three Months Ended Three Months Ended Six Months Ended Six Months Ended(thousands of United States dollars, except as noted) June 30, 2016 June 30, 2015 June 30, 2016 June 30, 2015Production costs 34,055$ 30,777$ 70,082$ 62,776$ Adjustments:
Inventory and other adjustments(iv ) 922 1,855 (102) 312 Cash operating costs (co-product basis) 34,977$ 32,632$ 69,980$ 63,088$
By-product metal revenues (32) (38) (79) (73) Cash operating costs (by-product basis) 34,945$ 32,594$ 69,901$ 63,015$ Gold production (ounces) 46,209 41,986 94,336 86,640 Total cash costs per ounce of gold produced ($ per ounce)(ii):
Co-product basis 757$ 777$ 742$ 728$ By-product basis 756$ 776$ 741$ 727$
Kittila Mine - Minesite Costs per Tonne(iii)
Three Months Ended Three Months Ended Six Months Ended Six Months Ended(thousands of United States dollars, except as noted) June 30, 2016 June 30, 2015 June 30, 2016 June 30, 2015Production costs 34,055$ 30,777$ 70,082$ 62,776$ Inventory and other adjustments(v ) 816 1,858 (381) 199 Minesite operating costs 34,871$ 32,635$ 69,701$ 62,975$ Minesite operating costs (thousands of €) 31,381€ 28,296€ 62,490€ 55,010€ Tonnes of ore milled (thousands of tonnes) 389 379 821 725 Minesite costs per tonne (€)(iii) 81€ 75€ 76€ 76€
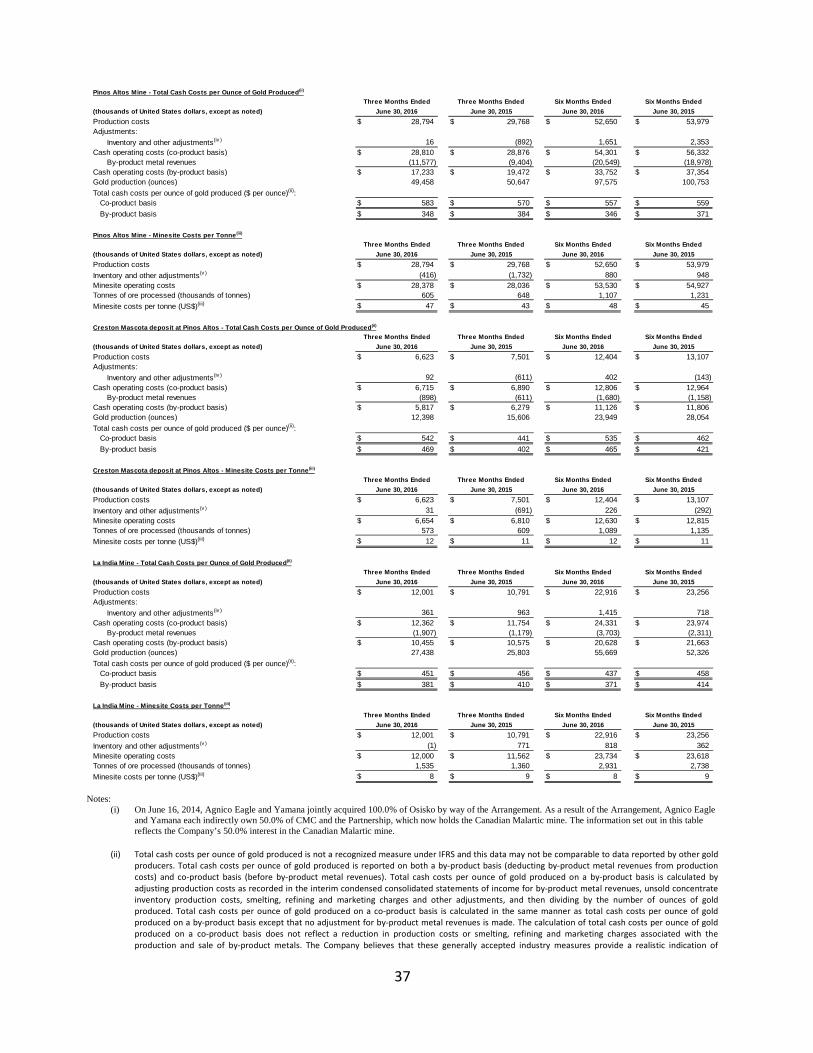
37
Notes:
(i) On June 16, 2014, Agnico Eagle and Yamana jointly acquired 100.0% of Osisko by way of the Arrangement. As a result of the Arrangement, Agnico Eagle and Yamana each indirectly own 50.0% of CMC and the Partnership, which now holds the Canadian Malartic mine. The information set out in this table reflects the Company’s 50.0% interest in the Canadian Malartic mine.
(ii) Total cash costs per ounce of gold produced is not a recognized measure under IFRS and this data may not be comparable to data reported by other gold producers. Total cash costs per ounce of gold produced is reported on both a by-product basis (deducting by-product metal revenues from production costs) and co-product basis (before by-product metal revenues). Total cash costs per ounce of gold produced on a by-product basis is calculated by adjusting production costs as recorded in the interim condensed consolidated statements of income for by-product metal revenues, unsold concentrate inventory production costs, smelting, refining and marketing charges and other adjustments, and then dividing by the number of ounces of gold produced. Total cash costs per ounce of gold produced on a co-product basis is calculated in the same manner as total cash costs per ounce of gold produced on a by-product basis except that no adjustment for by-product metal revenues is made. The calculation of total cash costs per ounce of gold produced on a co-product basis does not reflect a reduction in production costs or smelting, refining and marketing charges associated with the production and sale of by-product metals. The Company believes that these generally accepted industry measures provide a realistic indication of
Pinos Altos Mine - Total Cash Costs per Ounce of Gold Produced(ii)
Three Months Ended Three Months Ended Six Months Ended Six Months Ended(thousands of United States dollars, except as noted) June 30, 2016 June 30, 2015 June 30, 2016 June 30, 2015Production costs 28,794$ 29,768$ 52,650$ 53,979$ Adjustments:
Inventory and other adjustments(iv ) 16 (892) 1,651 2,353 Cash operating costs (co-product basis) 28,810$ 28,876$ 54,301$ 56,332$
By-product metal revenues (11,577) (9,404) (20,549) (18,978) Cash operating costs (by-product basis) 17,233$ 19,472$ 33,752$ 37,354$ Gold production (ounces) 49,458 50,647 97,575 100,753 Total cash costs per ounce of gold produced ($ per ounce)(ii):
Co-product basis 583$ 570$ 557$ 559$ By-product basis 348$ 384$ 346$ 371$
Pinos Altos Mine - Minesite Costs per Tonne(iii)
Three Months Ended Three Months Ended Six Months Ended Six Months Ended(thousands of United States dollars, except as noted) June 30, 2016 June 30, 2015 June 30, 2016 June 30, 2015Production costs 28,794$ 29,768$ 52,650$ 53,979$ Inventory and other adjustments(v ) (416) (1,732) 880 948 Minesite operating costs 28,378$ 28,036$ 53,530$ 54,927$ Tonnes of ore processed (thousands of tonnes) 605 648 1,107 1,231 Minesite costs per tonne (US$)(iii) 47$ 43$ 48$ 45$
Creston Mascota deposit at Pinos Altos - Total Cash Costs per Ounce of Gold Produced(ii)
Three Months Ended Three Months Ended Six Months Ended Six Months Ended(thousands of United States dollars, except as noted) June 30, 2016 June 30, 2015 June 30, 2016 June 30, 2015Production costs 6,623$ 7,501$ 12,404$ 13,107$ Adjustments:
Inventory and other adjustments(iv ) 92 (611) 402 (143) Cash operating costs (co-product basis) 6,715$ 6,890$ 12,806$ 12,964$
By-product metal revenues (898) (611) (1,680) (1,158) Cash operating costs (by-product basis) 5,817$ 6,279$ 11,126$ 11,806$ Gold production (ounces) 12,398 15,606 23,949 28,054 Total cash costs per ounce of gold produced ($ per ounce)(ii):
Co-product basis 542$ 441$ 535$ 462$ By-product basis 469$ 402$ 465$ 421$
Creston Mascota deposit at Pinos Altos - Minesite Costs per Tonne(iii)
Three Months Ended Three Months Ended Six Months Ended Six Months Ended(thousands of United States dollars, except as noted) June 30, 2016 June 30, 2015 June 30, 2016 June 30, 2015Production costs 6,623$ 7,501$ 12,404$ 13,107$ Inventory and other adjustments(v ) 31 (691) 226 (292) Minesite operating costs 6,654$ 6,810$ 12,630$ 12,815$ Tonnes of ore processed (thousands of tonnes) 573 609 1,089 1,135 Minesite costs per tonne (US$)(iii) 12$ 11$ 12$ 11$
La India Mine - Total Cash Costs per Ounce of Gold Produced(ii)
Three Months Ended Three Months Ended Six Months Ended Six Months Ended(thousands of United States dollars, except as noted) June 30, 2016 June 30, 2015 June 30, 2016 June 30, 2015Production costs 12,001$ 10,791$ 22,916$ 23,256$ Adjustments:
Inventory and other adjustments(iv ) 361 963 1,415 718 Cash operating costs (co-product basis) 12,362$ 11,754$ 24,331$ 23,974$
By-product metal revenues (1,907) (1,179) (3,703) (2,311) Cash operating costs (by-product basis) 10,455$ 10,575$ 20,628$ 21,663$ Gold production (ounces) 27,438 25,803 55,669 52,326 Total cash costs per ounce of gold produced ($ per ounce)(ii):
Co-product basis 451$ 456$ 437$ 458$ By-product basis 381$ 410$ 371$ 414$
La India Mine - Minesite Costs per Tonne(iii)
Three Months Ended Three Months Ended Six Months Ended Six Months Ended(thousands of United States dollars, except as noted) June 30, 2016 June 30, 2015 June 30, 2016 June 30, 2015Production costs 12,001$ 10,791$ 22,916$ 23,256$ Inventory and other adjustments(v ) (1) 771 818 362 Minesite operating costs 12,000$ 11,562$ 23,734$ 23,618$ Tonnes of ore processed (thousands of tonnes) 1,535 1,360 2,931 2,738 Minesite costs per tonne (US$)(iii) 8$ 9$ 8$ 9$
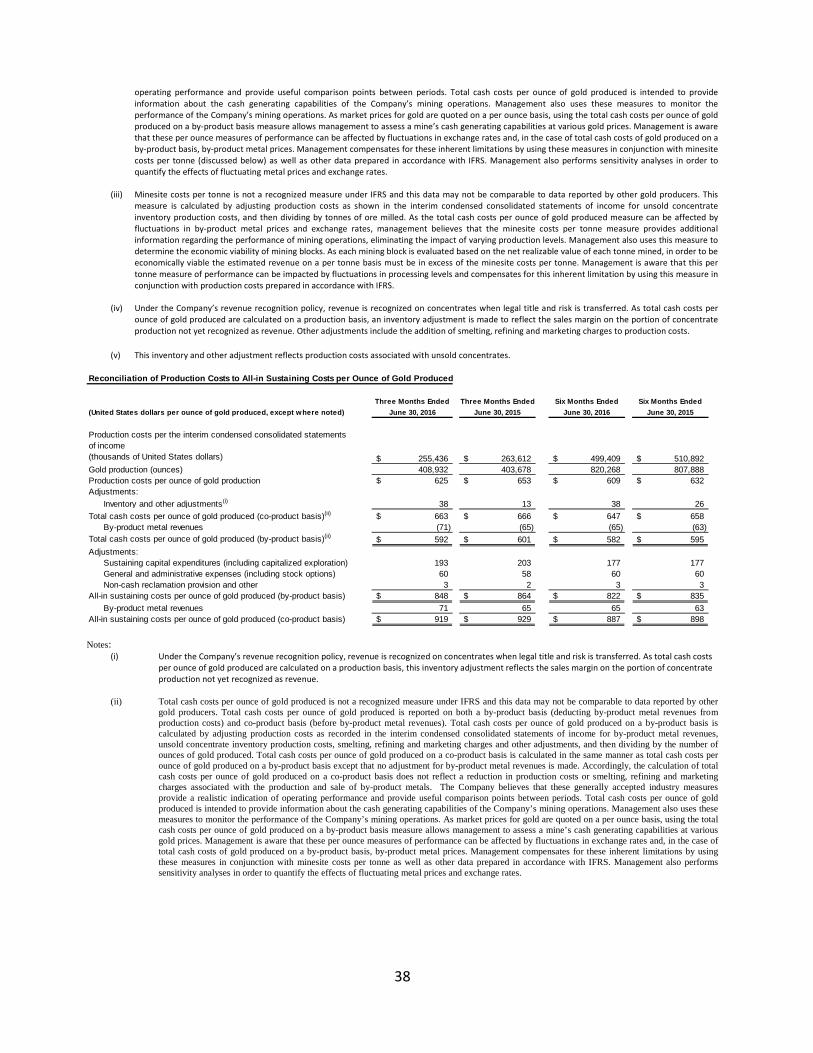
38
operating performance and provide useful comparison points between periods. Total cash costs per ounce of gold produced is intended to provide information about the cash generating capabilities of the Company’s mining operations. Management also uses these measures to monitor the performance of the Company’s mining operations. As market prices for gold are quoted on a per ounce basis, using the total cash costs per ounce of gold produced on a by-product basis measure allows management to assess a mine’s cash generating capabilities at various gold prices. Management is aware that these per ounce measures of performance can be affected by fluctuations in exchange rates and, in the case of total cash costs of gold produced on a by-product basis, by-product metal prices. Management compensates for these inherent limitations by using these measures in conjunction with minesite costs per tonne (discussed below) as well as other data prepared in accordance with IFRS. Management also performs sensitivity analyses in order to quantify the effects of fluctuating metal prices and exchange rates.
(iii) Minesite costs per tonne is not a recognized measure under IFRS and this data may not be comparable to data reported by other gold producers. This measure is calculated by adjusting production costs as shown in the interim condensed consolidated statements of income for unsold concentrate inventory production costs, and then dividing by tonnes of ore milled. As the total cash costs per ounce of gold produced measure can be affected by fluctuations in by-product metal prices and exchange rates, management believes that the minesite costs per tonne measure provides additional information regarding the performance of mining operations, eliminating the impact of varying production levels. Management also uses this measure to determine the economic viability of mining blocks. As each mining block is evaluated based on the net realizable value of each tonne mined, in order to be economically viable the estimated revenue on a per tonne basis must be in excess of the minesite costs per tonne. Management is aware that this per tonne measure of performance can be impacted by fluctuations in processing levels and compensates for this inherent limitation by using this measure in conjunction with production costs prepared in accordance with IFRS.
(iv) Under the Company’s revenue recognition policy, revenue is recognized on concentrates when legal title and risk is transferred. As total cash costs per ounce of gold produced are calculated on a production basis, an inventory adjustment is made to reflect the sales margin on the portion of concentrate production not yet recognized as revenue. Other adjustments include the addition of smelting, refining and marketing charges to production costs.
(v) This inventory and other adjustment reflects production costs associated with unsold concentrates.
Notes: (i) Under the Company’s revenue recognition policy, revenue is recognized on concentrates when legal title and risk is transferred. As total cash costs
per ounce of gold produced are calculated on a production basis, this inventory adjustment reflects the sales margin on the portion of concentrate production not yet recognized as revenue.
(ii) Total cash costs per ounce of gold produced is not a recognized measure under IFRS and this data may not be comparable to data reported by other gold producers. Total cash costs per ounce of gold produced is reported on both a by-product basis (deducting by-product metal revenues from production costs) and co-product basis (before by-product metal revenues). Total cash costs per ounce of gold produced on a by-product basis is calculated by adjusting production costs as recorded in the interim condensed consolidated statements of income for by-product metal revenues, unsold concentrate inventory production costs, smelting, refining and marketing charges and other adjustments, and then dividing by the number of ounces of gold produced. Total cash costs per ounce of gold produced on a co-product basis is calculated in the same manner as total cash costs per ounce of gold produced on a by-product basis except that no adjustment for by-product metal revenues is made. Accordingly, the calculation of total cash costs per ounce of gold produced on a co-product basis does not reflect a reduction in production costs or smelting, refining and marketing charges associated with the production and sale of by-product metals. The Company believes that these generally accepted industry measures provide a realistic indication of operating performance and provide useful comparison points between periods. Total cash costs per ounce of gold produced is intended to provide information about the cash generating capabilities of the Company’s mining operations. Management also uses these measures to monitor the performance of the Company’s mining operations. As market prices for gold are quoted on a per ounce basis, using the total cash costs per ounce of gold produced on a by-product basis measure allows management to assess a mine’s cash generating capabilities at various gold prices. Management is aware that these per ounce measures of performance can be affected by fluctuations in exchange rates and, in the case of total cash costs of gold produced on a by-product basis, by-product metal prices. Management compensates for these inherent limitations by using these measures in conjunction with minesite costs per tonne as well as other data prepared in accordance with IFRS. Management also performs sensitivity analyses in order to quantify the effects of fluctuating metal prices and exchange rates.
Reconciliation of Production Costs to All-in Sustaining Costs per Ounce of Gold Produced
Three Months Ended Three Months Ended Six Months Ended Six Months Ended(United States dollars per ounce of gold produced, except where noted) June 30, 2016 June 30, 2015 June 30, 2016 June 30, 2015
255,436$ 263,612$ 499,409$ 510,892$ Gold production (ounces) 408,932 403,678 820,268 807,888 Production costs per ounce of gold production 625$ 653$ 609$ 632$ Adjustments:
Inventory and other adjustments(i) 38 13 38 26 Total cash costs per ounce of gold produced (co-product basis)(ii) 663$ 666$ 647$ 658$
By-product metal revenues (71) (65) (65) (63) Total cash costs per ounce of gold produced (by-product basis)(ii) 592$ 601$ 582$ 595$ Adjustments:
Sustaining capital expenditures (including capitalized exploration) 193 203 177 177 General and administrative expenses (including stock options) 60 58 60 60 Non-cash reclamation provision and other 3 2 3 3
All-in sustaining costs per ounce of gold produced (by-product basis) 848$ 864$ 822$ 835$ By-product metal revenues 71 65 65 63
All-in sustaining costs per ounce of gold produced (co-product basis) 919$ 929$ 887$ 898$
Production costs per the interim condensed consolidated statements of income(thousands of United States dollars)