STOCK PRICE FLUCTUATION OF NEPALESE COMMERCIAL BANKS
87
STOCK PRICE FLUCTUATION OF NEPALESE COMMERCIAL BANKS A Thesis Submitted By Khagendra Prasad Joshi Central Department of Management Symbol No. 1145/017 T.U Registration No: 7-2-163-1-2010 Submitted in partial Fulfilment of the Requirements for the Degree of Master of Business Studies (MBS) In the Faculty of Management Tribhuvan University Kirtipur, Kathmandu December, 2019
Transcript of STOCK PRICE FLUCTUATION OF NEPALESE COMMERCIAL BANKS

STOCK PRICE FLUCTUATION OF NEPALESE COMMERCIAL
BANKS
A Thesis
Submitted
By
Khagendra Prasad Joshi
Central Department of Management
Symbol No. 1145/017
T.U Registration No: 7-2-163-1-2010
Submitted in partial Fulfilment of the Requirements for the Degree of
Master of Business Studies (MBS)
In the
Faculty of Management
Tribhuvan University
Kirtipur, Kathmandu
December, 2019

ii
Certificate of Authorship
I certify that the work in this thesis has not previously been submitted for a degree nor
has it been submitted as a part of requirements for a degree except as fully
acknowledged within the text.
I also certify that the thesis has been written by me. Any help that I have received in
my research work and the preparation of this thesis itself has been acknowledged. I
certify that all information sources and literature used are indicated in the reference
selection of this thesis.
…...………………
Khagendra Prasad Joshi
December, 2019

iii
RECOMMENDATION LETTER
It is certified that thesis entitled Stock price Fluctuation of Nepalese
commercial Bankssubmitted by Mr. Khagendra Prasad Joshi is an original piece of
research work carried out by the candidate under my supervision. Literary
presentation is satisfactory and thesis is in a form suitable for publication. Work
evinces the capacity of the candidate for critical examination and independent
judgment. Candidate has put in at least 60 days after registering the proposal. The
thesis is forwarded for examination.
…………………
Sushil Awale (Lecturer)
Thesis supervisor
Central Department of Management
Tribhuvan University, Kirtipur, Kathmandu, Nepal
Date…………………

iv
APPROVAL SHEET
We, the undersigned, have examined the thesis entitled Stock price
Fluctuation of Nepalese commercial banks presented by Khagendra Prasad Joshi,
a candidate for the degree of Master of Business Studies (MBS) semester,and
conducted the viva voce examination of the candidate. We hereby certify that the
thesis is worthy of acceptance.
…………………………….
Sushil Awale (Lecturer)
Thesis supervisor
…………………………….
Internal
…………………………….
External
…………………………….
Prof. Dr. Sanjay Kumar Shrestha
Chairperson, research committee
…………………………….
Prof. Dr. Ramji Gautam
Head of the department
Date: ………………………

v
ACKNOWLEDGEMENTS
This study entitled Stock Price Fluctuation of Nepalese Commercial Bankshas
been conducted to satisfy the partial requirements for the degree of Master of
Business Studies, Tribhuvan University.
A study of this kind would not have been possible without the help of all those who
contributed in diverse ways towards its success. Without the continued emotional
support provided by my family, I may have not reached the end of this journey.
During my studies there were times when work commitments and intermittent stress
made me believe that I would not be able to see this journey through. It was during
these times, and many others, that their words of encouragement and confidence in
my ability gave me the motivation to persist. No words of thanks can adequately
express the depth of my appreciation.
I would like to extend my immense gratitude to my supervisor lecturer Sushil Awale
for his valuable supervision and guidance in completing this study. I cannot express
the extent to which his patience and understanding allowed me to reach the end of this
journey. His encouragement, support, and, above all, his prompt, constructive and
greatly appreciated criticism and feedback, were invaluable to the research, writing,
and completion of this study.
I wish to acknowledge all lecturers and facilitators of Central Department of
Management for the various roles each one of them played towards the successful
completion of this thesis. I am grateful to Prof. Dr. Ramji Gautam, Department Head,
and Prof .Dr. Sanjay Kumar Shrestha, Research Committee Head, for timely
supervision and guidance to complete this work.
Finally, I would also like to thank my friend Jenar Maharjan, who always encouraged
and helped me to conduct this study with betterment.
Thank you.
Khagendra Prasad Joshi

vi
TABLE OF CONTENTS
Page No:
Title page i
Certificate of Authorship ii
Recommendation letter iii
Approval sheet iv
Acknowledgement v
Table of contents vi
List of table viii
List of figures ix
Abbreviation x
Abstract xi
CHAPTER I: INTRUDUCTION 1-11
1.1 Background of study 1
1.1.1 Development of Security Market in Nepal 4
1.1.2 Significance of Stock Market in Nepalese Economy 6
1.2 Statement of the problem and Research Questions 8
1.3 Purpose of Study 9
1.4 Significance of the Study 9
1.5 Limitation of the Study 10
1.6 Chapter Plan 10
CHAPTER II: LITERATURE REVIEW 12-39
2.1 Conceptual Review 12
2.1.1 Concept of Security Market 12
2.1.1.1 Common Stock 12
2.1.1.2 Theory of Common Stock Behaviour 16
2.1.2 Factors Affecting Performance of Nepalese Stock Market 22
2.1.2.1 General Factors Affecting Stock Price 23
2.1.2.2 Macro Economic Factors Affecting Stock Price 23
2.1.3 Security Market Indicates 27
2.1.4 Dematerialization 27
2.2 Review of Previous Works 29
2.2.1 Review of Genera Articles 29

vii
2.2.2 Review of Previous Thesis 29
2.2.3 Review of Nepalese Studies 33
2.3 Research Gap 38
CHAPTER III: METHODOLOGY 40-45
3.1 Research Design 40
3.2 Population and Sample 40
3.3 Sources of Data 40
3.4 Data Collection Procedures 41
3.5 Data processing Procedure 41
3.6 Data analysis tool and techniques 41
3.6.1 Financial ratios 41
3.6.2 Statistical tools 43
CHAPTER IV: RESULTS 46-57
4.1 Data presentation and analysis 46
4.1.1 Market price Per Share 46
4.1.2 Earnings Per Share 48
4.1.3 Dividend Per Share 49
4.1.4 Price Earnings Ratio 50
4.1.5 Net Worth Per Share 52
4.2 Correlation Matrix of Selected Banks 53
4.3 Major finding 54
4.3.1 Simple Regression Analysis of Dependent Variables (Y) and
IndependentVariables (X) 54
4.3.2 Major finding of secondary data 55
CHAPTER V: CONCLUSIONS 58-61
5.1 Discussion 58
5.2 Conclusions 59
5.3 Implications 60
References 62-64
Appendices 65-70

viii
LIST OF TABLES
Table no 1.1 List of Commercial Banks Studied 8
Table no 2.2 Major Nepalese Studies and their Findings 36
Table no 4.1 Market Price Per Share of Selected Commercial Banks 47
Table no 4.2 Earnings Per Share of Selected Commercial Banks 48
Table no 4.3 Dividend Per Share of Selected Commercial Banks 49
Table no 4.4 Price Earnings Ratio of Selected Commercial Banks 51
Table no 4.5 Net Worth Per Share of Selected Commercial Banks 52
Table no 4.6 Correlation Matrix of Selected Banks 53
Table no 4.7 Result of Simple Regression Analysis of Selected Banks 55

ix
List of Figure
Figure no 2.1 Conceptual Framework 39
Figure no 4.1 Quarterly Average Market Price Per Share of Selected Banks 47
Figure no 4.2 Average Earning Per Share of Selected Banks 49
Figure no 4.3 Average Dividend Per Share of Selected Banks 50
Figure no 4.4 Average Price Earnings Ratio of Selected Banks 51
Figure no 4.5 Average Net Worth Per Share of Selected Banks 53

x
ABBREVIATIONS
Avg : Average
DPS : Dividend Per Share
EBL : Everest Bank Limited
EPS : Earnings Per Share
FY : Fiscal Year
MPB : Machhapuchchhre Bank Limited
MPS : Market Price Per Share
NABIL : Nabil Bank Limited
NEPSE : Nepal Stock Exchange
No : Number
NWPS : Net Worth Per Share
P/E : Price Earnings
r : Correlation
SCB : Standard Chartered Bank
SEBON : Securities Exchange Board of Nepal
SPSS : Statistical Package for the Social Science

xi
ABSTRACT
Stock markets are the place where savings and investments are allocated effectively
which plays a key element for the development of the economy. However, high level of
fluctuation may adversely affect the financial system and makes the economy weak.
This thesis shows the data of four commercial banks from fiscal year 2013/14 to fiscal
year 2017/18. The study use Financial ratios to find out the analyze of MPS with
EPS, DPS, NWPS, P/E ratio and Statistical tool to measure mean, standard deviation,
correlation and regression analysis also by using SPSS version 23. The topic of stock
price fluctuation of commercial bank is very crucial and important to those who are
interested on it such as researcher investor etc.
It shows the dependent variable MPS has positive relation with independent
variables EPS, DPS, NWPS but having negative relation with P/E ratio. There is
positive correlation between dependent variable MPS with independent variable EPS,
DPS and NWPS but negative correlation between P/E ratio. Finally, the report shows
macroeconomic environment is good in Nepal but infrastructure situation,
technological readiness, and inefficient labour market are the main issue which
should be addressed to make Nepalese investment environment more competitive.

TABLE OF CONTENTS
Page No.
1. Background of the Study 1
2. Problem Statement and research questions 2
3. Objective of the Study 3
4. Conceptual Framework 3
5. Significance of the Study 4
6. Limitations of the Study 4
7. Literature Review 5
8. Methodology 9
8.1 Research design 9
8.2 Population and sample 9
8.3 Sources of data 9
8.4 Data collection & processing Procedure 9
8.5 Data analysis tools and Techniques 10
8.5.1 Financial Ratios 10
8.5.2 Statistical Tools 10
9. Chapter Plan 10
References

STOCK PRICE FLUCTUATION OF NEPALESE COMMERCIAL
BANKS
A Thesis
Submitted
By
Khagendra Prasad Joshi
Central Department of Management
Symbol No. 1145/017
T.U Registration No: 7-2-163-1-2010
Submitted in partial Fulfilment of the Requirements for the Degree of
Master of Business Studies (MBS)
In the
Faculty of Management
Tribhuvan University
Kirtipur, Kathmandu
December, 2019

ii
Certificate of Authorship
I certify that the work in this thesis has not previously been submitted for a degree nor
has it been submitted as a part of requirements for a degree except as fully
acknowledged within the text.
I also certify that the thesis has been written by me. Any help that I have received in
my research work and the preparation of this thesis itself has been acknowledged. I
certify that all information sources and literature used are indicated in the reference
selection of this thesis.
…...………………
Khagendra Prasad Joshi
December, 2019

iii
RECOMMENDATION LETTER
It is certified that thesis entitled Stock price Fluctuation of Nepalese
commercial Bankssubmitted by Mr. Khagendra Prasad Joshi is an original piece of
research work carried out by the candidate under my supervision. Literary
presentation is satisfactory and thesis is in a form suitable for publication. Work
evinces the capacity of the candidate for critical examination and independent
judgment. Candidate has put in at least 60 days after registering the proposal. The
thesis is forwarded for examination.
…………………
Sushil Awale (Lecturer)
Thesis supervisor
Central Department of Management
Tribhuvan University, Kirtipur, Kathmandu, Nepal
Date…………………

iv
APPROVAL SHEET
We, the undersigned, have examined the thesis entitled Stock price
Fluctuation of Nepalese commercial banks presented by Khagendra Prasad Joshi,
a candidate for the degree of Master of Business Studies (MBS) semester,and
conducted the viva voce examination of the candidate. We hereby certify that the
thesis is worthy of acceptance.
…………………………….
Sushil Awale (Lecturer)
Thesis supervisor
…………………………….
Internal
…………………………….
External
…………………………….
Prof. Dr. Sanjay Kumar Shrestha
Chairperson, research committee
…………………………….
Prof. Dr. Ramji Gautam
Head of the department
Date: ………………………

v
ACKNOWLEDGEMENTS
This study entitled Stock Price Fluctuation of Nepalese Commercial Bankshas
been conducted to satisfy the partial requirements for the degree of Master of
Business Studies, Tribhuvan University.
A study of this kind would not have been possible without the help of all those who
contributed in diverse ways towards its success. Without the continued emotional
support provided by my family, I may have not reached the end of this journey.
During my studies there were times when work commitments and intermittent stress
made me believe that I would not be able to see this journey through. It was during
these times, and many others, that their words of encouragement and confidence in
my ability gave me the motivation to persist. No words of thanks can adequately
express the depth of my appreciation.
I would like to extend my immense gratitude to my supervisor lecturer Sushil Awale
for his valuable supervision and guidance in completing this study. I cannot express
the extent to which his patience and understanding allowed me to reach the end of this
journey. His encouragement, support, and, above all, his prompt, constructive and
greatly appreciated criticism and feedback, were invaluable to the research, writing,
and completion of this study.
I wish to acknowledge all lecturers and facilitators of Central Department of
Management for the various roles each one of them played towards the successful
completion of this thesis. I am grateful to Prof. Dr. Ramji Gautam, Department Head,
and Prof .Dr. Sanjay Kumar Shrestha, Research Committee Head, for timely
supervision and guidance to complete this work.
Finally, I would also like to thank my friend Jenar Maharjan, who always encouraged
and helped me to conduct this study with betterment.
Thank you.
Khagendra Prasad Joshi

vi
TABLE OF CONTENTS
Page No:
Title page i
Certificate of Authorship ii
Recommendation letter iii
Approval sheet iv
Acknowledgement v
Table of contents vi
List of table viii
List of figures ix
Abbreviation x
Abstract xi
CHAPTER I: INTRUDUCTION 1-11
1.1 Background of study 1
1.1.1 Development of Security Market in Nepal 4
1.1.2 Significance of Stock Market in Nepalese Economy 6
1.2 Statement of the problem and Research Questions 8
1.3 Purpose of Study 9
1.4 Significance of the Study 9
1.5 Limitation of the Study 10
1.6 Chapter Plan 10
CHAPTER II: LITERATURE REVIEW 12-39
2.1 Conceptual Review 12
2.1.1 Concept of Security Market 12
2.1.1.1 Common Stock 12
2.1.1.2 Theory of Common Stock Behaviour 16
2.1.2 Factors Affecting Performance of Nepalese Stock Market 22
2.1.2.1 General Factors Affecting Stock Price 23
2.1.2.2 Macro Economic Factors Affecting Stock Price 23
2.1.3 Security Market Indicates 27
2.1.4 Dematerialization 27
2.2 Review of Previous Works 29
2.2.1 Review of Genera Articles 29

vii
2.2.2 Review of Previous Thesis 29
2.2.3 Review of Nepalese Studies 33
2.3 Research Gap 38
CHAPTER III: METHODOLOGY 40-45
3.1 Research Design 40
3.2 Population and Sample 40
3.3 Sources of Data 40
3.4 Data Collection Procedures 41
3.5 Data processing Procedure 41
3.6 Data analysis tool and techniques 41
3.6.1 Financial ratios 41
3.6.2 Statistical tools 43
CHAPTER IV: RESULTS 46-57
4.1 Data presentation and analysis 46
4.1.1 Market price Per Share 46
4.1.2 Earnings Per Share 48
4.1.3 Dividend Per Share 49
4.1.4 Price Earnings Ratio 50
4.1.5 Net Worth Per Share 52
4.2 Correlation Matrix of Selected Banks 53
4.3 Major finding 54
4.3.1 Simple Regression Analysis of Dependent Variables (Y) and
IndependentVariables (X) 54
4.3.2 Major finding of secondary data 55
CHAPTER V: CONCLUSIONS 58-61
5.1 Discussion 58
5.2 Conclusions 59
5.3 Implications 60
References 62-64
Appendices 65-70

viii
LIST OF TABLES
Table no 1.1 List of Commercial Banks Studied 8
Table no 2.2 Major Nepalese Studies and their Findings 36
Table no 4.1 Market Price Per Share of Selected Commercial Banks 47
Table no 4.2 Earnings Per Share of Selected Commercial Banks 48
Table no 4.3 Dividend Per Share of Selected Commercial Banks 49
Table no 4.4 Price Earnings Ratio of Selected Commercial Banks 51
Table no 4.5 Net Worth Per Share of Selected Commercial Banks 52
Table no 4.6 Correlation Matrix of Selected Banks 53
Table no 4.7 Result of Simple Regression Analysis of Selected Banks 55

ix
List of Figure
Figure no 2.1 Conceptual Framework 39
Figure no 4.1 Quarterly Average Market Price Per Share of Selected Banks 47
Figure no 4.2 Average Earning Per Share of Selected Banks 49
Figure no 4.3 Average Dividend Per Share of Selected Banks 50
Figure no 4.4 Average Price Earnings Ratio of Selected Banks 51
Figure no 4.5 Average Net Worth Per Share of Selected Banks 53

x
ABBREVIATIONS
Avg : Average
DPS : Dividend Per Share
EBL : Everest Bank Limited
EPS : Earnings Per Share
FY : Fiscal Year
MPB : Machhapuchchhre Bank Limited
MPS : Market Price Per Share
NABIL : Nabil Bank Limited
NEPSE : Nepal Stock Exchange
No : Number
NWPS : Net Worth Per Share
P/E : Price Earnings
r : Correlation
SCB : Standard Chartered Bank
SEBON : Securities Exchange Board of Nepal
SPSS : Statistical Package for the Social Science

xi
ABSTRACT
Stock markets are the place where savings and investments are allocated effectively
which plays a key element for the development of the economy. However, high level of
fluctuation may adversely affect the financial system and makes the economy weak.
This thesis shows the data of four commercial banks from fiscal year 2013/14 to fiscal
year 2017/18. The study use Financial ratios to find out the analyze of MPS with
EPS, DPS, NWPS, P/E ratio and Statistical tool to measure mean, standard deviation,
correlation and regression analysis also by using SPSS version 23. The topic of stock
price fluctuation of commercial bank is very crucial and important to those who are
interested on it such as researcher investor etc.
It shows the dependent variable MPS has positive relation with independent
variables EPS, DPS, NWPS but having negative relation with P/E ratio. There is
positive correlation between dependent variable MPS with independent variable EPS,
DPS and NWPS but negative correlation between P/E ratio. Finally, the report shows
macroeconomic environment is good in Nepal but infrastructure situation,
technological readiness, and inefficient labour market are the main issue which
should be addressed to make Nepalese investment environment more competitive.
TABLE OF CONTENTS
Page No.
1. Background of the Study 1
2. Problem Statement and research questions 2
3. Objective of the Study 3
4. Conceptual Framework 3
5. Significance of the Study 4
6. Limitations of the Study 4
7. Literature Review 5
8. Methodology 9
8.1 Research design 9
8.2 Population and sample 9
8.3 Sources of data 9
8.4 Data collection & processing Procedure 9
8.5 Data analysis tools and Techniques 10
8.5.1 Financial Ratios 10
8.5.2 Statistical Tools 10
9. Chapter Plan 10
References

1
CHAPTER -I
INTRODUCTION
1.1 Background of the Study
Stock market plays a vital and massive role in the economy of any country. It also
contributes in the economic development of country by promoting capital formation
and raising economic growth. Fluctuation in stock prices are occurs due to the supply
and demand forces. Financial intermediaries facilitate the transfer of funds from
various sectors. Now days, modern banking institutions have been accepted as one of
the most essential machinery to accelerate the pace of economic growth. The most
important problem of developing countries is the slow rate of economic development.
Economic development generally means development of leading sectors of the
economic like agriculture, industry, trade and commerce etc. The development of
these Sectors requires regular supply of finance. Finance serves as energy for the
economic development and financial institutions serve as reservoir for supplying and
controlling the stream of that fuel.
The liberalization of capital markets has been accompanied by the privatization of
state-owned enterprises (SOEs). In many developing and emerging market countries,
privatization programs have been enacted to stimulate the development of equity
markets as well as to increase government revenues and promote economic efficiency.
The programs helped expand the size of stock markets and enliven trading activity, as
state assets are sold through share offerings, and large privatized firms get listed.
They have also increased opportunities for investors to diversify their portfolios,
reduced investment risks, and enhanced the depth of equity markets. Mobilization of
such resources for investment is certainly a necessary condition for economic take off,
but quality of their allocation to various investment projects is an important factor for
growth. This is precisely what an efficient stock markets does to the economy
(Koirala & Bajracharya, 2003).
The price of a commodity, the economist makes us to believe is determined by the
forces of demand and supply in a free economy. Even if we accept the economists'
view, what factors influence demand and supply behavior? price? yes, but not all the
time , at least there are some other factors. In the securities market, whether the

2
primary or the secondary market, the price of equity is significantly influenced by a
number of factors which include book value of the firm, dividend per share, earnings
per share, price earning ratio and dividend cover (Gompers et al.,2003).
Financial market is the where the financial instruments such as share, bonds,
debentures etc. are traded. It consists of series of channels through which savings of
the community are made available to users of those funds. It provides a forum in
which suppliers and demanders of funds can transact business funds directly.
Financial market refers to the marketplace where buyers and sellers participate in the
trade of financial instruments. Financial assets may take different forms ranging from
the long term government bond to the ordinary shares of various companies. Short
term finance is known as money market, which is created by a suppliers and
demanders of short term funds with maturity of the one year or less than a year.
Money market allows firms to borrow funds on short term basis. Long term finance is
known as capital market, which created by a suppliers and demanders of long term
funds with maturities of more than one year. Capital market allows corporations to
gain long term funding. Financial market helps the economy in saving mobilization,
investment, national growth, entrepreneurship growth and industrial development
(Fama,1965).
Capital market, which refers to the stock exchanges and bond markets where
securities are traded, are important element of modern financial systems. Securities
are of two typesM equity securities such as share in companies, and debt securities
which includes bonds and debentures. It enables both individuals and firms to lend
their saving to those who need them, and allow companies and government to raise
long-term funds. Another important component of financial system is commercial
banks that accept deposits and grant credit. Capital market and banks co-exist and
constitute the most crucial sources of external financing for individuals, firms, and
government. They provide a means of not only distributing risks across the economy,
but also of mobilizing and channeling savings (Lindon,1996).
Stock market is an imperative part of the economy of the country. The stock market
plays an essential role in the growth of the industry and commerce of the country that
eventually affects the economy of the country to an unlimited extent. The stock
market is important from both the industry's point of view as well as investor's point

3
of view. Thus, a rising stock market is the sigh of developing industrial sector and aq
growing economy of the country (Ashaolu&Ogunmyiwa,2010).
The principal roles that stock market can perform can be stated as: First, stock market
work as a vehicle for raising capital for firms. Second, stock market can enable
investors to diversify their wealth across a variety of assets. Third, stock market can
perform a screening & monitoring role. Fourth, stock markets and other financial
intermediaries may function as complements, rather than substitutes and a stock
market that function well may have positive externalities for the rest of the financial
system.
Share or stock market is major component of the securities market. It is a place where
shares of listed companies are traded and transferred from one hand to other hand at
fair price through organized brokerage system. It creates and enhances liquidity in
securities. As government opened and brought broad financial policies in the process
of economic liberalization, various financial and insurance companies in the private
sector are established with national and international investment. Stock market plays a
significant role in the economy by channeling investment where it is needed. It works
as the channel through which the public savings are channelized to industrial and
business enterprises. These companies have to issue some of their shares to general
public. so, in order to make the public issue more transparent and to facilitate buying
and selling of securities in the secondary market, the government has framed law in
this regard and established Nepal Stock Exchange(NEPSE) and securities exchange
board, which can be considered as the favorable step towards the development of
capital market on Nepal.
Banking sector plays a vital role for the country’s economic development. Bank is a
resource mobilizing institution which accepts deposits from various sources and
invests such accumulated resources in the field of agriculture, trade, commerce,
industry, tourism etc. Hence, it is clear that the banks are extremely useful and
indispensable for a modern community. Thus, bank plays a vital role in the economic
development of developing countries like Nepal. Stock price movement has received
a great attention from both academicians and practitioners over the last two decades
because it can be used as a measure of risk in financial markets. Over recent years,
there has been a growth in interest in modeling of time-varying stock return volatility
(Shrestha & Subedi, 2016).

4
1.1.1 Development of capital/Security market in Nepal
Nepal has its own history about development of capital market. The history of
security market began with the flotation of share by Biratnagar Jute Mill Ltd. and
Nepal Bank Ltd. in 1937 AD. The ownership of shares was only within Rana Family.
Subsequently the development of capital market remained static. Almost two and half
decades later the introduction of the company act in 1964 AD and the first issuance
of government bond made in same year through Nepal Rastra Bank to collect the
developmental expenditures. It carried 6% interest rate and had the maturity period of
five years.
The process of stock market development in the country actually started in 1976 when
the government established Securities Exchange Centre (SEC) to deal in government
securities-development bonds and national savings bonds, and corporate securities of
few companies. The introduction of Security Exchange Act in 1984 provided the
systematic and favorable market environment for securities ensuring and protecting
the interest of individuals and institutional investors as well as to increase the public
participation in various forms and companies (Gurung, 1999).
With the adoption of privatization and economic liberalization policy the process gets
further impetus and the financial institution in Nepal grew at a faster pace especially
in quantitative terms. Securities exchange centre was established with the objective of
facilitating and promoting the growth of capital markets. Before its conversion into
Nepal stock exchange, it was only SEC undertaking the job of brokering,
underwriting, managing public issues, market making for government bonds and other
financial services. In 1993 government divided the SEC into two distinct entities
namely Security Board of Nepal (SEBON) and Nepal Stock Exchange Ltd. (NEPSE).
Securities Board of Nepal (SEBON) was established by the Government of Nepal on
June 7, 1993 as an apex regulator of Securities Markets. The Governing Board of
SEBON is composed of seven members. Government appoints the chairman for
tenure of four years. Other members of the Board include the representative from
government institutions as well as private institutions.
The major functions of SEBON are:
1. Provide advice to Government on matters related with the development of
capital market.

5
2. Issue necessary securities regulations and directives.
3. Register the securities of public companies.
4. Regulate and systematize the issue, transfer, sale and exchange of registered
securities.
5. Issue license to operate stock exchange.
6. Issue license to stock broker, dealer, merchant banker and fund manager.
7. Issue license to Depository Company, depository participant and credit rating
agency.
8. Register mutual funds, grant permission to operate collective investment
schemes, and supervise and monitor them.
9. Approve the bye-laws of stock exchange and Depository Company.
10. Take necessary actions to prevent insider trading or any other offenses relating
to transactions in securities in order to protect the interest of investors in
securities.
11. Establish coordination and exchange cooperation with appropriate agencies in
order to supervise and regulate matters concerning securities or companies.
12. Discharge or make arrangements for discharging such other functions as are
necessary for the development of the capital market (SEBON, 1993).
Nepal Stock Exchange Ltd. (NEPSE) is established under company act, operating
under Securities Exchange Act, 1983. It is only Stock Exchange of Nepal. It opened
its trading floor on January 13, 1994. Government of Nepal, Nepal Rastra Bank,
Nepal Industrial Development Corporation is shareholders of NEPSE. The basic
objective of NEPSE is to impart free marketability and liquidity to the government
and corporate securities by facilitating transactions in its trading floor through
member, market intermediaries, such as broker, market makers etc.
Major financial instruments trading in NEPSE include corporate shares, debentures,
government bonds and mutual funds. NEPSE introduced fully automated screen
based, order driven market trading since 2007 B.S.
Members of NEPSE are permitted to act as intermediaries in buying and selling of
government bonds and listed corporate securities. At present, there are 62 member

6
brokers and 2 market makers, who operate on the trading floor as per the Securities
Act, 2007, rules and bye-laws.
1.1.2 Significance of Stock Market in the Nepalese Economy
During last one and half decade stock market in Nepal has made some noticeable
progress. For example, between the fiscal year 1993/94 and 2017/18, the number of
listed companies in Nepal Stock Exchange Limited increased almost from 62 to 208.
Despite this, stock market in Nepal is yet at a developing stage and has yet to make its
presence felt in the overall economy of the country.
The level of stock market development and its impact on the national economy can be
measured by using various indicators such as size of stock market, liquidity,
concentration, and volatility. Impact of stock market in any economy can be judged
from its size and liquidity. Generally large stock market size indicates developed
stock market. In Nepal the number of companies listed with the Nepal Stock
Exchange Limited increase from 62 in 1993/94 to 208 in 2017/18. Although the
number of companies listed with the stock exchange shows an increase in the size of
stock market in Nepal, the market capitalization ratio indicates relatively low
importance of stock market to the national economy. It is interesting to note only
about one-tenth of the companies registered with the Office of the Company Registrar
as public limited company are listed with the Nepal Stock Exchange Limited during
the period. Most of the companies that are listed with the exchange belong to banking,
finance, and insurance sectors. While only few companies from the trading, hotel,
manufacturing, and aviation sectors are listed with the exchange, very few companies
from power, information technology, and construction sectors have entered the
organized stock exchange of the country. This indicates that firms tend to avoid stock
market as an alternative source of long-term capital in Nepal (K. C. 2004).
Capital market is a catalyst in the development of the country’s economy. It is the
intermediary link in facilitating the flow of funds from savers to investors. By
providing an institutional mechanism for mobilizing domestic and international
savings and efficiently channeling them into productive investments, they lower the
cost of capital to investors and accelerate economic growth of the country. As such,
developed economics have highly sophisticated financial institutions and capital
markets. Over the past decade or two, many developing economies have established

7
capital markets as they moved towards more liberal economic policies. These
emerging markets have shown extraordinary growth with very high volatility, which
have attracted many investors into these markets. Capital market plays a crucial role
in the economy by channeling investment where it is needed and can be put to best
use. The capital market works as the channel through which the public savings are
channeled to industrial and business enterprises. Mobilization of such resources for
investment is certainly a necessary condition for economic take off but the quality of
their allocation to various investment projects is as important as a factor for growth.
Capital market helps agents manage liquidity and productivity risk by eliminating
premature capital liquidation, which increases corporate sector productivity. Capital
market also accelerates growth indirectly by reducing liquidity risk, which encourages
firm investment (Neupane, 2006).
In recent years movement in the stock market in Nepal has shown a rising tendency.
High movement in the stock market denotes risk in equity investment. However, it
should be understood that high movement does not necessarily imply undeveloped
stock market. It is generally expected that stock markets, when well developed,
absorb risks in financial assets and offer higher return with less movement. Put
simply, it means that as an indicator of a country’s stock market development less
movement is preferred to high. A high ratio indicates the ability of the stock market to
provide liquidity and handle risk. Movement, when measured as a ratio of value-
traded-ratio to movement, showed an increasing trend during last three years
indicating inability of stock market in Nepal to handle risk relatively to volume of
trading of shares.
In the new and challenging environment, capital market would have a relatively more
important role in the allocation of resources and diversification of risks. As an integral
part and indicator of the nation’s development, the capital market represents a vital
part of the financial market infrastructure which, together with the banking sector,
supports the economic growth of the country. From a broader economic perspective,
the capital market contributes directly to national economic growth in terms of
employment and tax revenues, and indirectly through facilitating greater knowledge
development. Given the information-and technology- intensive nature of the capital
market, it will be an important facilitator of development as the nation moves towards
becoming a knowledge-based economy and with the increasing use of information

8
and communications technology. A fair, efficient and liquid capital market facilitates
the mobilization and allocation of funds within the domestic economy, and acts as a
gateway to country for global investors. Thus capital market assumes a greater role
and significance in the present day economies. (Adhikari, 2016)
Background of Commercial Banks studied
Table 1.1
List of Commercial Banks studied
S.N Name of Banks Date of operation(AD)
1 Nabil Bank Ltd. 1984/11/15
2 Machhapuchre Bank Ltd. 1998/03/08
3 Standard Chartered Bank Ltd. 1987/01/30
4 Everest Bank Ltd. 1994/10/18
(Source: Annual Report of NEPSE, 1995)
1.2Statement of the problem and research questions
In today’s context most of the investors are attractive to banking sectors. Many
researchers have been conducted in the issue of stock price movement. The stock
price fluctuates time to time and stock exchange reacts to the environment changes.
The investors couldn’t identify the good and bad stocks among many. Further, there is
not adequate number of organized investors to analyze the information regarding risk
and return of the companies in the stock market in Nepal. In this situation any
investors cannot take rational investment decision. Investor must have knowledge of
business environment, stock price behavior, sensitivity of stock price, company’s
dividend policy, company’s earning, net worth, price earnings ratio, government
policy towards general public investors. The investors are also tended to rely on the
explanatory information and do not show interest on the statistical data and technical
analysis. Since, the sufficient information of financial performance of the listed
companies has not been disseminated to the general public; the state and dynamism of
stock market suffer to the lack of transparency.
Thus, this study deals with the following research questions:

9
1. What is the trend of stock price in Nepal?
2. How earnings, dividend, net worth, and price earnings ratio affect the
stock price of the company?
1.3Purpose of the Study
The main aim of the study is basically to analyze the fluctuation of share price of
selected commercial banks of Nepal and their relationship with some variables
(Earnings per share, Dividend per share, Net worth per share, and Price earnings
ratio). Besides that the specific purpose are as follows:
1. To assess the trend of Stock Market in Nepal of Selected banks.
2. To analyze the impact of earnings, dividend, net worth, and price
earnings ratio on stock price of selected banks.
1.4 Significance of the study
Every people are attracted to invest in share for purpose of getting more return as well
as to maximize his or her wealth. So an analysis of sensitivity of share price in
Nepalese stock market has become an effective way to attract new investors. The
study will be significant for individual investors who are willing to trade in securities
of Nepalese and multinational organization. This study also will be helpful to
understand the share price of the various listed companies in Nepal. It will be helpful
to related person like policymakers, shareholders, management and all parties
involved in Nepalese share market. This study may help investors to think about
restructuring their investment portfolio. Similarly, the potential investors may take
better timely investment decision on the basis of the finding of the study. The finding
will be importance for the further researches and scholars who are related to Nepalese
stock market.
This study helps us to find out possibilities, problems, and prospects of stock market
in Nepal. It will also help to out the financial status of the selected banks. Therefore,
this study is expected to helpful for general investor and organizations thatare related
with stock market.

10
1.5 Limitations of the Study
The following are some limitation of the study:
1. The topic "stock price movement " (analysis of selected banks) is much more
dynamic and it takes huge resources including human and financial to cover
the whole aspects of the research but the research has focused only on the
stock price movement due to changes in EPS , DPS , NWPS , and P/E ratio as
independent variable.
2. The dependent variable, market price per share used in this study is computed
only on the basis of the average of quarterly average price of the stock in a
year.
3. The study is mainly concentrated on the stock price movement of five
commercial banks. Because banks have just merged with some development
banks and finance companies and some are in process of merger.
4. This study included the observation period of 5 years from FY 2013/014 to
2017/18 of 5 commercial banks.
5. The result is strictly based on information provided by secondary source the
company's website, SEBON, NEPSE, NRB etc.
1.6 Chapter Plan
The study will be organized into five chapters, as per the standard rule of thesis
writing of Tribhuvan University, which is as follows:
Chapter I: Introduction
This Chapter will include the background of the study, focus of the study, statement
of the problems, objectives of the study, significance of the study, limitations of the
study, and organization of the study.
Chapter II: Literature Review
This chapter includes the reviews of the relevant previous writing and the studies to
find the existing gaps. So, the past studies in relation to the concerned topic will be
reviewed to examine what new can be contributed to make the study more relevant.
Reviews of the journals, books, newspapers, annual reports are also going to be
included.

11
Chapter III: Methodology
This chapter deals with the methodology used in the study. It briefly explains about
the statistical tools which will be used to evaluate the risk and return analysis for the
concerned topic. It will consist of the research design, population and sample, sources
of data, data collection procedure, data analysis tools and methods of data analysis.
Chapter IV: Results
This chapter will comprise the main part of the study. It deals with the presentation
and analysis of the data and information collected from primary as well as secondary
sources and scoring the empirical findings of the study through definite course of the
research methodology.
Chapter V: Summary, Conclusions and Implications
This chapter will state the summary of the whole study. After the summary it will be
followed by the basic conclusions of the study based on the fourth chapter and lastly,
the recommendations will also be presented for considerations on the basis of the
conclusions.

12
CHAPTER-II
LITERATURE REVIEW
The main objective of this chapter is to review some of the basic literature on share
price behavior and movement as well as review of empirical evidences of previous
studies. This chapter is divided into two sections. The first section includes review of
previous studies, and second section includes conceptual framework.
2.1 Conceptual review
2.1.1 Concept of Security Market
A security market, or financial market, can be defined as a mechanism for bringing
together buyers and sellers of financial assets in order to facilitate trading. One of its
main functions is “price discovery” that is, to ensure that security prices reflect
currently available information. Financial markets are the ones in which funds are
transferred from those who have excess available to those who have a shortage in
encouraging higher economic efficiency.
The securities market plays an important role in mobilizing savings, and channeling
them into productive investment for the development of commerce and industry of the
country. The trading of securities generates sufficient liquidity and profit through
efficient allocation of fund. The security market in any country performs two
important functions:
a) It facilitates the transfer of real economic source from the saver to the users
b) It makes funds available to economically efficient borrowers to carry out their
plans and activities of business and industry
2.1.1.1 Common Stock
Common stock refers the ownership capital of a company. It is one of the important
sources of capital of the company. No other securities are as important as common
stock because it commands largest share in the market. Many investors are interested
in common stock because it provides higher return though with greater risk. Common
stock is also known as equity share representing ownership interest in the
organization. The company issues common shares to raise equity capital, which is

13
permanent capital of the company because common stock has infinite life. The
common stockholder or shareholders are real owner of the company, therefore, they
bear all kinds of risk associated with the company and have residual claim on income
and assets.
There are mainly two parties that trade the stock i.e.
a) Vendor or Company.
b) Buyer or Stockholder
Vendor Companies issues the equity share in the security market and purchasing
companies purchase theirs’ stock to be an owner of the company. These kinds of issue
may be in lump sum basis or installment basis. “There are shares which don’t carry
any special or preferential rights in the payment of annual dividend or repayment of
capital. The rate of dividend on such shares is not fixed. Dividend on equity shares is
paid out of the residual profits left after paying interest on debentures and preference
shares dividend. Similarly, equity shareholders are paid at the time of winding up to
receive what is left after all the prior claims have satisfied. Therefore, equity
shareholders are the real risk bearers. They also enjoy voting right in the management
and control of the company”. While issuing the equity share, company can achieve
great advantages i.e.
Permanent Capital: Equity shareholders provide the permanent capital to the
company. There is no any obligation to return the money except at the time of
liquidation of the company.
No Obligation for Dividend: Equity shares do not impose an obligation to
pay a fixed dividend but are payable only if the company has adequate profit.
Sources of Prestige: A company with substantial equity capital has a high
credit standing. Creditors readily lend money to it because they regard
company is not required to mortgage or pledge it’s assets for issuing common
stock. The assets remain free of charge for borrowing money in future.
“Common stockholders of a corporation are its residual owners, their claim to income
and assets come after creditors and preferred stockholders have been paid in full. As a
result, a stockholder’s return on investment is less certain than the return to a lender or
to a preferred stockholder. On the other hand, the return to a common stockholder is

14
not bounded on the upside, as are returns to the others. A company should not issue
stock at a price less than par value, because stockholders who bought stock for less
than par value would be liable for the difference between below the par price they
paid and the par value.” (Van Horne, 1997)
Usually common stock is issued with a perpetual life. These stocks are subjected to
issue and trading in primary market where it is generally issued with its face value
and once the stock gets listed in the stock exchange the trading starts to take place and
this particular market is called secondary market. Each share of stock is a fraction of
the rights that belongs to the owners of a business. A stock certificate is evidence of
that fractional ownership; it is tangible evidence, a certificate of title, to be a part of
the company.
Value of the Common Stock
There are mainly three kinds of value of the common stock:
• Par Value
• Book Value
• Market Value
Par Value
The par value is nominal or face value of a stock indicated in common stock
certificate and in the company’s Memorandum of Association. According to the
company Act 2053, par value of a share of common stock must be Rs. 100 for
Nepalese Company. In Nepal, the company cannot issue common stock at a price less
than par value (i.e. at discount).
Book Value
It represents the assets value per share after entire obligation of the corporation is met
and is calculated by dividing the total shareholder equity on the buying and selling by
number of equity shared outstanding.
Market Value
This value is based on the market demand and supply. Market value is determined by
the demand and supply factors and reflects the negotiation between investor and seller
for the transaction. The market value is influenced by many factors like economic and

15
industry condition, expected earnings and dividends, speculations and other signaling
effects like major events inside the country, Governments stability.
Features of Common Stocks
Study of the key features of common stocks would be the important to find out the
causes of stock price movement. Common stockholders are the true owner of the
business firm. Common stockholders are the residual owner in the same that they
received what is left after all other claims on the firm’s income have been satisfied.
The main positive consideration involve in equity ownership are income and control.
The key features of common stock are:
Par Value
The par value is nominal or face value of a stock indicated in common stock
certificate and in the company’s Memorandum of Association. According to the
company Act 2053, par value of a share of common stock must be Rs. 100 for
Nepalese Company. In Nepal, the company cannot issue common stock at a price less
than par value (i.e. at discount).
Dividend
The common stockholders invest in stock of the company with the expectation of
dividend. But the dividend of common stock is not fixed. It depends upon the earning
of the company and dividend policy. Common stockholders are the real owner of the
company, therefore they have residual claim on income. So the company may
distribute the residual income as dividend to common stockholders or retain some part
or all the residual earnings. The form of dividend may be cash or common stock.
Maturity
The common stock has no maturity date. It is not returned to stockholders until the
company is dissolved. It exists as long as a firm does. So, the capital raised by the sell
of common stock is also called the permanent capital of the company.
Claim on Assets
As, a real owner of the company, the common stock holders bear all kinds of risk and
benefit associated with the company. Therefore, shareholders of common stock have
claim on all residual assets either more than their investment or less, in case of the
liquidation of the company.

16
Liabilities
Liability of common stockholders is limited to the extent of their capital investment.
The liability of shareholders will be equal to par value of common stock if paid up
capital is less than par value. Shareholders should not pay the debt of the company
from their private property, if company fails to pay debt in case of the liquidation.
Voting Right
The common stockholders have right to attend general meeting for voting, amend the
charter of the company and pass the resolution. Shareholders have voting right
according to the number of stocks held by them. The voting system may be straight or
cumulative. In straight voting system, each share has one vote for each director.
Under the cumulative voting system, the shareholder can use all his or her votes for a
single director. The shareholders can transfer their voting right to their person by
using proxy.
Preemptive Rights
Preemptive right is the right of existing shareholders to purchase new securities on a
pro-rata basis if the company issues new additional common stock or convertibles.
The preemptive right is included in the charter or bylaws. Preemptive right enables
existing shareholders to maintain control over the company and it protects
shareholders against a dilution of vale of stocks. The preemptive right is carry out by
the use of right offering.
2.1.1.2 Theories of Common Stock Behavior
Basically, there are three theories concerning the valuation of securities and their
price behavior. They are i. Technical Analysis ii. Fundamental Analysis iii. Random
Walk or Efficient Market Analysis
Technical Analysis
Technical analysis involves the study of stock market prices in an attempt to predict
future movement. Under this analysis, past prices are examined to identify recurring
trends or patterns in price movements. Some of the important tools like charts,
moving average, relative strength, and contrary opinions are used to analyze the price
situation of individual common stock. On the other hand tools like Dow Theory,
Breath the market, Confidence Index are used to analyze the stock market as a whole.

17
Technical analysis is the study of the internal stock exchange information. The word
“technical” implies a study of the market itself and not of those external factors which
are reflected in the market all the relevant factors, whatever they may be, can be
reduced to the volume of the stock exchange transactions and the level of share prices;
or more generally, to the sum of the statistical information produced by the market.
(Alexander, Sharpe & Bailey, 2000)
The technical Analysis Theory of share price behavior is based on the past market
information. On the assumption that history tends to repeat itself, it is believed that
knowledge of past patterns of share prices will help to predict future prices under
similar circumstances. It involves the study of past market behavior with reference to
various financial and economic variables to forecast the future. Financial and
economic variables do change, but these variables are to be adjusted in the light of the
present situation. Charles Dow is the greatest protagonist of this theory. Since the
followers of this theory anticipate future share prices on the basis of charts and graphs
of past movements in prices, this approach is popularly known as Chartist Approach.
Thus, under this approach technicians are interested to interpret the past trend to
predict the future prices of equity shares. Technical Analysis is based on the widely
accepted premise that security prices are determined by the supply and demand. The
tools of Technical Analysis are therefore designed to measure supply and demand.
Technical analyst record historical finance data on charts, which can be meaningful in
predicting future prices. The basic assumptions underlying technical analysis are:
Market value is determined by the interaction of supply and demand,
Supply and demand is governed by numerous factors both rational and
irrational,
Security prices tend to move in trends that persist for an appreciable length of
time, despite fluctuation in the market.
Change in trend is caused by shifts in supply and demand,
Shifts in supply and demand, no matter why they occur, can be detected
sooner or later in charts of market action, and
Some chart patterns tend to recur and the recurring patterns can be used to
forecast the price movement.

18
Technical analysts, or chartists, believe that they can discern patterns in price or
volume movements, and that by observing and studying the past behavior patterns to
given stocks, they can use this accumulated theoretical information to predict future
price movements in the security. Technical analyst believes in the history behind chart
formation and patterns. They read charts much like ancient astrologers read the stars,
looking for “head and shoulders” formation. When the supply of a stock is greater
than the demand, the trend will be down as there are more sellers than buyers; when
demand exceeds supply, the trend will be up as buyers “bid up” the price; and if the
forces of supply and demand are nearly equal, the market will move sideways which
is called a “Trading Range”. Eventually, new information will enter the market and
the market trend will begin to go either up or down.
Depending whether the new informant is taken as positive or negative. Trend which
are very brief are called minor trends; those lasting a few weeks are known as
Intermediate Trends; and trends for a period of months are major trends. It helps us to
act in market both in bullish and bearish market. Price moves in trends. A trend
indicates there exists an inequality between the forces of supply and demand. Such
changes in the forces of supply and demand usually are readily identifiable by the
action of the market itself as displayed in the prices. (Alexander, Sharpe & Bailey,
2000)
Fundamental Analysis
The fundamental analysis tries to identify the real or true value of financial assets.
Fundamental analysts forecast, among other things, future levels of the economy
gross domestic product, future sales and earnings for a large number of industries, and
future sales and earnings for a larger number of firms. Eventually such forecasts are
converted to estimates of expected returns of specific stocks and perhaps, certain
industries and the Stock Market itself. In some cases the conversion is explicit.
(Alexander, Sharpe & Bailey, 2004)
Fundamental analysis forecast stock market on the basis of economic, industry, and
company statistics. The principal decision variables ultimately take the form of
earning and dividends. The fundamentalist makes a judgment of the stocks with risk
return framework based upon earnings power and the economic situation of the
country.

19
Some of the way to go through with the fundamental analysis may be following:
a. Top Down Versus Bottom-Up Forecasting
Under top down analysis approach the analysis is done by making forecast for the
economy, industries, and companies. The industries forecast are based on the forecast
for the economy and a company’s forecast are based on the forecast for the economy
and a company’s forecast are based on the forecasts for both its industries and the
economy likewise while doing bottom up forecasting estimation of the prospects for
the companies is down and then only estimation of the prospects for the companies is
down and then only estimation of the prospects for the industries in carried out and
ultimately the economy’s prospects is conducted.
b. Probabilistic Forecasting
Probabilistic forecasting often focuses on economy wide forecasts, as uncertainty at
this level is of the greatest importance in determining the risk and expected return of
well-diversified portfolio. A few alternatives economic sceneries may be forecasts
along with their respective probability of occurrence. Then accompanying projections
are made of the prospects for industries, companies and stock prices. Such exercise
provides an idea of the likely sensitivities of different stocks to surprises concerning
the economic and hence it sometimes referred to as what if analysis.
c. Financial Statement Analysis
A company’s financial statement can be regarded as the output of a model of a firm.
Many analysts do study financial statement to predict the future. Financial statement
analysis can be help an analyst to understand a company’s current situation where it
may be going, what factors affect it and how these factors affect it. To fully
understand a company and comparing this with other financial statements are required
to analyze carefully to determine the value of the firm. The price of the share can be
estimated by examining the ratio of earning, after tax to the book value of equity.
Random Walk-Efficient Market Theory
“Random walk efficient market theory consists of the study of random walk or
efficient market hypothesis. In 1900 a French mathematician, Louis Bachelor wrote a
scientific paper suggesting that day to day security price fluctuation were random. His
idea is known as the Random Walk Theory” (Coother, 1962). These tests to see if

20
stock price fluctuate randomly used to be called test of the “random walk theory” of
stock prices. “The random walk efficient theory is a completely at variance with the
technical and fundamental analysis. A number of empirical researcher have been done
on varied set of data for different time periods to test the random walk efficient
market model for describing share price behavior.
a. The Random Walk Hypothesis (RWH)
The random walk hypothesis is a financial theory stating that stock
market prices evolve according to a random walk and thus cannot be predicted. It
is consistent with the efficient-market hypothesis. The work from of efficient
market hypothesis stipulates that historical price and volume data for securities
contain no information which can be used to earn a trading profit above what
could be attained with a buy-an-hold investment strategy. The random walk
hypothesis states that current price fully reflect the information contained in the
Historical price movement. “The previous prices or the series of price changes are
random phenomenon.
Random walk theory implies that the future path of the price level of a security is no
more predictable than the path of a series of cumulated random numbers. The series
of price changes has no memory, that is, the past cannot be predicting the future in
any meaningful way. It means that current size and direction of price changes is
independent and unbiased outcome of previous price changes” (Fama, 1965).
b. The Efficient Market Hypothesis (EMH)
A perfectly efficient market is a market in which all investors have access to all
relevant information in which news Library that affects stock market is immediately
available through the market. “An efficient financial market exists when security
prices reflect all available public information about the economic, about financial
markets, and all about the specific company involved” (Vanhorne, 1998).
“An efficient capital market is one in which it is impossible to earn an abnormal
return by trading on the basis of publicly available information” (Brown, 1978).
According to Fama, an efficient market share prices instantaneously and fully reflect
all relevant available information, which is known as the efficient market hypothesis.
The market efficiently of any stock is based on how fast the available new
information reflects on the security price adjustment. The favorable information

21
results in an upward revision and unfavorable information push downward revision of
security price. However, the assumptions to the efficient market being perfect capital
market are:
information freely and instantaneously available to all
homogeneous product
no taxes
costless transactions
Perfect competition amongst investors
“If new information becomes known about a particular company, how quickly do
market participants find out about the information and buy or sell the securities of the
company on the basis of the information? How quickly do the prices of securities
adjust to reflect the new information? If price respond to all relevant new information
in a rapid fashion, we can say the market throughout the market, and if investors take
time in analysis the information and reacting and possibly overreacting to it, prices
may deviate from values based on a careful analysis of all available relevant
information. Such market could be characterized as being relatively inefficient”
(Haugen, 1997).
In a major review of the theoretical an empirical work done in capital market, (Fama,
1970) proposed three information subsets by which the efficient market model could
be appraised and tested. These three are weakly efficient, semi strongly efficient and
strong form efficient. The weak form efficient market hypothesis (WEMH) assumes
that all past information is reflected in security prices. In this market past information
has already been discounted in price, so excess profit cannot be derived from the
investment strategy based on past information. If current prices of the stocks reflect
all the publicly available information i.e. past prices and volume data and all the
published accounting information, the market is semi strongly efficient. In that
market, even fundamental analysis of the published accounting information has no
value, because participates would have discounted it accurately and instant annually
when they are disclosed.
And the Strong Form Efficient Market Hypothesis (SEMH) assumes that all
information affecting stock prices, both public and private is reflected in security

22
prices thus, in such condition even those who have access to private information
cannot consistently earn excess return. The measure of efficiently evolved from the
notion of perfect competition, which assumes free and instantly available information,
rational investors with no taxes or transaction cost.
2.1.2 Factors Affecting Performance of Nepalese Stock Market
Over the years, economists, financial analysts, academicians and researchers have
conducted numerous researches on the impact of macroeconomic variables on stock
prices in the United States and other developed economies. Interest in financial
markets and the efforts to forecast their performance is connected to the growing
recognition among economists, financial analysts, and policy makers of the increasing
impact of macroeconomic variables on these markets.
Most investors have shifted their attention to the stock markets and so over the last
decade stocks of some listed companies have been oversubscribed. Investing in stocks
provides a higher return than the other financial instruments but there are also risks
associated with these stocks. Most investors invest in the stock market with the
objectives of maximizing their return without taking into consideration the effect of
macroeconomic variables such as inflation, and exchange rate on the stock prices of
companies listed.
Nepalese stock market has witnessed spectacular change in the recent decades. The
economic instability in the global and national context has made its influence on the
market movement. Arbitrage Pricing Theory states the relationship between stock
market and macroeconomic determinants. The stock market of emerging economics
like Nepal carries huge expectations of the investors.
It is essential that the policymakers must keep eyes on the stock market development
and be ready to take appropriate measures, if needs arise, to prevent the buildup of
bubbles in the market. For this, it is necessary to understand the relationship between
the stock index and the factors that influence it. Several factors may affect the stock
market such as economic growth, government policies, financial literacy, political
stability, external stability, etc. However, which factors affect to what degree will
vary from country to country, depending on the size, type and other characteristics of
the economy and the market. There are various factors that affect the stock price and

23
cause movement in the stock price up and down. The factors are summarized as
below:
2.1.2.1 General Factors Affecting Stock Price
Industry Performance
The stock price of the companies in the same industry will move in cycle with each
other. This is because market conditions generally affect the companies in the same
industry the same way. But sometimes, the stock price of a company will benefit from
a piece of bad news for its competitor if the companies are competing for the same
market.
Investor Sentiment
Investor sentiment or confidence can cause the market to go up or down, which can
cause stock prices to rise or fall. The general direction that the stock market takes can
affect the value of a stock.
Bull market – it is a strong stock market where stock prices are rising and
investor confidence is growing. It’s often tied to economic recovery or an
economic boom, as well as investor optimism.
Bear market – it is a weak market where stock prices are falling and investor
confidence is fading. It often happens when an economy is in recession and
unemployment is high, with rising prices.
2.1.2.2 Macroeconomic Factors Affecting Stock Price
Evidence from the financial theory suggest that as the global financial markets
become more liberalized, there has been a close relationship between stock returns
and the macroeconomic variables including interest rates, exchange rate, Gross
Domestic Product(GDP), inflation, money supply, etc. These variables have been
viewed as the most important determinants of stock market behavior as they are used
to describe the state of macro economy that an investor must monitor and forecast in
order to make choices regarding their investment decisions (Junkin, 2012).
1. Monetary Policy
Monetary policy is the process by which the monetary authority of a country controls
the supply of money, often targeting an inflation rate or interest rate to ensure price

24
stability and general trust in the currency. The goal of monetary policy is to contribute
to economic growth and stability, to lower unemployment, and to maintain
predictable exchange rates with other currencies. The monetary policy may be
expansionary as well as contractionary. A policy is referred to as contractionary if it
reduces the size of the money supply or increases it only slowly, or if it raises the
interest rate. An expansionary policy increases the size of the money supply more
rapidly, or decreases the interest rate.
Interest rates
The interest rate on borrowing can largely influence the stock price. The central bank
of Nepal i.e. Nepal Rastra Bank can raise or lower interest rates to stabilize or
stimulate the Nepalese economy. This is known as monetary policy. High interest rate
regimes lead to high cost of borrowing and hence a reduction in economic activity.
This affects the company’s profit, future cash flow of the business and dividend. As a
result, its share price may drop. Moreover, changes in both short term and long-term
rates are expected to affect the discount rate in the same direction through their effect
on the nominal risk-free rate (Mukherjee and Naka, 1995). And, in times of higher
interest rates, investments that pay interest tend to be more attractive to investors than
stocks. Therefore interest rates are expected to be negatively related to market returns
either through the inflationary or discount factor effect.
Inflation
Inflation means higher consumer prices. This often slows sales and reduces profits.
Higher prices will also often lead to higher interest rates. For example, during
inflation Nepal Rastra Bank may raise interest rates to slow down inflation. These
changes will tend to bring down stock prices. Commodities however, may do better
with inflation, so their prices may rise. High rate of inflation increase the cost of
living and a shift of resources from investments to consumption. This leads to a fall in
demand for market instruments which lead to reduction in the volume of stock traded.
Also the monetary policy responds to the increase in the rate of inflation with
economic tightening policies, which in turn increases the nominal risk – free rate and
hence raises the discount rate model (Adam & Twenoba, 2008). High Inflation affects
corporate profits, which in turn causes dividends to diminish. Consequently, the
expected return of stocks decreases thereby causing stocks to depreciate in value.

25
Conversely, low inflation implies lower cost of borrowing. Corporate performance
goes up leading to increase in production and corporate profit. This results in the
payment of attractive dividends by companies. So, inflation has negative relationship
with share price (Shrestha & Subedi, 2014).
Exchange Rates
Establishing the relationship between stock prices and exchange rates is important.
Knowledge about the link between currency rates and other assets in a portfolio is
vital for the performance of the fund. Stock prices are expected to react ambiguously
to exchange rates. Depreciation could either raise or lower the value of a company,
depending on whether the company mainly imports or mainly exports. When the
stock market index is considered, the net effect cannot be predicted. The exchange
rate has various effects on stock price. First, a depreciating currency causes a decline
in stock prices because of expectations of inflation (Ajayi & Mougoue, 1996).
Second, foreign investors will be unwilling to hold assets in currency that depreciates
as that would erode the return on their investment. Third, the effect of exchange rate
depreciation will be different for each company depending on whether it imports or
exports more, whether it owns foreign units, and whether it hedges against exchange
rate fluctuation. Heavy importers will suffer from higher costs due to weaker
domestic currency and will have lower earnings, thus lower share prices.
2. Fiscal Policy
Fiscal policy is the policy administered by the government of nation and it deals with
the use of government revenue collection mainly tax and expenditure to influence the
economy. The two main instruments of fiscal policy are changes in the level,
composition of taxation, and government spending in various sectors. These changes
can affect the aggregate demand, saving and investment and distribution of income.
As government deficits increase the supply of government debt, government bond
prices fall and their yields rise in the absence of greater demand. In this scenario,
government deficits induce investors to allocate more of their portfolio toward
government debt. This reallocation away from equity leads to higher expected equity
returns. An alternative flight-to-quality scenario has government bond prices and
deficits both increasing as investors demand less risky government debt in bad
economic conditions. In both scenarios, government deficits are associated with

26
higher expected equity returns although bond yields are lower and higher,
respectively. However, as a result of balanced budget amendments, cumulative debt
ratios are relatively stable for state governments since deficits are eventually offset by
surpluses. Thus, dynamic portfolio allocations attributable to state-level fiscal policies
are unlikely to affect long-term equity returns (Daniel, 2006).
3. Political Events
Company stock prices and the stock markets in general can be influenced by world
events such as war, civil unrest and terrorism. These influences can be direct and
indirect and they often occur in chain reactions. Political events which can affect the
stock markets are government elections. Elections impact on a country’s currency and
are viewed by traders as a case of potential political instability and uncertainty which
typically equates to greater volatility in the value of a country’s currency.
Political events can therefore have a profound effect on stock markets and seasoned
investors often take advantage of this volatility. While it is very difficult to plan for
the unexpected in the markets during these unsettling times, an informed trader will
be quicker to react to global events than one who is unsure of what moves to make in
their wake. Researching relevant information and following the trends in times of
political conflict or uncertainty will allow you to make quick, informed decisions
regarding your trading activities so that you can ultimately maximize your profits
(Kithinji,A, 2005).
For example: On August 10, 2015 NEPSE had soared due to the latest political
development. “The expectation that the political situation will go in a positive way in
the future has attracted investors in the stock market”, and the domestic capital market
was highly influenced by political developments. The index leaped to 1,057.44 points
from 1,040.39 within 10 minutes of opening. And political instability has negative
impact on stock price and stock market. An effect of undeclared economic blockade
imposed by India was felt in Nepal Stock Exchange Limited (NEPSE). During the
blockade the NEPSE index went down and the stock market grew, due to easing of
the Indian blockade, mergers of a number of financial institutions, companies offering
bonus and right shares.

27
2.1.3 Security Market Indices
Security market index is an indicator that indicates the performance of security market
of a particular time on the basis of overall change in overall change of securities
prices in a particular stock exchange. Index is one of the most important indicators of
secondary market which is also considered as barometer of country’s economy.
NEPSE index group consists of various indices and they are calculated on the basis of
market capitalization. Out of them overall NEPSE index is the oldest one which is
being calculated since 1994.
NEPSE Index is calculated by considering all listed shares including that of promoter
shares of all listed companies in Nepal Stock Exchange Limited.
2.1.4 Dematerialization (Demat)
Dematerialization is the process by which physical certificates of an investor are
converted into an equivalent number of securities in electronic form and credit into
the Beneficial Owner’s (BO) account with his/her DP (Depository Participant). This is
a form of indirect holding system where an intermediary, such as a broker or central
securities depository holds a record of the ownership of shares usually in electronic
format. The dematerialization of securities such as stocks has been a major trend since
the late 1960s, with the result that by 2010 the majority of global securities were held
in dematerialized form.
In Nepal SEBON issued a notice on katika 2076 regarding compulsorily opening of
Demat account and trading of securities through Demat account only. Demat is
opened by the investor while registering with Depository Participant (DP). A
Depository Participant (DP) is an agent of the depository through which it interfaces
with investor and provides depository services. There are around 60 licensed
DPs/Brokers in Nepal.
However, the phenomena of dematerialization of securities issued by large firms is
mostly undertaken via Central Securities Depository, a national or regional institution
holding the notary function, such as CDS and Clearing Limited, a company
established under company act, promoted by Nepal Stock Exchange (NEPSE) in 2010
to provide centralized depository, clearing and settlement services in Nepal. The main
objective of the company is to act as a central depository for various instruments
(Equity, Bonds, and Warrants etc) especially to handle securities in dematerialized

28
form. This organization is entrusted with the safekeeping, deposit, and withdrawal of
securities certificates and transfer of ownership/rights of the said instruments. The
depository functions will be performed by the company under the securities
regulations of Securities Board of Nepal (SEBON).
The Dematerialized account number is quoted for all transactions to enable electronic
settlements of trades to take place. Every shareholder will have a Dematerialized
account for the purpose of transacting shares. Access to the Dematerialized account
requires an internet password and a transaction password. Transfers or purchases
of securities can then be initiated. Purchases and sales of securities on the
Dematerialized account are automatically made once transactions are confirmed and
completed.
According to report as of October, 2019 of CDS and Clearing Limited there are
560,889 Demat account opened and 1,145,363,662 shares are in demat form.
The advantages of demat are enumerated as follows:
Easy and convenient way to hold securities
Immediate transfer of securities
No stamp duty on transfer of securities
Safer than paper-shares (earlier risks associated with physical certificates such as
bad delivery, fake securities, delays, thefts etc. are mostly eliminated)
Reduced paperwork for transfer of securities
Reduced transaction cost
No "odd lot" problem: even one share can be sold
Change in address recorded with a Depository participant (DP) gets registered
with all companies in which investor holds securities eliminating the need to
correspond with each of them separately.
Automatic credit into demat account for shares arising out of bonus/split,
consolidation/merger, etc.
Traders can work from anywhere (e.g. even from home).
There are some disadvantages of opening demat account. They are enumerated as
follows:
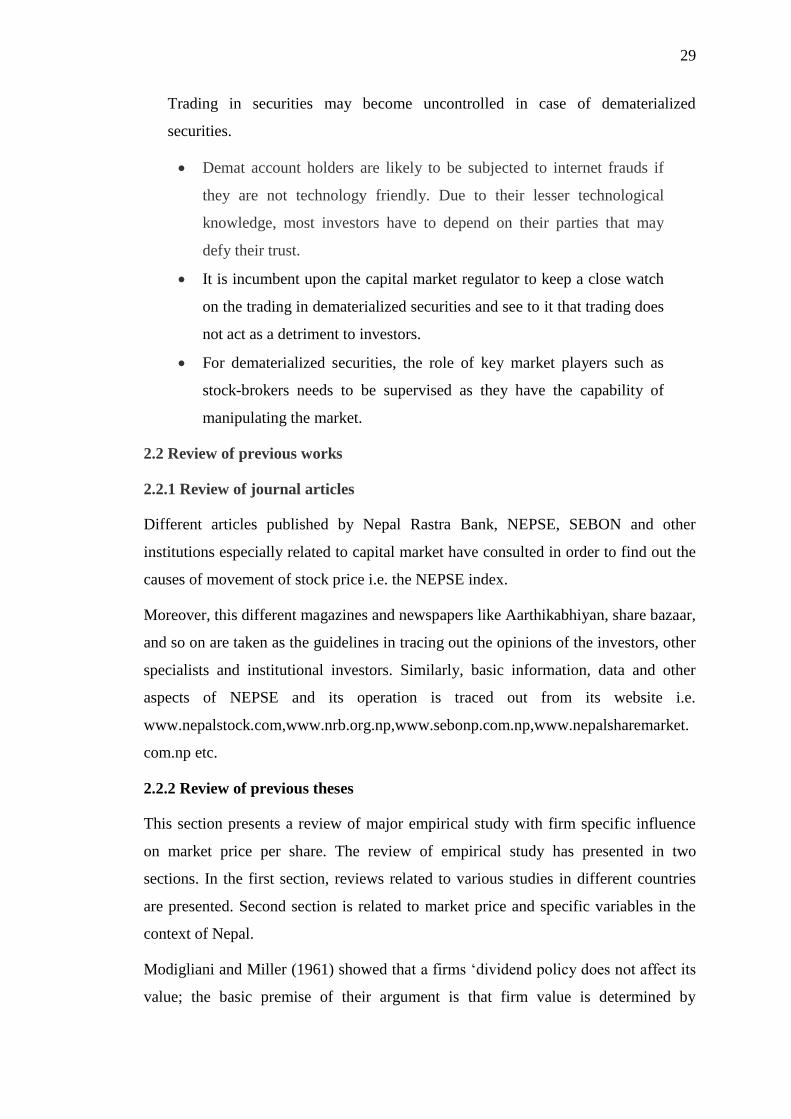
29
Trading in securities may become uncontrolled in case of dematerialized
securities.
Demat account holders are likely to be subjected to internet frauds if
they are not technology friendly. Due to their lesser technological
knowledge, most investors have to depend on their parties that may
defy their trust.
It is incumbent upon the capital market regulator to keep a close watch
on the trading in dematerialized securities and see to it that trading does
not act as a detriment to investors.
For dematerialized securities, the role of key market players such as
stock-brokers needs to be supervised as they have the capability of
manipulating the market.
2.2 Review of previous works
2.2.1 Review of journal articles
Different articles published by Nepal Rastra Bank, NEPSE, SEBON and other
institutions especially related to capital market have consulted in order to find out the
causes of movement of stock price i.e. the NEPSE index.
Moreover, this different magazines and newspapers like Aarthikabhiyan, share bazaar,
and so on are taken as the guidelines in tracing out the opinions of the investors, other
specialists and institutional investors. Similarly, basic information, data and other
aspects of NEPSE and its operation is traced out from its website i.e.
www.nepalstock.com,www.nrb.org.np,www.sebonp.com.np,www.nepalsharemarket.
com.np etc.
2.2.2 Review of previous theses
This section presents a review of major empirical study with firm specific influence
on market price per share. The review of empirical study has presented in two
sections. In the first section, reviews related to various studies in different countries
are presented. Second section is related to market price and specific variables in the
context of Nepal.
Modigliani and Miller (1961) showed that a firms ‘dividend policy does not affect its
value; the basic premise of their argument is that firm value is determined by

30
choosing optimal investments. The net payout is the difference between earnings and
investments, and simply a residual. Because the net payout comprises dividends and
share repurchases, a firm can adjust its dividends to any level with an offsetting
change in share outstanding. From the perspective of investors, dividends policy is
irrelevant, because any desired stream of payments can be replicated by 14
appropriate purchases and sales of equity. M&M concluded that given firms optimal
investment policy, the firm‘s choice of dividend policy has no impact on shareholders
wealth. In other words, all dividend policies are equivalent. The most important
insight of Miller and Modigliani‘s analysis is that it identifies the situations in which
dividend policy can affect the firm value. It could matter, not because dividends are
“safer” than capital gains, as was traditionally argued, but because one of the
assumptions underlying the result is violated. The propositions rest on the following
assumptions namely: Information is costless and available to everyone equally, no
distorting taxes exist, floatation and transportation costs are non- existent and non-
contracting or agency cost exists.
Friend and Puckett (1964) conducted a study on the relationship between dividend
policy and price of stock by running regression analysis on the data taken from 110
firms from five industries in the year 1956 to 1958. Industries taken as samples were
chemicals, electric utilities, food, steels, and electronics. They used dividends,
retained earnings and price earnings ratio as independent variable in their regression
model of price function and dividends as supply function. They also found that the
dividend and retained earning coefficient are closer to each other for all industries in
the both the years except for steels in 1956 and the correlations are higher again
except for steels. Finally, Friend and Puckett concluded that, management might be
able, at least in some measure, to increase stock prices in non-growth by raising
dividends payout and in growth industries by greater retention.
Browns (1978) studied the behavior of the earning changes, stock prices and market
efficiency. According to him, earning per share information is central to be valuation
of equity securities. The determination of market efficiency is especially important
but is yet unsettled. The purpose of his study was to present further information,
which will help to resolve the issue. The study used the standard residual paradigm
and daily price differencing interval to closely examine the market adjustment to EPS
reports by using a native annual forecast model and a more sophisticated quarterly

31
forecast model. Based on the sample of securities chosen, results indicated that the
announcement of unusual EPS significantly affects stock prices that the prices do not
adjust instantaneously and that an abnormal return in excess of transaction costs could
be earned by using the forecast models.
Chawla and Srinivasan (1987) carried out a study to identify the impact of dividend
and retention on share price in Indian context. They attempt to test dividend retained
earning hypothesis and examine the structural changes in the estimated relation over
time. They followed equation model as developed by Friend and Puckett (1964) in
their analysis. Their analysis based on relevant data of 18 chemicals and 13 sugar
companies collected from the official directory of Bombay stock exchange for the
year 1969 to 1973. They used two stages least square techniques for estimations. They
concluded that the dividend hypothesis holds well in the chemical industry. Both
dividend and retained earning significantly explain the variation in stock price in
chemical industry. They also stressed that the impact of dividend was more
pronounced than that of retained earnings but the market started shifting more weight
for retained earnings.
Wu and Wang (2000) used the empirical models to examine the predictive ability of
dividend and earning yields for long term stock returns. Results showed that dividend
and earning yield shared a similar predictive power of dividend yield increases with
return horizon, but that yields forecast future returns and growth over a much longer
horizon. Finally, dividend and earnings yield exhibition of high autocorrelation and
strong contemporaneous relations. Ultimately they found that both dividend and
earnings yields are highly correlated with future returns and the growth of the firm.
Liu &Shrestha (2008) investigates the long run relationship between Chinese stock
market and asset of macroeconomic variables which includes industrial production,
exchange rate, inflation, money supply and interest rate. They used secondary data of
all various from January 1992 to December 2001 and applied heter osciatic counter
action test on the above variables. Findings of this study suggest that industrial
production and money supply have the positive relationship with Chinese stock
indices while inflation, interest rate and exchange rate have the negative impact on
stock prices. They recommended that the investors who want to invest in Chinese
stock market they should invest for long term horizon because in short term the
Chinese stock market is very volatile and risky.

32
Khan (2009) found the evidences that dividends, retained earnings and other
determinants have dynamic relationship with market share price in the context of
Bangladesh. The study suggests that the overall impact of dividends on stock prices is
comparatively better that of retained earnings. The expected dividends play an
important role in the determination of stock prices whatever determinants, like lagged
price earnings ratio or lagged price, are considered.
A study on dividend policy and share price volatility in Kenya seeks to determine the
impact of dividend policy on share price volatility. A number of theoretical
mechanisms have been suggested that dividend policy vary inversely with share price
volatility like the duration effect. The study used data from the actively trading
companies listed in the Nairobi securities exchange for a period of ten years from
1999-2008. The estimation is based on multiple regression analysis between dividend
policy measures (dividend payout ratio and dividend yield) and share price volatility.
The most important results of the study were that payout ratio is important
determinant for share price volatility, payout ratios reduce price volatility due to high
confined of the managers of the firm in both the stability and increase in the firms’
future earning based on public and private information (Kenyoru et al., 2016).
Masum (2017) study on dividend policy and its impact on stock in Bangladesh
investigated excess stock market returns for all the thirty banks listed in Dhaka Stock
Exchange for the period of 2011 to 2015. Attempts are made to examine, what kind of
relationship exists between dividend policy and stock market returns of private
commercial banks in Bangladesh, and to what degree the returns on stocks can be
explained by their respective dividend policy for the same period of time. Sample size
is large i.e. all the listed commercial banks of Dhaka Stock Exchange so the results
are reliable and valid. Panel data approach is used to explain the relationship between
dividends and stock prices after controlling the variables like earnings per share,
return on equity, retention ratio have positive relation with stock prices and
significantly explain the variations in the market prices of shares, while the dividend
yield and profit after tax has negative, insignificant relation with stock prices. Overall
results of the study indicate that dividend policy has significant positive effect on
stock prices.
Almumani (2018) attempted to identify the quantitative factors that influence Share
Prices for the listed banks in Amman Stock Exchange over the period 2011-2017

33
using a linear multiple regression model. There is a significant positive relationship
between earnings per share and the market price share of the listed banks in Jordan.
Moreover, there is a significant relationship between banks book value and market
value. Another empirical finding from the regression analysis shows a positive
relationship between price earnings ratio and market price. Empirical finding from the
regression analysis on the relationship between Size and market price indicate that
there is an inverse relationship between Size and market price. Finally, other variable
dividend per share and dividend yield have in significant impact on market price.
2.2.3 Review of Nepalese Studies
Nepalese capital market is small and at emerging stage, there are limited studies
regarding market price and its relationship with fundamental variables. Here is a
review of studies in Nepalese perspective.
Pradhan (2003) also carried out a study on stock market behavior in a small capital
market. The study determined the relative important of dividend and retained earnings
in determining the market price of stock. The study showed relationship of market
equity, market value to book value, price earnings and dividend with liquidity,
leverage, profitability, assets turnover and interest coverage. The major findings of the
study were that larger stocks have larger price earnings ratios, larger ratio of market
value to book value of equity, lower liquidity, lower profitability and smaller
dividends. Dividend payment is more important as opposed to retained earnings in
Nepal. The results revealed the customary strong dividends effect and a very weak
retained earning effect indicating the attractiveness of divided among Nepalese
investors.
Koirala & Bajracharya (2003) carried out a study on Issues and Challenges of
Nepalese Capital Market. The study tried to explore about the problems of Nepalese
Stock Market. The study concluded that the Nepal Lag behind to develop a healthy
capital market with a sound financial infrastructure. Regulatory measures are slowly
updating incorporating the contemporary issues but that has not been found effective
because of governance problem in the corporate sector. Corporate sector is generally
not transparent. The culture of keeping books of account secret is still alive. Unless, it
is changed capital market will not contribute in a desirable way to contribute to
growth. In order to improve it, accounting and auditing standards, disclosure and

34
corporate governance need to be upgraded significantly and on the other the
monitoring and policy response capacity of SEBON should be enhanced.
Chhetri (2008) examined a relationship between dividend and stock price; the study
explained that there are differences in financial position of high dividend paying and
low dividend paying companies. The study revealed that there is a positive
relationship between dividend and stock prices. Further, the coefficient of dividends is
higher as compared to the coefficient of retained earnings.
Joshi (2011) conducted a study on effects of dividends on stock prices in Nepal. This
study aimed at understanding dividend has a strong effect than return earnings. The
study examines whether this is consistent in the context of Nepal or not and the
implication particularly to the banking and non-banking sectors. A descriptive and
analytical research design had been administered. The secondary data were used to
test this impact in order to examine the impact of dividends on stock prices; a
multivariate liner regression analysis had been implied in which current market stock.
The study found that DPS is a motivating factor in the Nepalese financial sector
which is strong enough to increase market price per share of the banking and non-
banking firms. Comparatively, it is also found that the effect of DPS greater than
REPS on the impact of market price per share. Lagged market price per share is an
accelerator to increase market price per share in subsequent years. Finally, the study
shows that dividends and retained earnings significantly explain the variations in
share price in both banking and non- banking sectors.
Bhattarai (2016) studied the “Determinants of Share Price of Nepalese Commercial
Banks”, taking nine commercial banks of Nepal as sample. The study results that the
shares of commercial banks offer the investment opportunities to Nepalese investors
because these shares are more frequently traded in the market than as compared to
others in Nepalese context. The findings of the study over the period 2006-2014
revealed that earning per share and price-earnings ratio have the significant positive
association with share price while dividend yield showed the significant inverse
association with the share price of the banks. The study concludes that dividend yield,
earnings per share and price- earnings ratio are the major determinants of share price
of Nepalese commercial banks.
Shrestha & Subedi (2016) studied the determinants of stock market performance in

35
Nepal. The finding revealed that stock price has strong positive relationship with
inflation and growth of money supply, and negative response to interest rate. It shows
that people have been gradually taking stock market as a hedge against inflation and
invest in this market when there is ample liquidity available at a low interest rate. A
positive political development with stability can promote share market further which
can play a vital role for financial intermediation and resource mobilization through
capital market. As our results reveal that share market is also influenced by rumors,
news and speculations, transparency should be increased in this market by making
information related to listed companies easily accessible. Transparency and
communication should, in fact, be enhanced by the concerned authorities in order to
clear gossips and rumors in the market.
Pathak & Gupta (2018).Examined the effect of rights share issue on share price
movement in the banking sector covering the period 2007/08 to 2016/17. In order to
find out the share price movement in different selected points of time, pre and post
right issue and price relatives were calculated considering the price of 90 days before
the right announcement date as the beginning index. Five different points of time were
selected to observe the share price movements assuming the announcement date as the
reference point of time. Stock price data were obtained from the website of NEPSE.
The paper uses correlation coefficient to examine whether the overall market
movement has any relationship with the individual share price change. Coefficient of
determination is used to identify what proportion of the variation in the share price is
explained by the event of right share issue. The result shows that right offering
announcements have the signaling effect, but it is negative. The share price of
Nepalese commercial banks decreases after the announcement of right in spite of the
increase in the market index in the corresponding period. The results highlight the
information asymmetry behavior which induces a negative change in share price after
the rights announcements. The implication of the result is that investors can anticipate
the nature of change in share price after rights issue announcements and develop
strategic plans to improve the trading activity.
Karki (2018).Related cross-sectional differences in stock prices of Nepalese
commercial banks to the underlying behavior of six fundamental variables: earnings
per share, book value per share, cash dividend per share, stock dividend per share,
price earnings ratio, and firm size. This study uses secondary sources of data. The

36
balanced panel data from commercial banks including 150 observations are used for
the period of 2000-2014. The earnings per share and stock dividend per share are the
more significant determinants of stock prices of commercial banks in Nepal. The
performance of the stock dividend is especially noteworthy; this variable is
statistically and economically the most important of the six fundamental variables
investigated.
Thapa (2019) explored the influencing factors of stock price in Nepal (with
referenceto Nepalese commercial banks) listed on the Nepal Stock Exchange Ltd.
over the period of 2008 to 2018AD. The information were collected from
questionnaire and financial statement of concerned organizations and analyzed using
simple linear regression model. The conclusions of the work revealed that earning
pershare (EPS), dividend per share (DPS), effective rules and regulations, market
whims and rumors, company profiles and success depend upon luck have the
significant positive association with share price while interest rate (IR) and price to
earnings ratio (PER), showed the significant inverse association with share price.
Further, accessibility of liquidity, fundamental and technical analysis stimulates the
performance of the Nepalese stock market. More importantly, stock market has been
found to respond significantly to changes in dividend and interest rate.
Table 2.2 Major Nepalese Studies and Their Findings
Study Findings
Pradhan
(2003)
The results of the study show that dividend payment has strong relation
with stock price while retained earnings have very weak relation with
stock market price. The results further explain that Nepalese stockholders
give more importance to dividend income than capital gains.
Koirala and
Bajracharya
(2003)
The study pointed out various issues faced in Nepalese Capital Market
like corporate governance, shareholders right, disclosure and transparency
etc. In order to improve it, accounting and auditing standards, disclosure
and corporate governance need to be upgraded and the monitoring and
policy response capacity of SEBON should be enhanced.

37
Chhetri
(2008)
The study revealed that there is a positive relationship between dividend
and stock prices. Further, the coefficient of dividends is higher as
compared to the coefficient of retained earnings.
Joshi
(2011)
The major findings were dividend per share is a motivating factor in the
Nepalese financial sector which is strong enough to increase MPS of the
banking and non-banking firms. The study shows that dividend and
retained earnings significantly explain the variation in share price.
Bhattarai
(2016)
This study found that that earning per share and price-earnings ratio have
the significant positive association with share price while dividend yield
showed the significant inverse association with the share price of the
bank
Shrestha and
Subedi
(2016)
The result of the study is that stock price has strong positive relationship
with inflation and growth of money supply, and negative response to
interest rate. It shows that people have been gradually taking stock
market as a hedge against inflation and invest in this market when there
is ample liquidity available at a low interest rate.
Pathak and
Gupta
(2018)
The results highlight the information asymmetry behavior which induces
a negative change in share price after the rights announcements. The
implication of the result is that investors can anticipate the nature of
change in share price after rights issue announcements and develop
strategic plans to improve the trading activity.
Karki (2018) The earnings per share and stock dividend per share are the more
significant determinants of stock prices of commercial banks in Nepal.
The performance of the stock dividend is especially noteworthy; this
variable is statistically and economically the most important of the six
fundamental variables investigated.
Thapa (2019) The conclusions of the work revealed that earning per share (EPS),
dividend per share (DPS), effective rules and regulations, market whims
and rumors, company profiles and success depend upon luck have the
significant positive association with share price while interest rate (IR)

38
and price to earnings ratio (PER), showed the significant inverse
association with share price. Further, accessibility of liquidity,
fundamental and technical analysis stimulates the performance of the
Nepalese stock market. More importantly, stock market has been found to
respond significantly to changes in dividend and interest rate.
2.3 Research Gap
Many researches on the stock market price in Nepal have been conducted to find
the determinants, which cause the fluctuation of share price. All of those researches
have many useful findings and their own limitations.
Nowadays, Nepalese share market has entered to the new horizon. Its size and market
capitalization are growing day by day. New By laws are being established to control
stock market price. But it is clearly realized that share prices are fluctuating
abnormally. If earning, dividend, net worth and price earnings ratio are taken as the
main determinants of price fluctuating, then why the share prices are increased
without the increment in such factors. Therefore, there is still lack of appropriate
researches to find out the cause of volatility of share price in Nepalese share market.
Therefore, this study is analyzing the various reasons on the fluctuation of price trend
and the cause and effect of different signaling factors over stock price. Thus, the
earlier studies on share price behavior needed to be updated and validated because of
the many changes taking place in stock market in Nepal. This study is an effort to
attempt in the same direction.
Conceptual Frame work
A conceptual framework is an analytical tool with several variations and contexts. It is
used to make conceptual distinctions and organize ideas. Strong conceptual
framework capture something real and do this in a way that is easy to remember and
apply. Dividend, Earnings, Price Earnings Ratio and Net Worth are taken as
independent variable whereas market price is dependent variable. The conceptual
framework that describes the dependent and independent variable used in the study
are shown in figure:

39
Independent Variables Dependent Variable
Influence
Figure 2.1: Conceptual Framework (Relationship between Dependent and
Independent Variable)
The figure 2.1 shows that independent variable DPS, EPS, P/E Ratio and NWPS used
in this study to measure its impact on market price per share. Market price per share
used as dependent variable.
Market Price
Per Share
(MPS)
Dividend Per Share (DPS)
Earnings Per Share (EPS)
Price Earnings Ratio (P/E Ratio)
Net Worth Per Share (NWPS)

40
CHAPTER – III
METHODOLOGY
Research methodology explains the method and process applied in the entire aspects
of study. Every research should be outline in the systematic manner and for that
reason research methodology is one of the most importance part of every research. To
achieve the basic objective of the study, the various research methodology including
research design, populations and sample, sources of data, data collection procedure
and so on are adopted.
3.1 Research Design
The research design used in this study is both descriptive and analytical. Descriptive
research design is used for describing the effect of EPS, DPS, NWPS, and P/E ratio
on stock price from tables, graphs, and figures with basic calculation of present
collected data. Similarly analytical research design is used for analyzing the standard
deviation, correlation coefficient, regression analysis of sampled banks. Research
design focuses on the data collection methods, the research instruments utilized, and
the sampling plan to be used.
3.2 Population and sample
There are various sectors in the stock market such as financial institutions, insurance
companies, manufacturing & processing, hotel, trading, hydropower and others. In
this study 28 commercial banks listed in NEPSE are taken as population. Out of total
28 commercial banks, convenience sampling technique was used to select 4
commercial banks because the selected banks had high net profit than other banks. I
had invested some amount in the share and debenture of the banks selected. Also, all
4 of the selected banks had their branches in my home district ‘Dadeldhura’.
In conclusion, Population size =28 commercial banks, sample size = 4 commercial
banks, sample percentage = 14.29 %.
3.3 Sources of data
The necessary information and data are collected from secondary source. The data are
taken from annual report, trading report and publication made by the NEPSE, SEBON

41
and sampled banks. Other data pertaining to NRB, national journals and concerned
websites.
3.4 Data collection procedure
Most of the data necessary for the study were collected from secondary source and
from survey. However, opinions were also taken with some individual investors,
related organizational officials, SEBON and NEPSE staffs and other related
personalities. Data related to market prices of share, market capitalization and
volatility of NEPSE index etc were taken from the trading report published by
NEPSE. Other data of related companies were taken from the companies as well as
their concerned websites.
The collection procedure is summarized below:
a) Annual report of the banks
b) Previous study and reports
c) Summary sheet of NEPSE
3.5 Data processing procedure
It includes all the collected data and their interpretation. In the study the data of the
market price of the shares of selected companies, earnings, dividend paid, net worth,
market return, NEPSE index and many other related terms were presented and
analyzed. Tables and Figures in this study clearly state the result of the findings.
3.6 Data analysis tool and techniques
To study the relationship between stock price, dividend, earnings, net worth, and price
earnings ratio. Following financial and statistical tools have been used to analyze the
variables of this study.
3.6.1 Financial Ratios
1. Market Price Per Share (MPS)
Market price per share is the closing price of the stock on which the stock has been
traded in Nepal Stock Exchange Ltd during study period. Market price per share is the
depended variable in this research model.

42
Total Market Capitalization
MPS=
No. of Shares Outstanding
2. Earnings Per Share (EPS)
The earnings per share is the portion of a company’s profit that is allocated to each
outstanding share of common stock. It is one of the indicators of company’s
profitability. A higher earnings indicate the better achievement in terms of
profitability and of financial institutions by mobilizing their funds and vice-versa.
EPS is the independent variable for this study.
Total Earning of the Organization
EPS=
No. of Shares Outstanding
3. Dividend Per Share (DPS)
Dividend per share is the sum of declared dividends for every ordinary shares issued.
It is the total dividends paid out to shareholders over an entire year divided by the
number of outstanding shares issued. Both cash and stock dividend declared by each
company have taken into account for the purpose of this study. It is one of the
independent variable in this study.
Total amount of dividend = Cash Dividend +Stock Dividend % * Next Year’s MPS
Total Dividend Paid
DPS=
No. of Shares Outstanding
4. Net Worth Per Share (Book Value per Share) (NWPS)
The NWPS represents the real value of the company. It is simply the ratio of net
worth (share capital plus retained earnings/genera reserve) divided by the number of
shares outstanding. It is also one of the independent variable in this study.

43
Net Worth
NWPS=
No. of Shares Outstanding
5. Price Earnings Ratio (P/E ratio)
Price earnings ratio examines the current price of the stock of a company relative to
its earnings. It also reflects investors’ expectations about the growth in the firm's
earnings, which affects the stock price. It is also an independent variable in this study.
Market Price Per Share
P/E Ratio =
Earning Price Per Share
3.6.2 Statistical Tools
1. Arithmetic Mean or Average
An average represents a group of values. It is the number which is obtained by adding
the various numbers of all the items of a series and dividing the total by the total
number of items. It is a useful tool in statistical analysis. It can be calculated by using
following formula.
Mean ( X ) = ∑𝑋
𝑁
Where,
X = Arithmetic Mean
ΣX = Sum of Elements
N = Number of Observation
2. Standard Deviation
Standard deviation is a measure that is used to quantify the amount of variation
or dispersion of a set of data values. The greater the standard deviation for the greater
will be the magnitude of deviation. A small deviation means a high degree of
uniformity of observation as well as homogeneity of a series. It can be calculated by
using the following formula.

44
σj = √∑𝑋2
𝑁
Where,
σj =Standard deviation of returns on stock ‘j’ during the time period n
X = X- X
N=No. of observations
3. Correlation Coefficient (r)
Correlation analysis is the statistical tool that used to describe the degree to which one
variable is linearly related to another" (Levin & David, 1994: 613). It is useful for
measuring the intensity of the magnitude of linear relationship between two variables.
If the values of the variables are directly proportional then the correlation is said to be
positive. On the other hand, If the values of the variables are inversely proportional,
then the correlation is said to be negative, but the correlation coefficient always
remains within the limit of +1 to -1. The correlation coefficients (r) between two
variants x and y can be obtained by using following formula.
r = 𝑁Σ𝑋𝑌−Σ𝑋Σ𝑌
√⌊𝑁∑𝑋2−(∑𝑋2)⌋⌊𝑁∑𝑌2−(∑𝑌2)⌋
Where,
r = The correlation coefficient between two variables X and Y.
4. Regression Analysis
Regression is the Statistical Method for investing relationship between the variables
by the establishment of an approximate functional relationship between them. It helps
to predict or estimate the value of one variable when the values of other variables are
known. Multiple regression analysis has been used in this study. Multiple regression
analysis consists of one dependent variable and two or more than two independent
variables. In this study dependent variable is MPS and independent variable is EPS
and DPS. The regression equation can be shown as:
Y=a+b1X1+b2X2

45
Where,
Y= MPS
a= y-intercept
X1=EPS
X2= DPS
b1= beta coefficient of EPS
b2= beta coefficient of EPS

46
CHAPTER-IV
RESULTS
Data presentation and analysis is one of the important part of the research work. In
this section the study tries to find out the proof from the mathematical calculation for
the theoretical statement. Results are based upon secondary data of selected
commercial banks.
4.1 Data presentation and analysis
This chapter includes all the collected data and their interpretation. In the study, data
of the market price of shares of selected companies, cash and stock dividend paid,
earning per share P/E ratio, NEPSE index and many other related terms are presented
and analyzed. Tables and Figures have been used for making the result clear and
understandable. Four commercial banks listed in NEPSE are taken as sample. MPS,
DPS, EPS, P/E ratio, NWPS, standard deviation, Correlation Coefficient, regression
analysis of selected companies and other related data presented in table and figures
and analysis were made accordingly using appropriate tools.
4.1.1 Market Price Per Share (MPS)
The MPS of a company's stock changes and fluctuates on the basis of various factors
such as industry performance, investors' sentiment, and various macroeconomic
factors and it can lead to movement in the price of the shares. The average MPS of
selected four commercial banks have changed throughout the five year period where
each shares of individual banks have increased and decreased and that have been
presented in the table 4.1.

47
Table 4.1
Market Price per Share of Selected Commercial Banks
2013/14 2014/15 2015/16 2016/17 2017/18 Average
MPS
Standard
Deviation
EBL 864.25 1427 2159 2036.5 2889.25 1875.2 767.750
NABIL 1048.75 1617.5 1973.75 2009.75 2166 1765.15 446.943
MPB 109 206.5 415.75 551.75 575 371.6 207.359
SCB 1532.25 1879.25 2087 1979 3043.25 2104.2 564.693
(Source: Quarterly Reports of selected Commercial Banks from FY 2013/14 to
2017/18)
The table 4.1 shows the average MPS of four commercial banks from the period of
FY 2013/14 to FY 2017/18. There has been seen fluctuation in the MPS of each
commercial bank. The average MPS of Standard Chartered Bank has found to be
highest of NPR 2104.2 per share followed by MPS of EBL, NABIL and SCB, having
1875.2, 1765.15 and 371.6 respectively. The standard deviation of EBL is higher than
other selected commercial banks with value of 767.750 shows high risk and standard
deviation of MPB is lower compared to other having 207.359 shows low risk and
bank NABIL and SCB have 446.93 and 564.693 respectively.
Figure 4.1
(Source: Quarterly reports of selected commercial banks)
The figure 4.1 clearly shows the average MPS of selected commercial banks. The
1875.21765.15
371.6
2104.2
0
500
1000
1500
2000
2500
EBL NABIL MPB SCB
AVERAGE MPS
AVERAGE MPS
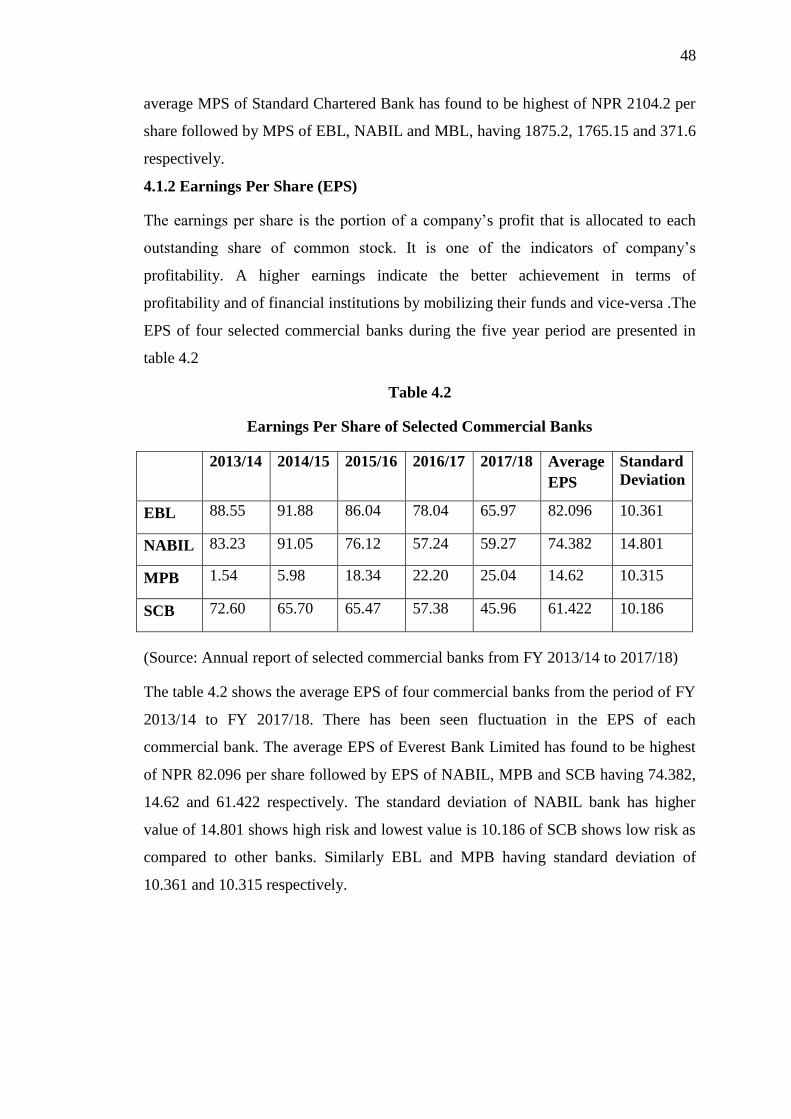
48
average MPS of Standard Chartered Bank has found to be highest of NPR 2104.2 per
share followed by MPS of EBL, NABIL and MBL, having 1875.2, 1765.15 and 371.6
respectively.
4.1.2 Earnings Per Share (EPS)
The earnings per share is the portion of a company’s profit that is allocated to each
outstanding share of common stock. It is one of the indicators of company’s
profitability. A higher earnings indicate the better achievement in terms of
profitability and of financial institutions by mobilizing their funds and vice-versa .The
EPS of four selected commercial banks during the five year period are presented in
table 4.2
Table 4.2
Earnings Per Share of Selected Commercial Banks
2013/14 2014/15 2015/16 2016/17 2017/18 Average
EPS
Standard
Deviation
EBL 88.55 91.88 86.04 78.04 65.97 82.096 10.361
NABIL 83.23 91.05 76.12 57.24 59.27 74.382 14.801
MPB 1.54 5.98 18.34 22.20 25.04 14.62 10.315
SCB 72.60 65.70 65.47 57.38 45.96 61.422 10.186
(Source: Annual report of selected commercial banks from FY 2013/14 to 2017/18)
The table 4.2 shows the average EPS of four commercial banks from the period of FY
2013/14 to FY 2017/18. There has been seen fluctuation in the EPS of each
commercial bank. The average EPS of Everest Bank Limited has found to be highest
of NPR 82.096 per share followed by EPS of NABIL, MPB and SCB having 74.382,
14.62 and 61.422 respectively. The standard deviation of NABIL bank has higher
value of 14.801 shows high risk and lowest value is 10.186 of SCB shows low risk as
compared to other banks. Similarly EBL and MPB having standard deviation of
10.361 and 10.315 respectively.

49
Figure: 4.2
(Source: Annual report of selected commercial banks)
The figure 4.2 clearly shows the average EPS of selected commercial banks. . The
average EPS of Everest Bank Limited has found to be highest of NPR 82.096 per
share followed by EPS of NABIL, MPB and SCB having 74.382, 14.62 and 61.422
respectively.
4.1.3 Dividend Per Share (DPS)
Dividend per share is the sum of declared dividends for every ordinary shares issued.
It is the total dividends paid out to shareholders over an entire year divided by the
number of outstanding shares issued. Both cash and stock dividend declared by each
company have taken into account for the purpose of this study. The DPS of four
selected commercial banks during five year period are presented in table 4.3.
Table 4.3
Dividend Per Share of Selected Commercial Banks
2013/14 2014/15 2015/16 2016/17 2017/18 Average
DPS
Standard
Deviation
EBL 1.58 50 50 5 3.74 22.064 25.531
NABIL 40 40 45 6.84 15 29.308 17.207
MPB 0 0 0.63 0.84 1.09 0.512 0.494
SCB 45 40 41.50 19.21 1.75 29.492 18.50
(Source: Annual report of selected commercial banks from FY 2013/14 to 2017/18)
82.09674.382
14.62
61.422
0
10
20
30
40
50
60
70
80
90
EBL NABIL MPB SCB
AVERAGE EPS
AVERAGE EPS

50
The table 4.3 shows the average DPS of four commercial banks from the period of FY
2013/14 to FY 2017/18. There has been seen fluctuation in the DPS of each
commercial bank. The average DPS of Standard Chartered Bank has found to be
highest of NPR 29.492 per share followed by DPS of EBL, NABIL and MPB having
22.064, 29.308 and 0.512 respectively. The standard deviation of EBL bank has
higher value of 25.531 shows high risk and lowest value is 0.494 of MPB shows low
risk as compared to other banks. Similarly, NABIL and SCB having standard
deviation of 17.207 and 18.50 respectively.
Figure:4.3
(Source: Annual reports of selected commercial banks)
The figure 4.3 shows the average DPS of four commercial banks from the period of
FY 2013/14 to FY 2017/18. . The average DPS of Standard Chartered Bank has found
to be highest of NPR 29.492 per share followed by DPS of EBL, NABIL and MPB
having 22.064, 29.308 and 0.512 respectively.
4.1.4 Price Earnings Ratio (P/E ratio)
Price earnings ratio examines the current price of the stock of a company relative to
its earnings. It also reflects investors’ expectations about the growth in the firm's
earnings, which affects the stock price. The P/E Ratio of four sample commercial
bank during five year period is shown in the table 4.4.
22.064
29.308
0.512
29.492
0
10
20
30
40
EBL NABIL MPB SCB
AVERAGE DPS
AVERAGE DPS

51
Table 4.4
Price Earnings Ratio of Selected Commercial Banks
2013/14 2014/15 2015/16 2016/17 2017/18 Avg.
P/E ratio
Standard
Deviation
EBL 11.67 17.32 30.58 27.17 51.37 27.622 15.276
NABIL 16.21 19.08 33.38 33.37 39.55 28.318 10.114
MPB 69.41 33.96 31.40 25.40 27.15 37.464 18.176
SCB 24.78 27.70 42.75 33.86 78.83 41.584 21.928
(Source: Annual reports of selected commercial banks from FY 2013/14 to 2017/18)
The table 4.4 shows the average P/E ratio of four commercial banks from the period
of FY 2013/14 to FY 2017/18. The average P/E ratio of Standard Chartered Bank has
found to be highest of NPR 41.584 per share followed by P/E ratio of EBL, NABIL
and MPB having 27.622, 28.318 and 37.464 respectively. The standard deviation of
SCB is higher than other selected commercial banks with value of 21.928 shows high
risk and standard deviation of NABIL is lower compared to other having 10.114
shows low risk and bank EBL and MPB have 15.276 and 18.176 respectively.
Figure: 4.4
(Source: Annual reports of selected commercial banks)
The figure 4.4 shows the average P/E ratio of four commercial banks from the period
of FY 2013/14 to FY 2017/18. The average P/E ratio of Standard Chartered Bank has
27.622 28.318
37.46441.584
0
5
10
15
20
25
30
35
40
45
EBL NABIL MPB SCB
AVERAGE P/E RATIO
AVERAGE P/E RATIO

52
found to be highest of NPR 41.584 per share followed by P/E ratio of EBL, NABIL
and MPB having 27.622, 28.318 and 37.464 respectively.
4.1.5 Net Worth per Share (NWPS)
The NWPS represents the real value of the company. It is simply the ratio of net
worth (share capital plus retained earnings/general reserve) divided by the number of
shares outstanding. The NWPS of four selected commercial banks during five year
period of time is shown in table 4.5
Table 4.5
Net Worth Per Share of Selected Commercial Banks
2013/14 2014/15 2015/16 2016/17 2017/18 Average
NWPS
Standard
Deviation
EBL 326.17 291.13 296.30 335.60 320.07 313.934 19.285
NABIL 269 275 251 259 244 259.6 12.681
MPB 106.83 112.81 130.54 137.46 138.18 125.164 14.476
SCB 256 249 249 265 268 257.4 8.848
(Source: Annual reports of selected commercial banks from FY 2013/14 to 2017/18)
The table 4.5 shows the average NWPS of four commercial banks from the period of
FY 2013/14 to FY 2017/18. The average NWPS of EBL has found to be highest of
NPR 313.934 per share followed by NWPS of NABIL, MPB and SCB having 296.6,
125.164 and 257.4 respectively. . The standard deviation of EBL is higher than other
selected commercial banks with value of 19.285 shows high risk and standard
deviation of SCB is lower compared to other having 8.848 shows low risk and bank
NABIL and MPB have 12.681 and 14.476 respectively.

53
Figure: 4.5
(Source: Annual reports of selected commercial banks)
The figure 4.5 clearly shows the average NWPS of four commercial banks from the
period of FY 2013/14 to FY 2017/18. The average NWPS of EBL has found to be
highest of NPR 313.934 per share as compared to NWPS of NABIL, MPB and SCB
having 259.6, 125.164 and 257.4 respectively.
4.2 Correlation Matrix of Selected Banks (r)
Table 4.6
Correlation Matrix
MPS EPS DPS P/E Ratio NWPS
MPS 1.000 0.905 0.961 -0.197 0.916
EPS 0.905 1.000 0.871 -0.594 0.981
DPS 0.961 0.871 1.000 -0.217 0.832
P/E Ratio -0.197 -0.594 -0.217 1.000 -0.512
NWPS 0.916 0.981 0.832 -0.512 1.000
(Source: SPSS version 23)
The table 4.6, shows the relationship of MPS is strongly correlated with DPS i.e.
0.961 followed by NWPS i.e. 0.916 then by EPS i.e. 0.905 and P/E ratio i.e. -0.197.
The relationship of MPS with EPS, DPS, NWPS are significant at 1% level of
significance.
313.934
259.6
125.164
257.4
0
50
100
150
200
250
300
350
EBL NABIL MPB SCB
AVERAGE NWPS
AVERAGE NWPS

54
While examining the universal relationship between independent variables, it is
observed that EPS has positive and significant relationship with DPS and NWPS.
Similarly, DPS has significant positive relationship with NWPS and negative
relationship with P/E ratio.
4.3 Major finding
Regression is statistical method for investing relationship between variables. This
study attempts to estimate various econometric models to confirm the relationship
between market price and fundamental variables and to test the robustness of the
results. Results of the regression estimates of four explanatory variables EPS, DPS,
NWPS and P/E ratio are presented in different tables with linear model and analyze in
the following sub headings. The analysis of the results of total sample is presented
sector wise in different models and the separate analysis of the whole sector has been
compared model wise. The models to be estimated as under:
MPS=a+b1EPS+ui………………………………………………………………… (i)
MPS=a+b1DPS+ui………………………………………………………………… (ii)
MPS=a+b1PE+ui……….…………………………………………………………. (iii)
MPS=a+b1NWPS+ui….……………………………………………………………(iv)
Where 'a' is considered as constant term, 'b' is considered as the coefficient of
independent variables and ui is disturbance or error term. In above model market price
per share (MPS) is dependent variable in each model. Earnings per share (EPS),
dividend per share (DPS), net worth per share (NWPS) and price earnings ratio (P/E
Ratio) have been considered as independent variables in each model.
4.3.1 Simple Regression Analysis of Dependent Variable (Y) on Independent
Variables (X)
The regression equation for simple regression is:
Y = a + bX……………………..i
∑Y = na + b∑X............................ii
∑XY = a∑X + b∑X2………………iii
Where,
Regression Equation of MPS on EPS
∑X = 232.32, ∑Y = 6116.15, ∑XY = 419918.7709, ∑X2 = 16258.8416

55
Regression Equation of MPS on DPS
∑X = 81.38, ∑Y = 6116.15, ∑XY = 155354.7996, ∑X2 = 2215.819
Regression Equation of MPS on P/E Ratio
∑X = 134.99, ∑Y = 6116.15, ∑XY = 203216.6218, ∑X2 = 4697.6643
Regression Equation of MPS on NWPS
∑X = 956.10, ∑Y = 6116.15, ∑XY = 1635053.999, ∑X2 = 247867.5033
After solving the above equations the result is as follows:
Table 4.7
Result of Simple Regression Analysis of Selected Banks
Dependent Variable (MPS or Y) Y intercept (a) Slope (b) Independent Variable (X)
Y 170.48 23.39 EPS (X)
Y 405.928 55.203 DPS (X)
Y 2286.25 -22.4376 P/E Ratio (X)
Y -611.308 8.9544 NWPS (X)
(Source: SPSS version 23)
The table 4.7 shows the simple regression analysis between Dependent Variable
(MPS) and various independent variables EPS, DPS, P/E Ratio and NWPS. When the
value of independent variable EPS, DPS, P/E Ratio and NWPS is zero the value of
dependent variable MPS is 170.48, 405.928, 2286.25 and -611.308 respectively.
Similarly, it also shows that MPS has positive relation with EPS, DPS, NWPS and
negative relation with P/E Ratio.
4.3.2 Major Findings of Secondary Data
1. In the last FY 2016/17 total listed companies in Nepal Stock Exchange Ltd. were
232, which were decreased to 208 in FY 2017/18 due to the merger and
acquisitions.
2. The Nepalese Capital Market during FY 2016/17 as the result the indicators of
secondary market like NEPSE index, annual turnover, number of transaction,
turnover to market capitalization and average price per share have been decreased
in FY 2016/17 than in FY 2015/16, it shows that the NEPSE was in diminishing
trend during FY 2016/17 and in FY 2017/18 it is on increasing way.
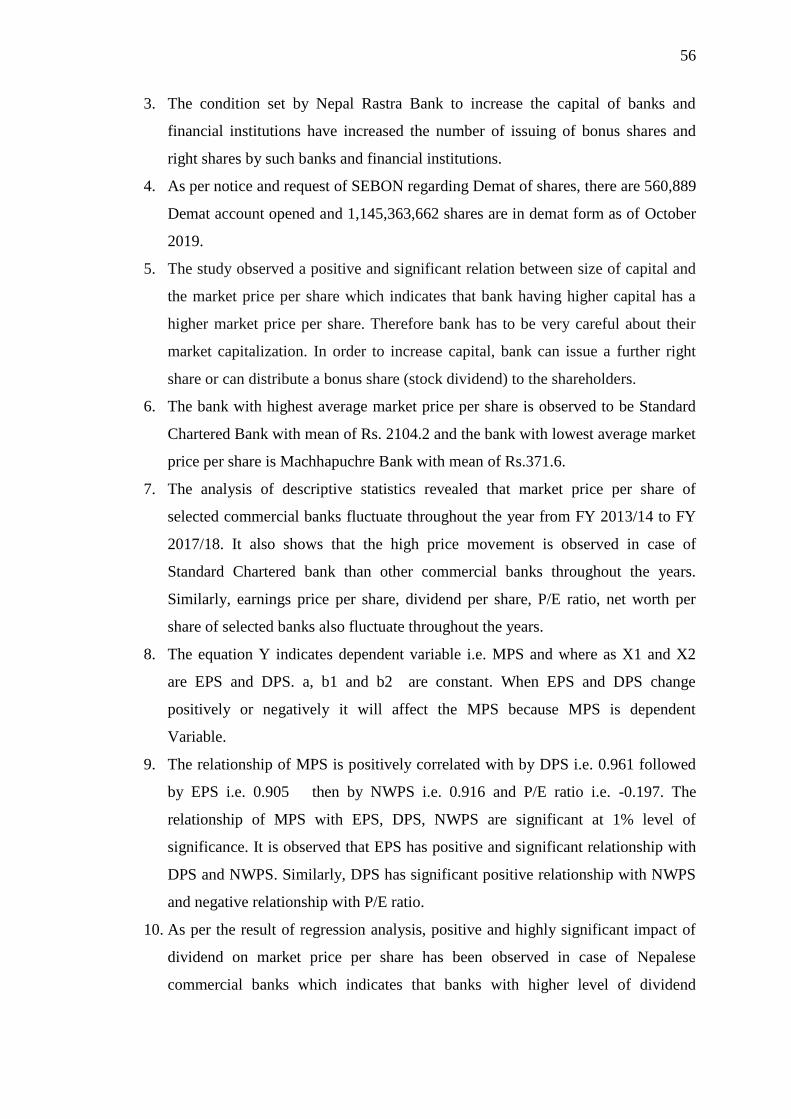
56
3. The condition set by Nepal Rastra Bank to increase the capital of banks and
financial institutions have increased the number of issuing of bonus shares and
right shares by such banks and financial institutions.
4. As per notice and request of SEBON regarding Demat of shares, there are 560,889
Demat account opened and 1,145,363,662 shares are in demat form as of October
2019.
5. The study observed a positive and significant relation between size of capital and
the market price per share which indicates that bank having higher capital has a
higher market price per share. Therefore bank has to be very careful about their
market capitalization. In order to increase capital, bank can issue a further right
share or can distribute a bonus share (stock dividend) to the shareholders.
6. The bank with highest average market price per share is observed to be Standard
Chartered Bank with mean of Rs. 2104.2 and the bank with lowest average market
price per share is Machhapuchre Bank with mean of Rs.371.6.
7. The analysis of descriptive statistics revealed that market price per share of
selected commercial banks fluctuate throughout the year from FY 2013/14 to FY
2017/18. It also shows that the high price movement is observed in case of
Standard Chartered bank than other commercial banks throughout the years.
Similarly, earnings price per share, dividend per share, P/E ratio, net worth per
share of selected banks also fluctuate throughout the years.
8. The equation Y indicates dependent variable i.e. MPS and where as X1 and X2
are EPS and DPS. a, b1 and b2 are constant. When EPS and DPS change
positively or negatively it will affect the MPS because MPS is dependent
Variable.
9. The relationship of MPS is positively correlated with by DPS i.e. 0.961 followed
by EPS i.e. 0.905 then by NWPS i.e. 0.916 and P/E ratio i.e. -0.197. The
relationship of MPS with EPS, DPS, NWPS are significant at 1% level of
significance. It is observed that EPS has positive and significant relationship with
DPS and NWPS. Similarly, DPS has significant positive relationship with NWPS
and negative relationship with P/E ratio.
10. As per the result of regression analysis, positive and highly significant impact of
dividend on market price per share has been observed in case of Nepalese
commercial banks which indicates that banks with higher level of dividend

57
payment incur higher market price per share which results in higher returns to the
shareholders.
11. The result of simple regression analysis between Dependent Variable (MPS) and
various independent variables EPS, DPS, P/E Ratio and NWPS shows that when
the value of independent variable EPS, DPS, P/E Ratio and NWPS is zero the
value of dependent variable MPS is 170.48, 405.928, 2286.25 and -611.3076
respectively. Similarly, it also shows that MPS has positive relation with EPS,
DPS, NWPS and negative relation with P/E Ratio.

58
CHAPTER-V
CONCLUSIONS
This chapter embodies three parts of the study; discussion, conclusions, implications.
The first part depicts about the discussion of whole research study, the second depicts
about conclusions and final part presents about the implications in light of its findings.
5.1 Discussion
Security market is one of the constituents of capital market. It has wide embracing
for the buyer and seller of all securities and all related agencies. It has a significant
role to the development of capital market as well as overall economy. Basically, it
affects the economy through creation of liquidity, marketability, etc. liquid equity
markets makes less expensive to trade equities, reduce disincentive to investing the
lag duration projects because investors can easily sell. It also facilitates higher to
choose and invest in higher return projects and best productivity growth. More
liquidity makes easier to sell. Like liquidity, market efficiency is another most
profound idea to affect the investment decision process in security market. This
means that efficiently proved markets in which this price of security do not depart
for any length of time from justified economic values. The security values are also
determined by investor’s expectation about earning risk and so on. In efficient
market values is going to be changed by reacting with new information. Thus,
securities are efficiently priced on a continuous basis.
The stock market of Nepal is in developing stage. It needs help from all concerned
bodies to function properly. The government should formulate effective rules and
regulations and implement it properly to develop the stock market. The listed
companies should always be ready to help the market by obeying the rules and
regulations, timely disclosing and submitting annual financial statement, avoiding
rumors and not manipulating the price of stock.
The study shows the dependent variable MPS has positive relation with independent
variables EPS, DPS, NWPS but having negative relation with P/E ratio. Beside this
Nowadays, Nepalese share market has entered to the new horizon. Its size and
market capitalization are growing day by day. New by laws are being established to
control stock market price. But it is clearly realized that share prices are fluctuating
abnormally. If earning, dividend, net worth and price earnings ratio are taken as the
main determinants of price fluctuating, then why the share prices are increased

59
without the increment in such factors. Thus, the earlier studies on share price
behavior needed to be updated and validated because of the many changes taking
place in stock market.
This study has raised the major issue to analyze whether the earnings per share,
dividend per share, net worth per share and price earnings ratio with respect to
market price of share are related or not. To deal with the above issue this study has
set the main objective is to evaluate factors affecting market price in the context of
Nepal. Other objectives are 1) To find out relationship between macro-economic
factors and the movement of Stock Price of Commercial Bank in Nepal 2) To
determine the effect of earnings, dividend, net worth, and price earnings ratio to the
stock price 3) To examine the relationship of MPS with various financial
indicators like EPS, DPS, NWPS, and P/E ratio and 4) To examine overall
efficiency of Stock Market in Nepal.. The relationship of EPS, DPS, NWPS and
P/E Ratio with MPS has been checked by correlation and regression analysis has
been done to predict the dependent variable MPS by the help of independent
variables EPS, DPS, NWPS and P/E Ratio and to know the strength of relationship
between variables.
Share market are the causes that have significant contribution for abnormal price
fluctuation in Nepalese stock market. And SEBON and Brokerage firms are major
responsible agencies for making market inefficient.
5.2 Conclusions
1. The stock market is one of the forms of secondary market. It is a medium through
which corporate sector mobilizes funds to financial productive projects by issuing
shares in the market. Most of the general investors in Nepal do not have sufficient
information regarding the primary market but still they are interested to invest
money in the primary market. As per this study, almost every sector is getting
good response from general public. Specifically financial sector is more preferable
than non-financial sector. Even among the financial sector most are interested in
commercial banks.
2. The Nepalese Capital Market during FY 2016/17 as the result the indicators of
secondary market like NEPSE index, annual turnover, number of transaction,
turnover to market capitalization and average price per share have been increased
in FY 2017/18 than in FY 2016/17.

60
3. From the findings it can be concluded that market price per share of selected
commercial banks fluctuate throughout the year from FY 2013/14 to FY 2017/18.
The relationship of MPS is positively correlated with EPS, DPS and NWPS and
negatively correlated with P/E ratio. The relationship of MPS with EPS, DPS,
NWPS are significant at 1% level of significance. It is observed that EPS has
positive and significant relationship with DPS and NWPS. Similarly, DPS has
significant positive relationship with NWPS and negative relationship with P/E
ratio.
4. The simple regression analysis between Dependent Variable (MPS) and various
independent variables EPS, DPS, P/E Ratio and NWPS shows that MPS has
positive relation with EPS, DPS, NWPS and negative relation with P/E Ratio.
5. From the above data and findings it can be seen that the secondary market of
Nepal is highly concentrated on banks and financial institutions. The secondary
market is highly dominated by banking and financial institutions. This may cause
problem to construct efficient portfolio in the market and could be the main
barrier for institutional investors. For this companies from real sector should be
encouraged to list and to get traded in capital market.
5.3 Implications
Based on findings of the study, and taking into considerations of the relevant
issues, the following appropriate recommendations have been gathered to ease the
study useful to the recipients and the other parties. This study should be fruitful to
the stakeholder, researchers and student who are interested to this topic.
1. The report shows that macroeconomic environment is good in Nepal but
infrastructure situation, technological readiness, and inefficient labor market are
the main issues that should be addressed to make Nepalese investment
environment more competitive.
2. The study observed that Nepalese capital market is largely dependent on banks and
financial sector, which is not good signal for overall development of capital market
and market as a whole in this regard the regulatory body and the government
should take a step forward and encourage public issue from other sectors like
manufacturing and processing by providing additional facilities such as tax-
concessions.

61
3. The study observed a positive and significant relation between size and the market
price per share which indicates that bank having higher capital has a higher market
price per share. Therefore bank has to be very careful about their market
capitalization. In order to maximize their capital, bank can issue a further right
share or can distribute a bonus share (stock dividend) to the shareholders.
4. The study supports the fact that dividend decision is concerned with earning
position of the bank and further the study revealed that dividend announcement is
relevant in determining value of the share in the market. Hence, investors are
recommended to review profitability of the bank before buying share of the banks
because earning position of the banks will reflect the dividend announcement
potentiality and dividend announcement will increase the market price per share.
5. The government should formulate effective rules and regulations and implement it
properly to develop the stock market. The listed companies should always be ready
to help the market by obeying the rules and regulations, timely disclosing and
submitting annual financial statement, avoiding rumors and not manipulating the
price of stock.
6. In order to contribute to the economic growth, the capital market should be
improved by upgrading companies accounting and auditing standards, disclosing
of information, upgrading corporate governance and enhancing the monitoring and
policy capacity of SEBON.
7. The study considered some selected independent variables; one can consider other
factors such as interest rate, political factor, economic policy, bank credit etc. for
more reliable conclusion.
8. The trading of NEPSE should be Fully Automated Trading so buying and selling
procedure of shares should be systematic, fast and less time consuming. The
NEPSE should update its technology as NEPSE system generally gets down.
Besides, this they must avoid and stop insider’s information so that the stock price
should be fair without may manipulation.
9. Due to less technological knowledge, most investors have to depend upon the third
party, and some may defy their trust so, investors should be updated about the
current market condition, and brokers need to be clearly providing the information
to the investors. As demat has various benefits and SEBON had also issued notice
to demat their shares so, every investors should demat their shares for easy and
convenient way to hold and trade securities.

References
Almumani, M. A. (2018). Determinants of equity share prices of the listed banks in
Amman stock exchange: Quantitative approach, International Journal of
Business and Social Science, 5 (1), 91-104.
Brown, Stewart L. (1978). Earning Changes Stock Prices and Market Efficiency.
Journal of Finance. Boston D.C. Health & co., 33 (1), 17.
Chawala, D.& Srinivasan, G. (1987). Impact of Dividend and Retention on Share
price an Economic Study. Decision, 20 (8), 137-140.
Corwin, Shane, A. (2003). The Determinants of Under pricing for Seasoned Equity
Offers. Journal of Finance, 58 (5), 128-130.
Chhetri , G.R. (2008). Dividend and stock prices: A Case of Nepal. An Unpublished
M. Phil. Thesis submitted to Tribhuvan University .
Durham, J. Benson. (2002). The Effects of Stock Market Development on Growth and
Private Investment in Low Income Countries . Emerging Markets Review,..3
(3) , 211-232.
Friend, I. & Marshall, P. (1964). Dividend and Stock Prices. The American Economic
Review 54, 656-681 .
Gompers, Paul A., Joy L. Ishii, and Andrew Metrick. (2003). Corporate Governance
and Equity prices.
Joshi, R. (2011). Effects of dividend on Stock Price in Nepal. NRB Economics review,
8 (15), 61-75.
Koirala, P & Bajracharya, P (2003). Nepalese capital Market: Issues and Challenges.
Economic Review.
Miller, M.H. and Modigliani, F. (1961), Dividend policy , Growth , and the Valuation
of Share , The Journal of Business, 34(2), 411-433
Shrestha, P. K. & Subedi, B.R. (2016). Determinants of Stock Market Performance in
Nepal. NRB Economic Review .

Wu, C. & Wang, Xu-M. (2000). The Predictive Ability Dividend And Earnings
Yields for Long Term Returns. The Financial Review, 35 (12), 97-124.