
Stock Presentation - Fisher College of Business · Stock Presentation Consumer ... Weakness in...
34
Presenters: Turki AlSabbar Ferny Angeles Paz July 13 th , 2016 SECURE Stock Presentation Consumer Discretionary Sector Student Investment Management
Transcript of Stock Presentation - Fisher College of Business · Stock Presentation Consumer ... Weakness in...

Presenters:
Turki AlSabbar
Ferny Angeles Paz
July 13th, 2016
SECURE
Stock PresentationConsumer Discretionary Sector
Student Investment Management

Agenda
Sector Overview (Recap)
Analysis of Stocks
Recommendation
Conclusion

Recommendation
Sector Overview (Recap)
Analysis of Stocks
Recommendation
Conclusion

4
Recommendation
Recommendation Stocks Analysis ConclusionSector Recap
Company Ticker Current Basis Proposed Basis Current Price Target Price Upside
(Downside)
Recommendation
Michael Kors KORS 469 bps 469 bps $51.91 $74.7 43.5% HOLD
Chipotle CMG 329 bps 0 bps $393.91 $234.7 40.4% SELL

Sector Overview (Recap)
Sector Overview (Recap)
Analysis of Stocks
Recommendation
Conclusion

6
Consumer Discretionary Sector
Recommendation Stocks Analysis ConclusionSector Recap
Automobiles & Components (7 members)
Consumer Durables & Apparel (20 members)
Consumer Services (12 members)
Media (15 members)
Retailing (33 members)
11.34%
21.97%
24.14%
42.47%
0.08%
Industries: 87 members and 5 industry groups

7
Consumer Discretionary Sector
Recommendation Stocks Analysis ConclusionSector Recap
Sector recommendation: BUY
Weights:
12.48% of S&P500 (as of July 11th)
12.82% of SIM (as of May 2016)
• Service Corp (SCI): 2%
• Chipotle (CMG): 3.29%
• Michael Kors (KORS): 4.69%
• Harley-Davidson (HOG): 2.84%
25.66%
15.59%
36.59%
22.16%
SIM: Consumer Discretionary
CMG
SCI
KORS
HOG

Analysis of Stocks
Sector Overview (Recap)
Analysis of Stocks
Recommendation
Conclusion

Michael Kors

10
Stock: Michael Kors
Recommendation Stocks Analysis ConclusionSector Recap
Michael Kors Michael Kors Holdings Ltd is a global
luxury designer, marketer, distributor and
retailer of women's apparel and accessories
and men's apparel. Founded in 1981, the
company has a presence in over 100
countries.
Retail, wholesale and licensing
Primary competitors: RL, KATE, COH
Market Data in U.S
Market Capitalization 9,088.9M
Shares Outstanding 176.4M
Dividend Yield DI
Dividend N.A
Beta 0.84
52 Week Price Range 34.83-59.49
Financial Data (TTM)
Revenue 4712.1M
Revenue Growth 7.8%
Gross Margin 59.4%
Operating Margin 18%
Earnings Per Share 4.48
Price to Earnings 11.45

11
Stock: Michael Kors – Business Segments
Recommendation Stocks Analysis ConclusionSector Recap
48%
48%
4%
2014
49%
47%
4%
2015
Retail Wholesale Licensing
51%45%
4%
2016
Retail: 50.8% of revenue
Largest wholesale customer: Macy’s contributed 12.7% of total revenue.

12
Stock: Michael Kors – Net Sales by segment and geography
Recommendation Stocks Analysis ConclusionSector Recap
Fiscal Years Ended
April 2, March 28, March 29,
2016 2015 2014
Retail net sales - The Americas $ 1,779.00 $ 1,656.10 $ 1,318.90
Retail net sales - Europe 509.60 412.10 235.60
Retail net sales - Asia 106.30 66.40 38.50
Wholesale net sales - The Americas 1,628.60 1,662.50 1,335.50
Wholesale net sales - Europe 406.40 401.10 242.00
Wholesale net sales - Asia 108.90 1.50 -
Licensing Revenue- The Americas 99.00 100.30 117.40
Licensing Revenue- Europe 74.30 71.50 22.90
Total revenue $ 4,712.10 $ 4,371.50 $ 3,310.80
• Slow retail in the Americas
• Retail and wholesale sales in Asia have
climbed up due to KORS’s acquisition of
Asiatic licenses
• Greater China License expected to contribute
$200M in retail sales next FY.

13
Stock: Michael Kors – Business Drivers
Recommendation Stocks Analysis ConclusionSector Recap
Retail sector weakness
Stock price has fallen by ~half over past 2 years.
Seasonality of market
93.27
40.06
49.48
0
20
40
60
80
100
120
140
160
180
200
9/30/2011 9/30/2012 9/30/2013 9/30/2014 9/30/2015
Stock Performance yearly
KORS COH LVMUY RL KATE

14
Stock: Michael Kors – Analysis
Recommendation Stocks Analysis ConclusionSector Recap
Revenue: Drop in retail consumption (Nordstrom).
Weakness in international tourism putting pressure on
margins.
New share repurchase program of 1Billion$:
established in last earnings report
Risks
• Economic slowdown in Europe and Asia
• Weakening pound
• E-commerce competition
• Brexit: prices for luxury items dropped 60% two weeks after
vs. two weeks before
Opportunities
• McLaren-Honda F1 partnership
• Acquisition of Great China and South Korea licensees
50.82%45.50%
3.68%
Revenue segmentation
Specialtyapparel stores
Apparel design
Apparel brandlicensing

15
Stock: Michael Kors – Operating Margin
Recommendation Stocks Analysis ConclusionSector Recap
15
20
25
30
35
40
45
50
55
Licensing Wholesale Retail
51.7
27.2
20.9
51.8
29.6
26.1
Operating Margin
FY 2016 FY 2015
Three segments have decreased their OM .
Retail went down 5.2%

16
Stock: Michael Kors – Gross Profit
Recommendation Stocks Analysis ConclusionSector Recap
0
500
1000
1500
2000
2500
3000
FY2016FY2015FY2014FY2013FY2012
Mill
ions
Gross Profit vs. Operating Income
Gross Profit Operating Income or Losses
Although gross profit increased, operating income
went down from FY 2015 to FY 2016
Company needs to trim costs or drive up revenue
performance.
Positive: Low cotton prices

17
Stock: Michael Kors – Key Ratios
Recommendation Stocks Analysis ConclusionSector Recap
KORS Valuation
Absolute Basis High Low Median Current
P/E 58.84
(03/2012)
9.11
(12/2015)
26.43 11.47
P/B 19.68
(03/2012)
3.64
(12/2015)
9.58 4.55
P/S 5.72 (09/2013) 1.66
(12/2015)
4.28 2.03
P/EBITDA 25.98
(03/2012)
5.62
(12/2015)
15.27 7.04
Competitor Multiples
Ticker P/E TTM P/S TTM P/B P/CF TTM EV/
EBITDA
TTM
Average 19.46 1.99 5.31 13.16 10.84
KORS 11.48 2.03 4.56 7.77 6.83
Peers
RL 16.50 1.13 2.17 8.32 7.15
KATE 26.86 2.13 10.06 19.80 18.36
COH 23.00 2.69 4.45 16.76 11.02
Valuation multiples lower than median by almost a half.
P/E ratio lower than industry’s average

18
Stock: Michael Kors – Recommendation
Recommendation Stocks Analysis ConclusionSector Recap
HOLD
Current Price: 51.91
Target Price: 74.47
Upside: 43.5%
Uncertainty about retail apparel stocks
Uncertainty coming from Brexit
Consumer spending going up but decreased sales at
department stores
Slower growth in foreign markets.

Chipotle Mexican Grill Inc.

20
Chipotle – Company Overview
Chipotle
Chipotle Mexican Grill, Inc. operates
Chipotle Mexican Grill restaurants. The
company was founded by Steve Ells, a
classically trained chef in 1993. Most of
these restaurants operate on fast-casual
Mexican food concept and are located in
the US. In order to diversify the risk, the
company has gradually been expanding
into international markets and other
food segments, See (Figure 1: Business
Segments).
Chipotle Restaurants
• US (1,971)• Canada (11) • England (7) • France (4) • Germany (1)
Mexican food: Burritos, tacos,
burrito bowls, salads
ShopHouse Southeast Asian Kitchen
13
Asian cuisine
Pizzeria Locale restaurants
(Indirectly held through investment in a separate
entity)
3
Fast casual pizza concept
# of Outlets
Sub-segment
# of Outlets
Sub-segment
# of Outlets
Sub-segment
Figure 1: Business Segments
Recommendation Stocks Analysis ConclusionSector Recap

21
Chipotle – Business Overview
Economic Drivers Drivers of Profitability
Consumer Spending
Consumer Confidence
Real GDP
US Unemployment Rate
Labor Costs
Food Commodity Costs
Recommendation Stocks Analysis ConclusionSector Recap

22
Chipotle – Stock Overview
Stock Overview
Ticker CMG
Sector Consumer Discretionary
Industry Restaurants
Current Price (USD) as of (07/01/2016) $393.91
Price Target (USD) $234.7
Total Projected Return $111,447
Dividend Yield (N/A)
Downside 40.4%
Recommendation: SELL
Market Capitalization (USD) $11.57 Bn.
Shares Outstanding 29.20 Mn.
52-week Price Range $384.77 - $758.61
Beta 0.33
Market Data
Revenue (USD) $4.50
Revenue Growth (Y/Y) 10%
Operating Income (USD) $764 Mn.
Financial Data (FY2015)
Recommendation Stocks Analysis ConclusionSector Recap

23
Chipotle – Stock Overview
0
100
200
300
400
500
600
700
800
CMG 12-Month Stock Price Chart Sector's Stock Price Performance Chart Compared to S&P 500
0
500
1000
1500
2000
2500
3000
3500
7/7/2011 7/7/2012 7/7/2013 7/7/2014 7/7/2015
CMG S&P 500
Recommendation Stocks Analysis ConclusionSector Recap
24
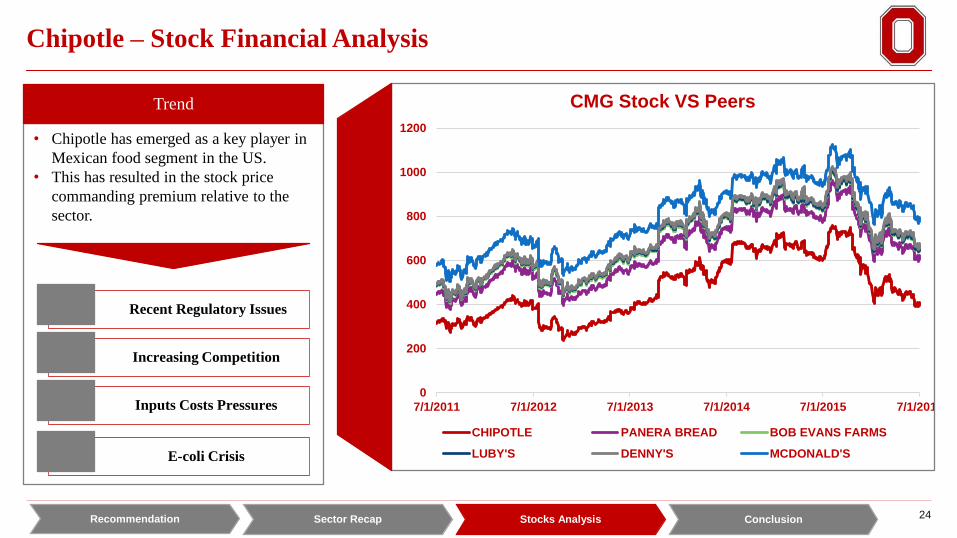
Chipotle – Stock Financial Analysis
• Chipotle has emerged as a key player in
Mexican food segment in the US.
• This has resulted in the stock price
commanding premium relative to the
sector.
Trend
Recent Regulatory Issues
Increasing Competition
Inputs Costs Pressures
E-coli Crisis
0
200
400
600
800
1000
1200
7/1/2011 7/1/2012 7/1/2013 7/1/2014 7/1/2015 7/1/2016
CMG Stock VS Peers
CHIPOTLE PANERA BREAD BOB EVANS FARMS
LUBY'S DENNY'S MCDONALD'S
Recommendation Stocks Analysis ConclusionSector Recap

25
Chipotle – Stock Financial Analysis
10Y CMG Absolute Valuation
High Low Median Current
P/E 64.79 21.66 36.86 25.92
P/S 5.17 1.52 3.43 2.75
P/B 10.75 3.20 7.42 5.73
P/CH 32.70 10.23 22.32 18.13
P/EBIT
DA30.42 10.57 18.23 13.86
10Y CMG Relative to S&P 500
High Low Median Current
P/E
4.12 1.54 2.74 1.95
P/S
4.32 1.19 2.51 1.52
P/B
5.78 1.23 3.15 2.67
P/CH
4.82 0.92 2.48 2.19
P/EBIT
DA5.05 1.33 2.70 1.71
9Y CMG vs Peers
P/E P/S P/B P/CHP/EBI
TDA
Average 23.53 1.48 3.06 11.55 9.92
CHIPOTLE 41.92 2.22 3.91 17.63 18.23
LUBY'S INC 13.71 0.78 1.64 9.92 7.52
MCDONALD'S
CORP18.71 2.53 3.45 12.60 9.38
BOB EVANS
FARMS23.49 0.81 1.85 8.85 7.76
PANERA BREAD 29.66 2.10 4.43 16.56 12.87
Recommendation Stocks Analysis ConclusionSector Recap

26
Chipotle – Stock Valuation
Weight
Implied value
by using the
model
DCF 60% 226.0
Valuation multiples based 40% 247.9
Final target price 234.7
Discount to the current market
price (%)40.4
Resolution of E-Coli and Norovirus incidents earlier than expected
Lower agriculture and crude oil prices
Successful international expansion earlier than anticipated
More successful and quicker scalability of diversification in other food segments
Quicker break-even period for newly opened stores
Risks
Recommendation Stocks Analysis ConclusionSector Recap

Conclusion
Sector Overview (Recap)
Analysis of Stocks
Recommendation
Conclusion
28
Conclusion
Recommendation Stocks Analysis ConclusionSector Recap
• Keep Sector Weight at From 12.82%
• Hold KORS Stock
• Sell CMG Stock
• Buy EXPE and MCD

29
Recommendation
Recommendation Stocks Analysis ConclusionSector Recap
Company Ticker Current Price Target PriceUpside
(Downside)Recommendation # of Shares
Expected Return
(USD)
Expedia Inc. EXPE $117.19 $182.24 55.5% BUY 1,755 $114,192
McDonalds MCD $126.06 $134.96 7.1% BUY 699 $6,220
Company Ticker Current Price # of Shares Proceeds
Chipotle CMG $419.68 700 $293,776

End of Presentation
Thank You For Listening

31
Appendix
Michael Kors (KORS)
Analyst: Ferny Angeles Paz Terminal Discount Rate = 10.0%
Terminal FCF Growth = 4.0%
(000s)
Year 2017E 2018E 2019E 2020E 2021E 2022E 2023E 2024E 2025E 2026E 2027E
Revenue 4,901,904 5,196,018 5,507,779 5,673,013 5,843,203 6,018,499 6,199,054 6,416,021 6,672,662 6,939,568 7,217,151
% Grow th 6.0% 6.0% 3.0% 3.0% 3.0% 3.0% 3.5% 4.0% 4.0% 4.0%
Operating Income 1,313,710 1,395,131 1,478,839 1,701,904 1,752,961 1,805,550 1,859,716 1,924,806 2,001,799 2,081,871 2,165,145
Operating Margin 26.8% 26.9% 26.9% 30.0% 30.0% 30.0% 30.0% 30.0% 30.0% 30.0% 30.0%
Interest Income 1,961 2,078 2,203 2,269 2,337 2,407 2,480 2,566 2,669 2,776 2,887
Interest % of Sales 0.0% 0.0% 0.0% 0.0% 0.0% 0.0% 0.0% 0.0% 0.0% 0.0% 0.0%
Taxes 458,769 487,205 516,437 594,872 612,718 631,100 650,033 672,784 699,695 727,683 756,790
Tax Rate 35.0% 35.0% 35.0% 35.0% 35.0% 35.0% 35.0% 35.0% 35.0% 35.0% 35.0%
Net Income 853,400 906,209 960,497 1,104,762 1,137,905 1,172,043 1,207,204 1,249,456 1,299,434 1,351,412 1,405,468
% Grow th 6.2% 6.0% 15.0% 3.0% 3.0% 3.0% 3.5% 4.0% 4.0% 4.0%
Add Depreciation/Amort 196,076 207,841 220,311 170,190 175,296 180,555 185,972 192,481 200,180 208,187 216,515
% of Sales 4.0% 4.0% 4.0% 3.0% 3.0% 3.0% 3.0% 3.0% 3.0% 3.0% 3.0%
Plus/(minus) Changes WC (67,377) (36,009) (43,543) (44,849) (46,194) (47,580) (49,008) (50,723) (52,752) (54,862) (57,056)
% of Sales -1.375% -0.7% -0.8% -0.8% -0.8% -0.8% -0.8% -0.8% -0.8% -0.8% -0.8%
Subtract Cap Ex 392,152 415,681 440,622 425,476 409,024 391,202 371,943 352,881 333,633 277,583 288,686
Capex % of sales 8.0% 8.0% 8.0% 7.500% 7.000% 6.500% 6.000% 5.500% 5.000% 4.000% 4.000%
Free Cash Flow 589,947 662,359 696,643 804,628 857,983 913,815 972,225 1,038,333 1,113,229 1,227,154 1,276,240
% Grow th 12.3% 5.2% 15.5% 6.6% 6.5% 6.4% 6.8% 7.2% 10.2% 4.0%
NPV of Cash Flows 5,549,265 39%
NPV of terminal value 8,528,794 61% Terminal Value 22,121,496
Projected Equity Value 14,078,059 100%
Free Cash Flow Yield 6.01% Free Cash Yield 5.77%
Current P/E 11.5 10.8 10.2 Terminal P/E 15.7
Projected P/E 16.5 15.5 14.7
Current EV/EBITDA 6.0 5.7 5.4 Terminal EV/EBITDA 9.0
Projected EV/EBITDA 8.9 8.3 7.9
Shares Outstanding 189,054
Current Price 51.91$ premarket after preannouncement
Implied equity value/share 74.47$
Upside/(Downside) to DCF 43.5%
Debt 2,000
Cash 702,000
Cash/share 3.71

32
Appendix
Chipotle Mexican Grill, Inc. (CMG)
Analyst: Turki AlSabbar Terminal Discount Rate = 10.00%
6/7/2016 Terminal FCF Growth = 4.0%
(000s)
Year 2016E 2017E 2018E 2019E 2020E 2021E 2022E 2023E 2024E 2025E 2026E
Revenue 4,276,162 4,447,208 4,625,097 4,810,101 5,002,505 5,202,605 5,410,709 5,681,244 5,965,307 6,263,572 6,576,751 % Growth 4.0% 4.0% 4.0% 4.0% 4.0% 4.0% 5.0% 5.0% 5.0% 5.0%
Operating Income 218,084 582,584 883,393 769,616 800,401 832,417 865,713 908,999 954,449 1,002,172 1,052,280 Operating Margin 5.1% 13.1% 19.1% 16.0% 16.0% 16.0% 16.0% 16.0% 16.0% 16.0% 16.0%
Interest Income 4,276 4,447 4,625 4,810 5,003 5,203 5,411 5,681 5,965 6,264 6,577 Interest % of Sales 0.1% 0.1% 0.1% 0.1% 0.1% 0.1% 0.1% 0.1% 0.1% 0.1% 0.1%
Taxes 82,316.12 222,582.78 338,325.82 294,450.3 306,228.3 318,477.4 331,216.5 347,777.4 365,166.2 383,424.6 402,595.8 Tax Rate 38.5% 38.5% 38.5% 38.5% 38.5% 38.5% 38.5% 38.5% 38.5% 38.5% 38.5%
Net Income 131,492 355,554 540,443 470,356 489,170 508,737 529,086 555,540 583,318 612,483 643,108 % Growth 170.4% 52.0% -13.0% 4.0% 4.0% 4.0% 5.0% 5.0% 5.0% 5.0%
Add Depreciation/Amort 128,285 133,416 138,753 144,303 150,075 156,078 162,321 170,437 178,959 187,907 197,303 % of Sales 3.0% 3.0% 3.0% 3.0% 3.0% 3.0% 3.0% 3.0% 3.0% 3.0% 3.0%
Plus/(minus) Changes WC 1,239 1,339 1,385 1,441 1,499 1,558 1,621 1,702 1,787 1,876 1,970 % of Sales 0.0% 0.0% 0.0% 0.0% 0.0% 0.0% 0.0% 0.0% 0.0% 0.0% 0.0%
Subtract Cap Ex 259,974 262,574 265,199 275,807 286,840 298,313 216,428 227,250 238,612 250,543 263,070 Capex % of sales 6.1% 5.9% 5.7% 5.7% 5.7% 5.7% 4.0% 4.0% 4.0% 4.0% 4.0%
Free Cash Flow 1,041.63 227,735.56 415,381.43 340,292.12 353,903.80 368,059.96 476,599.88 500,429.87 525,451.36 551,723.93 579,310.13 % Growth 21763.4% 82.4% -18.1% 4.0% 4.0% 29.5% 5.0% 5.0% 5.0% 5.0%
NPV of Cash Flows 2,504,535 39%
NPV of terminal value 3,871,385 61% Terminal Value 10,041,376
Projected Equity Value 6,375,920 100%
Free Cash Flow Yield 0.01% Free Cash Yield 5.77%
Current P/E 87.5 32.3 21.3 Terminal P/E 15.6
Projected P/E 48.5 17.9 11.8
Current EV/EBITDA 31.3 15.1 10.6 Terminal EV/EBITDA 7.5
Projected EV/EBITDA 16.5 8.0 5.6
Shares Outstanding 29,200
Current Price $ 393.91
Implied equity value/share $ 218.35
Upside/(Downside) to DCF -44.6%
Debt -
Cash 667,470
Cash/share 22.86
As on Dec 31, 2015
Cash 248005
Investments 415199
Total 663204
Cash for regular operations and liquidity 7.619520548
Implied value from DCF 226.0Discount
Upside/(Downside) to DCF (after adding cash) 0.573666462 0.426333538

33
Appendix
Expedia Inc. (EXPE)
Analyst: Turki AlSabbar Terminal Discount Rate = 12.00%
7/20/2016 Terminal FCF Growth = 0.25%
(000s)
Year 2016E 2017E 2018E 2019E 2020E 2021E 2022E 2023E 2024E 2025E 2026E
Revenue 8,674,012 10,929,255 12,787,229 14,961,058 17,504,437 20,480,192 23,961,824 27,316,480 31,140,787 35,500,497 40,470,566
% Growth 26.0% 17.0% 17.0% 17.0% 17.0% 17.0% 14.0% 14.0% 14.0% 14.0%
Operating Income 520,441 1,704,964 3,529,275 4,039,486 4,726,198 5,529,652 6,469,693 5,463,296 6,228,157 7,100,099 8,094,113
Operating Margin 6.0% 15.6% 27.6% 27.0% 27.0% 27.0% 27.0% 20.0% 20.0% 20.0% 20.0%
Interest Income 346,960 218,585 127,872 149,611 175,044 204,802 239,618 273,165 311,408 355,005 404,706
Interest % of Sales 4.0% 2.0% 1.0% 1.0% 1.0% 1.0% 1.0% 1.0% 1.0% 1.0% 1.0%
Taxes 182,153.25 384,708.78 731,428.48 777,975.0 910,230.7 1,064,970.0 1,246,014.9 1,038,026.2 1,183,349.9 1,349,018.9 1,537,881.5
Tax Rate 21.0% 20.0% 20.0% 20.0% 20.0% 20.0% 20.0% 20.0% 20.0% 20.0% 20.0%
Net Income 1,049,554 2,308,258 4,388,576 3,111,900 3,640,923 4,259,880 4,984,059 4,152,105 4,733,400 5,396,076 6,151,526
% Growth 119.9% 90.1% -29.1% 17.0% 17.0% 17.0% -16.7% 14.0% 14.0% 14.0%
Add Depreciation/Amort 86,740 76,505 51,149 59,844 70,018 81,921 95,847 109,266 124,563 142,002 161,882
% of Sales 1.0% 0.7% 0.4% 0.4% 0.4% 0.4% 0.4% 0.4% 0.4% 0.4% 0.4%
Plus/(minus) Changes WC 47,640 202,972 167,218 195,645 228,904 267,818 313,347 357,216 407,226 464,237 529,230
% of Sales 0.5% 1.9% 1.3% 1.3% 1.3% 1.3% 1.3% 1.3% 1.3% 1.3% 1.3%
Subtract Cap Ex 794,911 802,861 810,889 948,740 1,110,026 1,298,731 958,473 1,092,659 1,245,631 1,420,020 1,618,823
Capex % of sales 9.2% 7.3% 6.3% 6.3% 6.3% 6.3% 4.0% 4.0% 4.0% 4.0% 4.0%
Free Cash Flow 389,023.26 1,784,873.85 3,796,053.26 2,418,648.51 2,829,818.75 3,310,887.94 4,434,780.69 3,525,927.13 4,019,556.93 4,582,294.90 5,223,816.19
% Growth 358.8% 112.7% -36.3% 17.0% 17.0% 33.9% -20.5% 14.0% 14.0% 14.0%
NPV of Cash Flows 18,817,992 57%
NPV of terminal value 14,350,075 43% Terminal Value 44,569,155
Projected Equity Value 33,168,067 100%
Free Cash Flow Yield 1.82% Free Cash Yield 11.72%
Current P/E 20.3 9.2 4.9 Terminal P/E 7.2
Projected P/E 31.6 14.4 7.6
Current EV/EBITDA 34.3 11.7 5.8 Terminal EV/EBITDA 5.3
Projected EV/EBITDA 53.8 18.3 9.1
Shares Outstanding 182,000
Current Price $ 117.19
Implied equity value/share $ 182.24
Upside/(Downside) to DCF 55.5%
Debt 402,500
Cash 900,281
Cash/share 4.95

34
Appendix
McDonald's (MCD)
Analyst: Turki AlSabbar Terminal Discount Rate = 9.00%
7/20/2016 Terminal FCF Growth = 6.0%
$ In millions
Year 2016E 2017E 2018E 2019E 2020E 2021E 2022E 2023E 2024E 2025E 2026E
Revenue 26,430 28,015 30,257 32,677 35,291 38,114 41,164 37,459 34,088 31,020 28,228
% Growth 6.0% 8.0% 8.0% 8.0% 8.0% 8.0% -9.0% -9.0% -9.0% -9.0%
Operating Income 11,867 12,579 13,585 8,823 9,529 10,291 11,114 10,114 9,204 8,375 7,622
Operating Margin 44.9% 44.9% 44.9% 27.0% 27.0% 27.0% 27.0% 27.0% 27.0% 27.0% 27.0%
Interest Income 550 530 510 817 882 953 1,029 936 852 775 706
Interest % of Sales 2.1% 1.9% 1.7% 2.5% 2.5% 2.5% 2.5% 2.5% 2.5% 2.5% 2.5%
Taxes (3,507.11) (3,734.13) (4,052.34) 2,481.8 2,680.4 2,894.8 3,126.4 2,845.0 2,589.0 2,355.9 2,143.9
Tax Rate 31.0% 31.0% 31.0% 31.0% 31.0% 31.0% 31.0% 31.0% 31.0% 31.0% 31.0%
Net Income 7,806 8,311 9,020 5,524 5,966 6,443 6,959 6,332 5,763 5,244 4,772
% Growth 6.5% 8.5% -38.8% 8.0% 8.0% 8.0% -9.0% -9.0% -9.0% -9.0%
Add Depreciation/Amort 1,538 1,520 1,500 1,620 1,750 1,890 2,041 1,857 1,690 1,538 1,399
% of Sales 5.8% 5.4% 5.0% 5.0% 5.0% 5.0% 5.0% 5.0% 5.0% 5.0% 5.0%
Plus/(minus) Changes WC (64) (71) (78) (85) (91) (99) (107) (97) (88) (80) (73)
% of Sales -0.2% -0.3% -0.3% -0.3% -0.3% -0.3% -0.3% -0.3% -0.3% -0.3% -0.3%
Subtract Cap Ex 1,542 1,311 1,114 1,203 1,299 1,403 1,647 1,498 1,364 1,241 1,129
Capex % of sales 5.8% 4.7% 3.7% 3.7% 3.7% 3.7% 4.0% 4.0% 4.0% 4.0% 4.0%
Free Cash Flow 7,737.84 8,449.59 9,327.29 5,856.21 6,324.71 6,830.69 7,246.21 6,594.05 6,000.59 5,460.54 4,969.09
% Growth 9.2% 10.4% -37.2% 8.0% 8.0% 6.1% -9.0% -9.0% -9.0% -9.0%
NPV of Cash Flows 44,597 38%
NPV of terminal value 74,165 62% Terminal Value 175,574
Projected Equity Value 118,762 100%
Free Cash Flow Yield 6.98% Free Cash Yield 2.83%
Current P/E 14.2 13.3 12.3 Terminal P/E 36.8
Projected P/E 15.2 14.3 13.2
Current EV/EBITDA 9.5 9.0 8.4 Terminal EV/EBITDA 21.3
Projected EV/EBITDA 10.1 9.6 9.0
Shares Outstanding 880
Current Price $ 126.06
Implied equity value/share $ 134.96
Upside/(Downside) to DCF 7.1%
Debt 24,122
Cash 7,686
Cash/share 8.73