Stock Market Volatility and Economic Activity · following a large stock market volatility shock...
49
by Michael Callaghan A research exercise forming a part of the requirements for the degree of B.Com. (Hons) at the University of Canterbury October 2015 Stock Market Volatility and Economic Activity
Transcript of Stock Market Volatility and Economic Activity · following a large stock market volatility shock...

by
Michael Callaghan
A research exercise forming a part of the requirements for the degree of
B.Com. (Hons)
at the
University of Canterbury
October 2015
Stock Market Volatility and
Economic Activity


Abstract
This paper examines the extent to which uncertainty impacts real economic activity. The
short-term impact of uncertainty on labour market and industrial production variables in eight
countries is analysed. Uncertainty is measured by the expected volatility implied by option
prices on a country’s stock market index. The implied volatility index on each respective
stock market is decomposed to examine the asymmetric effects of big changes in implied
volatility. A significant asymmetric effect of uncertainty is present in most countries. The
negative effects of uncertainty are particularly strong in the period during and after the Global
Financial Crisis. This suggests that the spikes in uncertainty in recent years may have
contributed to the slow global economic recovery.

Table of Contents
1 Introduction 1
2 Literature Review
2.1 Theory 3
2.2 Empirics 4
3 Measuring Uncertainty 7
4 Methodology 9
5 Results
5.1 United States 13
5.2 Euro area 15
5.3 Japan 17
5.4 Germany 19
5.5 Switzerland 21
5.6 United Kingdom 23
5.7 France 25
5.8 Hong Kong 25
6 Sub-Sample Analysis 28
7 Conclusion 30
8 References 31
9 Appendices 32

1
1. Introduction
There has been increased interest in the effects of uncertainty on real economic activity in
recent years following the Global Financial Crisis (GFC). The weak recovery and periodic
spikes of uncertainty, as well as advancement in econometric techniques, have prompted
economists to explore the effects of uncertainty on the real economy. These recent
uncertainty spikes include the European sovereign debt crisis, the United States debt ceiling
crisis, the taper tantrum1 and recent global growth concerns.
Economic theory suggests that this uncertainty may lower economic activity as firms
postpone investments and consumers postpone their purchases. There is a “wait and see”
effect as market participants wait to determine whether economic prospects (such as product
demand and job security) will improve before investing or consuming. This has implications
for the real economy.
The concern over the weak global recovery and its link to uncertainty has been noted by
many policymakers, economists and the financial press. The Chief Economist of the Bank of
England, Andrew Haldane (2015), recently noted in a speech the damaging effects of
uncertainty, citing it as a reason for interest rates being stuck on the zero lower bound in
many economies:
“This cautious behaviour… can be seen in the weakness of global investment since the crisis,
despite the cost of company borrowing being at its lowest-ever levels. Uncertainty-induced
weakness in investment has provided a continuing drag on recovery, globally if not nationally.”
The aim of this research is to test the implications of uncertainty shocks on economic activity
growth. This project is specifically interested in the asymmetric effects of uncertainty: is
there a temporary, symmetric response, where large decreases in uncertainty offset large
increases in uncertainty? Or is there an asymmetric effect, where uncertainty shocks have a
persistent, negative effect on economic activity?
The implied volatility index is used as a measure of macro-economic uncertainty and is
decomposed in a statistical model to analyse the asymmetric effects of uncertainty on
economic activity indicators. Labour market and industrial production data are used as
indicators of economic activity. I construct impulse response functions to illustrate the effect
1 The taper tantrum was a market reaction to the tapering off of U.S. Federal Reserve quantitative easing, as the
market became uncertain about the strength of the economy without such supportive monetary policy.

2
of a spike in implied volatility and the subsequent decline in economic activity growth over
the months that follow.
I extend the analysis to data from several economies that have implied volatility indices on
their stock markets. The economies included are the United States, the euro area, Japan,
Germany, the United Kingdom, Switzerland, France and Hong Kong. Results are consistent
with the previous available empirical literature, which focuses on the United States and
United Kingdom economies.
The empirical study breaks the whole sample into two sub-sample periods: the pre-GFC
period (before 2007m08) and the GFC-onwards period (2007m08 onwards). The asymmetric
effects of uncertainty tend to be more significant and persistent in the GFC-onwards sub-
sample period. This result supports recent literature on the heightened negative impact of
uncertainty when monetary policy is constrained at the zero lower bound, as is the case with
many of the countries analysed.
The results suggest a strong role of uncertainty in the slow global economic recovery.
Significant asymmetric effects of uncertainty are found across the economies analysed and
are generally stronger during and after the Global Financial Crisis. This suggests that the
large spikes in uncertainty that we have seen frequently in recent years have contributed to
the weak economic recovery, as has been suggested by many market participants.

3
2. Literature Review
2.1 Theory
Economic theory (Bernanke (1983), Bloom (2009)) suggests that uncertainty may lower
economic activity as firms postpone investments and consumers postpone their purchases.
Three main theories regarding the effect of uncertainty on economic activity are real options,
risk premia and growth effects. The first two theories support the view that an increase in
uncertainty has negative effects on the real economy while the growth effects theory
highlights the positive impact that uncertainty may have on economic growth.
Real Options
Bernanke (1983) developed the theoretical work on investment in the face of uncertainty.
Investment should only proceed when the costs of deferring a project exceed the expected
value of information gained by waiting. By increasing the value of waiting for new
information, uncertainty slows the current rate of investment. This real options effect from
increased uncertainty over future business conditions causes an initial drop in activity as
firms delay investment and hiring. This happens rapidly as expectations change upon impact
of the uncertainty shock, so hiring and investment instantly freeze (Bloom, 2009).
The literature on irreversible investment and the option value of waiting therefore predicts a
negative relationship between growth uncertainty and average growth. A similar channel
exists for consumption, with uncertainty causing consumption to be postponed. The real
options argument not only suggests that uncertainty reduces levels of investment, hiring, and
consumption, but that it also makes economic actors less sensitive to changes in business
conditions. This can make monetary policy less effective (Bloom, 2014).
There are also reasons that the usual real options effect may be weakened or not hold. If the
decision can be easily reversed, the option no longer matters. For example, firms may be
happy to hire part-time employees even when uncertainty is extremely high. These workers
are flexible and can easily be laid off if conditions worsen. If the cost of delay is very high,
then the option to wait and see is not valuable. Similarly, if a firm does not have the ability to
wait, for example, if they are competing to patent a new idea, there is no value in waiting
(Bloom, 2014). Boyle and Guthrie (2003) also note the conflicting effects of uncertainty on
investment. While uncertainty surrounding project value increases the value of delay, the

4
presence of a financing constraint means that financing uncertainty can increase the value of
investing today.
Bloom (2000) shows that real options play no role in determining the long-run rate of
investment. However, they play an important role in shaping the short-run dynamics of
investment and hiring.
Risk Premia
In the presence of financial constraints, uncertainty can raise borrowing costs which reduces
economic growth (Arellano, Bai & Kehoe, 2010). As uncertainty increases, so do risk premia,
as investors need to be compensated for the higher risk. Therefore the cost of finance should
also increase. The default premium also increases because uncertainty raises the probability
of default, by expanding the size of the left-tail default outcomes (Bloom, 2014). Uncertainty
can therefore negatively impact economic activity by increasing the cost of borrowing for
firms.
Growth Effects
Conversely, increased uncertainty may have a positive effect on long-run growth. Uncertainty
can encourage investment if it increases the size of the potential prize. Firms may be able to
benefit from growth options created through a wider range of potential outcomes. These
growth options are particularly important for research and development-intensive firms. If the
downside is limited, due to the ability to lose only sunk research and development costs, then
a rise in mean-preserving risk means higher expected profit when the product goes to market
(Bloom, 2014).
Another argument in favour of a positive relation between output volatility and growth comes
from the theory of precautionary savings, where increased risk raises desired savings and
therefore investment and growth may increase in the longer-term (Grier et al. 2004).
2.2 Empirics
The difficulty of distinguishing the effects of uncertainty from the effects of recession is often
noted in the literature. Bloom (2014) notes three approaches in the empirical literature to
identifying the causal impact of uncertainty on firms and consumers. The first focuses on
timing; estimating the movements in output, hiring, and investment that follow jumps in
uncertainty. This approach works well for unexpected shocks to uncertainty.

5
A second approach uses structural models calibrated from macro and micro moments to
quantify the potential effect of uncertainty shocks. Like many structural models, it is sensitive
to potentially debatable modelling assumptions. A third approach exploits natural
experiments like disasters, political coups, trade changes, or movements in energy and
exchange rates.
A vector autoregressive estimation for the United States by Bloom (2009) shows that
following a large stock market volatility shock (at least 1.65 standard deviations above the
mean), there is a sharp drop in industrial production in the first six months followed by a
gradual rebound. Similar results are found for employment data. Foerster (2014) also
analyses the United States economy, using a statistical model to relate employment and
economic activity growth to changes in uncertainty. Foerster finds asymmetry in the response
of both employment growth and economy activity growth to changes in the implied volatility
index, a proxy for aggregate uncertainty. Large decreases in uncertainty and small changes in
either direction seem to have little or no effect on employment. Large increases in
uncertainty, however, produce statistically significant declines in both employment and
economic activity growth in the months following.
Bloom (2009) uses a parameterised model to simulate a macro uncertainty shock, which
produces a rapid drop and rebound in aggregate output and employment. Hiring and
investment rates fall dramatically in the four months after the shock because higher
uncertainty increases the real option value to waiting, so firms scale back their plans. The
immediate short-term impact of these shocks is similar to the vector autoregressive model
with the negative impact on economic activity being greatest two months after the uncertainty
shock. Once uncertainty starts to drop, pent-up demand for hiring and investment leads to a
rapid rebound. Hence, uncertainty shocks generate short, sharp drops and rebounds in output.
The literature tends to focus on data from the United States. Using data from the United
Kingdom, Denis and Kannan (2013) find a significant impact of uncertainty shocks on
industrial production and GDP, while unemployment is less affected. A vector autoregressive
model is used with the implied volatility index of the stock market as the primary measure of
uncertainty, as well as the dispersion of GDP forecasts. The peak impact of uncertainty
shocks is felt fairly quickly at around six to twelve months after the shock, with the most
substantial shifts occurring in the first few months. They conclude that uncertainty shocks
have a relatively short, but sharp, impact on economic activity.

6
Bekaert, Hoerova and Lo Duca (2013) decompose the S&P500 implied volatility index, the
VIX, into two components; a proxy for risk aversion and expected stock market volatility.
The latter component can give a purer measure of ‘physical’ expected volatility, as the
variance premium (risk aversion) is removed. This technique requires high frequency stock
market data, in this case five minute returns, to compute the conditional variance. Similarly,
Jones and Enders (2013) estimate the S&P500 index as a GARCH process for volatility
clustering and use the estimated conditional variance as an uncertainty measure.
Bekaert and Hoerova (2014) note that using the implied volatility index to measure
uncertainty, as Bloom (2009) does, may mean that results are driven by the variance premium
rather than uncertainty per se. Using a similar decomposition, they find that while the
variance risk premium predicts stock returns, it has no predictive power for future economic
activity. Stock market volatility meanwhile does predict industrial production growth, again
with data from the United States. The bivariate regressions with its two components show
that whatever predictive power the implied volatility index has for future output, is coming
from the uncertainty component. They find that the implied volatility index predicts
economic activity with a negative sign at all horizons, with industrial production growth
falling sharply over the next quarter.
Basu and Bundick (2011) calibrate the size of uncertainty shocks using fluctuations in the
implied volatility index. Relevant to the current global economic environment, they show that
if the central bank is constrained by the zero lower bound, then monetary policy can no
longer perform its usual stabilising function and higher uncertainty has even more negative
effects on the economy. Caggiano, Castelnuovo and Pellegrino (2015) also find the
contractionary effects of uncertainty shocks are statistically larger when the zero lower bound
is binding, using a vector autoregressive model. This is consistent with recent statements by
policymakers, economists and the financial press regarding uncertainty.
Together the empirical literature suggests that uncertainty is damaging to short-run economic
activity. There has been advancement into the area of uncertainty in recent years, with a
wealth of new research and the application of econometric techniques. The longer-run
evidence of the effect of uncertainty on output is more limited and inconclusive. One reason
is that while uncertainty appears to reduce short-run hiring and investment, it may also
stimulate research and development – the growth effects argument.

7
3. Measuring Uncertainty
There are many uncertainty measures noted in the literature – economic surprise index, policy
uncertainty index, forecasts, level of disagreement in forecasts, a measurement of how many
times the words ‘uncertain’ and ‘economy’ appear in articles. What I will use in this paper to
measure uncertainty is the change in the implied volatility index, commonly referred to as the
VIX, on the respective stock market.
Implied volatility indices are intended to provide a benchmark of expected short-term (30-
day) market volatility. The VIX is forward-looking and measures volatility that investors
expect to see (Whaley, 2008). The most familiar implied volatility index is the United States
VIX index on the S&P500 index which is traded on the Chicago Board Options Exchange. It
is constructed from the values of a range of call and put options on the stock market index
and essentially measures the ‘risk-neutral’ expected stock variance for the S&P500 index
(Bekaert et al. 2013). More volatility
is priced in by the market over the
coming month when uncertainty is
high. Implied volatility indices have
the advantage of being market based,
forward-looking, and based on
expectations. Movements in the
implied volatility index provide an
almost instantaneous measure of the
level of aggregate uncertainty in the
economy.
Implied stock market volatility has
been used as a proxy for uncertainty
previously in the literature in recent
years (Denis & Kannan (2013),
Foerster (2014), Bloom (2009),
Bekaert, Hoerova & Lo Duca (2013)).
Bloom (2009) shows that stock market volatility shocks are highly correlated with other
measures of uncertainty, like the cross-sectional spread of firm and industry level earnings
and productivity growth.
Figure 1: United States S&P500 VIX Index
Change in the United States S&P500 VIX Index

8
The level of the VIX tends to increase during recessions, as well as the change in the VIX.
This is consistent across the countries analysed. Figure 1A in the appendix shows the
volatility indices for each country. The shaded areas are periods of recession, defined as two
consecutive periods of negative real GDP growth.
The correlations presented in Table 1 show the strong co-movement in the implied volatility
indices across the various countries. The United States has an implied volatility index that is
highly correlated with the other countries’ implied volatility indices. This is a sign of the
increasingly globalised and interconnected financial markets and an indication of the
prominent status of the United States as a key player in the global financial market. Also of
note is the very high correlation between the European indices, while the volatility indices for
Hong Kong and Japan show slightly weaker correlation.
Table 1: Implied Volatility Correlations
US
VIX
Swiss
VIX
UK
VIX
Euro
VIX
German
VIX
French
VIX
HK
VIX
Japan
VIX
US VIX 1.000
Swiss VIX 0.866 1.000
UK VIX 0.952 0.924 1.000
EURO VIX 0.882 0.869 0.917 1.000
DAX VIX 0.809 0.946 0.876 0.854 1.000
French VIX 0.817 0.943 0.880 0.847 0.974 1.000
HK VIX 0.833 0.756 0.791 0.693 0.648 0.658 1.000
Japan VIX 0.824 0.705 0.805 0.743 0.612 0.608 0.705 1.000
All volatility indices are also plotted together on Figure 2A in the appendix. This again
illustrates the strong co-movement between the different implied volatility indices.

9
4. Methodology
The implied volatility index on each respective stock market is used as a proxy for market
uncertainty. Using monthly data, I regress the change in economic activity variables on a
number of lagged variables. These lagged variables include stock market growth and change
in the implied volatility index. This is to examine the effect that changes in uncertainty have
on economic activity indicators in the next period, while controlling for other factors such as
the change in the exchange rate or stock market movements. This regression therefore looks
at the impact of uncertainty shocks on the subsequent month.
This project adds to the existing literature in two ways. Firstly, it expands the analysis to a
number of economies that have not been analysed by the growing empirical literature. The
literature focuses almost exclusively on data from the United States, perhaps because it has
the original and longest implied volatility series. However, these implied volatility indices are
also available on the stock markets of other economies, albeit with a shorter data horizon. I
extend the analysis to data from the United States, the euro area, Japan, Germany, the United
Kingdom, Switzerland, France and Hong Kong. Data availability on an implied volatility
index limits the analysis to these economies, although it is still a far broader analysis than that
available in the current literature.
Secondly, I break down the samples into sub-sample periods ‘pre-GFC’ (before 2007m08)
and ‘GFC-onwards’ (2007m08 onwards). This is to see if the effect of uncertainty on
economic activity in recent years is different from that before the GFC.
The recent literature on uncertainty, mentioned previously, has emphasised the negative
impact of uncertainty shocks on economic activity in the months following the shock.
Uncertainty shocks are shown to have a short, sharp effect on economic activity. Economic
activity gradually returns to previous levels following the shock and may overshoot in the
medium term. Therefore it is appropriate to look at monthly data and the direct, immediate
effects of uncertainty.
Jones and Enders (2013) note that small changes in the level of uncertainty may not matter
due to adjustment costs. However, in the face of large uncertainty shocks, the costs of
inaction are likely to outweigh these adjustment costs. It is therefore important to distinguish
between the relative impacts that big uncertainty shocks may have. They also note that
uncertainty increases are likely to be transmitted to the economy faster than uncertainty
decreases, as it takes longer to expand capacity and hire labour than it does to shut down

10
capacity or lay off workers. The asymmetric effect of uncertainty is therefore an important
factor which the model will explore.
This paper will follow the procedure of Foerster (2014) in analysing the asymmetric effects
of implied volatility shocks in the months following. The regressions only consider the direct
effects of uncertainty. Longer lags and feedback are ignored in this model; however, the
empirical evidence discussed previously supports the short, sharp nature of uncertainty
shocks.
The Model
Three regressions are analysed to test the symmetric and asymmetric effects of uncertainty on
economic activity. The three regressions are symmetric, symmetric with big changes, and
asymmetric.
The model is at a monthly frequency from the first availability of the implied volatility index
through to March 2015:
For each country;
(
), monthly percentage change in economic activity.
(
), lagged monthly percentage change in stock market index.
lagged inflation adjusted short-term interest rate. The real short-term interest rate is defined as
the 90-day Libor less CPI inflation. The annual rate of CPI inflation is calculated as
.
(
), lagged monthly percentage change in the real trade weighted exchange rate.
, lagged monthly change in the implied volatility index.
The coefficient captures persistence in economic activity. The coefficient captures the
effect of stock market prices on economic activity. We might expect this to be positively
related to economic activity. This is because news that boosts the stock market index is likely
to be beneficial to economic activity in the next period.
Labour market variables, such as employment growth or unemployment rate growth, are used
as dependent variables in the regressions. This is to explore the effect that an uncertainty

11
shock has on employment decisions, as employment is a form of investment in human
capital. Industrial production growth is also used as a dependent variable in a second set of
regressions. Industrial production is a good measure of economic activity and both these
indicators are widely available as monthly data across the countries analysed.
The real interest rate and the change in the exchange rate are also included in the regression
as control variables, although their results are not reported as they are generally not
significant and do not affect the results of the regressions materially.
Following the procedure of Foerster (2014) on the United States economy, additional
variables are constructed by decomposing the change in the VIX into big changes (greater
than one standard deviation from the mean) and distinguishing between positive and negative
big changes;
{
{
The symmetric regression only includes the change in the volatility variable ( = =0).
The symmetric with big changes regression sets the coefficients on the two ‘big changes’
variables equal to each other ( = ). It takes a value of zero if the observation is less than
one standard deviation from the mean, and it retains its value otherwise. This regression
therefore looks at the additional effect that big uncertainty shocks have.
The asymmetric regression is of the form of the equation above, where the two additional
variables capture possible asymmetry in VIX changes. The equation allows changes in the
VIX to have different effects on the change in activity depending on their size and direction.
For example, the effect of a small change in the VIX is ∙∆VIX, the effect of increases in the
VIX by more than one standard deviation is ( )∙∆VIX, and the effect of decreases in the
VIX by more than one standard deviation is ( )∙∆VIX.
To test the hypothesis of an asymmetric response of uncertainty, I use a Wald test to see if the
difference of the coefficients on
and
is statistically significant from zero;
. The resulting F-statistic tests whether large positive and large negative changes
have equal influence. A statistically significant F-statistic means that the coefficients are
significantly different from each other. In the case of a spike in implied volatility, as shown

12
later in the impulse response function charts (Figure 3A), a statistically significant F-statistic
means that a big decrease in implied volatility does not offset the effect on economic activity
that the big increase in implied volatility had.
The impulse response functions show the economic effects of a two standard deviation
increase, and subsequent decrease, in the implied volatility index. Ninety percent confidence
intervals for the asymmetric regression are also shown. The results are reported as monthly
figures, not annualised, for easier interpretation when the results are displayed on the impulse
response functions.
Table 2: Summary Statistics of Change in the Implied Volatility Index
The reported standard errors are Newey-West standard errors, robust to autocorrelation. All
series run from the earliest available implied volatility index data, reported above, through to
03/2015. The dramatic March 2011 spike in implied volatility for Japan is reduced to one
standard deviation from the mean, as the shock was about a ten standard deviation move.
This outlier was due to the natural disaster that struck Japan.
Summary statistics for the raw implied volatility indices are also reported in Table 1A of the
appendix.
United
States
Japan Euro area Germany United
Kingdom
Switzerland France Hong
Kong
Stock market
index
S&P500 Nikkei
225
STOXX
600
DAX30 FSTE100 SMI20 CAC40 Hang
Seng
Average change -0.04 -0.10 -0.20 0.01 -0.05 -0.02 -0.04 -0.08
Standard
deviation
4.94 5.47 11.38 4.44 5.67 4.96 5.44 4.47
Largest increase 37.55 36.95 58.47 30.67 32.31 29.59 32.59 26.95
Largest
decrease
-16.59 14.16 -39.07 -10.57 -14.85 -11.86 -12.87 -13.23
Number of big
increases
32 20 21 30 21 23 22 19
Number of big
decreases
30 19 19 32 17 24 21 20
Observations 301 209 195 267 185 188 183 171
Series start 01/1990 11/1997 01/1999 01/1993 11/1999 07/1999 01/2000 01/2001

13
5. Results
5.1 United States
EFFECT OF UNCERTAINTY ON EMPLOYMENT GROWTH AND INDUSTRIAL PRODUCTION GROWTH
Dependent variable: percent
employment growth
Symmetric
( = =0)
Symmetric with big
changes ( = ) Asymmetric
Lagged activity .7605*** .7562*** .7150***
(.0663) (.0658) (.0580)
S&P500 growth .0043* .0045* .0048**
(.0023) (.0023) (.0023)
VIX changes .0019 .0067** .0076***
(.0023) (.0027) (.0029)
VIX big changes -- -.0057* --
(.0030)
VIX big increases -- -- -.0107***
(.0035)
VIX big decreases -- -- .0023
(.0038)
Constant .0179* .0197* .0340***
(.0101) (.0101) (.0090)
F-statistic for asymmetry -- -- 10.43***
Adjusted R-squared .6232 .6271 .6368
Dependent variable: percent
industrial production growth
Symmetric
( = =0)
Symmetric with big
changes ( = ) Asymmetric
Lagged activity .1840* .1865* .1425*
(.0951) (.0951) (.0796)
S&P500 growth .0377** .0380** .0375**
(.0158) (.0159) (.0152)
VIX changes .0238* .0456** .0486**
(.0137) (.0206) (.0207)
VIX big changes -- -.0263 --
(.0187)
VIX big increases -- -- -.0544***
(.0169)
VIX big decreases -- -- .0232
(.0295)
Constant .1233* .0130** .2035***
(.0647) (.0650) (.0481)
F-statistic for asymmetry -- -- 8.401***
Adjusted R-squared .0644 .0669 .1116
Note: Real interest rate and change in real exchange rate also included as explanatory variables in each regression.
Results significant at 1%, 5%, and 10% levels are indicated by ***, **, and *, respectively.
Newey West standard errors are in parentheses. Sources: DataStream, Bloomberg, and author's calculations.
Sample period: 01/1990-03/2015

14
The table for the United States shows two sets of regressions against two different economic
activity dependent variables; a labour market growth variable and industrial production
growth.
The first set of regression results for the United States uses the percentage growth in
employment as the dependent variable. The data comes from non-farm private payrolls, with
a mean monthly change of 0.09 percent and a standard deviation of 0.17. The second set of
regression results considers the effects of changes in uncertainty on industrial production
growth. The mean monthly change in industrial production is 0.18 percent, with a standard
deviation of 0.65.
The symmetric regression results from the employment growth set show the importance of
considering an asymmetric effect of uncertainty; the change in VIX alone suggests an
insignificant effect on employment growth. For industrial production, the symmetric
regression shows a small positive effect of change in uncertainty on industrial production
growth. Both sets of regression results show a significant, positive effect of SMI growth on
economic activity. The coefficients on the real interest rate and change in exchange rate were
statistically insignificant.
The coefficient on the
is negative in both regressions and statistically significant in
the employment regression, suggesting that big increases in uncertainty have a more negative
effect than small increases. Importantly, for the asymmetric regression, the coefficients on the
and
variables are statistically significantly different from each other
(statistically significant F-statistic), implying an asymmetric effect of uncertainty on both
economic activity indicators i.e. lag increases in uncertainty are detrimental to economic
growth.
The implications of these results are shown in the impulse response functions in Figure 3A of
the appendix. The effect of a two standard deviation increase, and subsequent decrease, in the
implied volatility index is shown. As a result, employment growth is reduced 0.1 percentage
points at its lowest point before slowly returning to its original growth level. Similarly,
industrial production growth falls 0.7 percentage points following the uncertainty shock
before recovering over time. These results are economically significant, given the fall in
employment growth is greater than the average monthly employment growth, and industrial
production growth falls more than one standard deviation.

15
5.2 Euro area
EFFECT OF UNCERTAINTY ON UNEMPLOYMENT GROWTH AND INDUSTRIAL PRODUCTION GROWTH
Dependent variable: percent
change in unemployment rate
Symmetric
( = =0)
Symmetric with big
changes ( = ) Asymmetric
Lagged activity .4077*** .4095*** .3686***
(.1289) (.1301) (.1175)
Stoxx600 growth -.0591*** -.0631*** -.0404**
(.0177) (.0182) (.0157)
VIX changes -.0183*** -.0466*** -.0412***
(.0066) (.0163) (.0155)
VIX big changes -- .0319** --
(.0158)
VIX big increases -- -- .0522***
(.0168)
VIX big decreases -- -- .0044
(.0177)
Constant .1080* .0961 -.0005
(.0598) (.0613) (.0624)
F-statistic for asymmetry -- -- 7.569***
Adjusted R-squared .2653 .2767 .3106
Dependent variable: percent
industrial production growth
Symmetric
( = =0)
Symmetric with big
changes ( = ) Asymmetric
Lagged activity .0054 .0055 -.0056
(.1995) (.0745) (.1791)
Stoxx600 growth .0711*** .0725*** .0495**
(.0207) (.0201) (.0197)
VIX changes .0053 .0157 .0099
(.0078) (.0190) (.0159)
VIX big changes -- -.0117 --
(.0190)
VIX big increases -- -- -.0341*
(.0196)
VIX big decreases -- -- .0019
(.0194)
Constant .0332 .0371 .0433**
(.0847) (.0785) (.0077)
F-statistic for asymmetry -- -- 6.386**
Adjusted R-squared .0740 .0708 .1102
Note: Real interest rate and change in real exchange rate also included as explanatory variables in each regression.
Results significant at 1%, 5%, and 10% levels are indicated by ***, **, and *, respectively.
Newey West standard errors are in parentheses. Sources: DataStream, Bloomberg, and author's calculations.
Sample period: 01/1999-03/2015
16
The results from the euro area are consistent with the idea of an asymmetric effect of
uncertainty on both percentage change in the unemployment rate and industrial production
growth.
The first set of regression results for the euro area uses the percentage change in the
unemployment rate as the dependent variable. Therefore a positive coefficient indicates an
increase in the unemployment rate – an indicator of decreased economic activity. It is
important to distinguish between the unemployment rate and the percentage change in the
unemployment rate when interpreting the results. The mean monthly percentage change in
the unemployment rate is 0.06 percent, with a standard deviation of 1.05. This means that if
the unemployment rate was at 10.00% for example, then a one standard deviation increase in
the percentage change of the unemployment rate would raise the unemployment rate to
10.11% (10*1.0105) in a given month, i.e. a 0.11 percentage point increase in the
unemployment rate. The second set of regression results considers the effects of changes in
uncertainty on industrial production growth. The mean monthly change in industrial
production is 0.05 percent, with a standard deviation of 1.05.
The symmetric regression shows no significant effect of change in uncertainty on industrial
production growth, but the positive effect of stock market index growth on economic activity
is significant throughout the regressions.
The F-statistic of 7.57 for percentage change in the unemployment rate and 6.39 for industrial
production growth shows a statistically significant difference between the
and
coefficients, indicating an asymmetric effect of big changes in uncertainty.
The impulse response function chart in Figure 3A in the appendix illustrates the implications
of these results. The effect of a two standard deviation increase, and subsequent decrease, in
the implied volatility index on the Stoxx600 is shown. Note that the axis for unemployment
growth has been inverted to show consistently that a downward movement in the chart is
associated with a decrease in economic activity. As a result of the shock, the percentage
change in the unemployment rate increases a maximum of 0.9 percentage points above the
norm before slowly returning to its original growth level. Similarly, industrial production
growth falls 0.65 percentage points following the uncertainty shock, before recovering. These
results are economically significant, given that the percentage change in the unemployment
rate increases almost one standard deviation following the shock, and industrial production
falls two thirds of a standard deviation.

17
5.3 Japan
EFFECT OF UNCERTAINTY ON ECONOMIC ACTIVITY AND INDUSTRIAL PRODUCTION GROWTH
Dependent variable: percent
coincident index growth
Symmetric
( = =0)
Symmetric with big
changes ( = ) Asymmetric
Lagged activity .3515** .3514** .3094**
(.1509) (.1511) (.1432)
Nikkei growth .0144 .0152 .0187
(.0164) (.0164) (.0168)
VIX changes -.0292* -.0554 -.0483
(.0175) (.0468) (.0458)
VIX big changes -- .0327 --
(.0481)
VIX big increases -- -- -.0166
(.0501)
VIX big decreases -- -- .0949
(.0617)
Constant -.0486 -.0592 .0551
(.1272) (.1331) (.1225)
F-statistic for asymmetry -- -- 4.434**
Adjusted R-squared .2384 .2363 .2541
Dependent variable: percent
industrial production growth
Symmetric
( = =0)
Symmetric with big
changes ( = ) Asymmetric
Lagged activity .0726 .0729 .0519
(.1384) (.1391) (.1259)
Nikkei growth .0187 .0207 .0236
(.0252) (.0249) (.0251)
VIX changes -.0496 -.1114 -.1002
(.0304) (.0715) (.0699)
VIX big changes -- .0771 --
(.0759)
VIX big increases -- -- .0038
(.0812)
VIX big decreases -- -- .1691*
(.0957)
Constant -.1218 -.1468 .0219
(.1952) (.2035) (.1672)
F-statistic for asymmetry -- -- 3.404*
Adjusted R-squared .0554 .0549 .1049
Note: Real interest rate and change in real exchange rate also included as explanatory variables in each regression.
Results significant at 1%, 5%, and 10% levels are indicated by ***, **, and *, respectively.
Newey West standard errors are in parentheses. Sources: DataStream, Bloomberg, and author's calculations.
Sample period: 11/1997-03/2015

18
The results for Japan show a statistically significant asymmetric response to big changes in
uncertainty for both economic activity indicators.
A coincident index is used as an indicator of economic activity, similar to Foerster’s (2014)
use of an aggregate economic activity index on the United States economy. The coincident
index is a single summary statistic that tracks the current state of the Japanese economy. The
index is calculated using month-over-month percentage changes in 11 leading indicators, 11
coincident indicators, and 6 lagging indicators. The mean monthly change in the coincident
index is 0.04 percent, with a standard deviation of 1.54.
The second set of regression results considers the effects of changes in uncertainty on
industrial production growth. The mean monthly change in industrial production is -0.03
percent, with a standard deviation of 2.34.
The impulse response function (Figure 2) shows the effect of a two standard deviation shock
to uncertainty, in this case a 10.94 increase
in the VIX on the Nikkei stock market.
While the coefficients on the implied
volatility index changes are all statistically
insignificant in the coincident index
regression results, the combined overall
effects ( and ) produce a
statistically significant result. As a result of
the shock, economic activity growth falls
0.75 percentage points before slowly
returning to its original growth level.
Similarly, industrial production growth falls
1.00 percentage points following the
uncertainty shock, before recovering. The
persistence in activity is only 0.05 in this
case, so activity recovers fairly quickly.
These results are economically significant,
given the shock produces falls of around half
a standard deviation in economic activity.
Figure 2: Japan Impulse Response Function

19
5.4 Germany
EFFECT OF UNCERTAINTY ON UNEMPLOYMENT GROWTH AND INDUSTRIAL PRODUCTION GROWTH
Dependent variable: percent
change in unemployment rate
Symmetric
( = =0)
Symmetric with big
changes ( = ) Asymmetric
Lagged activity .3717*** .3907*** .3903***
(.0626) (.0633) (.0636)
DAX growth -.0361** -.0303** -.0298**
(.0160) (.0143) (.0139)
VIX changes -.0256 .0943** .0941**
(.0245) (.0388) (.0388)
VIX big changes -- -.1350*** --
(.0346)
VIX big increases -- -- -.1302***
(.0331)
VIX big decreases -- -- -.1432***
(.0454)
Constant -.0816 -.0676 -.0778
(.0849) (.0845) (.0894)
F-statistic for asymmetry -- -- .1498
Adjusted R-squared .1433 .1758 .1728
Dependent variable: percent
industrial production growth
Symmetric
( = =0)
Symmetric with big
changes ( = ) Asymmetric
Lagged activity -.1870 -.1823 -.2135*
(.1322) (.1325) (.1252)
DAX growth .0560** .0532** .0486**
(.0256) (.0251) (.0245)
VIX changes .0093 -.0503 -.0459
(.0348) (.0557) (.0584)
VIX big changes -- .0675 --
(.0561)
VIX big increases -- -- .0113
(.0619)
VIX big decreases -- -- .1592**
(.0641)
Constant .2024 .1969 .3160***
(.1251) (.1244) (.1209)
F-statistic for asymmetry -- -- 5.684**
Adjusted R-squared .0542 .0560 .0817
Note: Real interest rate and change in real exchange rate also included as explanatory variables in each regression.
Results significant at 1%, 5%, and 10% levels are indicated by ***, **, and *, respectively.
Newey West standard errors are in parentheses. Sources: DataStream, Bloomberg, and author's calculations.
Sample period: 01/1993-03/2015

20
The first set of regression results for Germany uses the percentage change in the
unemployment rate as the dependent variable. The mean monthly percentage change in the
unemployment rate is -0.09 percent, with a standard deviation of 1.19. For example an
unemployment rate of 8.00% would move one standard deviation up to 8.10 % or down to
7.90% in a given month. The second set of regression results considers the effects of changes
in uncertainty on industrial production growth. The mean monthly change in industrial
production is 0.11 percent, with a standard deviation of 1.46.
Germany shows no significant asymmetric response in uncertainty for the labour market
variables, but a strong symmetric effect. This result may be due to the more rigid labour
market conditions in Germany in comparison to other countries such as the United States.
When industrial production growth is considered, a statistically significant asymmetric
response to big changes in uncertainty does appear.
In the impulse response function shown, note again that the y-axis values have been inverted
in the unemployment rate growth to illustrate consistently across the charts that a movement
downwards reflects a decrease in economic
activity.
As a result of the shock, unemployment rate
growth falls about 0.30 percentage points then
increases 0.30 percentage points before
returning to its original growth level – a
symmetric response. In contrast, industrial
production growth falls 0.90 percentage points
following the uncertainty shock, before
recovering. The results show that the
uncertainty shock has an economically
significant effect on industrial production
growth, given the shock produces a fall of
around two thirds of a standard deviation. The
symmetric response of the percent change in
the unemployment rate to the shock
demonstrates how in this case the effects on
economic activity are offset by the subsequent
decrease in uncertainty.
Figure 3: Germany Impulse Response Function
21
5.5 Switzerland
EFFECT OF UNCERTAINTY ON UNEMPLOYMENT GROWTH AND INDUSTRIAL PRODUCTION GROWTH
Dependent variable: percent
change in unemployment rate
Symmetric
( = =0)
Symmetric with big
changes ( = ) Asymmetric
Lagged activity .8320*** .8331*** .8189***
(.0992) (.1003) (.1003)
SMI20 growth -.0195 -.0168 -.0077
(.0164) (.0164) (.0162)
VIX changes -.0196 .0186 .0178
(.0225) (.0325) (.0316)
VIX big changes -- -.0419 --
(.0312)
VIX big increases -- -- .0016
(.0281)
VIX big decreases -- -- -.1153**
(.0462)
Constant .0482 .0568 -.0499
(.0863) (.0835) (.0832)
F-statistic for asymmetry -- -- 7.477***
Adjusted R-squared .7008 .7001 .7093
Dependent variable: percent
industrial production growth
Symmetric
( = =0)
Symmetric with big
changes ( = ) Asymmetric
Lagged activity .8942*** .8947*** .8920***
(.0363) (.0379) (.0375)
SMI20 growth .1301*** .1290*** .1197***
(.0427) (.0455) (.0439)
VIX changes .1316*** .1162 .1164
(.0441) (.1459) (.1457)
VIX big changes -- .0169 --
(.1277)
VIX big increases -- -- -.0225
(.1193)
VIX big decreases -- -- .0817
(.1480)
Constant .2723 .2676 .3717*
(.1898) (.1819) (.1887)
F-statistic for asymmetry -- -- 2.89*
Adjusted R-squared .8347 .8347 .8290
Note: Real interest rate and change in real exchange rate also included as explanatory variables in each regression.
Results significant at 1%, 5%, and 10% levels are indicated by ***, **, and *, respectively.
Newey West standard errors are in parentheses. Sources: DataStream, Bloomberg, and author's calculations.
Sample period: 07/1999-03/2015

22
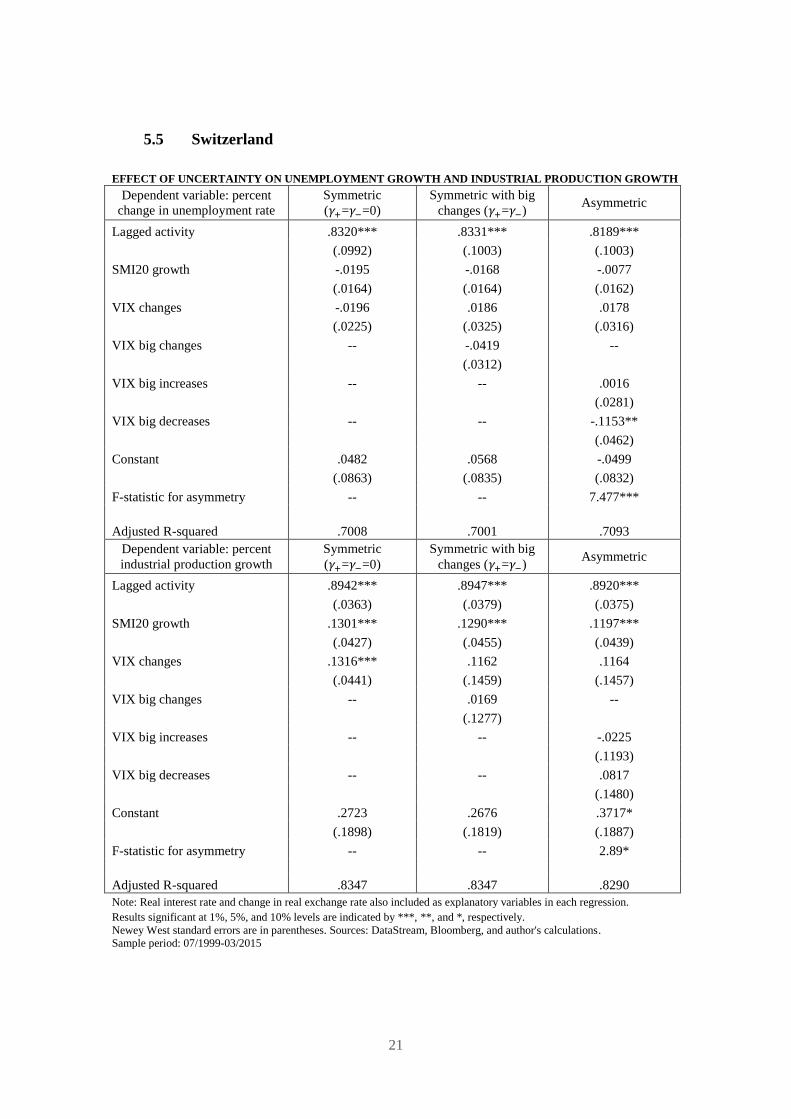
The first set of regression results for Switzerland uses the percentage growth in the
unemployment rate as the dependent variable. The mean monthly change in the
unemployment rate is 0.09 percent, with a standard deviation of 2.32. The second set of
regression results considers the effects of changes in uncertainty on industrial production
growth. The mean monthly change in industrial production is 2.83 percent, with a standard
deviation of 5.59.
The percentage change in Switzerland’s unemployment rate displays an asymmetric response
to big changes in uncertainty. The persistence of both variables is high, as shown by the large
coefficients (around 0.8) on the lagged economic activity variables. The percentage change in
the industrial production variable shows less significant results, yet still has asymmetric
properties in the big implied volatility changes variable. This weaker regression result for
industrial production growth may be due to the small contribution of industrial production to
the Swiss economy.
Interestingly, the change in the real trade-weighted exchange rate is significantly negatively
correlated with industrial production growth at a 5 percent level of confidence. The strength
in the Swiss franc has been noted as one of the key issues faced by Swiss manufacturing
companies, forcing them to make operational adjustments while cutting into margins. In a
recent industry survey 48% of respondents assessed the effects of the strong Swiss franc on
their profitability as “very negative”, while an additional 43% assessed it as “rather negative”
(Deloitte, 2014).
The impulse response function in Figure 3A of the appendix shows the effect of a two
standard deviation shock to uncertainty. As a result of the shock, the percentage change in the
unemployment rate falls 1.15 percentage points before slowly returning to its original growth
level. Industrial production growth increases initially, before falling and recovering slowly
over time. The persistence mentioned previously means that the economic activity indicators
take a long time to return to their original growth levels. The shock produces a persistent
increase of around one half of a standard deviation in unemployment rate growth.

23
5.6 United Kingdom
EFFECT OF UNCERTAINTY ON UNEMPLOYMENT GROWTH AND INDUSTRIAL PRODUCTION GROWTH
Dependent variable: percent
change in unemployment rate
Symmetric
( = =0)
Symmetric with big
changes ( = ) Asymmetric
Lagged activity .3065*** .3037*** .2963***
(.0932) (.0911) (.0863)
FTSE growth -.0384 -.0348 -.0219
(.0478) (.0462) (.0472)
VIX changes -.0149 .0313 .0376
(.0355) (.0480) (.0495)
VIX big changes -- -.0527 --
(.0534)
VIX big increases -- -- -.0329
(.0551)
VIX big decreases -- -- -.0847
(.0667)
Constant .0059 .0256 -.0262
(.1518) (.1592) (.1643)
F-statistic for asymmetry -- -- .8370
Adjusted R-squared .0866 .0853 .0840
Dependent variable: percent
industrial production growth
Symmetric
( = =0)
Symmetric with big
changes ( = ) Asymmetric
Lagged activity -.2596** -.2708*** -.2675**
(.1020) (.1011) (.1034)
FTSE growth .0184 .0222 -.0024
(.0286) (.0292) (.0271)
VIX changes -.0011 .0441 .0321
(.0213) (.0316) (.0314)
VIX big changes -- -.0515 --
(.0312)
VIX big increases -- -- -.0868**
(.0355)
VIX big decreases -- -- .0065
(.0385)
Constant -.0980 -.0802 .0114
(.0751) (.0758) (.0731)
F-statistic for asymmetry -- -- 4.009**
Adjusted R-squared .0470 .0537 .0904
Note: Real interest rate and change in real exchange rate also included as explanatory variables in each regression.
Results significant at 1%, 5%, and 10% levels are indicated by ***, **, and *, respectively.
Newey West standard errors are in parentheses. Sources: DataStream, Bloomberg, and author's calculations.
Sample period: 11/1999-03/2015

24
The effect on the labour market is not significant in the first set of regressions for the United
Kingdom. In fact, the marginal predictive power of the model is negative as the asymmetric
variables are included. There is, however, a statistically significant asymmetric effect of
uncertainty on industrial production growth in the United Kingdom. The predictive power of
the model is still low, at 9.04%, but the asymmetric variables do add predictive power when
compared to the adjusted r-squared of the symmetric regression.
The first set of regression results for the United Kingdom uses the percentage growth in the
unemployment rate as the dependent variable. The mean monthly change in the
unemployment rate is -0.03 percent, with a standard deviation of 1.71. The second set of
regression results considers the effects of changes in uncertainty on industrial production
growth. The mean monthly change in industrial production is -0.07 percent, with a standard
deviation of 0.96.
The impulse response function shows the
effect of a two standard deviation
uncertainty shock on both labour market
and industrial production variables. There
is no statistically significant effect of the
uncertainty shock on unemployment rate
growth, as shown by the 90% confidence
interval for the asymmetric regression
being indistinguishable from zero.
Industrial production growth falls 0.6
percentage points as a result of the shock.
This is economically significant given the
mean monthly industrial production
growth is -0.07 percent, with a standard
deviation of 0.96 for the United Kingdom.
These results are consistent with the work
from Denis and Kannan (2013), who use a
vector autoregressive model and find a
significant impact of uncertainty shocks
on industrial production and GDP, while unemployment is less affected.
Figure 4: United Kingdom Impulse Response Function
5.7 France
EFFECT OF UNCERTAINTY ON UNEMPLOYMENT GROWTH AND INDUSTRIAL PRODUCTION GROWTH
Dependent variable: percent
change in unemployment
Symmetric
( = =0)
Symmetric with big
changes ( = ) Asymmetric
Lagged activity .6714*** .6731*** .6614***
(.0964) (.0942) (.0863)
CAC40 growth -.0239* -.0278** -.0242*
(.0140) (.0131) (.0140)
VIX changes -.0175 -.0612*** -.0603***
(.0170) (.0224) (.0224)
VIX big changes -- .0492* --
(.0250)
VIX big increases -- -- .0599*
(.0315)
VIX big decreases -- -- .0300
(.0228)
Constant .0892 .0762 .0482
(.0431) (.0428) (.0540)
F-statistic for asymmetry -- -- 1.025
Adjusted R-squared .4918 .5010 .5023
Dependent variable: percent
industrial production growth
Symmetric
( = =0)
Symmetric with big
changes ( = ) Asymmetric
Lagged activity -.2601*** -.2623** -.2771***
(.0749) (.1190) (.1012)
CAC40 growth .0569** .0639** .0493*
(.0268) (.0306) (.0288)
VIX changes -.0047 .0704 .0661
(.0270) (.0529) (.0509)
VIX big changes -- -.0841* --
(.0463)
VIX big increases -- -- -.1245**
(.0555)
VIX big decreases -- -- -.0130
(.0644)
Constant -.0159 .0051 .1230
(.1062) (.0801) (.1102)
F-statistic for asymmetry -- -- 1.950
Adjusted R-squared .1093 .1197 .1426 Note: Real interest rate and change in real exchange rate also included as explanatory variables in each regression.
Results significant at 1%, 5%, and 10% levels are indicated by ***, **, and *, respectively.
Newey West standard errors are in parentheses. Sources: DataStream, Bloomberg, and author's calculations. Sample period: 01/2000-03/2015
5.8 Hong Kong
EFFECT OF UNCERTAINTY ON UNEMPLOYMENT GROWTH AND INDUSTRIAL PRODUCTION GROWTH
Dependent variable: percent
change in unemployment rate
Symmetric
( = =0)
Symmetric with big
changes ( = ) Asymmetric
Lagged activity .3851*** .3871*** .3316***
(.1195) (.1202) (.0996)
Hang Seng growth -.0894** -.0903** -.0698
(.0370) (.0375) (.0440)
VIX changes -.0363 -.1110 -.1146
(.0627) (.1175) (.1180)
VIX big changes -- .0892 --
(.1399)
VIX big increases -- -- .2382
(.1598)
VIX big decreases -- -- -.1311
(.1604)
Constant -.2767 -.2862 -.6096
(.2484) (.2425) (.2095)
F-statistic for asymmetry -- -- 4.441**
Adjusted R-squared .1514 .1482 .1874
Dependent variable: percent
industrial production growth
Symmetric
( = =0)
Symmetric with big
changes ( = ) Asymmetric
Lagged activity .6904*** .6913*** .6879***
(.0602) (.0603) (.0600)
Hang Seng growth .0099** .0098** .0096**
(.0047) (.0047) (.0048)
VIX changes .0013 -.0072 -.0073
(.0060) (.0184) (.0184)
VIX big changes -- .0100 --
(.0202)
VIX big increases -- -- .0071
(.0198)
VIX big decreases -- -- .0142
(.0245)
Constant -.0469 -.0474 -.0418
(.0373) (.0373) (.0411)
F-statistic for asymmetry -- -- .1662
Adjusted R-squared .5194 .5167 .5138 Note: Real interest rate and change in real exchange rate also included as explanatory variables in each regression.
Results significant at 1%, 5%, and 10% levels are indicated by ***, **, and *, respectively.
Newey West standard errors are in parentheses. Sources: DataStream, Bloomberg, and author's calculations.
Sample period: 01/2001-03/2015

26
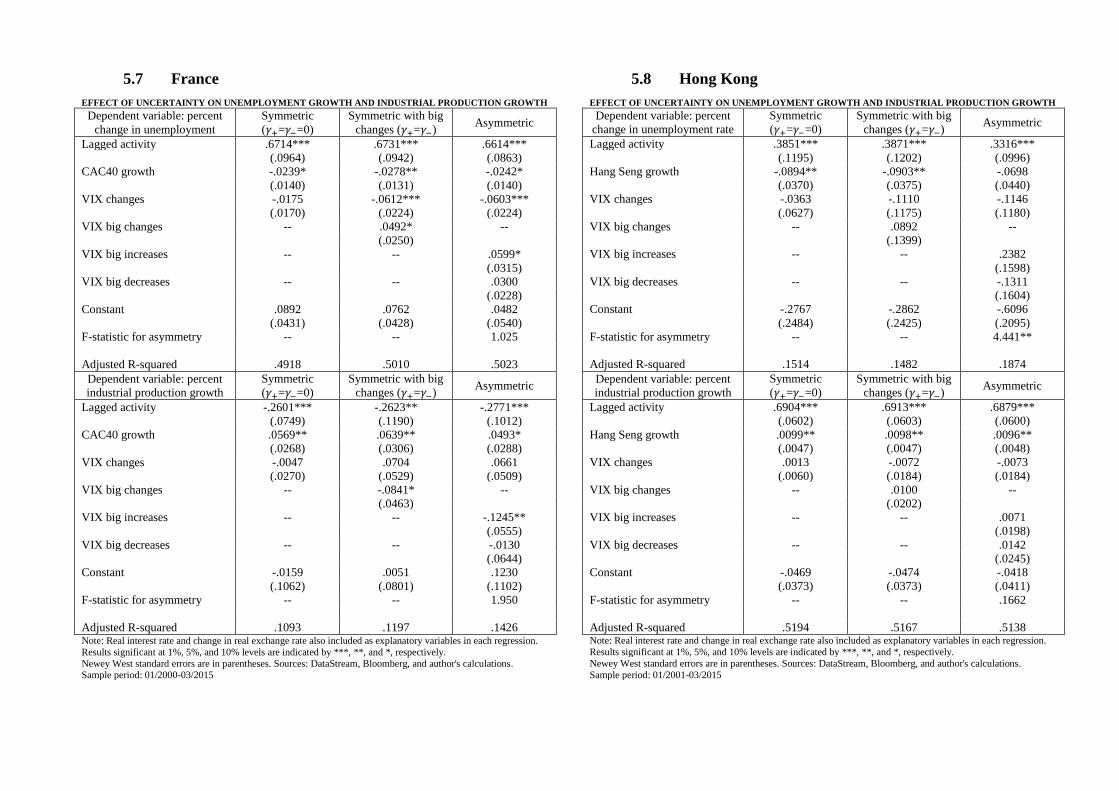
The results from the French economy show no statistically significant asymmetric response to
either economic activity indicator. The first set of regression results for France uses the
percentage growth in unemployment as the dependent variable. The second set of regression
results considers the effects of changes in uncertainty on industrial production growth.
The unemployment growth asymmetric regression shows that a big uncertainty increase has a
statistically significant effect, increasing unemployment. However, overall the impulse
response functions in the appendix show a statistically insignificant effect of the two standard
deviation uncertainty shock on both labour market and industrial production variables, with
the 90 percent confidence interval bands indistinguishable from zero.
The first set of regression results for Hong Kong uses the percentage growth in the
unemployment rate as the dependent variable. The mean monthly change in unemployment
rate growth is -0.17 percent, with a standard deviation of 3.20. The second set of regression
results considers the effects of changes in uncertainty on industrial production growth. The
mean monthly change in industrial production growth is -0.21 percent, with a standard
deviation of 0.67.
The significant coefficients on stock market growth for both the CAC and Hang Seng in each
set of regressions are consistent with lagged stock market growth being positively correlated
with economic activity, as was the case with the United States, the euro area, and Germany.
For the Hong Kong economy, the implied volatility coefficients are not statistically
significant in either regression set. Regardless of this, the
and
coefficients are statistically different from each other in the unemployment rate growth
asymmetric regression.
The second set of regression results show no significant effect of the change in the implied
volatility index on industrial output growth. An explanation for this weak industrial
production regression result may be that industrial production does not contribute much to the
Hong Kong economy. Hong Kong is one of the most service-oriented economies in the
world, with 88.5% of total employment in 2014 coming from the services sector. In contrast,
the manufacturing sector only accounted for 2.8% of total employment (Hong Kong
Government (2015)).

27
Although the results for the Hong Kong unemployment rate growth coefficients are
insignificant, the overall combined effect from the increase ( ), and subsequent decrease
( ), in uncertainty produce statistically significant results in the impulse response
function (Figure 3A). The unemployment rate growth increases a maximum of 2.50
percentage points before returning back to the previous growth level. This is economically
significant as the shock causes the percentage change in the unemployment rate to increase
the equivalent of three quarters of a standard deviation.
The effect of the uncertainty shock on industrial production growth is minimal, and the 90
percent confidence interval indicates the decline in industrial production growth is not
statistically distinguishable from zero.

28
6. Sub-Sample Analysis
The previous results showed strikingly consistent effects of uncertainty across the range of
developed countries. While some results are not statistically significant, the results generally
suggest a common asymmetric response to uncertainty shocks.
For the statistically significant impulse response functions, the negative impact on economic
activity tends to fall between one half and one standard deviations before slowly recovering.
The reactions of the impulse response functions to a large uncertainty shock illustrates
statistically significant negative employment effects for the United States, euro area,
Switzerland, the United Kingdom and Hong Kong. The shock causes a reduction in economic
activity in Japan which is not offset.
The reactions of the impulse response functions to a large uncertainty shock also illustrates
statistically significant negative industrial production growth effects for the United States,
euro area, Japan, Germany and the United Kingdom.
A strand in the recent
literature has emphasised
the greater impact of
uncertainty when central
banks are constrained by the
zero lower bound (Basu &
Bundick (2011), Caggiano
et al. (2015)). Along with
recent emphasis on
uncertainty effects in the
current global economic
environment by
policymakers, economists,
and the financial press, it is
of interest to split the data
into two sub-sample
periods: pre-GFC (before 2007m07) and GFC-onwards (2007m08 onwards), to assess if the
effect of uncertainty on economic activity has been stronger in recent years.
Table 4: F-statistic for Asymmetry
Unemployment rate Pre-GFC GFC-onwards Whole period
United States^ 6.356** 7.563*** 10.43***
Euro area 1.193 9.957*** 7.569***
Japan^ 4.157** .9331 4.434**
Germany .1875 .3610 .1498
Switzerland .1552 7.333*** 7.477***
United Kingdom 3.713* 2.888* .8370
France^ 1.237 2.787* 1.025
Hong Kong 3.936* 5.810** 4.441**
Industrial production Pre-GFC GFC-onwards Whole period
United States 2.187 4.605** 8.401***
Euro area 1.365 6.062** 6.386**
Japan 2.655 .5635 3.404*
Germany 2.358 6.270** 5.684**
Switzerland .5789 2.474 2.89*
United Kingdom .6076 6.290** 4.009**
France .0730 3.825* 1.950
Hong Kong .9031 .0002 .1662 Results significant at 1%, 5%, and 10% levels are indicated by ***, **, and *, respectively
^United States: employment, Japan: coincident index, France: unemployment

29
Figure 5: United Kingdom Sub-Sample Impulse Response Function
Summary statistics for the two sub-sample periods are presented in Table 2A of the appendix.
The results of the asymmetric regressions are reported in Table 3A of the appendix and the F-
statistic results, which test for asymmetry in the big negative and big positive changes in
uncertainty, are summarised in Table 4. The table shows clearly a much stronger asymmetry
over the GFC-onwards subsample period.
The reported impulse response functions (Figure 4A) also show a greater negative effect of
uncertainty for the United States, the euro area, Switzerland, the United Kingdom, France and
Hong Kong on labour market growth and industrial production growth.
Germany shows a more volatile symmetric response GFC-onwards and a greater negative
impact of uncertainty on industrial production growth. The results for Japan are more
inconclusive. The smaller sample sizes make it difficult to prove statistically significant
differences in the effects between the two sub-sample periods, although the impulse response
functions and regressions give an indication of the direction and significance.
The most dramatic change between the
two periods is for the United Kingdom.
The impulse response function on this
page shows the asymmetric responses to a
two standard deviation shock for each
United Kingdom sub-sample and the
whole period.
The regression results support the
conclusion that the GFC-onwards period
has greater negative uncertainty effects on
economic activity. Unlike for the whole
period, the effect of uncertainty on
unemployment rate growth in the GFC-
onwards period has a statistically
significant asymmetric effect (F-statistic
of 2.888), and the big decreases
coefficient is statistically significant. The
adjusted r-squared also increases greatly.

30
Similarly for industrial production growth, the asymmetric effect is more statistically
significant in the GFC-onwards period. This sharper negative effect can be seen in the
impulse response function.
Further regression tables and impulse response functions for each economy are reported in
Figure 4A of the appendix.
7. Conclusion
This paper has investigated the short-term effects of uncertainty on economic activity, as
measured by the implied volatility index. This measure of aggregate uncertainty is market-
based, highly correlated with other measures of uncertainty, and is available on a range of
developed stock market indices.
There is evidence of asymmetric effects of uncertainty on economic activity. A Wald test was
used to analyse the difference between the effects of a large increase and a large decrease in
uncertainty. Asymmetric effects can be seen in the significance of the F-statistics reported in
each regression.
The impulse response functions provide a useful illustration of the impact of an uncertainty
shock. Evidence is presented of statistically significant negative employment effects for the
United States, euro area, Switzerland, the United Kingdom and Hong Kong. The shock
causes a reduction in economic activity in Japan which is not offset. Similarly, the
uncertainty shock has negative effects on industrial production growth for the United States,
euro area, Japan, Germany and the United Kingdom.
The results are consistent with findings on the United States (Bloom (2009), Foerster (2014))
and United Kingdom economies (Denis & Kannan (2013)). The short, sharp impact of
uncertainty shocks on economic activity is noted in the recent literature, which is consistent
with the results presented in this paper.
The sub-sample analysis also shows the increased impact of uncertainty shocks on the
economic activity indicators in a number of economies following the outbreak of the Global
Financial Crisis.

31
The evidence that large increases in uncertainty – as we have seen frequently in recent years
– are not offset by subsequent decreases in many economies, suggests that uncertainty has
played an important role in hindering the global economic recovery.
8. References
Arellano, C., Bai, Y., Kehoe, P. (2012). Financial frictions and fluctuations in volatility.
Federal Reserve Bank of Minneapolis.
Basu, S. and Bundick, B. (2011). Uncertainty shocks in a model of effective demand. Boston
College Working Papers in Economics 774, Boston College Department of Economics.
Bekaert, G., Hoerova, M. & Lo Duca, M. (2013). Risk, uncertainty and monetary policy.
Journal of Monetary Economics, 60, 771-788.
Bekaert, G. & Hoerova, M. (2014). The VIX, the variance premium and stock market
volatility. Journal of Econometrics, 183, 181-192.
Bernanke. (1983). Irreversibility, uncertainty and cyclical investment. The Quarterly Journal
of Economics, 98(1), 85-106.
Bloom, N. (2000). The real options effect of uncertainty on investment and labour demand.
Institute for Fiscal Studies. Working Paper No. 00/15.
Bloom, N. (2009). The impact of uncertainty shocks. Econometrica, 77(3), 623-685.
Bloom, N. (2014). Fluctuations in uncertainty. Journal of Economic Perspectives, 28(2), 153-
176.
Boyle, G. and Guthrie, G. (2003). Investment, uncertainty, and liquidity. The Journal of
Finance, 58(5), 2143–2166.
Caggiano, G., Castelnuovo, E. and Pellegrino, G. (2015). Estimating the real effects of
uncertainty shocks at the zero lower bound. Accessed from http://economia.unipv.it/eco-
pol/mbf2015/Papers%20Website/PellegrinoEstimating.pdf
Deloitte. (2014). White Paper on Swiss Manufacturing Industry: Challenges and prospects in
global competition. Accessed 1/10/2015 from
http://www2.deloitte.com/content/dam/Deloitte/ch/Documents/manufacturing/ch-en-
manufacturing-white-paper-switzerland-05052014.pdf

32
Denis, S. and Kannan, P. (2013). The impact of uncertainty shocks on the UK economy.
International Monetary Fund. Working Paper No. 13/66.
Foerster, A. (2014). The asymmetric effects of uncertainty. Economic Review, Federal
Reserve Bank of Kansas City, 99(3), 5-26.
Grier, K., Henry, O., Olekalns, N., and Shields, K. (2004). The asymmetric effects of
uncertainty on inflation and output growth. Journal of Applied Econometrics, 19, 551-565.
Haldane, A. (2015). Stuck, speech. Bank of England. 30 June.
Hong Kong Government. (2015). Hong Kong: the facts, trade and industry. Accessed
21/09/2015 from www.gov.hk/en/about/abouthk/factsheets/docs/trade%26industry.pdf.
Jones, P. and Enders, W. (2013). The asymmetric effects of uncertainty on macroeconomic
activity. University of Alabama, mimeo.
Whaley, R. (2008). Understanding VIX. Journal of Portfolio Management 35, 98–105.
9. Appendices
Table 1A: Summary Statistics of Implied Volatility Data
United
States
Japan Euro
area
Germany United
Kingdom
Switzerland France Hong
Kong
Stock index S&P500 Nikkei
225
STOXX
600
DAX30 FSTE
100
SMI20 CAC40 Hang
Seng
Average
value
19.95 26.15 29.90 21.93 20.61 19.49 23.54 23.40
Standard
deviation
8.17 9.14 14.05 8.68 9.07 8.39 9.02 9.84
Maximum
value
69.25 76.35 106.48 57.06 63.26 59.45 64.33 69.56
Minimum
value
10.05 13.58 13.06 10.44 10.29 9.63 11.48 11.60
Series start 01/1990 11/1997 01/1999 01/1993 11/1999 07/1999 01/2000 01/2001

Japan Nikkei VIX Index
Change in Japan Nikkei VIX Index
United Kingdom FTSE VIX Index
Change in United Kingdom FTSE VIX Index
Euro area Stoxx VIX Index
Change in Euro area Stoxx VIX Index
Germany DAX VIX Index
Change in Germany DAX VIX Index
Financial market events:
1990-1991 Gulf War, 1997 Asian Financial Crisis, 1998 Russian and LTCM hedge fund default, 2001 9/11, 2002
WorldCom and Enron accounting scandals, 2007-2008 Global Financial Crisis, 2010-2011 Euro Debt Crisis, March
2011 Japanese Tsunami, 2011 US debt ceiling, 2013 taper tantrum, October 2014 flash crash (Bloom 2009, 2014).
Figure 1A: VIX and change in VIX country data

Figure 2A: All Volatility Indices
Hong Kong Hang Seng VIX Index
Change in Hong Kong Hang Seng Index
France CAC VIX Index
Change in France CAC VIX Index
Switzerland SMI VIX Index Change in Switzerland SMI VIX Index

United States Euro area Switzerland
Figure 3A: Impulse Response Functions

France Hong Kong

Table 2A: Summary Statistics of Sub-Sample Change in the Implied Volatility Index
United States Euro area United Kingdom Japan
Pre-GFC GFC-onwards Pre-GFC GFC-onwards Pre-GFC GFC-onwards Pre-GFC GFC-onwards
Stock exchange S&P500 Stoxx600 FSTE100 Nikkei
Average change -0.052 -0.005 -0.367 -0.0133 -.0957 -0.0055 -0.1167 -0.0845
Standard deviation 3.957 6.687 9.261 13.33 4.952 6.306 4.250 6.693
Largest increase 16.45 37.55 39.24 58.47 24.28 32.31 20.15 36.95
Largest decrease -16.59 -12.94 -26.53 -39.07 -14.28 -14.85 -11.75 -14.16
Number of big
increases
19 12 7 14 10 11 8 12
Number of big
decreases
14 16 9 10 7 10 7 12
Observations 209 92 101 92 93 92 117 92
Series 01/1990
07/2007
08/2007
03/2015
01/1999
07/2007
08/2007
03/2015
11/1999
07/2007
08/2007
03/2015
11/1997
07/2007
08/2007
03/2015
Germany Switzerland France Hong Kong
Pre-GFC GFC-onwards Pre-GFC GFC-onwards Pre-GFC GFC-onwards Pre-GFC GFC-onwards
Stock exchange DAX30 SMI20 CAC40 Hang Seng
Average change .0272 -.0235 -.0434 .0037 -.0888 0.0135 -.0780 -0.079
Standard deviation 4.016 5.159 4.204 5.637 3.996 6.550 3.154 5.338
Largest increase 21.87 30.67 16.06 29.59 18.34 32.59 12.63 26.95
Largest decrease -10.57 -10.55 -9.96 -11.86 -7.845 -12.87 -9.35 -13.23
Number of big
increases
18 12 10
13 6 16 5 14
Number of big
decreases
18 14 10 14 5 16 6 14
Observations 172 92 96 92 93 92 79 92
Series 01/1993
07/2007
08/2007
03/2015
07/1999
07/2007
08/2007
03/2015
11/1999
07/2007
08/2007
03/2015
01/2000
07/2007
08/2007
03/2015

ASYMMETRIC EFFECT OF UNCERTAINTY ON EMPLOYMENT GROWTH AND INDUSTRIAL
PRODUCTION GROWTH
Dependent variable: percent
employment growth Pre-GFC GFC-onwards Whole period
Lagged activity .5475*** .8010*** .7150***
(.0828) (.0735) (.0580)
S&P500 growth .0032 .0041 .0048**
(.0028) (.0039) (.0023)
VIX changes .0085** .0051 .0076***
(.0040) (.0040) (.0029)
VIX big increases -.0125** -.0078** -.0107***
(.0053) (.0039) (.0035)
VIX big decreases -.0012 .0055 .0023
(.0050) (.0045) (.0038)
Constant .0452*** .0198** .0340***
(.0137) (.0097) (.0090)
F-statistic for asymmetry 6.356** 7.563*** 10.43***
Adjusted R-squared .4435 .8166 .6368
Dependent variable: percent
industrial production growth Pre-GFC GFC-onwards Whole period
Lagged activity -.0106 .2223* .1425*
(.0993) (.1146) (.0796)
S&P500 growth .0223* .0374 .0375**
(.0132) (.0288) (.0152)
VIX changes .0481** .0347 .0486**
(.0205) (.0386) (.0207)
VIX big increases -.0729*** -.0285 -.0544***
(.0217) (.0253) (.0169)
VIX big decreases -.0276 .0678 .0232
(.0313) (.0503) (.0295)
Constant .2270*** .1169 .2035***
(.0597) (.1028) (.0481)
F-statistic for asymmetry 2.187 4.605** 8.401***
Adjusted R-squared .0763 .1936 .1116 Note: Real interest rate and change in real exchange rate also included as explanatory variables in each regression.
Results significant at 1%, 5%, and 10% levels are indicated by ***, **, and *, respectively.
Newey West standard errors are in parentheses. Sources: DataStream, Bloomberg, and author's calculations.
ASYMMETRIC EFFECT OF UNCERTAINTY ON UNEMPLOYMENT GROWTH AND INDUSTRIAL
PRODUCTION GROWTH
Dependent variable: percent
unemployment growth Pre-GFC GFC-onwards Whole period
Lagged activity .1294 .4399*** .3686***
(.1044) (.1253) (.1175)
Stoxx600 growth -.0558** -.0220 -.0404**
(.0257) (.0209) (.0157)
VIX changes -.0410** -.0309 -.0412***
(.0182) (.0271) (.0155)
VIX big increases .0422** .0525** .0522***
(.0211) (.0258) (.0168)
VIX big decreases .0120 -.0100 .0044
(.0259) (.0288) (.0177)
Constant .0205 .0730 -.0005
(.1229) (.1134) (.0624)
F-statistic for asymmetry 1.193 9.957*** 7.569***
Adjusted R-squared .1389 .3621 .3106
Dependent variable: percent
industrial production growth Pre-GFC GFC-onwards Whole period
Lagged activity -.4485*** .1288 -.0056
(.0733) (.1707) (.1791)
Stoxx600 growth .0308 .0561* .0495**
(.0266) (.0310) (.0197)
VIX changes -.0069 .0311 .0099
(.0164) (.0310) (.0159)
VIX big increases -.0124 -.0594* -.0341*
(.0209) (.0303) (.0196)
VIX big decreases .0228 .0016 .0019
(.0275) (.0323) (.0194)
Constant .2695*** .0768 .0433**
(.0977) (.1210) (.0077)
F-statistic for asymmetry 1.365 6.062** 6.386**
Adjusted R-squared .1626 .2243 .1102 Note: Real interest rate and change in real exchange rate also included as explanatory variables in each regression.
Results significant at 1%, 5%, and 10% levels are indicated by ***, **, and *, respectively.
Newey West standard errors are in parentheses. Sources: DataStream, Bloomberg, and author's calculations.
Table 3A: Asymmetric Sub-Sample Regression Tables
United States Euro area

Japan
ASYMMETRIC EFFECT OF UNCERTAINTY ON UNEMPLOYMENT GROWTH AND INDUSTRIAL
PRODUCTION GROWTH
Dependent variable: percent
coincident index growth Pre-GFC GFC-onwards Whole period
Lagged activity .0075 .3043* .3094**
(.1565) (.1577) (.1432)
Nikkei growth .0155 .0313 .0187
(.0131) (.0237) (.0168)
VIX changes .0344 -.1395* -.0483
(.0350) (.0791) (.0458)
VIX big increases -.0909** .1080 -.0166
(.0405) (.0866) (.0501)
VIX big decreases -.0046 .1831* .0949
(.0415) (.0955) (.0617)
Constant .2860*** -.0509 .0551
(.0916) (.1979) (.1225)
F-statistic for asymmetry 4.157** .9331 4.434**
Adjusted R-squared -.0087 .3327 .2541
Dependent variable: percent
industrial production growth Pre-GFC GFC-onwards Whole period
Lagged activity -.3570*** .0629 .0519
(.1119) (.1379) (.1259)
Nikkei growth .0117 .0471 .0236
(.0206) (.0328) (.0251)
VIX changes .0566 -.2774** -.1002
(.0442) (.1221) (.0699)
VIX big increases -.1373** .2455* .0038
(.0573) (.1436) (.0812)
VIX big decreases -.0651 .3448** .1691*
(.0512) (.1436) (.0957)
Constant .4174*** -.2186 .0219
(.1300) (.3298) (.1672)
F-statistic for asymmetry 2.655 .5635 3.404*
Adjusted R-squared .0935 .1143 .1049 Note: Real interest rate and change in real exchange rate also included as explanatory variables in each
regression.
Results significant at 1%, 5%, and 10% levels are indicated by ***, **, and *, respectively. Newey West standard errors are in parentheses. Sources: DataStream, Bloomberg, and author's calculations.
Germany
ASYMMETRIC EFFECT OF UNCERTAINTY ON UNEMPLOYMENT GROWTH AND INDUSTRIAL
PRODUCTION GROWTH
Dependent variable: percent
unemployment rate growth Pre-GFC GFC-onwards Whole period
Lagged activity .3967*** .2769** .3903***
(.0712) (.1285) (.0636)
DAX growth -.0246* -.0667** -.0298**
(.0141) (.0300) (.0139)
VIX changes .0922* .0301 .0941**
(.0490) (.0531) (.0388)
VIX big increases -.1118*** -.0989* -.1302***
(.0421) (.0531) (.0331)
VIX big decreases -.1278** -.1313** -.1432***
(.0535) (.0635) (.0454)
Constant .2057 -.2589** -.0778
(.9063) (.1231) (.0894)
F-statistic for asymmetry .1875 .3610 .1498
Adjusted R-squared .1684 .1476 .1728
Dependent variable: percent
industrial production growth Pre-GFC GFC-onwards Whole period
Lagged activity -.4042*** -.0146 -.2135*
(.0560) (.1586) (.1252)
DAX growth .0315 .0368 .0486**
(.0212) (.0465) (.0245)
VIX changes -.0151 -.1489 -.0459
(.0662) (.0967) (.0584)
VIX big increases -.0168 .0812 .0113
(.0689) (.0951) (.0619)
VIX big decreases .0723 .2839*** .1592**
(.0648) (.0876) (.0641)
Constant .5315*** .1486 .3160***
(.1834) (.2064) (.1209)
F-statistic for asymmetry 2.358 6.270** 5.684**
Adjusted R-squared .1607 .1488 .0817 Note: Real interest rate and change in real exchange rate also included as explanatory variables in each
regression.
Results significant at 1%, 5%, and 10% levels are indicated by ***, **, and *, respectively. Newey West standard errors are in parentheses. Sources: DataStream, Bloomberg, and author's calculations.

Switzerland
ASYMMETRIC EFFECT OF UNCERTAINTY ON UNEMPLOYMENT GROWTH AND INDUSTRIAL
PRODUCTION GROWTH
Dependent variable: percent
unemployment rate growth Pre-GFC GFC-onwards Whole period
Lagged activity .9790*** .6890*** .8189***
(.0304) (.1705) (.1003)
SMI20 growth .0031 .0214 -.0077
(.0198) (.0294) (.0162)
VIX changes .0241 .0547 .0178
(.0374) (.0531) (.0316)
VIX big increases -.0092 -.0126 .0016
(.0328) (.0426) (.0281)
VIX big decreases -.0200 -.1858** -.1153**
(.0361) (.0767) (.0462)
Constant -.0463 -.1330 -.0499
(.0542) (.1657) (.0832)
F-statistic for asymmetry .1552 7.333*** 7.477***
Adjusted R-squared .9583 .5018 .7093
Dependent variable: percent
industrial production growth Pre-GFC GFC-onwards Whole period
Lagged activity .9104*** .8372*** .8920***
(.0597) (.0543) (.0375)
SMI20 growth .1616** .0578 .1197***
(.0790) (.0523) (.0439)
VIX changes .1654 .0671 .1164
(.3051) (.1309) (.1457)
VIX big increases -.0591 -.0051 -.0225
(.2642) (.1071) (.1193)
VIX big decreases .0209 .1366 .0817
(.2883) (.1531) (.1480)
Constant .3613 .4315 .3717*
(.2883) (.2846) (.1887)
F-statistic for asymmetry .5789 2.474 2.89*
Adjusted R-squared .8454 .7854 .8290 Note: Real interest rate and change in real exchange rate also included as explanatory variables in each
regression.
Results significant at 1%, 5%, and 10% levels are indicated by ***, **, and *, respectively.
Newey West standard errors are in parentheses. Sources: DataStream, Bloomberg, and author's calculations.
United Kingdom
ASYMMETRIC EFFECT OF UNCERTAINTY ON UNEMPLOYMENT GROWTH AND INDUSTRIAL
PRODUCTION GROWTH
Dependent variable: percent
unemployment rate growth Pre-GFC GFC-onwards Whole period
Lagged activity .0317 .3813*** .2963***
(.1133) (.0977) (.0863)
FTSE growth .0921 -.0532 -.0219
(.0665) (.0547) (.0472)
VIX changes .0391 .0690 .0376
(.0759) (.0758) (.0495)
VIX big increases .0201 -.0808 -.0329
(.0614) (.0797) (.0551)
VIX big decreases .1560* -.2026*** -.0847
(.0876) (.0636) (.0667)
Constant .7463 -.0750 -.0262
(.7524) (.2317) (.1643)
F-statistic for asymmetry 3.713* 2.888* .8370
Adjusted R-squared .0458 .2465 .0840
Dependent variable: percent
industrial production growth Pre-GFC GFC-onwards Whole period
Lagged activity -.4557*** -.0704 -.2675**
(.1085) (.1135) (.1034)
FTSE growth -.0242 .0023 -.0024
(.0433) (.0426) (.0271)
VIX changes -.0042 .0407 .0321
(.0488) (.0459) (.0314)
VIX big increases -.0292 -.1106*** -.0868**
(.0638) (.0385) (.0355)
VIX big decreases .0075 .0259 .0065
(.0521) (.0518) (.0385)
Constant .5840 .0498 .0114
(.3603) (.1103) (.0731)
F-statistic for asymmetry .6076 6.290** 4.009**
Adjusted R-squared .1575 .0892 .0904 Note: Real interest rate and change in real exchange rate also included as explanatory variables in each
regression.
Results significant at 1%, 5%, and 10% levels are indicated by ***, **, and *, respectively. Newey West standard errors are in parentheses. Sources: DataStream, Bloomberg, and author's calculations.

France
ASYMMETRIC EFFECT OF UNCERTAINTY ON UNEMPLOYMENT GROWTH AND INDUSTRIAL
PRODUCTION GROWTH
Dependent variable: percent
unemployment growth Pre-GFC GFC-onwards Whole period
Lagged activity .5808*** .6557*** .6614***
(.1047) (.1302) (.0863)
CAC40 growth -.0633*** .0010 -.0242*
(.0216) (.0193) (.0140)
VIX changes -.0696** -.0505 -.0603***
(.0285) (.0368) (.0224)
VIX big increases -.0001 .0787** .0599*
(.0326) (.0377) (.0315)
VIX big decreases .0278 .0280 .0300
(.0286) (.0321) (.0228)
Constant -.0431 .1043 .0482
(.0722) (.0997) (.0540)
F-statistic for asymmetry 1.237 2.787* 1.025
Adjusted R-squared .4484 .4201 .5023
Dependent variable: percent
industrial production growth Pre-GFC GFC-onwards Whole period
Lagged activity -.4720*** -.1132 -.2771***
(.0926) (.1005) (.1012)
CAC40 growth .0830** -.0035 .0493*
(.0319) (.0375) (.0288)
VIX changes .1025** -.0390 .0661
(.0513) (.0689) (.0509)
VIX big increases -.0684 -.0759 -.1245**
(.0706) (.0540) (.0555)
VIX big decreases -.1030 .0688 -.0130
(.1261) (.0833) (.0644)
Constant .0452 .0688 .1230
(.1337) (.1498) (.1102)
F-statistic for asymmetry .0730 3.825* 1.950
Adjusted R-squared .2372 .1526 .1426 Note: Real interest rate and change in real exchange rate also included as explanatory variables in each
regression.
Results significant at 1%, 5%, and 10% levels are indicated by ***, **, and *, respectively. Newey West standard errors are in parentheses. Sources: DataStream, Bloomberg, and author's calculations.
Hong Kong
ASYMMETRIC EFFECT OF UNCERTAINTY ON UNEMPLOYMENT GROWTH AND INDUSTRIAL
PRODUCTION GROWTH
Dependent variable: percent
unemployment growth Pre-GFC GFC-onwards Whole period
Lagged activity .3229*** .3149** .3316***
(.1016) (.1364) (.0996)
Hang Seng growth -.1326 -.0412 -.0698
(.0826) (.0603) (.0440)
VIX changes -.2313* .0091 -.1146
(.1259) (.1830) (.1180)
VIX big increases -.2658* .1702 .2382
(.1358) (.2031) (.1598)
VIX big decreases .0990 -.2729 -.1311
(.1860) (.2234) (.1604)
Constant -1.205 -.7422 -.6096
(.6032) (.5681) (.2095)
F-statistic for asymmetry 3.936* 5.810** 4.441**
Adjusted R-squared .2824 .1628 .1874
Dependent variable: percent
industrial production growth Pre-GFC GFC-onwards Whole period
Lagged activity .5981*** .7378*** .6879***
(.0906) (.0562) (.0600)
Hang Seng growth .0152 .0100 .0096**
(.0139) (.0063) (.0048)
VIX changes -.0221 .0042 -.0073
(.0281) (.0249) (.0184)
VIX big increases .0494 .0013 .0071
(.0428) (.0285) (.0198)
VIX big decreases .0108 .0015 .0142
(.0580) (.0295) (.0245)
Constant .2192 -.0749 -.0418
(.1651) (.0903) (.0411)
F-statistic for asymmetry .9031 .0002 .1662
Adjusted R-squared .4766 .5870 .5138 Note: Real interest rate and change in real exchange rate also included as explanatory variables in each
regression.
Results significant at 1%, 5%, and 10% levels are indicated by ***, **, and *, respectively.
Newey West standard errors are in parentheses. Sources: DataStream, Bloomberg, and author's calculations.

Figure 4A: Impulse Response Functions – Asymmetric Sub-Samples
United States Euro area Japan

Germany Switzerland France

Hong Kong