Stock Market Review -...
9
The Stock Market Flops Tops Stock Market Review Week 03– from January 16th to January 20th 2017 CREDIT RISK MANAGEMENT BEYOND NUMBERS Bloomfield Investment Corporation is a pan-African credit rating agency which specializes in the assessment of the credit risk. Headquartered in Abidjan with offices in Douala and in Kigali. the agency operates essentially in Africa. Department of Economic and Stock Market Analysis Accreditation UEMOA AN-001/2012 RWANDA ref/CMA/July/3047/2015 Headquarters Plateau. BIAO-CI Tower. 15 th floor. Abidjan - Côte d’Ivoire Website www.bloomfield-investment.com Follow us BRVM 10 k 0.80% 251.92 BRVM COMPOSITE k 1.18% 281.32 Evol Value Average PER* k 24.36 Average yield / share* m 5.64% Market capitalization (billion FCFA) k 7 431 Trading volume (shares) 1 375 023 Trading volume (bonds) 49 000 Value traded (shares) 2 930 956 056 Value traded (bonds) 490 000 000 Market Trends The BRVM closes this week up with 251.92 points for the BRVM 10 index (+0.80%) and 281.32 points for the BRVM Composite index (+1.18%). The market capitalization amounted to 7 431 billion FCFA. The transaction value of equity market amounted to 2.9 billion FCFA this week, driven mainly by “Finances” (46%) and “Public Services” (45%) sectors. The CROWN SIEM stock records the largest growth with a gain of 43.54%, whereas the PALMCI stock shows the largest decline with a fall of 10.81%. On the commodities market gold, silver, coffee and rubber prices maintain their upward trend, while those of natural gas and palm oil prices end the week down. * Calculated on the basis of the latest financial information published without consideration of companies in liquidation (Source BRVM) Listed Companies 43 Sector Indices Price Evol% Vol Val (000) PER Y/S CROWN SIEM CI 48 805 43.54% 38 1 703 39.2 2.5% VIVO ENERGY CI 3 100 10.71% 12 612 37 558 59.8 53.7% BANK OF AFRICA M 44 075 10.19% 2 444 98 578 12.7 0.0% SODE CI 69 300 7.03% 103 7 090 19.0 4.7% Price Evol% Vol Val (000) PER Y/S PALM CI 11 550 -10.81% 1 075 12 848 N/A 5.6% NESTLE CI 54 485 -9.19% 116 6 492 18.2 1.2% SAFCA CI 21 275 -7.50% 5 106 38.9 6.8% SERVAIR ABIDJAN CI 4 595 -6.22% 3 091 14 396 40.1 2.0% # Companies Value Evol% Evol YTD Volume Value traded (MFCFA) Avg PER Avg Y/S BRVM – Industry 12 148.95 0.83% -4.48% 1 994 59 17.8 3.9% BRVM – Publics Services 4 765.94 1.04% -1.14% 63 809 1 320 17.1 5.1% BRVM – Finances 12 97.27 1.59% 2.39% 1 284 251 1 355 18.1 4.0% BRVM – Transport 2 1 302.93 6.13% -9.01% 157 7 40.1 5.1% BRVM – Agriculture 5 193.52 -3.96% -6.67% 7 631 105 59.9 6.5% BRVM – Distribution 7 552.19 1.12% -4.30% 16 979 82 35.6 11.6% BRVM - Other Sectors 1 407.41 -5.71% -5.71% 202 4 13.0 N/A
Transcript of Stock Market Review -...
The Stock Market
FlopsTops
Stock Market Review
Week 03– from January 16th to January 20th 2017
CREDIT RISK MANAGEMENT BEYOND NUMBERS
Bloomfield Investment Corporation is a pan-African creditrating agency which specializes in the assessment of the creditrisk. Headquartered in Abidjan with offices in Douala and inKigali. the agency operates essentially in Africa.
Department of Economic and Stock Market Analysis
Accreditation UEMOA AN-001/2012RWANDA ref/CMA/July/3047/2015
Headquarters Plateau. BIAO-CI Tower. 15th floor. Abidjan - Côte d’Ivoire
Website www.bloomfield-investment.com
Follow us
BRVM 10 k 0.80% 251.92
BRVM COMPOSITE k 1.18% 281.32
Evol Value
Average PER* k 24.36
Average yield / share* m 5.64%
Market capitalization (billion FCFA) k 7 431
Trading volume (shares) 1 375 023
Trading volume (bonds) 49 000
Value traded (shares) 2 930 956 056
Value traded (bonds) 490 000 000
Market Trends
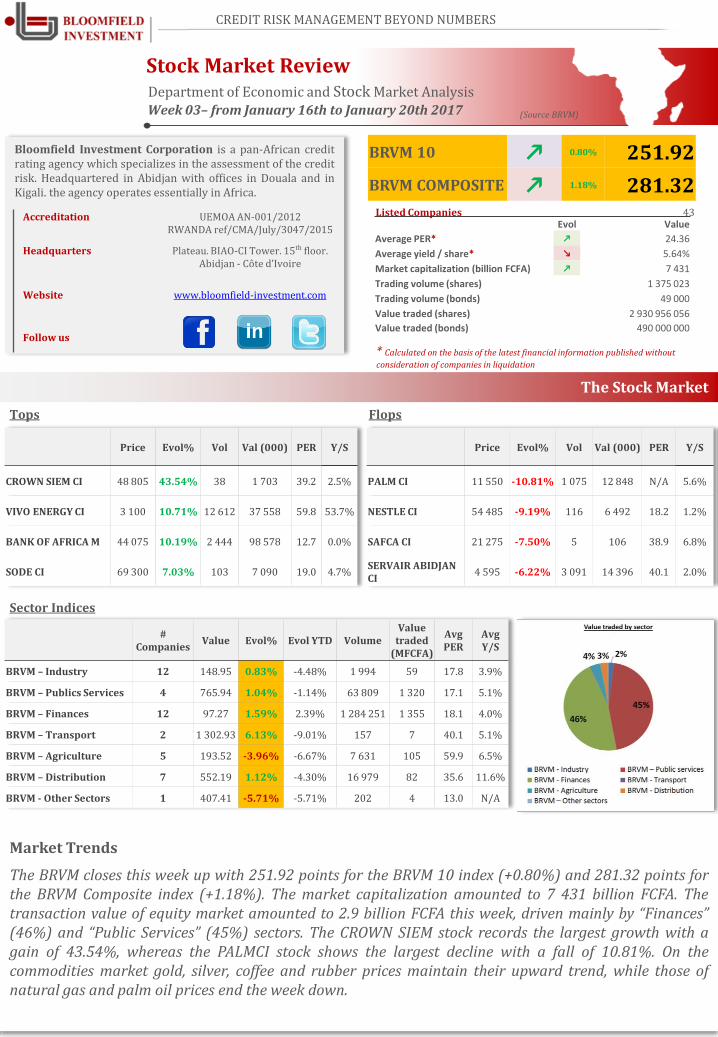
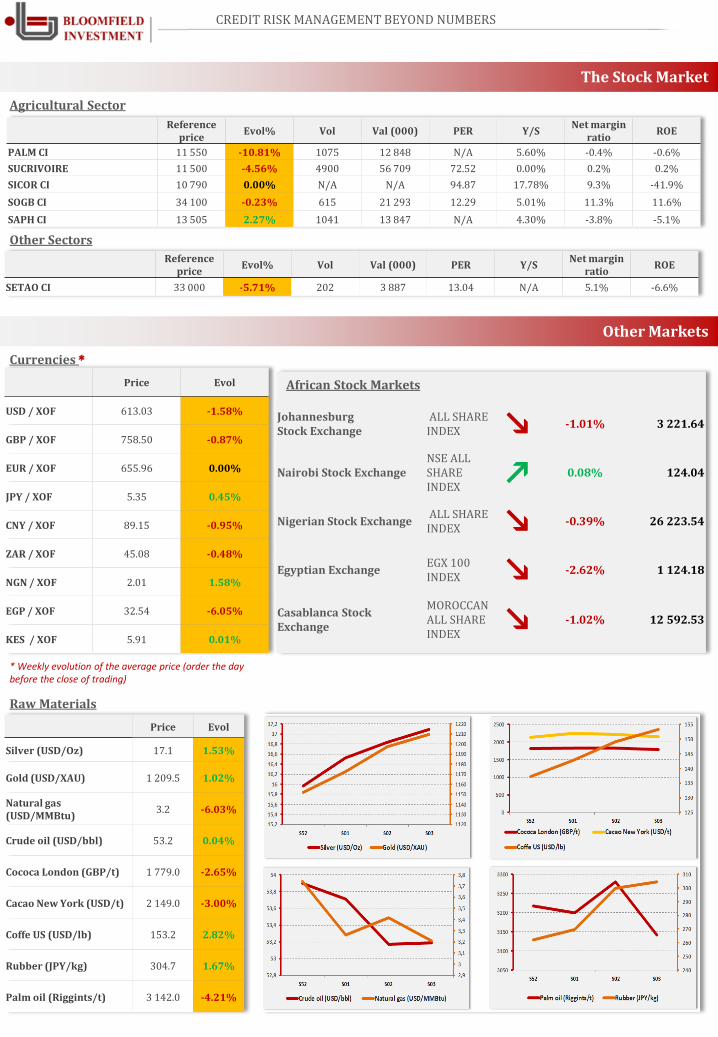
The BRVM closes this week up with 251.92 points for the BRVM 10 index (+0.80%) and 281.32 points forthe BRVM Composite index (+1.18%). The market capitalization amounted to 7 431 billion FCFA. Thetransaction value of equity market amounted to 2.9 billion FCFA this week, driven mainly by “Finances”(46%) and “Public Services” (45%) sectors. The CROWN SIEM stock records the largest growth with again of 43.54%, whereas the PALMCI stock shows the largest decline with a fall of 10.81%. On thecommodities market gold, silver, coffee and rubber prices maintain their upward trend, while those ofnatural gas and palm oil prices end the week down.
* Calculated on the basis of the latest financial information published without
consideration of companies in liquidation
(Source BRVM)
Listed Companies 43
Sector Indices
Price Evol% Vol Val (000) PER Y/S
CROWN SIEM CI 48 805 43.54% 38 1 703 39.2 2.5%
VIVO ENERGY CI 3 100 10.71% 12 612 37 558 59.8 53.7%
BANK OF AFRICA M 44 075 10.19% 2 444 98 578 12.7 0.0%
SODE CI 69 300 7.03% 103 7 090 19.0 4.7%
Price Evol% Vol Val (000) PER Y/S
PALM CI 11 550 -10.81% 1 075 12 848 N/A 5.6%
NESTLE CI 54 485 -9.19% 116 6 492 18.2 1.2%
SAFCA CI 21 275 -7.50% 5 106 38.9 6.8%
SERVAIR ABIDJAN CI
4 595 -6.22% 3 091 14 396 40.1 2.0%
# Companies
Value Evol% Evol YTD VolumeValue
traded(MFCFA)
AvgPER
AvgY/S
BRVM – Industry 12 148.95 0.83% -4.48% 1 994 59 17.8 3.9%
BRVM – Publics Services 4 765.94 1.04% -1.14% 63 809 1 320 17.1 5.1%
BRVM – Finances 12 97.27 1.59% 2.39% 1 284 251 1 355 18.1 4.0%
BRVM – Transport 2 1 302.93 6.13% -9.01% 157 7 40.1 5.1%
BRVM – Agriculture 5 193.52 -3.96% -6.67% 7 631 105 59.9 6.5%
BRVM – Distribution 7 552.19 1.12% -4.30% 16 979 82 35.6 11.6%
BRVM - Other Sectors 1 407.41 -5.71% -5.71% 202 4 13.0 N/A

Market News
[COTE D'IVOIRE]: The Center for the Promotion of
Investments in Cote d'Ivoire (CEPICI) recorded 12
166 new businesses in 2016, an increase of 28%
compared with 2015. The businesses created are
mainly concentrated in services (46%), commerce
(30%) and construction (13%) sectors. The volume of
investments approved in 2016 has changed little, with
672 billion FCFA, 0.3% more than in 2015. These
investments are mainly from France (12%), Nigeria
(10%) and Great Britain (9%). In addition, the main
beneficiary sectors are construction (25%), ICT (17%)
and the agro-food industry (15%).
[BURKINA FASO]: The first observations of the
cotton campaign 2016/2017 of Burkina Faso, after the
abandonment of the GMOs are marked the
improvement of the quality of the cotton. This
improvement was reflected by the absence of short
fiber and an abundance of long fiber. This evolution
reinforces the choice made by the authorities to
return to conventional cotton, even if the financial
cost for the main ginner of the country, SOFITEX
(Burkinabe Society of Textile Fibers), is about 120
million FCFA according to the Managing Director of
the said structure. The improvement in cotton prices
since the end of the first quarter of 2016 has favored
income from the sale of cotton production above
production costs for SOFITEX. The upward trend in
the price is expected to strengthen in 2017, notably
due to the rise in oil prices and a lower global cotton
production than the demand, which allows better
absorption of stocks.
CREDIT RISK MANAGEMENT BEYOND NUMBERS
The Stock Market
News BRVM Corporates
[VIVO ENERGY]: Vivo Energy Group has
inaugurated its largest service station in Africa,
Morocco, built on an area of 6 hectares. According to a
press release from Vivo Energy Maroc, this station has
two fuel distribution areas, one for light vehicles and
the other for heavy goods vehicles due to the strong
dominance of the heavy goods vehicle category in the
region which requires special provisions. This
inauguration is part of a strategy to extend Vivo
Energy on Moroccan market where it is positioning
itself as a major player. An extension of the station
should host a center for light mechanical services, a
supermarket and a motel, in addition to the various
facilities already present (coffee shop, restaurant,
mosque and playground).
[SIB CI] : The Société Ivoirienne de Banque (SIB), a
subsidiary of Attijariwafa bank, launched its
institutional campaign for the year 2017. This
campaign aims to allow a better repositioning of the
SIB on the Ivorian market and to consolidate its
proximity to its customers, as well as its
competitiveness through a range of appropriate
services, responding perfectly to the needs of
customers. Its main strategic axes of development are
transformation and innovation, network expansion,
operational efficiency and risk control, with a focus on
"customer orientation". In addition, as the SIB
Managing Director pointed out, with the launch of the
insurance companies "Wafa Assurance CI" and "Wafa
Assurance Vie CI", SIB is now able to make an
integrated offer "credit and insurance” to its
customers.
The Chief Economist’s Analysis [a focus on BOA NIGER]
Compared to the first half of 2015, the first half of 2016 has resulted in an improvement of the main indicators of
activity and financial results of Bank of Africa’ subsidiary in Niger, BOA Niger. At the end of June 2016, customer
deposits increased by 4.1% to 139 721 million FCFA, and customer loans grew by 5.8% to 152 217 million FCFA.
Thus, BOA Niger's net banking income rose by 10.88% in the first half of 2016, reaching 9,712.04 million FCFA. Like
the net banking income, the company's net profit increased by 19.44% over the same period to reach 3,647.84
million FCFA at the end of June 2016. On the stock market, The BOA Niger share price followed an upward trend
between 04 January and 10 March 2016, with an increase of 52.9%, in line with the good performance of the bank
at the end of 2015. Since then, the share price follows a general downward trend and stands at 88,000 FCFA on 20
January 2017, down by 32.3% from its level at 10 March 2016. This downward trend could be justified by the
general wait-and-see attitude of investors on the stock market. For the second half of 2016, BOA Niger should see
an increase in its main activity and earnings indicators, contributing to an improvement in its price, at least in the
short term after the publication of its results, during the year 2017.

CREDIT RISK MANAGEMENT BEYOND NUMBERS
The Stock Market
Public Services Sector
Financial Sector
Industry Sector
Distribution Sector
Transport Sector
Reference price
Evol% Vol Val (000) PER Y/SNet margin
ratioROE
BICI CI 91 000 0.00% 84 7 639 16.39 4.65% 22.3% 21.7%
BANK OF AFRICA BN 170 000 0.00% 901 153 033 13.66 4.76% 11.5% 24.5%
BANK OF AFRICA BF 145 000 2.11% 330 47 161 13.26 4.62% 38.4% 40.5%
BANK OF AFRICA CI 135 000 -0.74% 514 69 292 16.38 4.59% 18.4% 41.2%
BANK OF AFRICA M 44 075 10.19% 2444 98 578 12.74 0.00% 23.6% 24.0%
BANK OF AFRICA NG 88 000 0.00% 485 42 071 15.18 5.47% 24.1% 27.2%
BANK OF AFRICA S 50 000 1.21% 440 21 731 28.86 1.50% 6.9% 20.8%
CORIS BANK INTERNATIONAL BF
49 000 5.49% 11748 559 728 20.42 0.00% 44.8% 60.0%
ECOBANK TRANS. INCORP. TG 24 0.00% 1255296 29 497 6.78 8.30% 5.1% 6.3%
SAFCA CI 21 275 -7.50% 5 106 38.93 6.77% 0.3% 1.2%
SGB CI 140 000 1.45% 483 66 014 16.11 3.73% 26.1% 35.4%
SOCIETE IVOIRIENNE DE BANQUE CI
22 500 0.90% 11521 259 782 15.19 N/A 33.9% 40.8%
Reference price
Evol% Vol Val (000) PER Y/SNet margin
ratioROE
CIE CI 69 000 -2.82% 496 34 853 23.34 3.83% 1.9% 33.0%
ONATEL BF 11 295 3.62% 20034 220 762 15.19 5.76% 17.5% 32.7%
SODE CI 69 300 7.03% 103 7 090 18.95 4.68% 3.7% 25.9%
SONATEL SN 24 500 0.82% 43176 1 057 320 11.08 6.12% 25.6% 36.0%
Reference price
Evol% Vol Val (000) PER Y/SNet margin
ratioROE
SICABLE CI 85 000 -2.86% 12 1 020 17.94 1.41% 5.4% 14.9%
FILTISAC CI 20 950 0.70% 431 8 714 18.80 4.99% 8.4% 10.1%
NEI-CEDA CI 3 000 0.00% N/A N/A N/A 7.50% -6.4% -54.7%
NESTLE CI 54 485 -9.19% 116 6 492 18.15 1.16% 2.4% -772.8%
CROWN SIEM CI 48 805 43.54% 38 1 703 39.18 2.49% 4.6% 12.9%
AIR LIQUIDE CI 11 100 0.00% 119 1 353 11.53 5.68% 10.4% 29.5%
SOLIBRA CI 165 000 0.00% 76 12 540 12.01 2.49% 14.4% 34.6%
SMB CI 18 000 0.00% 602 10 842 6.34 2.50% 4.1% 579.6%
SITAB CI 140 000 -0.71% 26 3 644 13.67 5.82% 10.1% 58.0%
TRITURAF CI-Ste en Liquidation
490 0.00% N/A N/A N/A N/A N/A N/A
UNILEVER CI 17 990 -0.06% 141 2 526 N/A 6.85% -21.1% -172.6%
UNIWAX CI 24 000 3.90% 433 10 005 22.86 2.03% 11.1% 63.7%
Reference price
Evol% Vol Val (000) PER Y/SNet margin
ratioROE
SERVAIR ABIDJAN CI 4 595 -6.22% 3091 14 396 40.14 1.96% 16.1% 68.3%
BERNABE CI 168 000 -3.45% 1 168 23.75 3.27% 5.2% 20.3%
CFAO CI 60 000 1.69% 91 5 314 29.00 3.83% 5.7% 18.3%
TRACTAFRIC MOTORS CI 290 500 -3.37% 13 3 781 20.03 4.49% 4.7% 27.8%
VIVO ENERGY CI 3 100 10.71% 12612 37 558 59.80 53.71% 1.2% 19.7%
TOTAL CI 17 500 -2.78% 724 12 626 40.70 2.57% 1.7% 17.4%
TOTAL SN 18 200 1.11% 447 8 077 12.10 5.14% 1.2% N/A
Reference price
Evol% Vol Val (000) PER Y/SRatio marge
netteROE
BOLLORE AFRICA LOGISTICS CI
269 900 6.21% 24 6 427 40.10 3.55% 8.8% 19.4%
MOVIS CI 4 000 0.00% 133 530 N/A 6.75% -11.7% -59.4%
CREDIT RISK MANAGEMENT BEYOND NUMBERS
Agricultural Sector
The Stock Market
Other Sectors
Other Markets
Raw Materials
Currencies **
African Stock Markets
* Weekly evolution of the average price (order the day before the close of trading)
Reference price
Evol% Vol Val (000) PER Y/SNet margin
ratioROE
PALM CI 11 550 -10.81% 1075 12 848 N/A 5.60% -0.4% -0.6%
SUCRIVOIRE 11 500 -4.56% 4900 56 709 72.52 0.00% 0.2% 0.2%
SICOR CI 10 790 0.00% N/A N/A 94.87 17.78% 9.3% -41.9%
SOGB CI 34 100 -0.23% 615 21 293 12.29 5.01% 11.3% 11.6%
SAPH CI 13 505 2.27% 1041 13 847 N/A 4.30% -3.8% -5.1%
Reference price
Evol% Vol Val (000) PER Y/SNet margin
ratioROE
SETAO CI 33 000 -5.71% 202 3 887 13.04 N/A 5.1% -6.6%
JohannesburgStock Exchange
ALL SHARE INDEX m -1.01% 3 221.64
Nairobi Stock ExchangeNSE ALL SHARE INDEX k 0.08% 124.04
Nigerian Stock ExchangeALL SHARE
INDEX m -0.39% 26 223.54
Egyptian ExchangeEGX 100 INDEX m -2.62% 1 124.18
Casablanca Stock Exchange
MOROCCAN ALL SHARE INDEX m -1.02% 12 592.53
Price Evol
USD / XOF 613.03 -1.58%
GBP / XOF 758.50 -0.87%
EUR / XOF 655.96 0.00%
JPY / XOF 5.35 0.45%
CNY / XOF 89.15 -0.95%
ZAR / XOF 45.08 -0.48%
NGN / XOF 2.01 1.58%
EGP / XOF 32.54 -6.05%
KES / XOF 5.91 0.01%
Price Evol
Silver (USD/Oz) 17.1 1.53%
Gold (USD/XAU) 1 209.5 1.02%
Natural gas (USD/MMBtu)
3.2 -6.03%
Crude oil (USD/bbl) 53.2 0.04%
Cococa London (GBP/t) 1 779.0 -2.65%
Cacao New York (USD/t) 2 149.0 -3.00%
Coffe US (USD/lb) 153.2 2.82%
Rubber (JPY/kg) 304.7 1.67%
Palm oil (Riggints/t) 3 142.0 -4.21%

CREDIT RISK MANAGEMENT BEYOND NUMBERS
Credit Ratings (1/3)
Company name Country Sector/ ActivityLong term Short term Rating
expiration dateLast Rating Perspective Last Rating Perspective
CIE Cote d'Ivoire Electricity AA+ Stable A1+ Stable 30/09/2017
IDT Cote d'Ivoire Tobacco distribution Confidential 01/11/2016
Loyale Assurances SA Cote d'Ivoire IARD Insurances BB- Negative C Negative31/10/2016
(ratingwithdrawn)
Loyale Vie SA Cote d'Ivoire LIFE Insurances A- Stable A2 Stable 31/07/2017
OMNIUM MaliManufacturing and distribution of batteries
BBB+ Positive A3 Positive 30/05/2017
ONEP Cote d'IvoirePromoting access to safe drinking water
BB- Stable B Stable 30/09/2017
PAA Cote d'Ivoire Port activities A+ Stable A1- Stable 30/06/2017
PALMCI Cote d'IvoireSeed and palm oilproducts
A- Stable A1- Stable 30/07/2017
PETRO IVOIRE Cote d'IvoireOil ProductsDistribution
A Stable A3 Stable 30/06/2017
PASP Cote d'Ivoire Public port operations A Stable A2 Stable 30/05/2017
SHELTER AFRIQUE Kenya Banking A Stable A1 Stable 30/06/2017
SIMAT Cote d'Ivoire Handling and Transit Confidential31/03/2011
(ratingwithdrawn)
Société Ivoirienne de Raffinage (SIR) Cote d'Ivoire Crude oil refining Confidential31/03/2012
(ratingwithdrawn)
SODECI Cote d'Ivoire Water distribution AA- Stable A1- Stable 30/09/2017
Ville de Dakar Sénégal Local community BBB+ Stable A3 Positive31/10/2016
(ratingwithdrawn)
CROWN SIEM CI Cote d'Ivoire Metal packaging BBB+ Stable A3 Stable 31/07/2017
SICOGI Cote d'IvoireConstruction and housing management
BBB Stable B Stable31/10/2015
(ratingwithdrawn)
NESTLE CI Cote d'Ivoire Food industry A- Stable A1- Stable 31/10/2017
GuarantCo United Kingdom Institutional Garranty AAA Stable A1+ Stable 30/06/2017
Commune du Plateau Côte d'Ivoire Local community BBB- Stable A2 Stable 31/07/2016
CAMTEL Cameroun Telecommunications BBB Stable A3 Stable 31/07/2016

CREDIT RISK MANAGEMENT BEYOND NUMBERS
Credit Ratings (2/3)
Company name Country Sector/ ActivityLong term Short term Rating
expiration dateLast Rating Perspective Last Rating Perspective
AVENI – RE Cote d’Ivoire Reinsurance A- Stable A2 Stable 30/09/2016
Emission de la ville de Dakar Sénégal Financial instrument A Stable A1 Stable01/01/2016
(ratingwithdrawn)
District d'Abidjan Cote d’Ivoire Local community BB+ Stable B Stable 31/10/2016
Fonds d'Entretien Routier (FER) Cote d’IvoireFinancing of the maintenance of road infrastructure
A- Positive A2 Stable 30/09/2016
Bank Of Africa – Benin Benin Banking sector A Positive A1 Stable 30/04/2017
Bank Of Africa – Burkina Faso Burkina Faso Banking sector A Stable A1 Stable 30/04/2017
Bank Of Africa – Niger Niger Banking sector A- Stable A2 Stable 30/04/2017
Bank Of Africa – Sénégal Senegal Banking sector A- Stable A2 Stable 31/05/2017
Bank Of Africa – Côte d’Ivoire Cote d’Ivoire Banking sector A Stable A2 Positive 30/05/2017
Koffi & Diabaté Développement Cote d’Ivoire Construction BBB+ Stable A3 Stable 30/10/2017
Bank Of Africa – Mali Mali Banking sector A- Stable A2 Stable 30/04/2017
Caisse Régionale de Refinancement Hypothécaire
UEMOA Financial institution AA Stable A1+ Stable 30/06/2017
BERNABE Cote d’Ivoire
Distribution of hardware products. industrial equipment. metal products and construction materials
A+ Stable A1- Positive 31/07/2017
Air Côte d’Ivoire Cote d’Ivoire Airline company BBB+ Stable A3 Stable 30/08/2017
Alios Finance Cote d’Ivoire Financing by leasing BBB+ Stable A1 Stable 31/07/2017
State of Cote d'Ivoire - Local currency rating
Côte d'Ivoire Sovereign debt A- Stable A2 Stable 30/06/2017
VIP NET Cote d’Ivoire Telecommunications Confidential30/09/2015
(ratingwithdrawn)
ANSUT Cote d’Ivoire Telecommunications Confidential 31/10/2017
DEKEL OIL Cote d’IvoireSeed and palm oil products
Confidential 31/10/2017
FICOGES Cote d’Ivoire Audit Confidential 31/10/2016
UIREVI Cote d’Ivoire Export agriculture Confidential 31/07/2016
NSIA Banque Côte d’Ivoire Banking sector Confidential 31/03/2017
Radiant Insurance Company Rwanda Insurance Confidential 31/07/2017

CREDIT RISK MANAGEMENT BEYOND NUMBERS
Credit Ratings(3/3)
Company name Country Sector/ ActivityLong term Short term Rating
expiration dateLast Rating Perspective Last Rating Perspective
NSIA Assurance Gabon Gabon Insurance Confidential 31/07/2017
NSIA Assurance VIE Côte d'Ivoire Cote d’Ivoire Insurance Confidential 31/07/2017
NSIA Assurance Cote d'Ivoire Cote d’Ivoire Insurance Confidential 30/06/2017
NSIA Assurance Guinée Bissau Guinea-Bissau Insurance Confidential 31/07/2017
NSIA Assurance Senegal Senegal Insurance Confidential 30/06/2017
NSIA Assurance Vie Senegal Senegal Insurance Confidential 31/07/2017
Tropical Distribution Cote d’Ivoire Distribution In development
Tropical Packaging Cote d’Ivoire Metal industry In development
CI Energies Cote d’Ivoire
Monitoring of the energy sector and
electrical infrastructure works
In development
Côte d’Ivoire Céréales Cote d’IvoireCorn and rice
processing / Bond issue
In development
Société Equatoriale des Mines Gabon Mining operations In development
Société Ivoirienne de Banque Cote d’Ivoire Banking sector In development
CREDIT RISK MANAGEMENT BEYOND NUMBERS
Bond Market
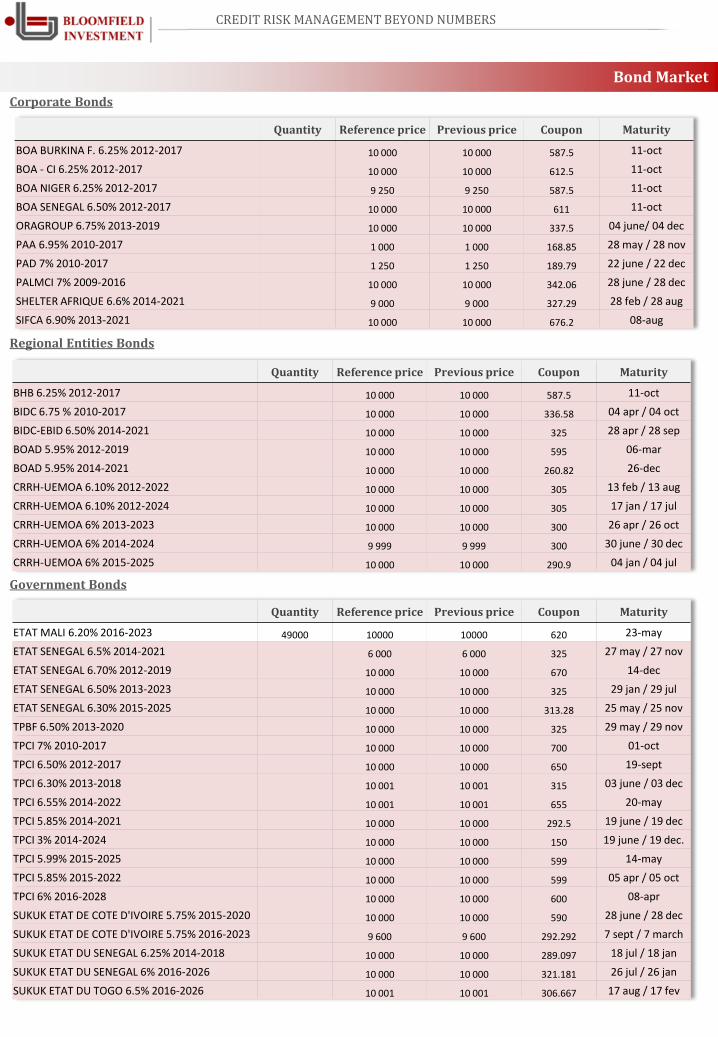
Corporate Bonds
Regional Entities Bonds
Government Bonds
Quantity Reference price Previous price Coupon Maturity
BHB 6.25% 2012-2017 10 000 10 000 587.5 11-oct
BIDC 6.75 % 2010-2017 10 000 10 000 336.58 04 apr / 04 oct
BIDC-EBID 6.50% 2014-2021 10 000 10 000 325 28 apr / 28 sep
BOAD 5.95% 2012-2019 10 000 10 000 595 06-mar
BOAD 5.95% 2014-2021 10 000 10 000 260.82 26-dec
CRRH-UEMOA 6.10% 2012-2022 10 000 10 000 305 13 feb / 13 aug
CRRH-UEMOA 6.10% 2012-2024 10 000 10 000 305 17 jan / 17 jul
CRRH-UEMOA 6% 2013-2023 10 000 10 000 300 26 apr / 26 oct
CRRH-UEMOA 6% 2014-2024 9 999 9 999 300 30 june / 30 dec
CRRH-UEMOA 6% 2015-2025 10 000 10 000 290.9 04 jan / 04 jul
Quantity Reference price Previous price Coupon Maturity
ETAT MALI 6.20% 2016-2023 49000 10000 10000 620 23-may
ETAT SENEGAL 6.5% 2014-2021 6 000 6 000 325 27 may / 27 nov
ETAT SENEGAL 6.70% 2012-2019 10 000 10 000 670 14-dec
ETAT SENEGAL 6.50% 2013-2023 10 000 10 000 325 29 jan / 29 jul
ETAT SENEGAL 6.30% 2015-2025 10 000 10 000 313.28 25 may / 25 nov
TPBF 6.50% 2013-2020 10 000 10 000 325 29 may / 29 nov
TPCI 7% 2010-2017 10 000 10 000 700 01-oct
TPCI 6.50% 2012-2017 10 000 10 000 650 19-sept
TPCI 6.30% 2013-2018 10 001 10 001 315 03 june / 03 dec
TPCI 6.55% 2014-2022 10 001 10 001 655 20-may
TPCI 5.85% 2014-2021 10 000 10 000 292.5 19 june / 19 dec
TPCI 3% 2014-2024 10 000 10 000 150 19 june / 19 dec.
TPCI 5.99% 2015-2025 10 000 10 000 599 14-may
TPCI 5.85% 2015-2022 10 000 10 000 599 05 apr / 05 oct
TPCI 6% 2016-2028 10 000 10 000 600 08-apr
SUKUK ETAT DE COTE D'IVOIRE 5.75% 2015-2020 10 000 10 000 590 28 june / 28 dec
SUKUK ETAT DE COTE D'IVOIRE 5.75% 2016-2023 9 600 9 600 292.292 7 sept / 7 march
SUKUK ETAT DU SENEGAL 6.25% 2014-2018 10 000 10 000 289.097 18 jul / 18 jan
SUKUK ETAT DU SENEGAL 6% 2016-2026 10 000 10 000 321.181 26 jul / 26 jan
SUKUK ETAT DU TOGO 6.5% 2016-2026 10 001 10 001 306.667 17 aug / 17 fev
Quantity Reference price Previous price Coupon Maturity
BOA BURKINA F. 6.25% 2012-2017 10 000 10 000 587.5 11-oct
BOA - CI 6.25% 2012-2017 10 000 10 000 612.5 11-oct
BOA NIGER 6.25% 2012-2017 9 250 9 250 587.5 11-oct
BOA SENEGAL 6.50% 2012-2017 10 000 10 000 611 11-oct
ORAGROUP 6.75% 2013-2019 10 000 10 000 337.5 04 june/ 04 dec
PAA 6.95% 2010-2017 1 000 1 000 168.85 28 may / 28 nov
PAD 7% 2010-2017 1 250 1 250 189.79 22 june / 22 dec
PALMCI 7% 2009-2016 10 000 10 000 342.06 28 june / 28 dec
SHELTER AFRIQUE 6.6% 2014-2021 9 000 9 000 327.29 28 feb / 28 aug
SIFCA 6.90% 2013-2021 10 000 10 000 676.2 08-aug

CREDIT RISK MANAGEMENT BEYOND NUMBERS
Contacts Bloomfield Investment Corporation
Djeneba DIALLODirecteurAnalyses Economiques et Boursiè[email protected]
Bloomfield Investment Corporation06 BP 1888 Abidjan 06Tel: (225) 20 215 747 / (225) 20 215 749Fax: (225) 20 215 751
![WAFA - Booklet_Final(1)Final[1]](https://static.fdocuments.in/doc/165x107/545a790eb1af9fcf338b5d9f/wafa-bookletfinal1final1.jpg)