STOCK MARKET INTEGRATION AND PORTFOLIO … Market Integration and Portfolio... · research pr.per...
24
STOCK MARKET INTEGRATION AND PORTFOLIO DIVERSIFICATION IN THE BRIC COUNTRIES Wong Kai Hung HG 4636 Corporate Master in Business Admini tration W8 71 2012 20U
Transcript of STOCK MARKET INTEGRATION AND PORTFOLIO … Market Integration and Portfolio... · research pr.per...

STOCK MARKET INTEGRATION AND PORTFOLIO DIVERSIFICATION IN THE BRIC COUNTRIES
Wong Kai Hung
HG 4636
Corporate Master in Business Admini tration W871 201220U

Pusat Khidmat Maklumat Akademik UNIVERSm MALAYSIA SARAWAK
P.I<HIDMAT MAI<LUMAT A1<ADEMII<
111111111 Ili'milllllllll 1000246915
STOCK MARKETS INTEGRATION AND PORTFOLIO DIVERSIFICATION IN THE BRIC COUNTRIES
WONG KAI HUNG
A dissertation submitted in partial fulfillment of the requirements for the degree of Corporate Master in Business Administration
Faculty of Economics and Business UNIVERSITI MALAYSIA SARA W AK
2012

I
,...
APPROVAL PAGE
I certified that I have supervised and read this study and in my opinion it conforms to
acceptable standards of scholarly presentation and is fully adequate in scope and quality
as a research paper for the degree of Corporate Master in Business Administration.
Associate Professor Dr. Puah Chin Hong Supervisor
This research paper was submitted to the Faculty of Economics and Business, UNIMAS
and is accepted as partial fulfillment of the requirements for the degree of Corporate
Master in Business Administration.
Professor Dr. Shazali bin Abu Mansor Dean, Faculty of Economics and Business UNIMAS
11
STATEMENT OF ORIGINALITY
111e work described in this Research Paper, entitled
"STOCK MARKETS If-HEGRA TION AND PORTFOLIO DIVERSIFICATION
IN THE BRIe COUNTRIES"
is to the best of the author's knowledge that of the author except
where due reference is made.
oIt SEP 2012 Date WONG KAI HUNG
10031717
1Il

ABSTRACT
STOCK MARKETS INTEGRATION AND PORTFOLIO DIVERSIFICATION
IN THE BRIe COUNTRIES
By
WONG KAI HUNG
GniS study examines the stock market integration and portfolio diversification in the
BRICs (Brazil, Russia, India and China) before and after the US subprime mortgage
crisis in 2008. The monthly stock market dosing indexes from May 2003 to June 201]
have been adopted and further sub-divided into pre-crisis and post-crisis periody The
results reveal that increase of stock market integration in BRICs after the subprime crisis.
The evidence also found that China stock market is the most influential among the BRICs,
in whioh the China stock market has the ability to Granger cause the other three BRICs
member countlies. Policy implication for investor on portfolio diversification shall be
considered.
1V
<

,.....
ABSTRAK
PASARANSAHAMINTEGRASIDAN PORTFOLIO KEPELBAGAIAN
DI NEGARA BRIe
Oleh
WONG KAI HUNG
Kajian ini mengkaji integrasi pasaran saham dan pempelbagaian portfolio dalarn BRICs
(Bra7jl, Rusia, India dan China) sebelum dan selepas krisis gadai janji subprima US pada
talmn 2008. Indeks penutupan pasaran saharn bulanan dari Mei 2003 hingga Jun 2011
telah dipakai dan dibahagikan kepada tempoh sebelum krisis dan tempoh selepas krisis.
Dapatan kajian menunjukkan bahawa terdapat peningkatan integrasi pasaran saham
dalarn BFJCs selepas krisis subprima. Keteranganjuga mendapati bahawa pasaran saharn
China adalah yang paling berpengaruh di kalangan BRICs, di mana pasaran sallam China
mempwlyai keupayaan untuk Granger menyebabkan tiga BRICs negara anggota yang
lain. Implikasi dasar untuk pelabur pada kepe1bagaian portfolio hendaklah
dipertimbangkan.
v

I
ACKNOWLEDGEMENT
lliank God for gi ving His wisdom and all the arrangement for me to complete the 18
months CMBA study. Thank God to arrange Dr. Puah Chin Hong to be my EBA6495
research pr.per supervisor. lowe a debt of gratitude to Dr. Puah for his guidance, advices,
comments and suggestions that have enable the paper to be completed. I am grateful for
. the assistance and support extended by Dr. Pual1.
I
[ would also like to express my thanks to all the course mates in accompanying me during I
the CMBA journey. Thanks for yow' all encouragement and support in the process of
completing this study.
Lastly, I am grateful to my wife and three lovely children who have given a support and
patience to me throughout the CMBA study.
Thanks for all.

,...
i
Pusat Khidm8t Maklumat Akademlk IJNIVf.RSm MA~YSIA SARAWAK
TABLE OF CONTENTS
LIST OF TABLES
LIST OF FIGURES
CHAPTER I: INTRODUCfJON
1.0 Introduction
1.1 BRIC Countries Background
1.2 BRICs Stock Market Development
1.2.1 Brazil Stock Market Development
1.2.2 Russia Stock Market Development
1.2.3 India Stock Market Development
1.2.4 China Stock Market Development
1.2.5 The BRICs Role in Global Economic
1.3 Special Event in 2008
1.4 Problem Statement
1.5 Objectives of the Study
1.5.1 General Objective
1.5.2 Specific Objectives
1.6 Significance of the Study
1.7 Scope of the Study
Page
x
XI
4
7
8
10
12
14
17
20
22
23
23
23
23
24
VIl

I
II CHAPTER II: LITERATURE REVIEW
2.0 Introduction 25
2.1 Review of Stock Market Integration in Developed COlll1tries 25
2.1.1 CEECs 25
2.1.2 EMU 26
2.1.3 Latin American 27
2.1.4 NAFTA 27
2.2 Review of Stock Market Integration in Developing COlll1tries 31
r , 2.2.1 Gee 31
2.2.2 ASEAN-5 32
2.2.3 MENA .) .... .,
2.2.4 ASIA 33
I' 2.3 Review of Stock Market Integration in BRIC Countries 37
I' CHAPTER III: METHODOLOGY
3.0 Introduction 40
3.1 Estimation Methods 41
3.1.1 Augmented Dickey-Fuller Unit Root Test 42
3. i .2 Johansen and luselius Cointegration Test 43
3.1.3 Gra..'1ger Causality Test Based on VECM 44
Ylll

I'
I'
I'
J
I
I
~ .
II
I
CHAPTER IV: EMPIRICAL RESULTS
4.0 Introduction 46
4.1 Unit Root Test Results 46
4.2 Cointegration Test Results 47
4.3 Granger Causality Test Results Based on VECM 49
CHAPTER V: CONCLUSION
5.0 introduction 54
5.1 Policy Implications 54
5.2 Conclusion Remarks 56
5.3 Limitation of the Study 57
REFERENCES
IX

LIST OF TABLES
Page
Table 1.1 BRIC Countries - Economy and Income, 2010 4
Table 1.2 BRiCs Foreign Direct Investment Inflow, 2000 - 2010 6
Table 2.1 Summary of the Review on Developed Countries 29-30
Table 2.2 Summary of the Review on Developing Countries 35-36
Table 2.3 Summary of the Review on BRIC Countries 39
Table 4.1 Augmented Dickey-Fuller Test Results 47
Table 4.2 Johansen-Juselius Cointegration Test Results 48
Table 4.3 Granger Causality Test Results Based on VECM 49
x

LIST Ol~ FIGURES
Page
Figure 1.1 BRIC Countries Economic Growth, 2000 - 2010 5
Figure 1.2 Monthly Brazil BOVESPA Index, 1993-2011 9
Figure 1.3 Monthly Russia Moscow Timex Ir..dcx, 1995-2011 11
Figure 1.4 Monthly India BSE 100 Index, 1987-2011 13
Figure 1.5 Monthly China SSE Composite Index, 1997-2011 16
Figure 1.6 BRICs Relative to the World, 1990-2010 18
Figure 1.7 FDI, Net Inflows (BoP, Current US$), 2003-2010 19
Figme 4.1 Direction of Causality 50
Xl

CHAPTER I
INTRODUCTION
1.0 lntt'oduction
Financial market is a mechanism that allows people to trade the financial securities,
commodities and other fungible items that to facililate in raising of capital in capital
market, transferring of risk in derivatives and money markets, and international trade in
the currency market. Throughout the past few decades, the financial markets have grown
rapidly in most of the developing countries due to globalization, deregulation, and
advancement in technology. The change of regulatory on international capital flows has
resulting in increased of capital mobility and more integrated of financial market allover
the world.
In Finance, market are said to be integrated when the identical risk of an asset in different
countries lead to similar level of expected return. Market integration refers to a situation
where there are no impediments such as legal restrictions, transaction cost, taxes and
tariffs against the trade in foreign assets or the mobility of portfolio equity flows
(Marashdeh & Shrestha, 20 1 0, pp.l02). Equity market, also known as stock market, is
vital in financial economy because it provides a channel for investors to access in capital
and ownership of a company with potential return based on its future performance. Hence,
the development of stock markets could enhance the degree of market integration.
1

Integration of stock markets has brought an awareness to both policy-makers and finance
specialists. It is vi,tal for several reasons. First, 'it provides opportunities in risk sharing
among the integrated market (Marashdeh & Shrestha, 20 I 0). Second, it reduces the cost
of capital and price volatility (Tai , 2007). Third, it contributes to financial stability by
enhancing competition and efficiency in allocation of resources (Trichet, 2005). Forth, it
encourages innovation and cost effective intenneddion to improve access of financial
services «(iiunndli ('I 01.. 2002). Fifth, it fosters country's financial sector to emerge as a
regional financial centre (Reddy, 2003). Sixth, it promotes domestic savings, investment
and could positively affect total factor productivity and economic growth (Levine, 200 I) .
Hence, the analysis of the nature of integration of emerging markets would not only give
an idea of possible gains to be reaped out of pOitfolio diversification but may also
provide some indications of the vulnerabil ity of the country's equity market in case of
regionaliinancial crisis and consequent reversal of capital tlowsfrom the region (Chittedi.
2009, pp.19)
Generally. there are two core benefits of pOltfolio diversification. for example gain In
expected returns and risk reduction. The impact of financial market integration is
imrortant. given that a pOltfolio 's exposure to systematic risk can be reduced through
international diversification. The international pOJtfolio diversification \vill be benefited
if foreign securities do not perfectly correlated. It is well established that greater
diversification benefits exist when the markets are less correlated: However, the concept
of integrated marker has strong consequences for international investors as it implies that
the benefits of international portfolio diversification would disappear (Lee el al .. 2009).
2

Therefore, it is important to study the integration of stock market as it could affect the
investors' decision in portfolio diversification especially in emerging market. In order to
better understand the emerging stock market integration dynamics, the study focuses on
BRIe (Brazil, Russia, India and China) countries as it is the world's fastest growing
emerging market which plays an increasing important role in the global economic
development in 2010s. As at 20 February 2011, the Richest People reported the following
statement:
"By 2020 there will be a major shift in the global balance of economic
power compared to 2010. Emerging economies will rise in importance
and China will have overtaken the USA to lead the list of the world's top
ten largest economies by Gross Domestic Product (GDP) measured in
purchasing power parity (PPP) terms. Consumer markets in emerging
economies will present enormous opportunities but their rapid growth
poses a challenge to the global environment. i:-arly this year, Japan
confirmed that China's economy surpassed its own and the world's second
largest in 2010".
The top ten world's ranking by according to PPP CDP is as below:
1- United States 6 -Russia
2 - Chilla 7 - United Kingdom
3-Japan 8 -Brazil
4 -Illdia 9-France
5-Germany 10 -Italy
3

1.1 BRIC Countries Background
The BRIC cOlmtries, established since 2003, are dominating the emergmg market
economies in 21 st century. Due to its demographic and economic development, the BRIC
countries are rank among the world largest and most influential economies. The emerging
market economy plays an increasingly important role in global economic development as
well as monetary and financial systems. After the financial crises in Asia and Russia in
) 998, Turkey and Brazil in 1999, and Argentina in 2001, the financial potential and
economic development of the emerging markets especially the BRIC cOlIDtries were
focused sharply by the investor (Jensen & Larsen, 2004).
Table 1.1: BRIe Countries - Economy and Income, 2010
BRIC GDP I
(USD Iper cent
GDP,PPP
(USD f per ccnt
Market capitalisation
(USD Iper cent (
Population
'11" )1 per ccnt billion) of world billion) of world billion) of world ml IOn of world
Brazil 2,088 3.3% 2,185 2.9% 1,546 2.8% 195 2.9%
Russia 1,480 2.3% 2,812 3.7% 1,005 1.8% 142 2.1%
India 1,727 2.7% 4,195 5.5% 1,616 2.9% 1,171 17.1%
China 5,927 9.4% 10,170 13.3% 4,763 8.5% 1,338 19.6%
BRIC total 11,222 • I17.8% 1 19,362 25.3% 8,930 15.9% 2,846 41.6%
Source: WOl database, World Bank.
111e development of BRIC cOlIDtries stock markets are significant in relative to the world
economy. By referring to the Table l.l, the BruCs total popUlation comprised more than
2.8 billion people which over 40% of the world's population. Among the BRICs, China
and India stood about 20% and 17% respectively. The significant grew in population
could lead to the deveiopment of BRIC countries economy and directly influenced the
GDP and purchasir.g power parity (PPP). As a result the GDP of the BRICs had
4

"Pusat Khldmat Maklumat Akademik lJNIVERSm MALAYSIA SARAWAK
accolUlted for nearly 18% of the world and its GOP, PPP had stood up to 25% globally.
From there, China had contributed 9.4% and 13.3% respectively. Due to high population
and economy performance, the total market capitalization of the BRICs had achieved
about 16% of the world. Among the BRIes, China took up the largest portion which was
8.5% of the world total market capitalization. As at 31 December 2010, China consisted
of 2,062 listed companies which ranked the world second largest by market capitalization
ofstocks I.
Figure 1.1: BRiC Countries Economic Growth, 2000 - 2010
15%
10%
5%
OOA,
! - 8 g 8 8 '0 "g g g ~ ~ ~ ~ ~ ~ ~
-5%
-10%
1- &azil. - RuSSia - India China - - - . World I Source: WDI database, World Bank.
In the last decade. the BRIC countries achieved a higher economic growth rate as
compared to the world, see Figure 1.1. Before the U.S. financial crisis2 erupted in 2008,
I Reported by Shang Fulin, chairman of the China Securities Regulatory Commission in China Daily dated 31 December 2010. 2 'The U.S. subprime mortgage crisis occurred since August 2007 due to rise of interest rate and house bubble, and this tragedy spread to the world in September 2008.
5

__
the BRIe cOWltries achieved a positive high growth rate from 5% to 14%. Due to this,
many international investors have diversifying their portfolio in the emerging market
espccially the BRIe COWltries. Table 1.2 reported that the foreign direct investment (FDI)
inflow of BRIes was increased significantly by 337% from US$77.5 billion in 2000 to
US$338.6 billion in 2008. Even though the FDI inflow ofBRICs was dropped during the
subprime crisis periods but due to its strong economic, it had recovered subsequently in
2010. This indicated that more and more investors realized the importance of BRIes
e.-nerging market in the world perspective ar.d have a confidence in the BRICs market's
potentiality. Therefore, it is worth to study the market integration among the BRIe
CClDltries in order to determine the intem&lionru portfolio diversification direction.
Table 1.2: BRICs FOI-eign Direct Investment Inflow, 2000 - 2010
Brazil ! Russian I India I China Total Year
US$ Million
2000 32,779 2,714 3.584 38,399 77,476
2001 22,459 2:~48 5,"172 44,241 74.918
2002 16,590 3,461 5,626 49,308 74,985
10,144 7,958 4,323 47,0772003 69,502 I 18,166 15,444 5,771 54,936 94,3172004
15,066 12,&86 7,606 117,208 152,7662005
2006 18,782 29,;01 20,336 124,082 192,901
2007 34,5a5 55,073 25,483 160,052 275,193
2008 45,058 75,002 43,406 175,148 338,614
212,260 2009 25,949 36,500 35,5% 114,215
48,438 42,868 24,159 185,081 300,5462010
Source: Databank, World Bank.
6
-============-- --- ------------ --------------1

1.2 BRICs Stoclk Market Development
The growth of stock market in BRICs has brought up an interest to the policymakers by
expanding the financing options availability. Levine and Zervos (1995) argued that the
stock market can give a big boost to economic development. According to World Bank
(2010), several benefits can be associated with the development of the equity market:
. - Investment in stocks is a form of long-term saving that is invested directly in
production activity.
- Developed markets reward investors by returns maximization and the efficient use
of resources, which are the seeds to begin a cycle of development and
competitiveness.
- Developed markets \\1th liquidity, volwne and regulation stimulate businesses at a
firm-level.
- Shareholder activity reflects the expectations of the main market players, as well
as their opinions about both domestic and international states of economic affairs.
- An efficient stock market has a fundamental role in attracting, maximizing,
consolidating and retaining external capital .
The stock market development of the BRIC countries will be presented in the follo\\1ng
section and four main stock indexes namely Brazil BOVESP A Index, Russia Moscow
Times Index, India Bombay SE 100 Index, and China Shanghai Composite Index are
adopted as a benchmark in analyzing the market performance.
7
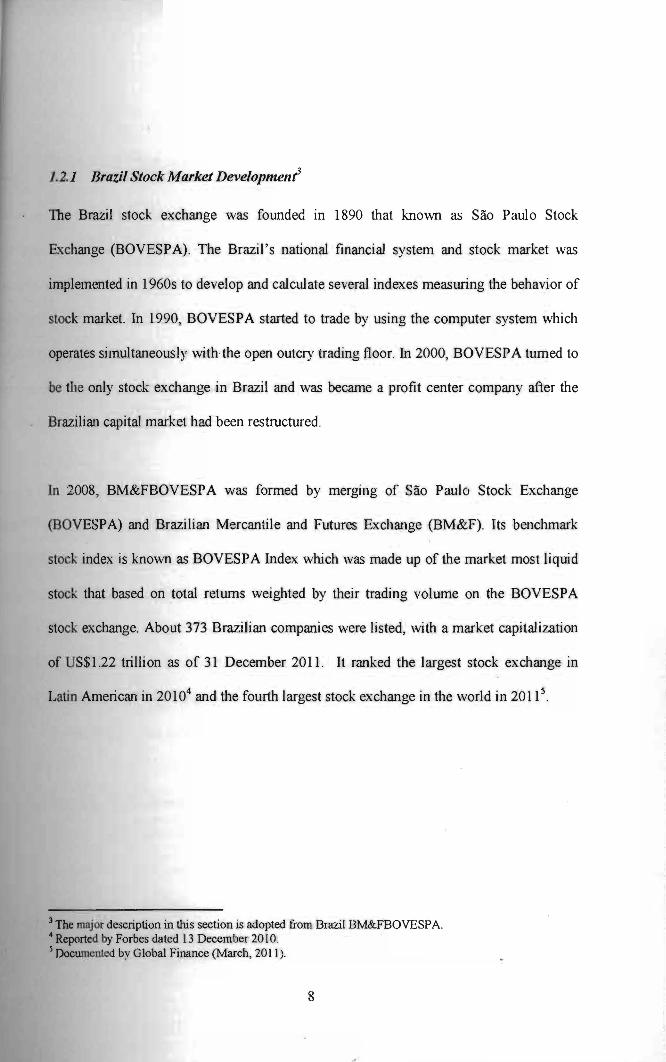
1.2.1 Brazil Stock Market Developmellt
The Brazil stock exchange was founded 10 1890 that known as Sao Paulo Stock
Exchange (BOVESP A). The Brazil ' s national financial system and stock market was
implemented in 1960s to develop and calculate several indexes measuring the behavior of
stock market. In 1990, BOVESPA started to trade by using the computer system which
operates simultaneously with the open outcry trading floor. In 2000, BOVESPA turned to
be the only stock exchange in Brazil and was became a profit center company after the
Brazilian capital market had been restructured.
In 2008, BM&FBOVESPA was formed by merging of Sao Paulo Stock Excha.rlge
(BOVESPA) and Brazilian Mercantile and Futures Exchange (BM&F). Its benchmark
stock index is known as BOVESP A Index which was made up of the market most liquid
stock that based on total returns weighted by their trading volume on the BOVESPA
stock exchange. About 373 Brazilian companies were listed, ,\lith a market capitalization
of US$1.22 trillion as of 31 December 2011. It ranked the largest stock exchange in
Latin American in 20104 and the fourth largest stock exchange in the world in 2011 5.
3 The major description in this section is adopted from Brazil13M&FBOVESP A. 4 Reported by Forbes dated 13 December 2010. S Docwnenled by Global Finance (March, 2011).
8

Figure 1.2: Monthly Brazil BOVESPA Index, 1993-2011
Index
80000
70000
BRIC Pre-recognition
50000
40000
I ~ 20000
1 I Subprime
___________ ____M_'0_rt_ga_6_c_c.r_iS_iS_~.::::-__'..__. Hi ~ ff ff ff H~ R~ ~ ~ I~ SOW"ce: DataStrcam,
Figure 1.2 displays the monthly historical Brazil BOVESPA Index movement from 1993
to 20 11. Before the recognition of BRICs region, the index was less volatile and moved
not higher than 20,000 points for the past decade, The highest point recorded was in
Ma;ch 2000 at 17,820 but dropped again to less than 10,000 in July 2002, After BRICs
region was formed in 2003 as an emerging market, the BOVESPA Index increased
sharply by reaching a historical high of 73,516 point in May 2008 before the subprime
mortgage crisis occurred.
Due to the effect of subplime mortgage crisis tragedy, the BOVESPA Index was declined
by more than 50% to only 29,435 points in just six months period from May to
No\'ember 2008. However, the stock market recovered again and escalated to the peak of
70,673 points in October 2010. In spite of the European sovereign debt concerns in early
2010 and uncertainly about the impact of in../lation on the emerging economies' growth in
BRIC Post-Recognition
I 10000. o_~, _~ _~, ' _~ :~_~~_~~~ -. • - -. ~. -. -
9

the latter part of the year, the BOVESPA Index fell again since October 2010 by 20% to
56,754 points as at 31 December 201 L
1.2 2 Russia Stock Market Developmellt 6
The Russian first regulated stock market after the dissolution of Soviet Union in 1991
was estabiished in 1995 which known as Russian Trading System (RTS) Stock Exchange.
RTS Stock Exchange is trading the full range of financial instruments from cash equities
to commodity futures and become Russian securities industry benchmark. Subsequently,
the Moscow Stock Exchange (MSE) was introduced to create and develop the equities
market through a single trading system in 1997. The MSE's core activity is to develop the
commodity market infrastructure as well as constantly improves its trading systems by
looking for new opporttmities to enhance its products and services.
As of 19 December 2011, RTS merged with Moscow Interbank Currency Exchange
(MICEX). MICEX was established in 1992 and acts as a main stock exchange in Russia
as , ell as in East Europe and ranked in top 20 of world ' s top stock exchange in 2011 7.
The main function of MICEX during the time when it was created w~ to carry out
currency transactions. As a result, the merger of two largest stock exchanges in Moscow
is tending to become a main tmiversal stock exchange entity for trading all classes of
financial assets and to advance Moscow into an international financial centre as well as
6 The major backgrolUld contents are adopted from Russian Trading System Stock Exchange and Moscow Stock Exchange. 1 The statistic was abstracted from The MICEX Group Proftle.
10

---- ---- -
further market will be refonned in 2012 including the creation of a single depository8 As
001 December 2011, the total market capitalization of Russia was about US$1 trillion.
Figure 1.3: Monthly Russia Moscow Timex Index, 1995-2011
Index
25(Xx)
2()(xx)
15(0)
J()(XX)
:5(0)
0
ffi' 10 i' 00
~ ~ ~
BRlCs Pre-recognition
~ a -8 8
"I "I 8 § "I "I
BRICs
"I § 10 i'
8 8 8 "I "I "I "I
Subprimc Mortgage crisis
00 01
~ 8 8 a a "I "I "I "I
Source: DataStream.
Figure 1.3 shows the monthly data movement of Russia Moscow Times (RMT) Index
between 1995 and 2011. Prior to the recognition of BRIes, the RMT Index was moved
gmdual ly upwards but in slower pace. The highest point hit was in April 2003 which at
5, j 95. This was mainly due to Russian debt crisis in 1998 which led to the devaluation of
ruble9 and default of debts. 111is crisis affected a.'l inflow of foreign direct investment
(FDI) to the country. According to the World Bank's statistic, the average net inflow of
FDI between 1995 arld 2002 was only US$3.1 billion per annum. After the recognition of
BRICs in 2003, the Russian FDI net inflow increased significantly to an average of
aReported by Reuters dated 19 December 20II . 9 It is the currency unit of Russia.
11
=----~~-----------==:------:--:---.-:..: - -------------

US$32.7 billion per annum between 2003 and 2008. This encouragement had bulled up
the RMT Index by 287% from 5,505 points in May 2003 to 21,304 points in April 2006
and further up to historical high of 25,887 points before the subprime mortgage crisis
happened in May 2008. The index movement has similar trend with Brazil BOVESPA
Index.
Due to the subprime CrISIS In 2008, the stock market in Russia had been affected
tragically which resulted RMT Index dropped significantly to less than 8,000 points in
just 6 months period. By that time, Russia had registered a negative GDP growth of 8%
~md the net inflow of Russian FDI was dropped from US$75billion in 2008 to only
US$36 billion in 2009. However, due to its strong positive reserves and current acCOlUlt
balances, the Russian economy had been recovered rapidly in 2009. During the time of
subprime crisis in 2008-2009, Russia still maintained US$439 billion of total reserves
(includes gold) and US$49 billion current account balances 10. Therefore, the RMT Index
sooner retrieved from 7,966 point in December 2008 to as high as 21,056 points as of 31
July 201 1.
1.2.3 /tldia Stock Market Development II
The Bombay Stock Exchange (BSE), established in 1875, is the oldest stock exchange in
Asia It was the first stock exchange recognized by the Indian Government in 1956. In
1986, BSE developed the BSE SENSEX (Sensitivity Index) or BSE 3012. to measure the
overall index of the stock exchange in India stock market. In [ 989, BSE National Index
10 The empirical statistic reported by World Bank. II The major description of this section is referred to India Bombay Stock Exchange. 12 SSE 30 is free float market capitalization weighted stock market index of 30 largest stocks in 12 sectors.
12