
Stock Tips | Free Stock Tips | Intraday Tips | Commodity Tips
Upload
narnolia-securities-limitedCategory
view
422download
0description

BAJAJ-AUTO LTD: Inline Performance but Market Share lost. "Neutral" 17th Jan 2014
Bajaj Auto posted its 3QFY14 results with net sales at Rs 5025 Cr down by 6 % YoY. The decline in the net sales came on the back of lower
volume in the quarter under review. The company during the 3QFY14 manage to sell 993,690 units of vehicles down by 11 % YoY.
...................................................................... ( Page : 5-6)
HCLTECH : "Retain confidence" "BUY" 17th Jan 2014
HCL tech beats expectations with a sustained momentum in volumes and proved its consistency to maintain its margin at 26% mark; Sales grew
by 2.8% (QoQ) in INR term and 4% (QoQ) in USD term led by 4.6% of growth from Infrastructure services and BPO services. Considering the
increasing discretionary spends across the geographies like US and Europe, we expect healthy earnings performance ahead. At a CMP of Rs
1392, stock trades at 17.5x of FY14E earnings, We retain BUY on the stock and revised our target price from Rs 1194 to Rs1560.
............................................... ( Page : 2-4)
DCB : "BUY" 17th Jan 2014
DCB reported healthy profit growth on the back of higher growth in NII and other income. Bank reported improvement in asset quality in
sequential basis despite of challenging macro environment. During quarter bank strengthen its balance sheet and witnessed improvement of
operating and financial metrics. We have revised our target price to Rs.65 from earlier of Rs.61 and according change our rating from neutral to
buy ............................................ ( page :12-16)
Axis Bank’s profit was better than expectation largely due to lower provisions made by bank. At PBT level bank reported moderate growth of
10.7% YoY despite of healthy NII growth on account of flat other income and higher CI ratio. Margin at sequential basis was compressed by 8
bps due to higher growth in cost of fund than yield on loan. Exposure to risky sector remained high among peers. We revised our target price to
Rs.1217 from earlier of 1147. We remain have neutral view on the stock owing to uncomfortable profit, lower growth in deposits than loan,
sticky gross slippage ratio and impaired asset higher than peers. ............................... ( Page :7-11)
17th Jan, 2014
Edition : 186
IEA-Equity
Strategy
AXIS BANK : "Neutral" 17th Jan 2014
CMC : "Nothing for excitement" "Neutral" 16th Jan 2014
we expect that its earning visibility and order from government side in coming 2 quarter could be impacted because of general election
schedule in India (earns 41% revenue from India). For a near to medium -term prospect, we are not much excited on the stock taking its earning
visibility in near term. We had already advised to book profit on 9th Jan 2014 at a target price of Rs 1690, now we have a “Neutral” view on the
stock. At a CMP of Rs 1527, stock trades at 16.5X FY15E earnings ................................... ( Page : 24-26)
YES BANK : "Neutral" 16th Jan 2014
Yes Bank profit growth was higher than expectation due to lower provisions made of bank despite of reporting higher delinquencies. Balance
sheet growth on sequential basis declined led by lower incremental deposits (other than CASA) whereas advance grew handsomely. Leverage
ratio (Total asset to Net worth) has been declining from past four quarters indicating no surplus liquidity in balance sheet. Moreover bank need
additional borrowings to fund its growth trajectory, this would result of higher cost of fund and margin compression. We remain have neutral
view on the stock and reduce our target price to Rs.388 from Rs.443.................... ( Page :20-23)
"BUY" 16th Jan 2014
For 3QFY14, NIITTECH reported marginally below numbers than street estimates, sales was unchanged at Rs587.3cr because of reduced
purchase for resale (PFR) in domestic Government business while revenues from services grew 4.3% sequentially. Company’s Order wins in the
recent quarters have been healthy, lending visibility on revenue growth. At a CMP of Rs 376, trades at 6.9x FY15E earnings. We retain “ buy”
view on the stock with a price target of Rs 440 (revised from Rs360) ........................... ( Page :17-19)
NIIT Tech :"Focused on growth story"
Narnolia Securities Ltd,
India Equity AnalyticsDaliy Fundamental Report on Indian Equities
HCLTECH
1M 1yr YTD
Absolute 17.8 109.4 149.1
Rel. to Nifty 15.4 105.1 131
Current 4QFY13 3QFY13
Promoters 61.84 61.92 61.99
FII 26.01 24.45 24.32
DII 5.70 6.49 6.56
Others 6.45 7.14 7.13
Financials2QFY14 1QFY14 (QoQ)-% 1QFY13 (YoY)-%
Revenue 8184 7961 2.8 6273.8 30.4
EBITDA 2125 2093 1.5 1417 50.0
PAT 1495 1416 5.6 965 54.9
EBITDA Margin 26.0% 26.3% (30bps) 22.6% 340bps
PAT Margin 18.3% 17.8% 50bps 15.4% 290bps
2
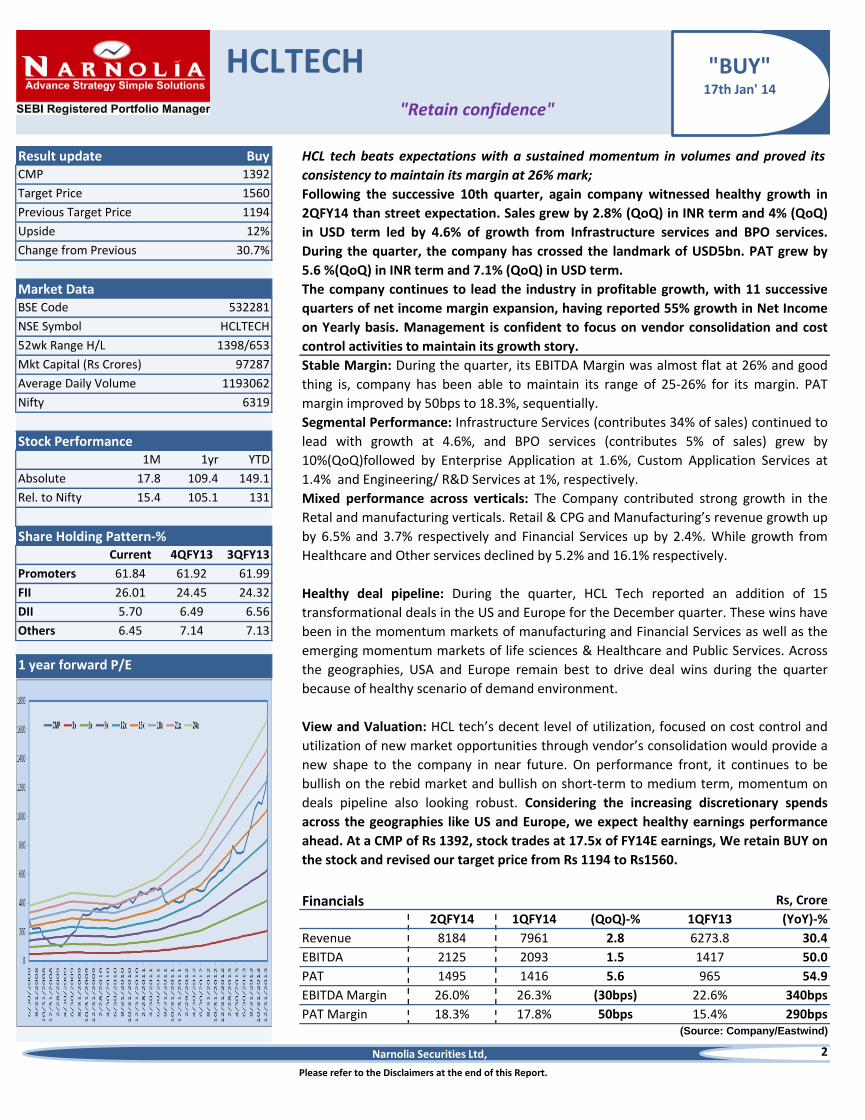
Segmental Performance: Infrastructure Services (contributes 34% of sales) continued to
lead with growth at 4.6%, and BPO services (contributes 5% of sales) grew by
10%(QoQ)followed by Enterprise Application at 1.6%, Custom Application Services at
1.4% and Engineering/ R&D Services at 1%, respectively.
Stable Margin: During the quarter, its EBITDA Margin was almost flat at 26% and good
thing is, company has been able to maintain its range of 25-26% for its margin. PAT
margin improved by 50bps to 18.3%, sequentially.
Following the successive 10th quarter, again company witnessed healthy growth in
2QFY14 than street expectation. Sales grew by 2.8% (QoQ) in INR term and 4% (QoQ)
in USD term led by 4.6% of growth from Infrastructure services and BPO services.
During the quarter, the company has crossed the landmark of USD5bn. PAT grew by
5.6 %(QoQ) in INR term and 7.1% (QoQ) in USD term.
Mixed performance across verticals: The Company contributed strong growth in the
Retal and manufacturing verticals. Retail & CPG and Manufacturing’s revenue growth up
by 6.5% and 3.7% respectively and Financial Services up by 2.4%. While growth from
Healthcare and Other services declined by 5.2% and 16.1% respectively.
Healthy deal pipeline: During the quarter, HCL Tech reported an addition of 15
transformational deals in the US and Europe for the December quarter. These wins have
been in the momentum markets of manufacturing and Financial Services as well as the
emerging momentum markets of life sciences & Healthcare and Public Services. Across
the geographies, USA and Europe remain best to drive deal wins during the quarter
because of healthy scenario of demand environment.
The company continues to lead the industry in profitable growth, with 11 successive
quarters of net income margin expansion, having reported 55% growth in Net Income
on Yearly basis. Management is confident to focus on vendor consolidation and cost
control activities to maintain its growth story.
Share Holding Pattern-%
Nifty 6319
Stock Performance
Result update Buy
1 year forward P/E
Rs, Crore
(Source: Company/Eastwind)
Please refer to the Disclaimers at the end of this Report.
View and Valuation: HCL tech’s decent level of utilization, focused on cost control and
utilization of new market opportunities through vendor’s consolidation would provide a
new shape to the company in near future. On performance front, it continues to be
bullish on the rebid market and bullish on short-term to medium term, momentum on
deals pipeline also looking robust. Considering the increasing discretionary spends
across the geographies like US and Europe, we expect healthy earnings performance
ahead. At a CMP of Rs 1392, stock trades at 17.5x of FY14E earnings, We retain BUY on
the stock and revised our target price from Rs 1194 to Rs1560.
Average Daily Volume 1193062
Previous Target Price 1194
Upside 12%
HCL tech beats expectations with a sustained momentum in volumes and proved its
consistency to maintain its margin at 26% mark;
"Retain confidence"
CMP 1392
Target Price 1560
Change from Previous 30.7%
52wk Range H/L 1398/653
97287Mkt Capital (Rs Crores)
Market DataBSE Code 532281
NSE Symbol HCLTECH
"BUY"17th Jan' 14
Narnolia Securities Ltd,

3
Utilization rate
(Source: Company/Eastwind)
(Source: Company/Eastwind)
Utilization down from 84.9% to 84.1%.
Further, it's Utilization are at decent
levels, indicated can still derive more
efficiency .
In dollar terms, the revenues grew by
4% QoQ (cc terms 3.1%) to USD 1321mn
and net profit grew by 7.1% QoQ to
USD 241.6mn.
Tha company expects to maintain EBIT
margin at 18.5-19.5% in FY14
Clients Metrics
Employee Metrics
(Source: Company/Eastwind)
Please refer to the Disclaimers at the end of this Report.
HCLTECH
Sales(USD term) and Sales growth-%(QoQ)
Margin-%
Narnolia Securities Ltd,
. 1QFY12 2QFY12 3QFY12 4QFY12 1QFY13 2QFY13 3QFY13 4QFY13 1QFY14 2QFY14
Top 5 Clients 15.3% 15.8% 16.0% 16.4% 16.2% 15.7% 15.4% 15.4% 15.1% 14.8%
Top 10 Clients 24.1% 24.2% 24.3% 24.7% 24.5% 24.2% 24.0% 23.8% 23.8% 23.8%
Top 20 Clients 34.2% 33.9% 33.9% 34.1% 33.6% 33.3% 32.8% 33.0% 33.2% 33.6%
Clients Contribution
. 1QFY12 2QFY12 3QFY12 4QFY12 1QFY13 2QFY13 3QFY13 4QFY13 1QFY14 2QFY14
No of Employee 70321 72055 72474 74675 75621 75226 74226 74912 87196 88332
Gross Addition 6927 4931 3303 5274 4479 3291 2933 4316 8061 7593
Attrition 15.9% 15.7% 15.0% 14.0% 13.6% 13.6% 14.2% 14.9% 16.10% 16.6%

4
The company is expecting to catch up more deal from US and Europe because of better
demand environment ahead. Clients are looking vendor’s consolidation, and company will
try to turn this opportunity into deal.
The company expects to see margin at a range of 21-22% in near term. The wage hike is
spread over two quarters or rather more than two quarters. Q3 and Q4 margin could be
impact be 30bps.
The infrastructure business is largely under penetrated globally, less than 5% from an
Indian (vendor's) standpoint. They expect to see significant growth over there, in that
business and expect to raise infrastructure services margins by supporting customers
migrating to cloud computing.
Please refer to the Disclaimers at the end of this Report.
(Source: Company/Eastwind)
Financials;
HCLTECH
Key facts from Con-Call
Narnolia Securities Ltd,
Rs, Cr FY10 FY11 FY12 FY13 FY14E FY15E
Net Sales-USD 2704.6 3545.3 4151.5 4686.5 5379.7 6492.2
Net Sales 12136.3 15730.3 20830.6 25581.1 32278.2 38628.3
Raw Materials Cost 443.6 522.1 612.0 959.3 968.3 1158.8
Employee Cost 6253.7 8589.6 11104.6 12574.2 16139.1 19507.3
Operation and other expenses 3498.5 4163.2 5418.8 6386.4 7101.2 8691.4
Total Expenses 10195.7 13274.9 17135.3 19919.9 24208.6 29357.5
EBITDA 1940.6 2455.4 3695.2 5661.2 8069.5 9270.8
Depreciation 418.1 459.7 549.2 636.8 748.6 903.4
Other Income 154.1 299.7 206.5 306.6 511.6 645.6
Extra Ordinery Items 0.0 0.0 0.0 44.5 -484.2 77.3
EBIT 1522.5 1995.7 3146.0 5024.4 7320.9 8367.3
Interest Cost 204.1 142.6 142.6 105.6 79.2 59.4
PBT 1472.4 2152.8 3209.8 5269.9 7269.1 9030.8
Tax 213.4 488.5 782.7 1225.3 1744.6 2212.5
PAT 1259.0 1664.3 2427.1 4044.6 5524.5 6818.2
Sales-USD 24.1% 31.1% 17.1% 12.9% 14.8% 20.7%
Sales 18.6% 29.6% 32.4% 22.8% 26.2% 19.7%
EBITDA 5.9% 26.5% 50.5% 53.2% 42.5% 14.9%
PAT -4.6% 32.2% 45.8% 66.6% 36.6% 23.4%
Margin -%
EBITDA 16.0% 15.6% 17.7% 22.1% 25.0% 24.0%
EBIT 12.5% 12.7% 15.1% 19.6% 22.7% 21.7%
PAT 10.4% 10.6% 11.7% 15.8% 17.1% 17.7%
Expenses on Sales-%
Employee Cost 51.5% 54.6% 53.3% 49.2% 50.0% 50.5%
RM Cost 3.7% 3.3% 2.9% 3.8% 3.0% 3.0%
Operation and other expenses 28.8% 26.5% 26.0% 25.0% 22.0% 22.5%
Tax rate 14.5% 22.7% 24.4% 23.3% 24.0% 24.5%
Valuation
CMP 364.9 493.5 490.0 759.5 1392.0 1392.0
No of Share 67.9 68.9 69.3 69.6 69.6 69.6
NW 6288.8 7653.0 9837.9 13164.0 17548.4 23226.5
EPS 18.5 24.2 35.0 58.1 79.4 97.9
BVPS 92.6 111.1 141.9 189.1 252.1 333.7
RoE-% 20.0% 21.7% 24.7% 30.7% 31.5% 29.4%
Dividend Payout ratio 25.0% 31.5% 33.1% 24.2% 20.6% 16.7%
P/BV 3.94 4.44 3.45 4.02 5.52 4.17
P/E 19.68 20.43 13.99 13.07 17.54 14.21
Growth-%

1M 1yr YTD
Absolute 0.2 -9.0 13.0
Rel. to Nifty -1.8 -14.0 -5.0
Current 2QFY14 1QFY1
4Promoters 50.0 50.0 50.0
FII 18.7 17.8 17.4
DII 6.9 7.8 7.7
Others 24.4 24.4 24.8
Financials Rs, Crore
3QFY14 2QFY14 (QoQ)-% 3QFY13 (YoY)-%
Revenue 5131 5175 (0.9) 5413 -5.2
EBITDA 1135 1132 0.3 1012 12.2
PAT 905 837 8.1 819 10.5
EBITDA Margin 22.1% 21.9% 20bps 18.7% 340bps
PAT Margin 17.6% 16.2% 150bps 15.1% 250bps
5
The stock is trading at Rs 1908 and it has achieved our previous target price of Rs 2100, we
have turned to neutral for the stock post our target price achievement .The 3QFY14 results
are not much strong to make a convincing thought more over the management of company
has not hinted relatively stronger business outlook going forward. Post analysis of 3QFY14
results and management commentary does not make any strong conviction and maintain
our NEUTRAL view for the stock with Target Price of Rs 1870.
View & Valuation
The management of the company after results said that they donot look significant change in
industry outlook going forward. The management stated that though they have lost nearly 3
% of market share during the quarter however are hopeful to regain it on the back of 125 cc
discover bike (Launched way back in Nov 2013) and another forthcoming launch in March
2014.The company further said that they donot see OPM to cross 21% levels in near term.
The company reiterated that they will not foray in scooter segments.
Management Commentary
The realization per vehicle for the quarter was at Rs 50567 and it was Rs 47060 for the
same time last fiscal.
Inline Performance but Market Share lost.
Result Update Neutral
CMP 1908
The net profits of the company for 3QFY14 came at Rs 905 Cr and NPM at 17.6 %.The
other income for the quarter came at Rs 222 Cr and Tax Rate was 31 %.
Bajaj Auto posted its 3QFY14 results with net sales at Rs 5025 Cr down by 6 % YoY. The
decline in the net sales came on the back of lower volume in the quarter under review. The
company during the 3QFY14 manage to sell 993,690 units of vehicles down by 11 % YoY.
The total number of 2W sold during the quarter was 887,671 units down by 10 %YoY. The
company during the quarter sold 106,019 units of 3W down by 25 % YoY. The company
during 3QFY14 also have lost 3% market share.
Declined Sales Growth ; Loss in Market Share ; Maintained EBITDA Margin; Not so
Optimistic guidance..
The operating EBITDA during the quarter came at Rs 1135 Cr and OPM was 22.1 %
however the company have gained Rs 95 Cr towards time value of foreign exchange
contracts. Therefore adjusted OPM stands at 21 %.The company during the quarter
managed to hold its prices across its models which helps to maintain its OPM levels at early
twenties range. The realization of dollar for the quarter was at Rs 62.
-
Upside
Target Price 1870
Previous Target Price -
Nifty 6318
Share Holding Pattern-%
Mkt Capital (Rs, Cr)
NSE Symbol
Change from Previous
One Yr Price Movement
(Source: Company/Eastwind)
55,208
Average Daily Volume 197712
BAJAJ-AUTO LTD.
Please refer to the Disclaimers at the end of this Report.
52wk Range H/L 2193/1657
-
Market Data
BSE Code 532977
BAJAJ-AUTO
Stock Performance-%
"NEUTRAL"17th Jan' 14.
Narnolia Securities Ltd,

6
The total number of 2W sold during the
quarter was 887,671 units down by 10 %YoY.
The company during the quarter sold
106,019 units of 3W down by 25 % YoY.
(Source: Company/Eastwind)
SALES & PAT TREND
The decline in the net sales in the quarter
came on the back of lower volume sales.
Please refer to the Disclaimers at the end of this Report.
Volume Trend
(Source: Company/Eastwind)
BAJAJ-AUTO LTD.
OPM & NPM TREND
(Source: Company/Eastwind)
The company during the quarter managed to
hold its prices across its models which helps
to maintain its OPM levels at early twenties
range
Narnolia Securities Ltd,
AXIS BANK
1173
1217
1147
4
6
1M 1yr YTD
Absolute -6.3 -15.1 -15.1
Rel.to Nifty -9.2 -20.0 -20.0
Current 4QFY13 3QFY1
3Promoters 33.9 33.9 33.9
FII 43.2 43.4 40.7
DII 9.7 4.9 8.8
Others 13.2 17.8 16.6
Financials Rs, Cr
2011 2012 2013 2014E 2015E
NII 6566 8026 9666 12224 14775
Total Income 11238 13513 16217 19146 21697
PPP 6377 7413 9303 11206 12367
Net Profit 3340 4224 5179 5826 6934
EPS 81.4 102.2 110.7 124.2 148.2
7
Mkt Capital (Rs Cr)
(Source: Company/Eastwind)
Stock Performance
Average Daily Volume
Change from Previous
Axis Bank Vs Nifty
Share Holding Pattern-%
5.19 lakh
Nifty 6318
Result Updated NEUTRAL
CMP
Target Price
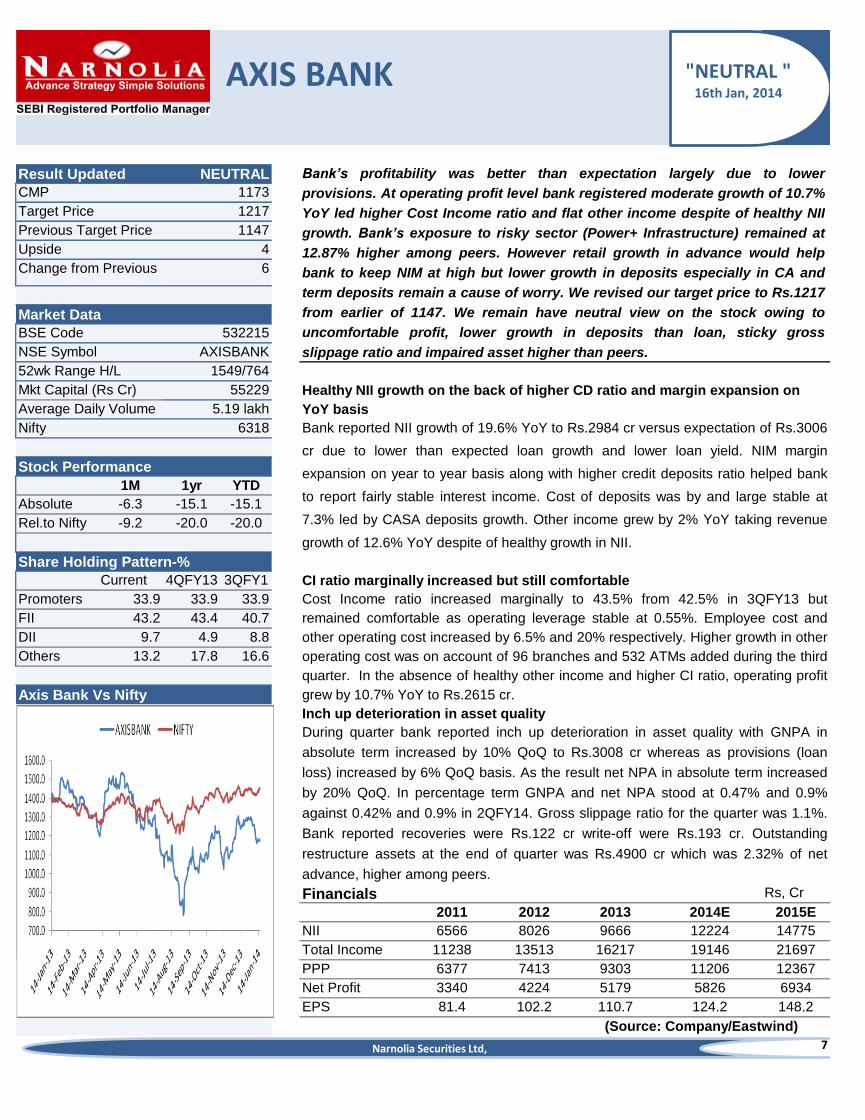
Bank’s profitability was better than expectation largely due to lower
provisions. At operating profit level bank registered moderate growth of 10.7%
YoY led higher Cost Income ratio and flat other income despite of healthy NII
growth. Bank’s exposure to risky sector (Power+ Infrastructure) remained at
12.87% higher among peers. However retail growth in advance would help
bank to keep NIM at high but lower growth in deposits especially in CA and
term deposits remain a cause of worry. We revised our target price to Rs.1217
from earlier of 1147. We remain have neutral view on the stock owing to
uncomfortable profit, lower growth in deposits than loan, sticky gross
slippage ratio and impaired asset higher than peers.
55229
Previous Target Price
Market Data
Upside
1549/764
BSE Code 532215
NSE Symbol AXISBANK
52wk Range H/L
Inch up deterioration in asset quality
During quarter bank reported inch up deterioration in asset quality with GNPA in
absolute term increased by 10% QoQ to Rs.3008 cr whereas as provisions (loan
loss) increased by 6% QoQ basis. As the result net NPA in absolute term increased
by 20% QoQ. In percentage term GNPA and net NPA stood at 0.47% and 0.9%
against 0.42% and 0.9% in 2QFY14. Gross slippage ratio for the quarter was 1.1%.
Bank reported recoveries were Rs.122 cr write-off were Rs.193 cr. Outstanding
restructure assets at the end of quarter was Rs.4900 cr which was 2.32% of net
advance, higher among peers.
Healthy NII growth on the back of higher CD ratio and margin expansion on
YoY basis
Bank reported NII growth of 19.6% YoY to Rs.2984 cr versus expectation of Rs.3006
cr due to lower than expected loan growth and lower loan yield. NIM margin
expansion on year to year basis along with higher credit deposits ratio helped bank
to report fairly stable interest income. Cost of deposits was by and large stable at
7.3% led by CASA deposits growth. Other income grew by 2% YoY taking revenue
growth of 12.6% YoY despite of healthy growth in NII.
CI ratio marginally increased but still comfortable
Cost Income ratio increased marginally to 43.5% from 42.5% in 3QFY13 but
remained comfortable as operating leverage stable at 0.55%. Employee cost and
other operating cost increased by 6.5% and 20% respectively. Higher growth in other
operating cost was on account of 96 branches and 532 ATMs added during the third
quarter. In the absence of healthy other income and higher CI ratio, operating profit
grew by 10.7% YoY to Rs.2615 cr.
"NEUTRAL "16th Jan, 2014
Narnolia Securities Ltd,

8
Bank’s profitability was better than expectation largely due to lower provisions. At
operating profit level bank registered moderate growth of 10.7% YoY led higher Cost
Income ratio and flat other income despite of healthy NII growth. Bank’s exposure to risky
sector (Power+ Infrastructure) remained at 12.87% higher among peers. However retail
growth in advance would help bank to keep NIM at high but lower growth in deposits
especially in CA and term deposits remain a cause of worry. We revised our target price
to Rs.1217 from earlier of 1147. We remain have neutral view on the stock owing to
uncomfortable profit, lower growth in deposits than loan, sticky gross slippage ratio and
impaired asset higher than peers.
AXIS BANK
Please refer to the Disclaimers at the end of this Report.
Loan growth higher than deposits growth; CASA remain healthy
On balance sheet front, bank’s advance grew by 18% YoY as against our expectation of
20% led retail advance growth of 44% YoY followed by SME (25% YoY) and agriculture
(15% YoY) growth. Deposits grew by 7% YoY versus expectation of 16%. Lower deposits
growth was primarily due to muted growth in current account and term deposits which
were reported 5% and 3% YoY growth respectively. Saving deposits grew by 23% YoY
taking overall deposits growth to 7%. CASA deposits registered growth of 250 bps YoY to
42.6%. A credit deposit for the quarter was high at 80.6% implying some dependency on
other than deposits. Borrowings as a percentage of NDTL (net demand time liability)
increased to 15.6% from 13.7% in 3QFY13 but still at comfortable level (above of HDFC
bank and below of ICICI bank). Bank is able to maintain its cost of fund under control
basically from high base of CASA deposits.
Margin compression on sequential basis due to declined loan yield as compare to
cost of fund
Sequentially NIM was declined by 8 bps to 3.71% from 3.79% due to declined of loan
yield as compare to cost of fund. Loan yield was 10.5% versus 10.7% in previous quarter
whereas cost of fund remains stable at 6.3%. Deposits cost (EW Calculation) other than
borrowing increased marginally to 6.18% from 6.16% on sequential basis. We do not
see margin compression >10 bps in next couple of quarters because of low cost
deposits (CASA) support and increasing share of high yield retail advance.
Valuation & View
Narnolia Securities Ltd,

9
AXIS BANK
Source: Eastwind/Company
Please refer to the Disclaimers at the end of this Report.
Fundamenatl throught graph
NII growth led by healthy CD ratio and
margin expansion on YoY basis
Lower other income and higher CI ratio led
muted PPP growth
Profit growth was higher than expectation on
the back of lower provisions
Narnolia Securities Ltd,

10
Quarterly Result
AXIS BANK
Source: Eastwind/Company
Please refer to the Disclaimers at the end of this Report.
Narnolia Securities Ltd,
Quarterly Result 3QFY14 2QFY14 3QFY13 % YoY Gr % QoQ Gr 3QFY14E Variation
Interest/discount on advances / bills 5557 5394 4907 13.3 3.0 5748 3.4
Income on investments 2110 2143 2014 4.8 -1.5 2235 5.9
Interest on balances with Reserve Bank of India 49 35 25 97.7 39.4 35 -29.2
Others 73 37 19 277.1 95.6 38 -47.4
Total Interest Income 7789 7609 6965 11.8 2.4 8056 3.4
Others Income 1644 1766 1615 1.8 -6.9 1774 7.9
Total Income 4628 4703 4110 12.6 -1.6 4780 3.3
Interest Expended 4805 4672 4470 7.5 2.8 5049 5.1
NII 2984 2937 2495 19.6 1.6 3006 0.8
Other Income 1644 1766 1615 1.8 -6.9 1774 7.9
Total Income 4628 4703 4110 12.6 -1.6 4780 3.3
Employee 655 644 615 6.5 1.7 0
Other Expenses 1358 1309 1134 19.8 3.8 0
Operating Expenses 2013 1953 1749 15.1 3.1 2008 -0.3
PPP( Rs Cr) 2615 2750 2362 10.7 -4.9 2772 6.0
Provisions 202 687 387 -47.7 -70.5 752 271.4
PBT 2413 2062 1975 22.2 17.0 2020 -16.3
Tax 808 700 628 28.8 15.5 687 -15.0
Net Profit 1604 1362 1347 19.1 17.7 1333 -16.9
Balance Sheet Date
Net Worth 37649 36224 27027 39.3 3.9 37558 -0.2
Deposits 262398 255365 244501 7.3 2.8 272935 4.0
Loan 211467 201303 179504 17.8 5.0 214892 1.6
Asset qualtiy( Rs Cr)
GNPA 3008 2734 2275 32.2 10.0 -
NPA 1003 838 679 47.8 19.7 -
%GNPA 1.4 1.4 1.3 -
%NPA 0.5 0.4 0.4 -

11
AXIS BANK
FINANCIALS & ASSUPTION
Source: Eastwind/Company
Please refer to the Disclaimers at the end of this Report.
Narnolia Securities Ltd,
Income Statement 2011 2012 2013 2014E 2015EInterest Income 15155 21995 27183 31198 38490
Interest Expense 8589 13969 17516 18974 23716
NII 6566 8026 9666 12224 14775
Change (%) 31.2 22.2 20.4 26.5 20.9
Non Interest Income 4671 5487 6551 6922 6922
Total Income 11238 13513 16217 19146 21697
Change (%) 25.3 20.2 20.0 18.1 13.3
Operating Expenses 4860 6100 6914 7940 9330
Pre Provision Profits 6377 7413 9303 11206 12367
Change (%) 22.4 16.2 25.5 20.5 10.4
Provisions 3033 3189 4124 2402 2461
PBT 3345 4224 5179 8804 9906
PAT 3340 4224 5179 5826 6934
Change (%) 34.8 26.5 22.6 12.5 19.0
Balance SheetDeposits( Rs Cr) 189166 219988 252614 290506 334081
Change (%) 34 16 15 15 15
of which CASA Dep 77758 91412 112100 124917 143655
Change (%) 18 18 23 11 15
Borrowings( Rs Cr) 26268 34072 43951 51266 58956
Investments( Rs Cr) 71788 92921 113738 129873 149354
Loans( Rs Cr) 142408 169760 196966 228481 265037
Change (%) 36 19 16 16 16
Valuation
Book Value 460 549 708 813 942
CMP 1404 1146 1304 1174 1174
P/BV 3.1 2.1 1.8 1.4 1.2

59
65
62
10
5
1M 1yr YTD
Absolute 17.1 15.9 -15.1
Rel.to Nifty 14.2 11.0 -20.0
Current 4QFY13 3QFY1
3Promoters 18.5 18.5 18.5
FII 11.9 11.4 11.4
DII 15.0 14.1 12.5
Others 54.6 56.1 57.7
Financials Rs, Cr
2011 2012 2013 2014E 2015E
NII 189 228 284 369 364
Total Income 301 328 401 509 505
PPP 86 84 126 188 192
Net Profit 21 55 102 153 157
EPS 1.1 2.3 4.1 6.1 6.3
12
52wk Range H/L
Average Daily Volume
1475
Asset quality improved despite of tight macro environment
During this quarter, bank made total provision (includes loan loss, investment
depreciation, standard asset, restructure assets etc) of Rs.10 cr versus Rs.7 cr in
previous quarter and Rs.5 cr in last quarter. On sequential basis gross NPA
improved by 12% to 208 cr from Rs.235 cr. In percentage of gross advance GNPA
for the quarter improved to 2.8% from 3.5% in 2QFY14. Bank made lower loan loss
provision to the tune of Rs.151 cr versus Rs.178 cr in previous quarter. As the result
provision coverage ratio was declined from 76% to 72.6% sequentially. Net NPA in
absolute term stable with Rs.57 cr and improved to 0.8% from 0.9% of net advances
on quarter to quarter basis.
Registered healthy loan and deposits growth, balance sheet consolidated
DCB reported higher than expected loan growth of 23.4% YoY to Rs.7362 cr against
our expectation of Rs.7125 cr. Deposits grew by 27% YoY led by term deposits
growth of 34% YoY. CASA reported growth of 9% YoY but in percentage term, it
stood at 24.8% as against 28.9% in 3QFY13. Credit deposits ratio stable at
sequential basis at 76.7% versus 76% in previous quarter and 78.9% in 3QFY14.
Higher CD ratio during the last quarter was on account of higher dependence on
borrowing rather than deposits. Borrowing as a percentage of NDTL (net demand
time liability) reduced to 24.8% in 3QFY14 from 28.9% in 3QFY13. Declining share
of CASA ratio little disappointed us but bank was able to keep cost of fund under
control. We do not see larger impact on NIM due to declined of CASA.
Stock Performance
60.55/38.05
BSE Code 532772
NSE Symbol DCB
CMP
Target Price
DCB reported healthy profit growth with the support of robust NII along with
other income. We note that bank’s operating as well as financial metrics has
been improving continuously. Although on CASA front, we disappointed little
bit but continuous decreasing dependency on addition fund (borrowing as a
percentage of net demand time liability) would keep NIM at current level.
Improvement of asset quality along with comfortable PCR would provide
cushion to its earnings. We have revised our target price from Rs.61 to Rs.65
and recommend buy.
Mkt Capital (Rs Cr)
Please refer to the Disclaimers at the end of this Report.
(Source: Company/Eastwind)
Result Updated
Previous Target Price
Market Data
Upside
BUY
DCB
Change from Previous
DCB Vs Nifty
Share Holding Pattern-%
13.76 lakh
Nifty 6318
"BUY"17th Jan,2014
Narnolia Securities Ltd,

13
Cost to Income ratio was declined to 63.4% from 68.5% in 3QFY13 and 66.2% in
2QFY14 which surprise us positively. We assumed 66% of CI ratio for the quarter but
looking at bank’s strategy to keep operating leverage under control we tweak our
assumption to 63.2% for FY14. Employee cost and other operating cost increased by
12.7% and 20% YoY respectively. Healthy core earnings, higher other income and lower
CI ratio led operating profit growth of 46% YoY.
DCB
Source: Company/Eastwind
Please refer to the Disclaimers at the end of this Report.
Robust growth in NII on the back of healthy NII growth and supportive other
income
DCB in its quarter result reported revenue growth of 25.6% YoY to Rs.125 cr in line with
our expectation of Rs.127 cr. Growth in NII was come from sequentially improvement of
credit deposits ratio, margin expansion led by higher loan yield in compare to cost of
fund. During quarter bank reported NII growth of 30% YoY to Rs.94 against our
expectation of Rs.88 cr. Bank reported other income of Rs.328 cr versus Rs.289 cr in last
quarter in which commission income was 267 cr registered growth of 20% YoY. Bank has
been continuous strengthen its core earnings contribution to total earnings as the ratio of
other income to total income has been declining from 20% in 1QFY11 to 10% in 3QFY14.
Declining share of other income in total income
Cost to Income declined sequentially led operating profit growth of 46% YoY
Narnolia Securities Ltd,
Rs. Cr 1QFY11 2QFY11 3QFY11 4QFY11 1QFY12 2QFY12 3QFY12 4QFY12 1QFY13 2QFY13 3QFY13 4QFY13 1QFY14 2QFY14 3QFY14
Other Income(A) 30 27 26 29 23 23 26 28 28 28 29 33 45 27 33
Total Income(B) 150 155 166 177 185 202 210 221 241 247 258 286 306 296 324
%(A/B) 20 17 16 16 13 11 13 13 11 11 11 12 15 9 10

14
Valuation & View
Compression of NIM on account of higher cost of fund rather than growth of loan
yield
NIM declined 13 bps QoQ to 3.55% from 3.68% largely due to higher growth came in
cost of fund than yield on loan. Sequentially cost of fund increased to 7.86% against
7.56% whereas yield on loan increased to 12.96% from 12.73%. Higher cost fund was
account of declining share of low cost CASA franchise in total deposits.
DCB reported healthy profit growth with the support of robust NII along with other income.
We note that bank’s operating as well as financial metrics has been improving
continuously. Although on CASA front, we disappointed little bit but continuous
decreasing dependency on addition fund (borrowing as a percentage of net demand time
liability) would keep NIM at current level. Improvement of asset quality along with
comfortable PCR would provide cushion to its earnings. We have revised our target price
from Rs.61 to Rs.65 and rate buy from neutral.
DCB
Source: Eastwind/ Company
Please refer to the Disclaimers at the end of this Report.
Higher profit growth led by healthy revenue growth, sequential improvement of CI
ratio and improvement in asset quality
With the support of healthy core income, higher other income, sequentially improvement
of CI ratio and improving asset quality led net profit growth of 35% YoY to Rs.36 cr as
against our expectation of Rs.34. In our earlier note dated 13th Dec.2014 (Private sector
banking result preview), we highlighted that DCB, HDFC bank and ICICI bank would
report better result.
Narnolia Securities Ltd,
15
DCB
Source: Eastwind/ Company
Please refer to the Disclaimers at the end of this Report.
Narnolia Securities Ltd,
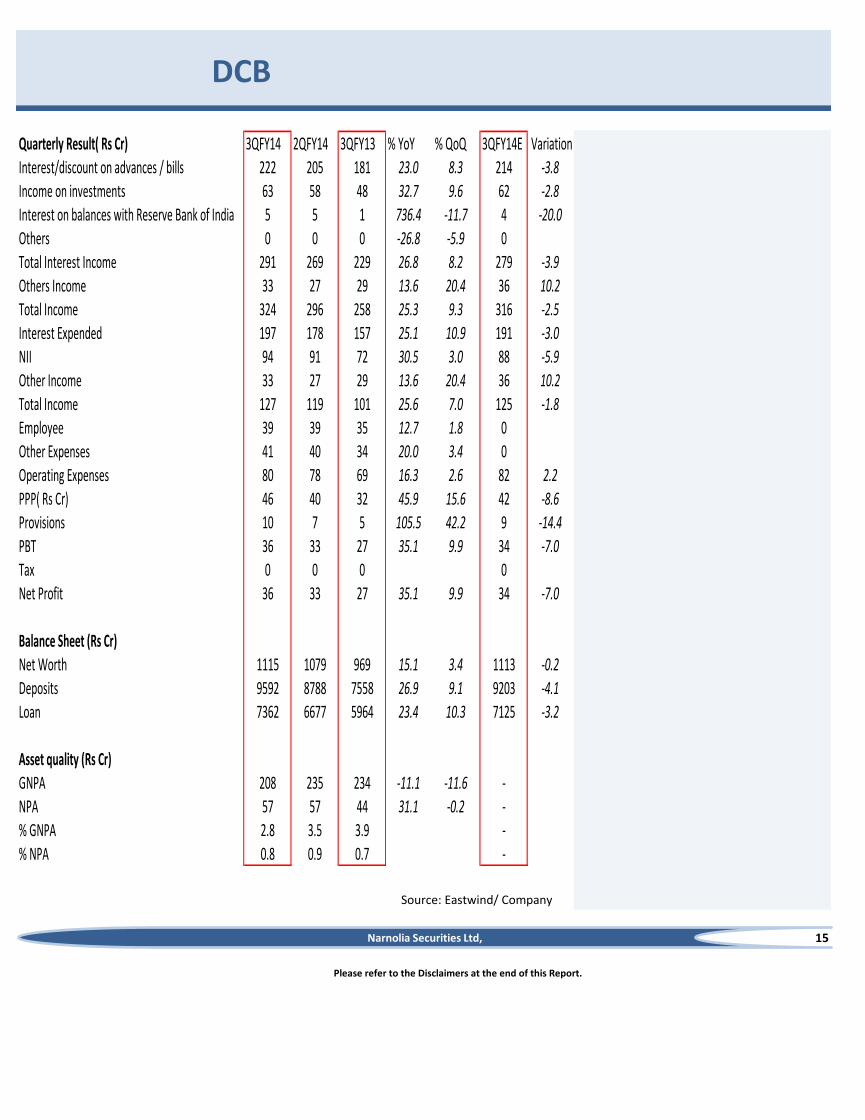
Quarterly Result( Rs Cr) 3QFY14 2QFY14 3QFY13 % YoY % QoQ 3QFY14E Variation
Interest/discount on advances / bills 222 205 181 23.0 8.3 214 -3.8
Income on investments 63 58 48 32.7 9.6 62 -2.8
Interest on balances with Reserve Bank of India 5 5 1 736.4 -11.7 4 -20.0
Others 0 0 0 -26.8 -5.9 0
Total Interest Income 291 269 229 26.8 8.2 279 -3.9
Others Income 33 27 29 13.6 20.4 36 10.2
Total Income 324 296 258 25.3 9.3 316 -2.5
Interest Expended 197 178 157 25.1 10.9 191 -3.0
NII 94 91 72 30.5 3.0 88 -5.9
Other Income 33 27 29 13.6 20.4 36 10.2
Total Income 127 119 101 25.6 7.0 125 -1.8
Employee 39 39 35 12.7 1.8 0
Other Expenses 41 40 34 20.0 3.4 0
Operating Expenses 80 78 69 16.3 2.6 82 2.2
PPP( Rs Cr) 46 40 32 45.9 15.6 42 -8.6
Provisions 10 7 5 105.5 42.2 9 -14.4
PBT 36 33 27 35.1 9.9 34 -7.0
Tax 0 0 0 0
Net Profit 36 33 27 35.1 9.9 34 -7.0
Balance Sheet (Rs Cr)
Net Worth 1115 1079 969 15.1 3.4 1113 -0.2
Deposits 9592 8788 7558 26.9 9.1 9203 -4.1
Loan 7362 6677 5964 23.4 10.3 7125 -3.2
Asset quality (Rs Cr)
GNPA 208 235 234 -11.1 -11.6 -
NPA 57 57 44 31.1 -0.2 -
% GNPA 2.8 3.5 3.9 -
% NPA 0.8 0.9 0.7 -

16
DCB
Source: Eastwind/ Company
Please refer to the Disclaimers at the end of this Report.
Narnolia Securities Ltd,
Income Statement 2010 2011 2012 2013 2014E 2015EInterest Income 459 536 717 916 1121 1241
Interest Expense 317 347 489 632 753 1088
NII 142 189 228 284 369 153
Change (%) -28.2 33.6 20.4 24.9 29.6 -58.5
Non Interest Income 107 112 100 117 140 140
Total Income 249 301 328 401 509 293
Change (%) -21.6 21.2 8.9 22.4 26.8 -42.4
Operating Expenses 201 215 244 275 322 182
Pre Provision Profits 48 86 84 126 188 111
Change (%) -36.5 79.9 -2.6 50.5 48.7 -40.5
Provisions 121 57 29 24 35 0
PBT -73 29 55 102 153 111
PAT -79 21 55 102 153 111
Change (%) -10.1 -127.2 157.1 85.3 49.7 -27.0
Balance SheetDeposits( Rs Cr) 4787 5610 6336 8364 9618 11061
Change (%) 3 17 13 32 15 15
of which CASA Dep 1693 1975 2035 2272 2710 1904
Change (%) 17 17 3 12 19 -30
Borrowings( Rs Cr) 504 861 1123 1526 814 1282
Investments( Rs Cr) 2018 2295 2518 3359 3689 3270
Loans( Rs Cr) 3460 4271 5284 6586 7640 9168
Change (%) 6 23 24 25 16 20
RatioAvg. Yield on loans 10.4 9.4 10.1 10.8 9.7 9.7
Avg. Yield on Investments 4.7 5.8 6.9 5.8 6.8 6.8
Avg. Cost of Deposit 5.9 5.2 6.4 6.4 5.9 5.9
Avg. Cost of Borrowimgs 6.8 6.4 7.2 6.4 6.0 6.0
Valuation
Book Value 30 31 36 40 46 51
CMP 32.2 45.9 45 45 57 57
P/BV 1.1 1.5 1.3 1.1 1.2 1.1

NIIT Tech
1M 1yr YTD
Absolute 12.7 36.3 43.3
Rel. to Nifty 10.2 31.4 38.5
Current 2QFY14 1QFY14
Promoters 31.08 31.19 31.23
FII 32.35 29.21 29.04
DII 17.34 19.94 19.67
Others 19.23 19.66 20.06
Financials3QFY14 2QFY14 (QoQ)-% 3QFY13 (YoY)-%
Revenue 587.3 587.3 0.0 500.1 17.4
EBITDA 95.1 88.6 7.3 81.3 17.0
PAT 52.5 60.4 (13.1) 56.6 -7.2
EBITDA Margin 16.2% 15.1% 110bps 16.3% (10bps)
PAT Margin 8.9% 10.3% (120bps) 11.3% (140bps)
17
"Focused on growth story"
CMP 376
Target Price 440
Below than street expectations, but confident on future growth; Result update Buy
For 3QFY14, NIITTECH reported marginally below numbers than street estimates, sales
was unchanged at Rs587.3cr because of reduced purchase for resale (PFR) in domestic
Government business while revenues from services grew 4.3% sequentially. During the
quarter, company has been able to maintain healthy order book and eyeing on strong
order pipeline.
1 year forward P/E
Rs, Crore
(Source: Company/Eastwind)
Please refer to the Disclaimers at the end of this Report.
View and Valuation: We expect good growth from Travel & Tourism vertical in FY'14
and the BFSI expected to be softer. However, the MFG and Govt verticals expected to
improve going forward. Company’s Order wins in the recent quarters have been healthy,
lending visibility on revenue growth. At a CMP of Rs 376, trades at 6.9x FY15E earnings.
We retain “ buy” view on the stock with a price target of Rs 440 (revised from Rs360).
Healthy order addition: During the quarter, the company secured a USD 300 million
vendor consolidation deal from a top BFSI client for a period of 10 years. It has secured
fresh order of USD 377mn versus USD 84mn in 2QFY14. However, in 3Q FY14, order has
primarily been in the international market. During the quarter, NIIT Tech forayed into
Latin America through its partnership with GRU Aeroporto Internacional de São Paulo
(Sao Paolo International Airport), to implement and transform the cargo handling
system at the airport.
Average Daily Volume 20884
Previous Target Price 360
Upside 17%
Change from Previous 22%
Market DataBSE Code 532541
NSE Symbol NIITTECH
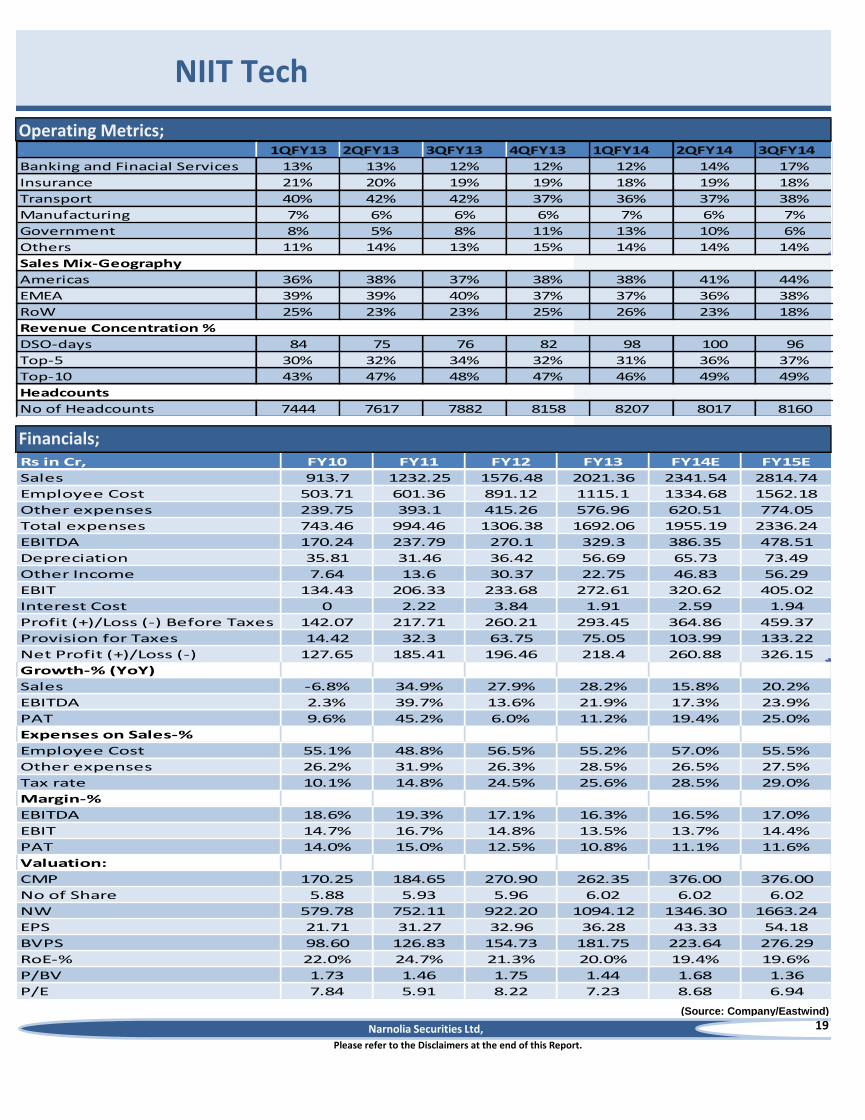
Slow deal execution in Government and Insurance projects: Among industry segments,
Travel and Transportation contributed to 37% (up by 3%, QoQ), BFS was 17% (up by
21%, QoQ), Government projects declined from 10% to 6% (down by 40%, QoQ) to the
revenue mix.
Steady margin: EBITDA Margin improved by 120bps (QoQ) to 16.2% on the back of
reduction Employee cost by 3.5%, sequentially.
PAT declined by 12%(QoQ) impacted by a loss in other income as a result of revaluation
of foreign currency assets and liabilities due to period end exchange difference.
Post earning, management is gearing up for its paradigm shift in growth strategy for the
future and set an aspirational target to grow revenues to USD 1 bn in the next 5yrs. They
stated that, margins will start seeing improvement from Q4FY14, led by the
improvement in the margin from the Geographic Information Systems (GIS) business
and the Morris joint venture.
Stock Performance
52wk Range H/L 399/234
Share Holding Pattern-%
Healthy growth traction from US and Europe: The contribution to the total revenues
from the U.S. increased to 44% from 41% (up 7%,QoQ) and EMEA stood at 38% from
36%( up 6%, QoQ). The revenue share from rest of the world declined from 23% to 18%
(down 22% QoQ). Post result management stated that the demand environment is
clearly showing positive signs in the US with the debt issue being the only overhang.
Mkt Capital (Rs Crores)
Nifty 6321
2281
"BUY"16th Jan' 14
Narnolia Securities Ltd,

18
The 3QFY14 witnessed sustained hiring
and attrition improved from 12.44% to
13.40% on LTM basis. Managent is very
confident to maintain attrition at 12-13%
and utilization at 77-80%.
It expects the growth momentum will
sustain with holding the margins going
forward.
Clients Metrics
(Source: Company/Eastwind)
Please refer to the Disclaimers at the end of this Report.
Higher DSO: The DSO days were 98 (2QFY14 – 100) during the quarter.In general, the DSO
days are typically used to be at 80 days.
NIIT Tech
Sales and PAT growth-%(QoQ)
Employee Metrics: Total headcount increased from 8017 from 8,160 at the end of the
quarter. Utilzation declined to 78.4% from 80.3%(2QFY14) because of weak quarter and
still, company is good to maintain attrition at a mark of 12-13%, which is better than its
peers.
Clients Metrics: During the quarter, Company added 4 new clients, each in BFSI, travel
and transportation, manufacturing, and government segment.
Margin-%
(Source: Company/Eastwind)
(Source: Company/Eastwind)
Company expects FY14 to be better
than FY13 with respect to both revenue
growth and EBIT margin. And also
expects stronger growth in the US and
Asian markets compared with Europe.
Management also expects to see
demand environmrnt ahead.
Narnolia Securities Ltd,
19
NIIT Tech
Operating Metrics;
Please refer to the Disclaimers at the end of this Report.
(Source: Company/Eastwind)
Financials;
Narnolia Securities Ltd,
. 1QFY13 2QFY13 3QFY13 4QFY13 1QFY14 2QFY14 3QFY14
Banking and Finacial Services 13% 13% 12% 12% 12% 14% 17%
Insurance 21% 20% 19% 19% 18% 19% 18%
Transport 40% 42% 42% 37% 36% 37% 38%
Manufacturing 7% 6% 6% 6% 7% 6% 7%
Government 8% 5% 8% 11% 13% 10% 6%
Others 11% 14% 13% 15% 14% 14% 14%
Americas 36% 38% 37% 38% 38% 41% 44%
EMEA 39% 39% 40% 37% 37% 36% 38%
RoW 25% 23% 23% 25% 26% 23% 18%
DSO-days 84 75 76 82 98 100 96
Top-5 30% 32% 34% 32% 31% 36% 37%
Top-10 43% 47% 48% 47% 46% 49% 49%
No of Headcounts 7444 7617 7882 8158 8207 8017 8160
Sales Mix-Geography
Revenue Concentration %
Headcounts
Rs in Cr, FY10 FY11 FY12 FY13 FY14E FY15E
Sales 913.7 1232.25 1576.48 2021.36 2341.54 2814.74
Employee Cost 503.71 601.36 891.12 1115.1 1334.68 1562.18
Other expenses 239.75 393.1 415.26 576.96 620.51 774.05
Total expenses 743.46 994.46 1306.38 1692.06 1955.19 2336.24
EBITDA 170.24 237.79 270.1 329.3 386.35 478.51
Depreciation 35.81 31.46 36.42 56.69 65.73 73.49
Other Income 7.64 13.6 30.37 22.75 46.83 56.29
EBIT 134.43 206.33 233.68 272.61 320.62 405.02
Interest Cost 0 2.22 3.84 1.91 2.59 1.94
Profit (+)/Loss (-) Before Taxes 142.07 217.71 260.21 293.45 364.86 459.37
Provision for Taxes 14.42 32.3 63.75 75.05 103.99 133.22
Net Profit (+)/Loss (-) 127.65 185.41 196.46 218.4 260.88 326.15
Growth-% (YoY)
Sales -6.8% 34.9% 27.9% 28.2% 15.8% 20.2%
EBITDA 2.3% 39.7% 13.6% 21.9% 17.3% 23.9%
PAT 9.6% 45.2% 6.0% 11.2% 19.4% 25.0%
Expenses on Sales-%
Employee Cost 55.1% 48.8% 56.5% 55.2% 57.0% 55.5%
Other expenses 26.2% 31.9% 26.3% 28.5% 26.5% 27.5%
Tax rate 10.1% 14.8% 24.5% 25.6% 28.5% 29.0%
Margin-%
EBITDA 18.6% 19.3% 17.1% 16.3% 16.5% 17.0%
EBIT 14.7% 16.7% 14.8% 13.5% 13.7% 14.4%
PAT 14.0% 15.0% 12.5% 10.8% 11.1% 11.6%
Valuation:
CMP 170.25 184.65 270.90 262.35 376.00 376.00
No of Share 5.88 5.93 5.96 6.02 6.02 6.02
NW 579.78 752.11 922.20 1094.12 1346.30 1663.24
EPS 21.71 31.27 32.96 36.28 43.33 54.18
BVPS 98.60 126.83 154.73 181.75 223.64 276.29
RoE-% 22.0% 24.7% 21.3% 20.0% 19.4% 19.6%
P/BV 1.73 1.46 1.75 1.44 1.68 1.36
P/E 7.84 5.91 8.22 7.23 8.68 6.94

353
388
443
10
14
1M 1yr YTD
Absolute -2.7 -29.2 -29.2
Rel.to Nifty -5.4 -35.4 -35.4
Current 4QFY13 3QFY1
3Promoters 25.6 25.6 25.7
FII 35.1 46.0 49.0
DII 19.4 15.7 13.2
Others 20.0 12.7 12.1
Financials Rs, Cr
2011 2012 2013 2014E 2015E
NII 1247 1616 2219 2440 2374
Total Income 1870 2473 3476 4217 4150
PPP 1190 1540 2142 2328 2614
Net Profit 727 977 1301 1778 1098
EPS 20.9 27.7 36.3 49.4 35.6
20
547/216
BSE Code 532648
NSE Symbol
YES BANK
Yes bank reported better than expected profit largely due to lower provision
despite of reported higher delinquencies. This has resulted of lower provision
coverage ratio but still it is above of regulatory requirement. Incremental
deposits (other than CASA) were remained muted whereas advance reported
handsomely. Bank would face liquidity problem or would have to dependent
on additional borrowings to maintain its growth trajectory. This would result of
higher cost of fund and margin compression in our view. Leverage ratio (total
asset to net worth) has been declining from past four quarters indicated no
surplus liquidity in balance sheet. In the absence of comfortable earnings we
remain have neutral view. Also, we reduce our target price from Rs.443 to
Rs.388.YESBANK
Result update Neutral
CMP
Target Price
Previous Target Price
Upside
52wk Range H/L
Change from Previous
1 Yr P/BV
Share Holding Pattern-%
18.04
Nifty 6320
On sequential basis NIM of bank remained flat at 2.9% but declined 10 bps on YoY
basis. Lending yield declined sharply to 13.3% from 13.6% due to increased share of
low yield Corporate and Institutional banking. Cost of deposits increased to 10.9%
from 10.8% on QoQ basis. Despite of lower lending yield and higher cost of fund,
margin stable on sequential basis was probably due to lower earnings asset growth
as we get evidence from negative growth of balance sheet on QoQ basis.
Cost to Income ratio was highest ever to 41.6% because of bank’s strategy to
increase market share of CASA. During quarter bank hire 647 employee and opened
17branches and 36 ATMs. As the result employee cost and operating cost were
increased by 20% and 42% respectively. Due to higher operating cost, pre
provisioning profit increased by 9% YoY despite of healthy NII and other income.
Operating leverage increased to 0.41% from 0.39% in 3QFY14. We expect this ratio
to remain high because of bank would continue to increase its CASA franchise base
by opening new branches and hiring.
Average Daily Volume
12729
Market Data
Mkt Capital (Rs Cr)
Please refer to the Disclaimers at the end of this Report.
(Source: Company/Eastwind)
Stock Performance
NII growth of 14% YoY led by advance growth and stable cost of fund
Bank’s NII grew by 14% YoY to Rs.665 cr largely due to stable margin and other
income. In 3QFY14, bank reported other income of Rs.388 cr up by 24% YoY
whereas margin was stable at 2.9% declined mere by 10 bps YoY. Credit deposits
ratio was improved by 330 bps QOQ but was declined by 400 bps YoY due to lower
deposits base. We observed that bank’s cost of deposits (Calculated) remain at
elevated level despite of relatively have higher CASA base whereas yield on loan
improved handsomely to 13.3% from 12.7% in 3QFY13.
Muted PPP growth due to higher CI ratio
Stable margin on sequential basis despite of lower lending yield and marginal
increased of cost of fund
"NEUTRAL"16th Jan, 2014
Narnolia Securities Ltd,

21
YES BANK
Please refer to the Disclaimers at the end of this Report.
Deposits growth moderate sequentially but advance reported handsome growth
On balance sheet front, bank’s advance grew by 14.7% YoY led by retail banking growth
followed by corporate and institutional banking. Retail loan registered growth of 47% YoY
whereas corporate banking reported 18% YoY growth. Deposits grew by 20.7% YoY led
by CASA deposits growth of 38% YoY followed by term deposits (17% YoY). We
observed that bank’s incremental deposits (other than CASA) were remained muted at
Rs.24 cr as against Rs.1708 cr in second quarter. Bank would have to depend on
additional borrowings to maintain its growth trajectory if the present trend continued which
would be the result of higher cost of fund and margin compression. Sequentially credit
deposits ratio was higher at 73.9% from 70.6% on account of lower deposits base
especially of term deposits.
Valuation & View
Yes bank reported better than expected profit largely due to lower provision despite of
reported higher delinquencies. This has resulted of lower provision coverage but it is still
above of regulatory requirement. Incremental deposits (other than CASA) were remained
muted whereas advance increased handsomely. Bank would face liquidity problem or
would have to dependent on additional borrowings to maintain its growth trajectory. This
would result of higher cost of fund and margin compression in our view. Leverage ratio
(total asset to net worth) has been declining from past four quarters indicated no surplus
liquidity in balance sheet. In the absence of comfortable earnings we reduce our target
price to Rs.388 from Rs.443.
Valuation Band ( 1 yr forward P/BV)
Narnolia Securities Ltd,

22
YES BANK
Source: Eastwind/Company
Please refer to the Disclaimers at the end of this Report.
Quarterly Result
Narnolia Securities Ltd,
Quarterly Result 3QFY14E 2QFY14 3QFY13 %YoY Gr %QoQ Gr
Interest/discount on advances / bills 1666 1618 1394 19.5 3.0
Income on investments 840 875 726 15.8 -4.0
Interest on balances with Reserve Bank of India 8 8 4 82.6 -7.5
Others 0 0 10 -96.4 20.0
Total Interest Income 2514 2501 2134 17.8 0.5
Others Income 388 446 313 23.8 -13.1
Total Income 2902 2947 2447 18.6 -1.5
Interest Expended 1849 1829 1549 19.3 1.1
NII 665 672 584 13.9 -1.0
Other Income 388 446 313 23.8 -13.1
Total Income 1053 1118 898 17.4 -5.8
Employee 194 185 162 19.8 4.7
Other Expenses 245 220 172 42.1 11.2
Operating Expenses 439 405 334 31.3 8.2
PPP( Rs Cr) 615 713 563 9.1 -13.8
Provisions 13 179 57 -76.6 -92.6
PBT 601 534 507 18.7 12.7
Tax 186 163 164 13.0 14.2
Net Profit 416 371 342 21.4 12.0
Balance Sheet Data
Advances 50,293 47717 43,857 14.7 5.4
Shareholders’ Funds 6,610 6610 5,679 16.4 0.0
Deposits 68,060 67575 56,401 20.7 0.7
Asset Quality
GNPA 195.8 132.1 76.2 157.0 48.3
NPA 42.3 19.36 15.6 171.2 118.5
% GNPA 0.39 0.28 0.17
% NPA 0.08 0.04 0.04
PCR(%) 78.4 85.3 79.5
23
YES BANK
Souce: Eastwind/Company
Please refer to the Disclaimers at the end of this Report.
Financials & Assuption
Narnolia Securities Ltd,
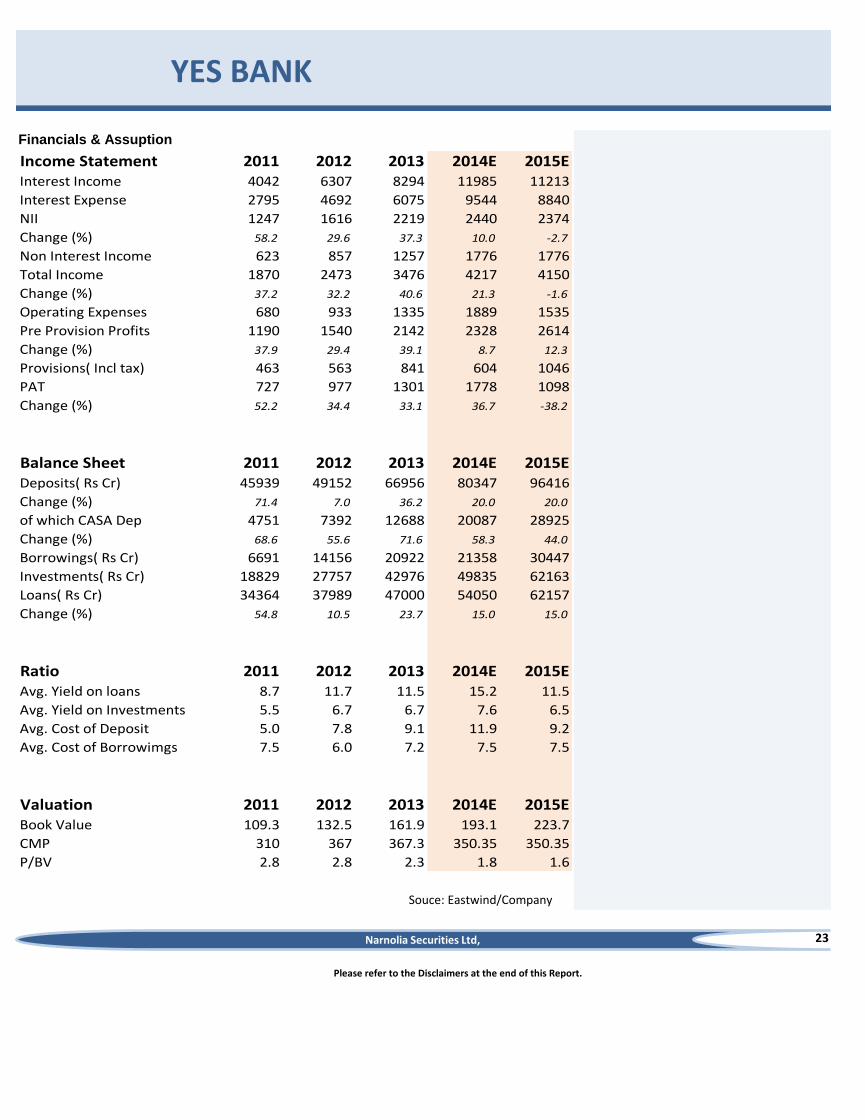
Income Statement 2011 2012 2013 2014E 2015EInterest Income 4042 6307 8294 11985 11213
Interest Expense 2795 4692 6075 9544 8840
NII 1247 1616 2219 2440 2374
Change (%) 58.2 29.6 37.3 10.0 -2.7
Non Interest Income 623 857 1257 1776 1776
Total Income 1870 2473 3476 4217 4150
Change (%) 37.2 32.2 40.6 21.3 -1.6
Operating Expenses 680 933 1335 1889 1535
Pre Provision Profits 1190 1540 2142 2328 2614
Change (%) 37.9 29.4 39.1 8.7 12.3
Provisions( Incl tax) 463 563 841 604 1046
PAT 727 977 1301 1778 1098
Change (%) 52.2 34.4 33.1 36.7 -38.2
Balance Sheet 2011 2012 2013 2014E 2015EDeposits( Rs Cr) 45939 49152 66956 80347 96416
Change (%) 71.4 7.0 36.2 20.0 20.0
of which CASA Dep 4751 7392 12688 20087 28925
Change (%) 68.6 55.6 71.6 58.3 44.0
Borrowings( Rs Cr) 6691 14156 20922 21358 30447
Investments( Rs Cr) 18829 27757 42976 49835 62163
Loans( Rs Cr) 34364 37989 47000 54050 62157
Change (%) 54.8 10.5 23.7 15.0 15.0
Ratio 2011 2012 2013 2014E 2015EAvg. Yield on loans 8.7 11.7 11.5 15.2 11.5
Avg. Yield on Investments 5.5 6.7 6.7 7.6 6.5
Avg. Cost of Deposit 5.0 7.8 9.1 11.9 9.2
Avg. Cost of Borrowimgs 7.5 6.0 7.2 7.5 7.5
Valuation 2011 2012 2013 2014E 2015EBook Value 109.3 132.5 161.9 193.1 223.7
CMP 310 367 367.3 350.35 350.35
P/BV 2.8 2.8 2.3 1.8 1.6
CMC
1M 1yr YTD
Absolute 17.12 15.4 27.37
Rel. to Nifty 15.93 10.52 22
Current 1QFY14 4QFY13
Promoters 51.12 51.12 51.12
FII 22.63 23.32 21.84
DII 18.26 17.83 19.05
Others 7.99 7.73 7.99
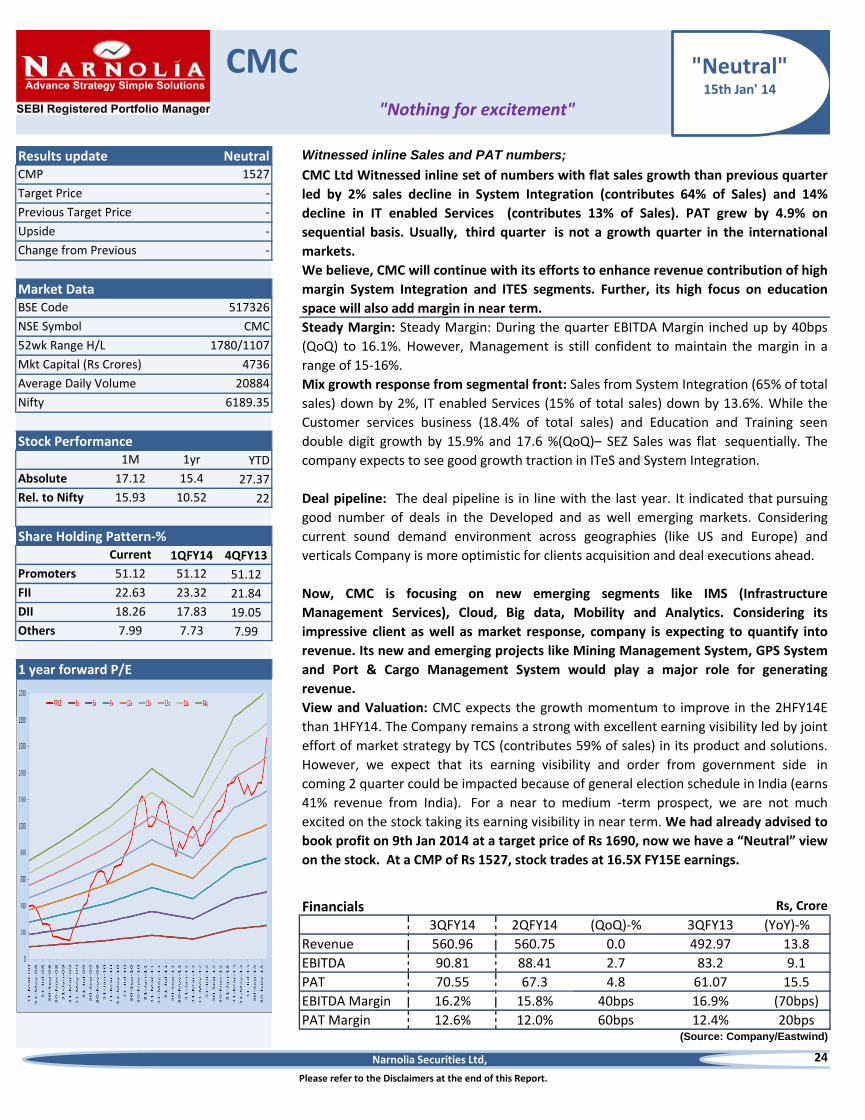
Financials3QFY14 2QFY14 (QoQ)-% 3QFY13 (YoY)-%
Revenue 560.96 560.75 0.0 492.97 13.8
EBITDA 90.81 88.41 2.7 83.2 9.1
PAT 70.55 67.3 4.8 61.07 15.5
EBITDA Margin 16.2% 15.8% 40bps 16.9% (70bps)
PAT Margin 12.6% 12.0% 60bps 12.4% 20bps
24
Steady Margin: Steady Margin: During the quarter EBITDA Margin inched up by 40bps
(QoQ) to 16.1%. However, Management is still confident to maintain the margin in a
range of 15-16%.
Mix growth response from segmental front: Sales from System Integration (65% of total
sales) down by 2%, IT enabled Services (15% of total sales) down by 13.6%. While the
Customer services business (18.4% of total sales) and Education and Training seen
double digit growth by 15.9% and 17.6 %(QoQ)– SEZ Sales was flat sequentially. The
company expects to see good growth traction in ITeS and System Integration.
BSE Code 517326
NSE Symbol CMC
Average Daily Volume 20884
4736Mkt Capital (Rs Crores)
Nifty 6189.35
52wk Range H/L 1780/1107
1 year forward P/E
Rs, Crore
(Source: Company/Eastwind)
Please refer to the Disclaimers at the end of this Report.
Share Holding Pattern-%
Deal pipeline: The deal pipeline is in line with the last year. It indicated that pursuing
good number of deals in the Developed and as well emerging markets. Considering
current sound demand environment across geographies (like US and Europe) and
verticals Company is more optimistic for clients acquisition and deal executions ahead.
Now, CMC is focusing on new emerging segments like IMS (Infrastructure
Management Services), Cloud, Big data, Mobility and Analytics. Considering its
impressive client as well as market response, company is expecting to quantify into
revenue. Its new and emerging projects like Mining Management System, GPS System
and Port & Cargo Management System would play a major role for generating
revenue.
View and Valuation: CMC expects the growth momentum to improve in the 2HFY14E
than 1HFY14. The Company remains a strong with excellent earning visibility led by joint
effort of market strategy by TCS (contributes 59% of sales) in its product and solutions.
However, we expect that its earning visibility and order from government side in
coming 2 quarter could be impacted because of general election schedule in India (earns
41% revenue from India). For a near to medium -term prospect, we are not much
excited on the stock taking its earning visibility in near term. We had already advised to
book profit on 9th Jan 2014 at a target price of Rs 1690, now we have a “Neutral” view
on the stock. At a CMP of Rs 1527, stock trades at 16.5X FY15E earnings.
We believe, CMC will continue with its efforts to enhance revenue contribution of high
margin System Integration and ITES segments. Further, its high focus on education
space will also add margin in near term.
Market Data
Stock Performance
"Nothing for excitement"
CMP 1527
Target Price -
Witnessed inline Sales and PAT numbers;Results update Neutral
CMC Ltd Witnessed inline set of numbers with flat sales growth than previous quarter
led by 2% sales decline in System Integration (contributes 64% of Sales) and 14%
decline in IT enabled Services (contributes 13% of Sales). PAT grew by 4.9% on
sequential basis. Usually, third quarter is not a growth quarter in the international
markets.
Previous Target Price -
Upside -
Change from Previous -
"Neutral"15th Jan' 14
Narnolia Securities Ltd,

25
Clients Metrics: The Company added 14 clients during the quarter out of which 10 from
India and the 4 from the USA. In FY13, the company added 80 clients. During the quarter,
its DSO increased from 79days to 83days.
Please refer to the Disclaimers at the end of this Report.
Employee Metrics: The total headcount for the quarter stood at 10,890 employees out of
which 4,555were on company payrolls while the remaining 6,235 were subcontractors.
CMC
Sales and Sales growth-%(QoQ)
Margin-%
(Source: Company/Eastwind)
(Source: Company/Eastwind)
Second half of FY14 will be better than
the first half. And expects to sees
opportunities in the international
markets in FY15E
Despite salary hike during the quarter,
company's employee cost on sales
increased from 25.1% (2QFY14) to
25.6%.
The management expects operating
Profit margin between 15 percent and
16 percent .
Clients Metrics
(Source: Company/Eastwind)
Narnolia Securities Ltd,

26
Please refer to the Disclaimers at the end of this Report.
(Source: Company/Eastwind)
Financials;
CMC
Key facts from Concall (attended on 16th Oct, 2013)►CMC continues to target growth ahead of the overall IT industry; the company expects
to grow faster than that in the current financial year
►Expects operating Profit margin at 16 percent for FY14E,
►The company expects to maintatin its tax regime at 20-20.5% for coming quarter. For
next year tax rate could be stand at a range of 20-21%.
►Company’s hiring Plan; a net addition of 400-500 this year
► Notably, it targets revenues of Rs 250-300 crore from Education and Training business
in next two 3-4 years timeline.
Narnolia Securities Ltd,
Rs, Cr FY10 FY11 FY12 FY13 FY14E FY15E
Net Sales 870.73 1084.40 1469.34 1927.87 2155.00 2415.28
Purchases of stock-in-trade 99.35 99.28 145.40 188.56 193.95 217.37
Employee Cost 276.16 345.13 440.22 521.65 560.30 640.05
Subcontracting and outsourcing cost 173.56 262.35 446.11 679.73 818.90 917.81
Other expenses 159.94 170.17 213.63 222.88 215.50 253.60
Total Expenses 709.01 876.93 1245.36 1612.82 1788.65 2028.83
EBITDA 161.72 207.47 223.98 315.05 366.35 386.44
Depreciation 9.85 10.46 21.37 23.20 25.73 37.23
Other Income 18.75 11.80 17.46 13.17 21.55 24.15
EBIT 151.87 197.01 202.61 291.85 340.62 349.21
Interest Cost 3.17 0.22 0.02 0.18 0.1 0.25
PBT 167.45 208.59 220.05 304.84 362.07 373.11
Tax 24.23 32.42 68.59 76.76 101.38 93.28
PAT 143.22 176.17 151.46 228.08 260.69 279.84
Growth-%
Sales -7.4% 24.5% 35.5% 31.2% 11.8% 12.1%
EBITDA 27.7% 28.3% 8.0% 40.7% 16.3% 5.5%
PAT 23.3% 23.0% -14.0% 50.6% 14.3% 7.3%
Margin -%
EBITDA 18.6% 19.1% 15.2% 16.3% 17.0% 16.0%
EBIT 17.4% 18.2% 13.8% 15.1% 15.8% 14.5%
PAT 16.4% 16.2% 10.3% 11.8% 12.1% 11.6%
Expenses on Sales-%
Employee Cost 31.7% 31.8% 30.0% 27.1% 26.0% 26.5%
Subcontracting Cost 19.9% 24.2% 30.4% 35.3% 38.0% 38.0%
Tax rate 14.5% 15.5% 31.2% 25.2% 28.0% 25.0%
Valuation
CMP 1340.00 2079.55 994.80 1410.00 1527 1527
No of Share 1.50 1.50 3.00 3.03 3.03 3.03
NW 510.68 654.02 772.19 946.26 1145.07 1354.19
EPS 95.48 117.45 50.49 75.27 86.04 92.35
BVPS 340.45 436.01 257.40 312.30 377.91 446.93
RoE-% 28.0% 26.9% 19.6% 24.1% 22.8% 20.7%
Dividen Payout ratio 18.6% 19.9% 23.2% 19.4% 23.7% 25.3%
P/BV 3.94 4.77 3.86 4.51 4.04 3.42
P/E 14.03 17.71 19.70 18.73 17.75 16.53

Narnolia Securities Ltd402, 4th floor 7/ 1, Lords Sinha Road Kolkata 700071, Ph
033-32011233 Toll Free no : 1-800-345-4000
email: [email protected],
website : www.narnolia.com
Risk Disclosure & Disclaimer: This report/message is for the personal information of
the authorized recipient and does not construe to be any investment, legal or taxation
advice to you. Narnolia Securities Ltd. (Hereinafter referred as NSL) is not soliciting any
action based upon it. This report/message is not for public distribution and has been
furnished to you solely for your information and should not be reproduced or
redistributed to any other person in any from. The report/message is based upon publicly
available information, findings of our research wing “East wind” & information that we
consider reliable, but we do not represent that it is accurate or complete and we do not
provide any express or implied warranty of any kind, and also these are subject to change
without notice. The recipients of this report should rely on their own investigations,
should use their own judgment for taking any investment decisions keeping in mind that
past performance is not necessarily a guide to future performance & that the the value of
any investment or income are subject to market and other risks. Further it will be safe to
assume that NSL and /or its Group or associate Companies, their Directors, affiliates
and/or employees may have interests/ positions, financial or otherwise, individually or
otherwise in the recommended/mentioned securities/mutual funds/ model funds and
other investment products which may be added or disposed including & other mentioned
in this report/message.