
Stock Code: BSE NSE ABIRLANUVO Reuters Bloomberg · International Monetary Fund raised India‟s...
40
Stock Code: BSE : 500303 NSE : ABIRLANUVO Reuters : ABRL.BO / ABRL.NS / IRYN.LU Bloomberg : ABNL IN / NABNL IN / IRIG LX
Transcript of Stock Code: BSE NSE ABIRLANUVO Reuters Bloomberg · International Monetary Fund raised India‟s...

Stock Code: BSE : 500303 NSE : ABIRLANUVO Reuters : ABRL.BO / ABRL.NS / IRYN.LU Bloomberg : ABNL IN / NABNL IN / IRIG LX

22
Key Highlights 3 – 12
Financial Performance 13 – 17
Annexure 18 – 40
Contents
Note : The financial figures in this presentation have been rounded off to the nearest ` one Crore.

33
India Inc.
International Monetary Fund raised India‟s GDP growth forecast for 2010 to 9.4%
Key economic indicators continues to signify positive outlook:
The Index of Industrial Production (IIP) grew by 17.6%* (y-o-y) in Apr‟10 compared to 10.4% in FY10
FII investments in H1-CY2010 aggregated to ~ USD 13 billion
Government of India garnered ~ USD 24 billion from 3G and BWA spectrum auctions
Inflation, normal monsoon, rise in interest rates & global economic cues will be key factors going forward
Indian Rupee (`) gets a distinct identity reflecting strength and global face of the Indian Economy
Growth of Indian Economy continues to be driven by four key factors:
(a) Savings, (b) Consumption, (c) Infrastructure Development & (d) Exports
Aditya Birla Nuvo : A large ecosystem with leadership position across its businesses
With a strong presence in the Financial Services, Telecom, IT-ITeS, Fashion & Lifestyle and Manufacturing
sectors, Aditya Birla Nuvo is uniquely positioned to capitalise on growth opportunities present across the wide
spectrum of Indian Economy
Momentum continues with a positive outlook
*Quick estimate; Source : Ministry of Statistics and Programme Implementation
44
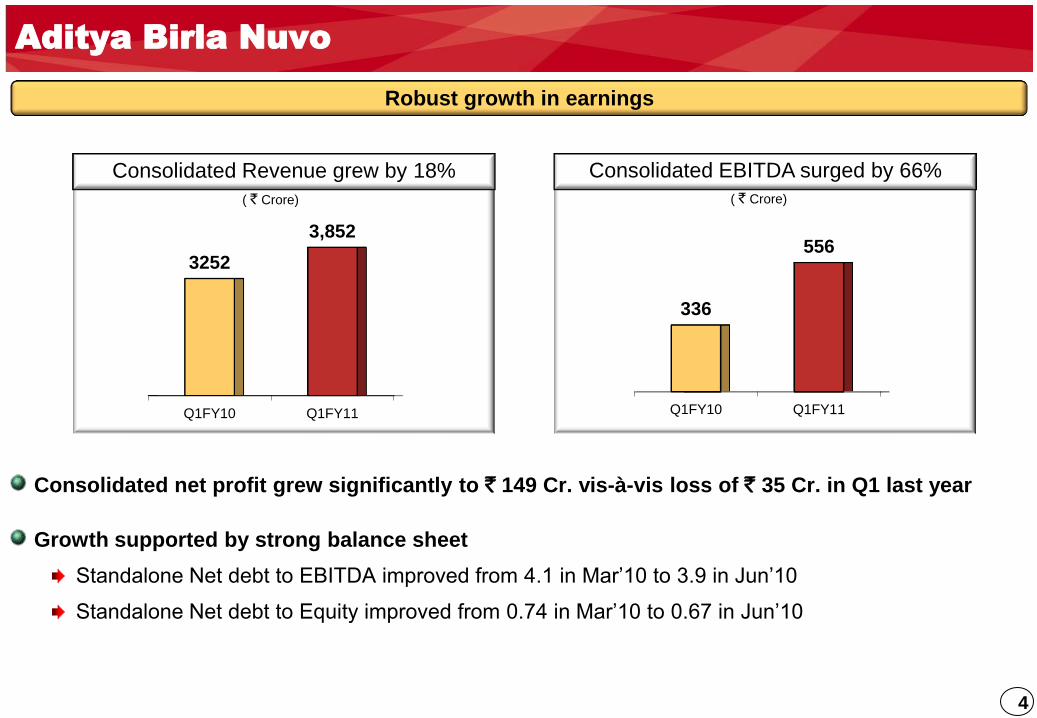
Consolidated net profit grew significantly to ` 149 Cr. vis-à-vis loss of ` 35 Cr. in Q1 last year
Growth supported by strong balance sheet
Standalone Net debt to EBITDA improved from 4.1 in Mar‟10 to 3.9 in Jun‟10
Standalone Net debt to Equity improved from 0.74 in Mar‟10 to 0.67 in Jun‟10
Aditya Birla Nuvo
Robust growth in earnings
Consolidated EBITDA surged by 66%
Q1FY10 Q1FY11
336
556
( ` Crore)
Consolidated Revenue grew by 18%
( ` Crore)
Q1FY10 Q1FY11
3252
3,852

55
Revenue EBITDA
Financial Services
Telecom
IT-ITeS
Fashion & Lifestyle1
Manufacturing
1Branded apparels and accessories
Continuous pursuit of strategic objectives driving profitable growth across the businesses
Consolidated earnings growth (y-o-y) in Q1FY11
Aditya Birla Nuvo
66
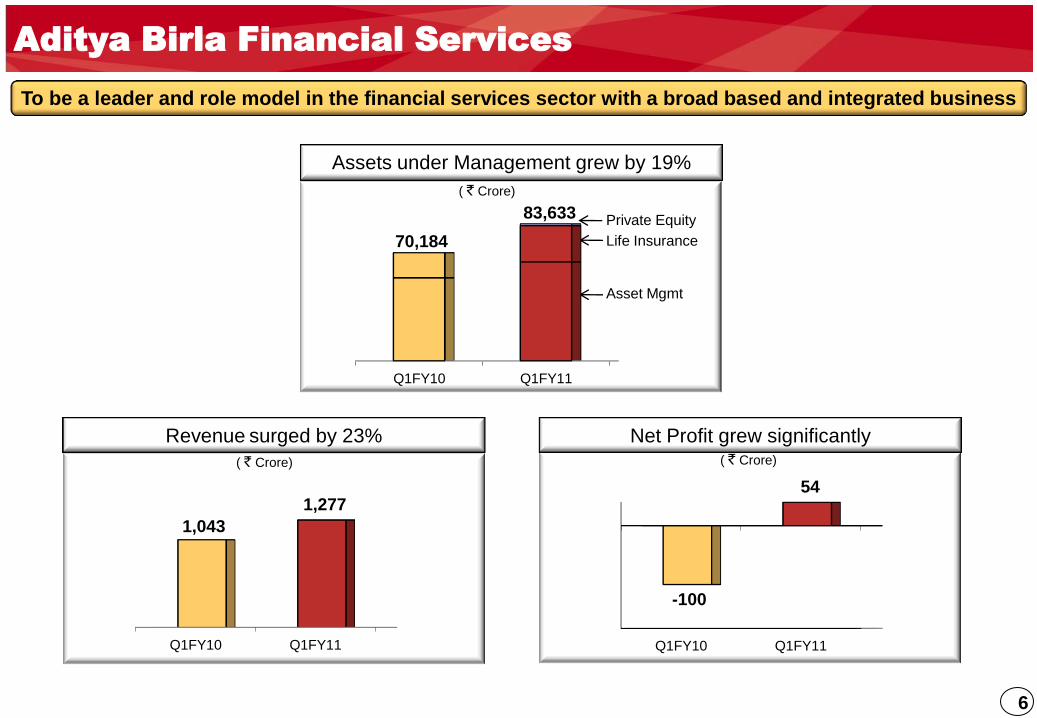
Aditya Birla Financial Services
To be a leader and role model in the financial services sector with a broad based and integrated business
Life Insurance
Asset Mgmt
Private Equity
Q1FY10 Q1FY11
70,184
83,633
Assets under Management grew by 19%
Revenue surged by 23%
Q1FY10 Q1FY11
1,043
1,277
Net Profit grew significantly
Q1FY10 Q1FY11
-100
54
( ` Crore) ( ` Crore)
( ` Crore)
77
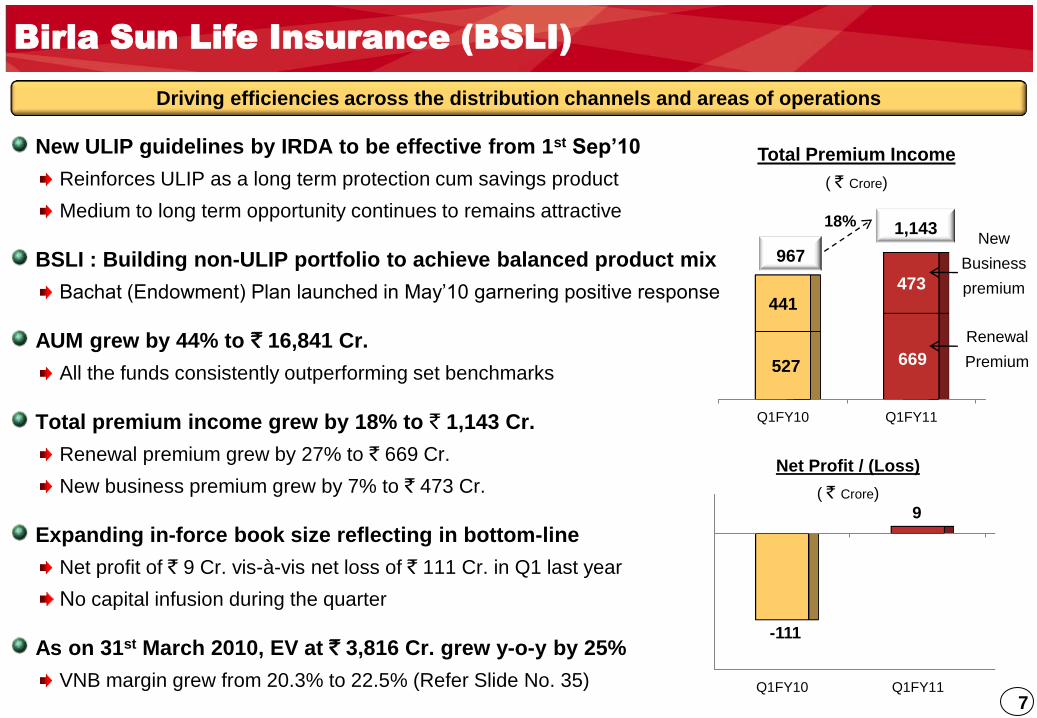
New ULIP guidelines by IRDA to be effective from 1st Sep‟10
Reinforces ULIP as a long term protection cum savings product
Medium to long term opportunity continues to remains attractive
BSLI : Building non-ULIP portfolio to achieve balanced product mix
Bachat (Endowment) Plan launched in May‟10 garnering positive response
AUM grew by 44% to ` 16,841 Cr.
All the funds consistently outperforming set benchmarks
Total premium income grew by 18% to ` 1,143 Cr.
Renewal premium grew by 27% to ` 669 Cr.
New business premium grew by 7% to ` 473 Cr.
Expanding in-force book size reflecting in bottom-line
Net profit of ` 9 Cr. vis-à-vis net loss of ` 111 Cr. in Q1 last year
No capital infusion during the quarter
As on 31st March 2010, EV at ` 3,816 Cr. grew y-o-y by 25%
VNB margin grew from 20.3% to 22.5% (Refer Slide No. 35)
Birla Sun Life Insurance (BSLI)
Q1FY10 Q1FY11
527 669
441
473
New
Business
premium
Total Premium Income
( ` Crore)
967
1,143
Renewal
Premium
18%
Q1FY10 Q1FY11
-111
9
Net Profit / (Loss)
( ` Crore)
Driving efficiencies across the distribution channels and areas of operations

88
Domestic AUM of BSAMC grew y-o-y by 12% while Industry was flat
BSAMC achieved highest y-o-y & q-o-q growth rate among top 5 players
Ranks 5th with 9.3% share vis-à-vis 8.3% in Mar‟10 & 8.4% in Jun‟09
Equity avg. AUM (Incl. offshore) at ` 13,904 Cr. grew y-o-y by 42%
Industry‟s avg. equity AUM grew y-o-y by 20%
Achieved 2nd highest y-o-y growth rate amongst top 10 players in domestic
avg. equity AUM, led by higher net sales
Ranked amongst top 3 equity mobilisers in Q1, garnering equity net sales of
over ` 425 Cr. compared to industry‟s net redemption of ~ ` 1,425 Cr.
Continues to have highest number of funds with 4 & 5 star
categories across the industry
Launched India Reforms Fund & Capital Protection Fund
mobilising ` 556 Cr. Launched Real Estate Onshore Fund
Revenue more than doubled y-o-y to ` 100 Cr.
Net profit grew multifold to ` 32 Cr.
Offshore
Domestic
Birla Sun Life Asset Management (BSAMC)
Total Avg. AUM (Incl. Offshore & PMS)
( ` Crore)
Break up of Equity AUM & share in
industry‟s domestic equity AUM
(` Crore)
Thrust on increasing share of equity AUM and alternate assets
Equity (Incl.
offshore)
& PMS
Q1FY10 Q1FY11
Debt &
Liquid
65,91158,514
4.4%
5.4%
Q1FY10 Q2FY10 Q3FY10 Q4FY10 Q1FY11
7,817
11,5131,993
2,3919,810
13,904

99
Rising revenue share displays Idea‟s capability to emerge stronger amidst hyper competition
Cash profit sustained y-o-y at ` 779 Cr. despite competitive pressure and new launches
During past 5 quarters, average realised rate declined from 58p to 44p. Cost per minute reduced from 44p to
35p even after absorbing start up costs of seven new service areas launched during this period
Earnings were supported by robust y-o-y growth in total Minutes of Usage at 82 billion minutes
Net profit lower at ` 201 Cr. vis-à-vis ` 297 Cr.
Idea won 3G spectrum in 11 service areas which account for ~80% of its existing 2G revenue and
~50% of Industry‟s all-India revenue : Idea ranks 1st or 2nd in 7 out of these 11 service areas
Capex guidance (2G & 3G) for FY11 at ` 40-44 billion
Strong balance sheet & cash profit to support growth: Net debt-equity less than 1 & Net debt-EBITDA at 3
Telecom : Idea Cellular
1Incl.Spice & based on gross revenue for UAS & Mobile license only, as released by TRAI, latest available till Q4FY10
Ranks 3rd in revenue market share1
11.7%12.6%
Q4FY09 Q4FY10
Building sustainable competitiveness while maintaining growth momentum
Q1FY10 Q1FY11
2,975
3,650
Revenue grew by 23%
( ` Crore)
1010
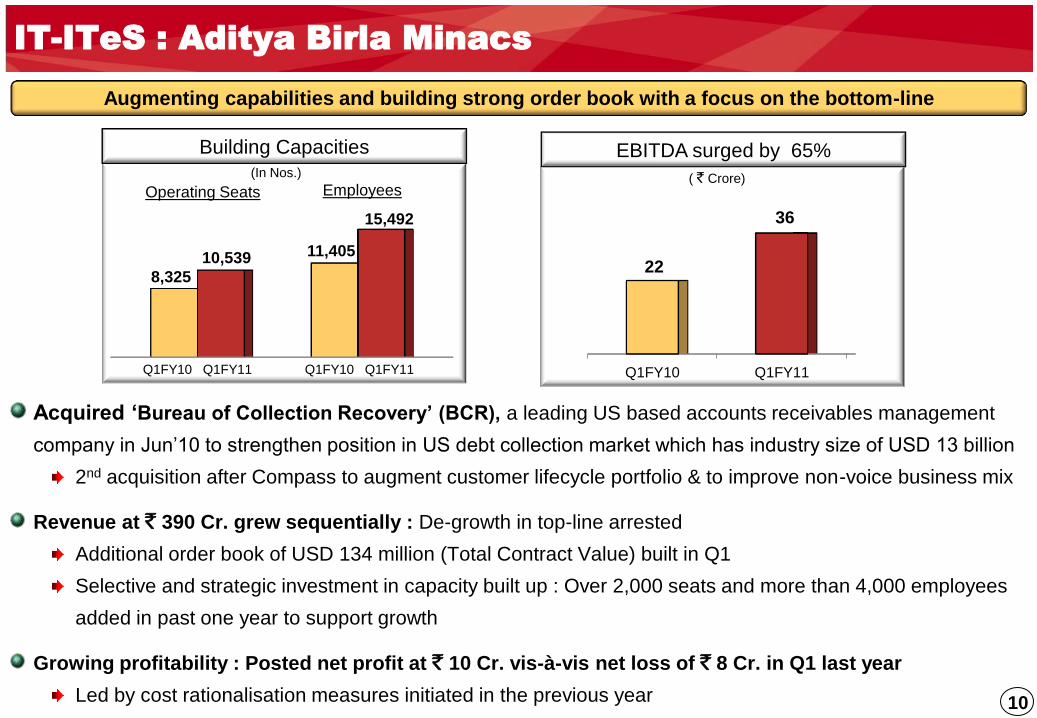
Acquired „Bureau of Collection Recovery‟ (BCR), a leading US based accounts receivables management
company in Jun‟10 to strengthen position in US debt collection market which has industry size of USD 13 billion
2nd acquisition after Compass to augment customer lifecycle portfolio & to improve non-voice business mix
Revenue at ` 390 Cr. grew sequentially : De-growth in top-line arrested
Additional order book of USD 134 million (Total Contract Value) built in Q1
Selective and strategic investment in capacity built up : Over 2,000 seats and more than 4,000 employees
added in past one year to support growth
Growing profitability : Posted net profit at ` 10 Cr. vis-à-vis net loss of ` 8 Cr. in Q1 last year
Led by cost rationalisation measures initiated in the previous year
IT-ITeS : Aditya Birla Minacs
Augmenting capabilities and building strong order book with a focus on the bottom-line
Q1FY10 Q1FY11
22
36
EBITDA surged by 65%Building Capacities
8,325
11,40510,539
15,492
Q1FY10 Q1FY11 Q1FY10 Q1FY11
EmployeesOperating Seats
(In Nos.) ( ` Crore)
1111
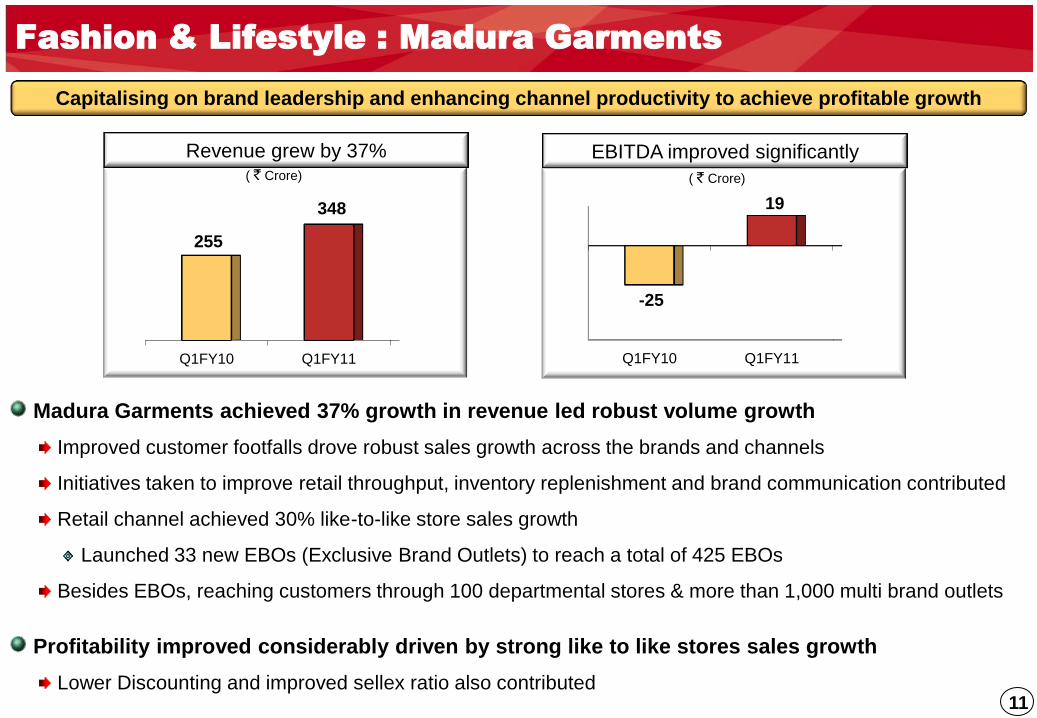
Fashion & Lifestyle : Madura Garments
Madura Garments achieved 37% growth in revenue led robust volume growth
Improved customer footfalls drove robust sales growth across the brands and channels
Initiatives taken to improve retail throughput, inventory replenishment and brand communication contributed
Retail channel achieved 30% like-to-like store sales growth
Launched 33 new EBOs (Exclusive Brand Outlets) to reach a total of 425 EBOs
Besides EBOs, reaching customers through 100 departmental stores & more than 1,000 multi brand outlets
Profitability improved considerably driven by strong like to like stores sales growth
Lower Discounting and improved sellex ratio also contributed
Capitalising on brand leadership and enhancing channel productivity to achieve profitable growth
Q1FY10 Q1FY11
-25
19
EBITDA improved significantly
Q1FY10 Q1FY11
255
348
Revenue grew by 37%
( ` Crore)( ` Crore)

1212
BusinessQ1 EBITDA
FY10 FY11Highlights
Carbon Black 31 58In Q1 last year, consumption of high priced CBFS strained margins
~85K MT Greenfield expansion completed in May‟10, currently under stabilisation
Agri-business 16 29Higher sales volume and subsidy arrear contributed
Annual maintenance shutdown of 21 days vis-à-vis 24 days in Q1 last year
Rayon 47 31 Lower sales volume coupled with higher input & fuel prices impacted margins
Insulators 21 31 Higher sales volume and improved yield contributed
Textiles 10 22 Robust demand led higher volumes in linen segment augmented earnings
Manufacturing Businesses
Capturing sector growth and realising full potential
Q1FY10 Q1FY11
787970
Revenue grew by 23% & EBITDA surged by 37%
Q1FY10 Q1FY11
125
172
Revenue EBITDAQ1FY10 Q1FY11
EBITDA Margin 16% 18%
ROACE
(Annualised)17% 25%
( ` Crore)

13

1414
Consolidated Revenue Walk
Financial Services led the revenue walk followed by Manufacturing businesses
3252
+209+123
-2
+93
+183
-6
3852
Q1FY10 Financial
Services
Telecom IT-ITeS Fashion &
Lifestyle
Manufacturing Elim. Q1FY11
( ` Crore)

1515
Financial Services
32%
Telecom24%
IT-ITeS10%
Fashion & Lifestyle
9%
Manufacturing25%
(Life Insurance 28%)
Consolidated Revenue Mix
` 3,852 Crore in Q1FY11
Financial Services is the largest contributor to the consolidated revenue pie

1616
Consolidated Segmental EBIT Walk
Financial Services led the profit walk followed by Fashion & Lifestyle and Manufacturing businesses
89
+146
-35
+14
+49
+44
307
Q1FY10 Financial
Services
Telecom IT-ITeS Fashion &
Lifestyle
Manufacturing Q1FY11
( ` Crore)

1717
Consolidated Net Profit Walk
Improved earnings across the businesses led the turnaround at bottom-line
-35
+220
+54
-19
-38
-34
149
Q1FY10 EBITDA Interest
Expenses
Depreciation Tax Minority
Interest
Q1FY11
0
( ` Crore)

18
1919
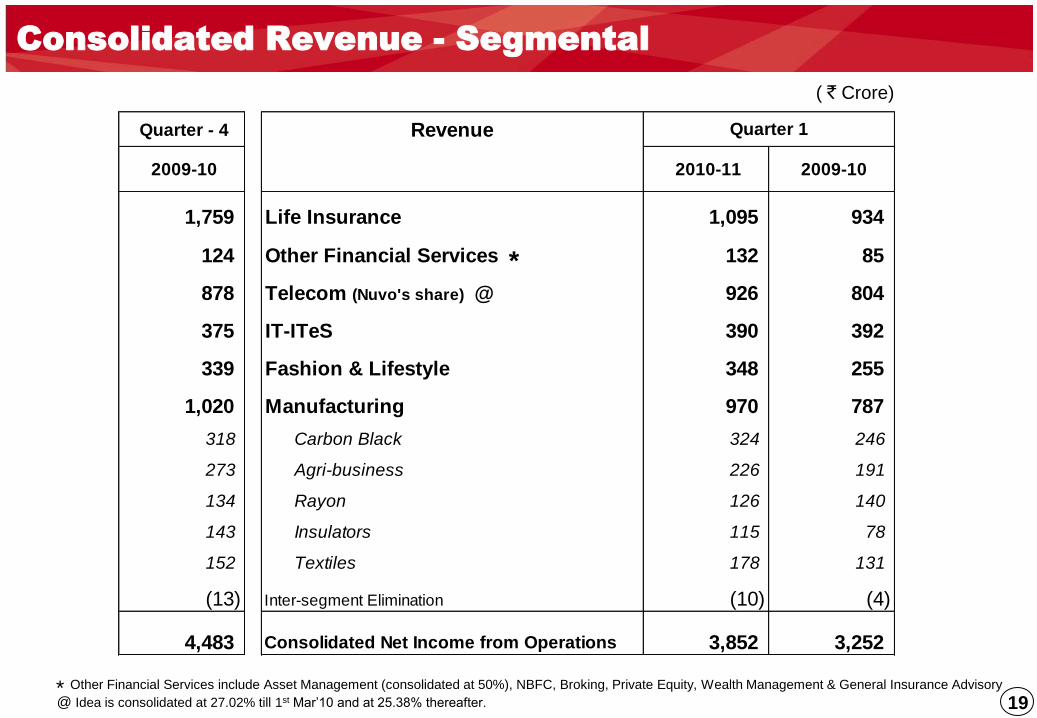
Consolidated Revenue - Segmental
@ Idea is consolidated at 27.02% till 1st Mar‟10 and at 25.38% thereafter. * Other Financial Services include Asset Management (consolidated at 50%), NBFC, Broking, Private Equity, Wealth Management & General Insurance Advisory
Quarter - 4 Revenue
2009-10 2010-11 2009-10
1,759 Life Insurance 1,095 934
124 Other Financial Services * 132 85
878 Telecom (Nuvo's share) @ 926 804
375 IT-ITeS 390 392
339 Fashion & Lifestyle 348 255
1,020 Manufacturing 970 787
318 Carbon Black 324 246
273 Agri-business 226 191
134 Rayon 126 140
143 Insulators 115 78
152 Textiles 178 131
(13) Inter-segment Elimination (10) (4)
4,483 Consolidated Net Income from Operations 3,852 3,252
Quarter 1
( ` Crore)

2020
Consolidated Profitability (EBIT) - Segmental
* Other Financial Services include Asset Management (consolidated at 50%), NBFC, Broking, Private Equity, Wealth Management & General Insurance Advisory
@ Idea is consolidated at 27.02% till 1st Mar‟10 and at 25.38% thereafter.
( ` Crore)
Quarter - 4 EBIT
2009-10 2010-11 2009-10
(51) Life Insurance 12 (108)
32 Other Financial Services * 43 17
116 Telecom (Nuvo's share) @ 87 122
10 IT-ITeS 21 7
(15) Fashion & Lifestyle 4 (45)
169 Manufacturing 141 96
54 Carbon Black 51 25
40 Agri-business 25 11
20 Rayon 23 39
36 Insulators 26 17
19 Textiles 17 5
261 Segmental EBIT 307 89
Quarter 1

2121
Consolidated Profit & Loss and Balance Sheet
Quarter - 4 Profit & Loss Account
2009-10 2010-11 2009-10
4,483 Net income from operations 3,852 3,252
516 EBITDA 556 336
151 Interest Expenses 135 190
366 EBDT 420 146
231 Depreciation 221 203
135 Earnings before Tax 199 (57)
(31) Provision for Taxation (Net) 44 6
(14) Minority Interest 6 (28)
180 Net Profit after minority interest 149 (35)
Quarter 1 Balance Sheet
Net Worth 5,634 5,475
Minority Interest 192 186
Total Debt 7,718 6,707
Deferred Tax Liabilities (Net) 244 241
Capital Employed 13,787 12,608
Policyholders' funds
(Incl. funds for future appropriation) 16,455 15,652
Total Liabilities 30,243 28,260
Net Block (Incl. Goodwill) 11,400 9,881
Net Working Capital 297 568
Long Term Investments 219 219
Life Insurance Investments 16,841 16,130
Cash Surplus & Current Investments 1,486 1,462
Book Value (`) 547 531
Net Debt / EBITDA (x) 2.8 3.1
Net Debt / Equity (x) 1.1 1.0
June-10 March-10
( ` Crore)( ` Crore)

2222
June March
2010 2010
Net Worth 4,726 4,662
Total Debt 3,757 3,636
Deferred Tax Liabilities 180 178
Capital Employed 8,663 8,476
Net Block 1,836 1,815
Net Working Capital 922 1,045
Long Term Investments 5,307 5,436
Cash Surplus & Current Investments 598 180
Book Value (`) 459 453
Net Debt / EBITDA (x) 3.9 4.1
Net Debt / Equity (x) 0.67 0.74
Market Capitalisation - NSE 7,808 9,336
Balance SheetQuarter - 4 Profit & Loss Account
2009-10 2010-11 2009-10
1,351 Net income from operations 1,311 997
217 EBITDA 204 127
73 Interest Expenses 69 95
144 EBDT 135 32
47 Depreciation 45 44
97 Earnings before Tax 90 (12)
(49) Provision for Taxation (Net) 25 (10)
146 Net Profit 65 (2)
Quarter 1
Note 1 : Capex plan for FY2010-11 is ` 300 Cr. including ` 150 Cr. towards maintenance capex
Note 2 : Life Insurance business will require funding of ` 200 Crore in FY2010-11 to fund its growth plans.
Standalone Profit & Loss and Balance Sheet
( ` Crore)( ` Crore)

2323
Birla Sun Life Insurance
Individual life policies issued in Q1 grew y-o-y by 10% to
3.6 lacs – Second highest among private players
Going Forward :
Continued strong focus on persistency
Building balanced mix of ULIP & Non-ULIP products
Review operating model in response to new
guidelines
2010-11 2009-10
New Business Premium
Individual Business 398 380
Group Business 75 61
New Business Premium (Gross) 473 441
Renewal Premium (Gross) 669 527
Premium Income (Gross) 1,143 967
Less : Reinsurance ceded & Service tax (52) (38)
Premium Income (Net) 1,091 929
Other Operating Income 4 4
Revenue 1,095 934
Net Profit / (Loss) 9 (111)
Capital 2,450 2,050
Assets under management 16,841 11,670
Quarter 1
` Crore
2424
Birla Sun Life Asset Management
Jun-10 Jun-09
Equity 11,513 7,817
Debt & Liquid 51,598 48,466
Domestic AUM 63,112 56,283
Off shore (All Equity) 2,391 1,993
PMS 409 238
Total AUM 65,911 58,514
Average AUM ` Crore
2010-11 2009-10
Revenue (Fee Income) 100 49
Earnings before tax 49 8
Net Profit 32 5
Quarter 1
Revenues
` Crore
Only player amongst top five players to record positive q-o-q growth
in domestic avg. AUM
Live SIPs grew y-o-y by 56%
2525
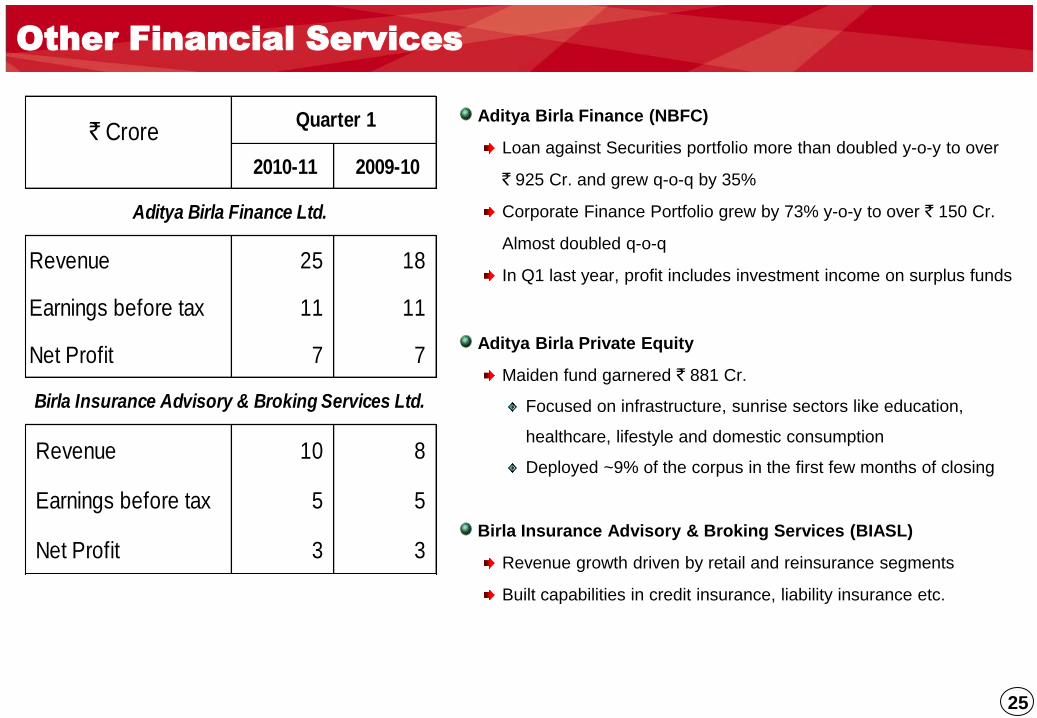
Aditya Birla Finance (NBFC)
Loan against Securities portfolio more than doubled y-o-y to over
` 925 Cr. and grew q-o-q by 35%
Corporate Finance Portfolio grew by 73% y-o-y to over ` 150 Cr.
Almost doubled q-o-q
In Q1 last year, profit includes investment income on surplus funds
Aditya Birla Private Equity
Maiden fund garnered ` 881 Cr.
Focused on infrastructure, sunrise sectors like education,
healthcare, lifestyle and domestic consumption
Deployed ~9% of the corpus in the first few months of closing
Birla Insurance Advisory & Broking Services (BIASL)
Revenue growth driven by retail and reinsurance segments
Built capabilities in credit insurance, liability insurance etc.
Other Financial Services
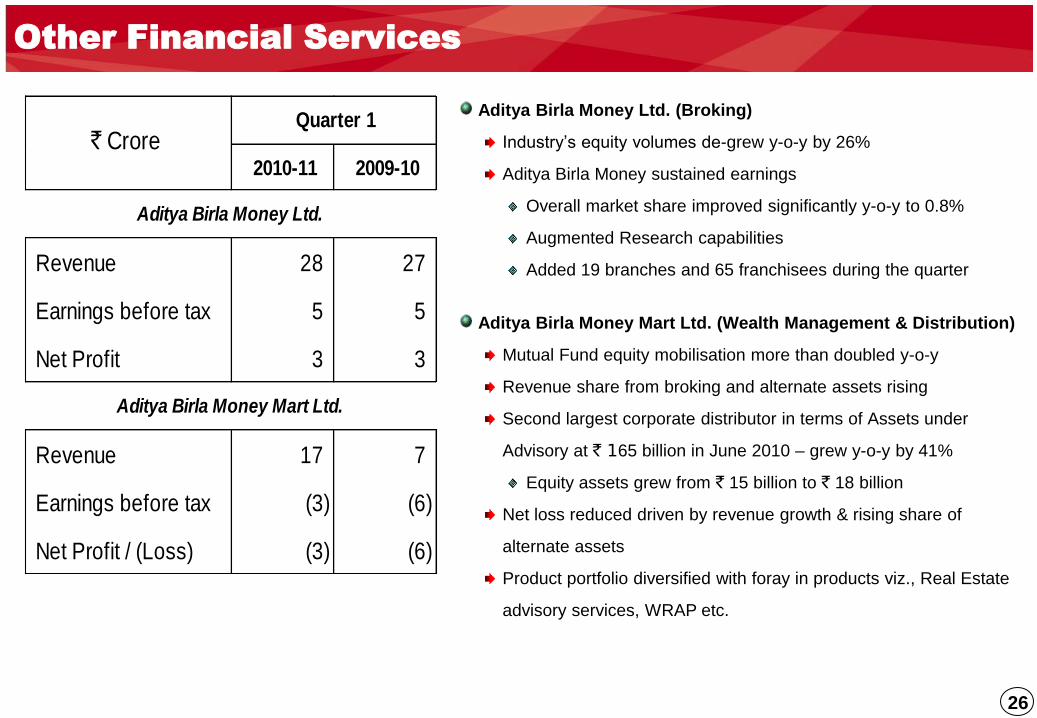
2010-11 2009-10
Revenue 25 18
Earnings before tax 11 11
Net Profit 7 7
Revenue 10 8
Earnings before tax 5 5
Net Profit 3 3
Birla Insurance Advisory & Broking Services Ltd.
Aditya Birla Finance Ltd.
Quarter 1 ` Crore
2626
Aditya Birla Money Ltd. (Broking)
Industry‟s equity volumes de-grew y-o-y by 26%
Aditya Birla Money sustained earnings
Overall market share improved significantly y-o-y to 0.8%
Augmented Research capabilities
Added 19 branches and 65 franchisees during the quarter
Aditya Birla Money Mart Ltd. (Wealth Management & Distribution)
Mutual Fund equity mobilisation more than doubled y-o-y
Revenue share from broking and alternate assets rising
Second largest corporate distributor in terms of Assets under
Advisory at ` 165 billion in June 2010 – grew y-o-y by 41%
Equity assets grew from ` 15 billion to ` 18 billion
Net loss reduced driven by revenue growth & rising share of
alternate assets
Product portfolio diversified with foray in products viz., Real Estate
advisory services, WRAP etc.
Other Financial Services
2010-11 2009-10
Revenue 28 27
Earnings before tax 5 5
Net Profit 3 3
Revenue 17 7
Earnings before tax (3) (6)
Net Profit / (Loss) (3) (6)
Aditya Birla Money Mart Ltd.
Rs. Crore Quarter 1
Aditya Birla Money Ltd.
` Crore
2727
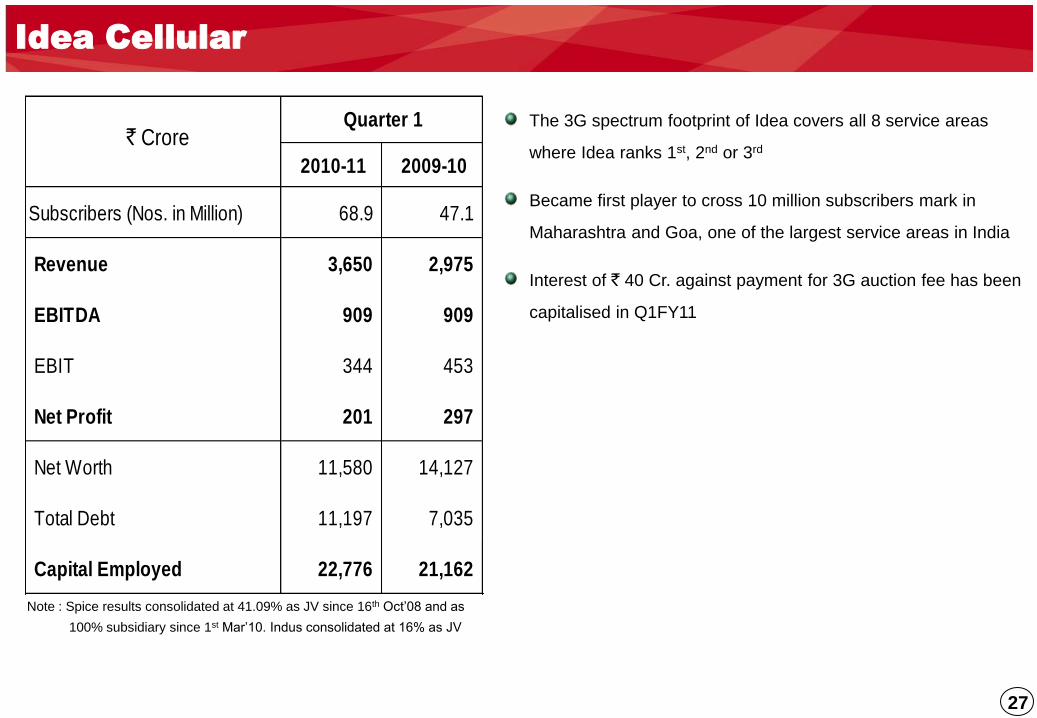
Idea Cellular
Note : Spice results consolidated at 41.09% as JV since 16th Oct‟08 and as
100% subsidiary since 1st Mar‟10. Indus consolidated at 16% as JV
2010-11 2009-10
Subscribers (Nos. in Million) 68.9 47.1
Revenue 3,650 2,975
EBITDA 909 909
EBIT 344 453
Net Profit 201 297
Net Worth 11,580 14,127
Total Debt 11,197 7,035
Capital Employed 22,776 21,162
Quarter 1 Rs. Crore ` Crore
The 3G spectrum footprint of Idea covers all 8 service areas
where Idea ranks 1st, 2nd or 3rd
Became first player to cross 10 million subscribers mark in
Maharashtra and Goa, one of the largest service areas in India
Interest of ` 40 Cr. against payment for 3G auction fee has been
capitalised in Q1FY11

2828
Aditya Birla Minacs Madura Garments
Thrust on accelerating F&A & Collections practices
BCR is a leading player in US debt collection
industry since more than 25 years
Outstanding consumer debt in US was ~ USD 2.6
trillion in 2008 (Source : Datamonitor)
2010-11 2009-10
Operating Seats (Nos.) 10,539 8,325
Employees (Nos.) 15,492 11,405
Revenue 390 392
EBITDA 36 22
EBIT 21 7
Net Profit / (Loss) 10 (8)
Quarter 1 Rs. Crore ` Crore
Retail channel comprises 425 EBOs spread across
8.5 lacs square feet
Contributes ~45% to the business revenue
Focus on driving growth through channel expansion
and like to like store sales growth
2010-11 2009-10
No. of EBOs 425 352
Retail Space (Lacs Sq. Ft) 8.5 7.6
Revenue 348 255
EBITDA 19 (25)
EBIT 4 (45)
Capital Employed 530 673
Rs. Crore
Quarter 1
` Crore

2929
Hi-Tech Carbon
Revenue surged by 32% driven by higher realisation
During Q1 last year, realisation was lower reflecting movement in
feedstock (CBFS) prices in line with crude oil prices
EBITDA grew from ` 31 Cr. to ` 58 Cr.
In Q1 last year, margins were impacted due to consumption of
high priced CBFS
Greenfield capacity expansion by ~85,000 MTPA at Patalganga
completed in May 2010 end along with 23 MW power plant
Currently under stabilisation, the capacity expansion will benefit in
the coming quarters
Total carbon black capacity reached ~3,15,000 MTPA and
installed power plant capacity reached ~75 MW
Planning to augment capacity further by 85,000 MTPA each at
Patalganga in second phase as well as in southern India
2010-11 2009-10
Sales Volumes (MT) 57,721 56,167
Realisation (Rs./MT) 52,552 39,776
Revenue 324 246
EBITDA 58 31
EBIT 51 25
Capital Employed 1,036 719
ROACE (Annualised) (%) 21 14
Rs. Crore
Quarter 1 ` Crore

3030
Sales volumes grew by 14%
Indo-Gulf observed annual maintenance shutdown for 21 days
vis-à-vis 24 days in Q1 last year
Revenue surged by 18% to ` 226 Cr. & EBITDA grew from ` 16 Cr.
to ` 29 Cr.
Led by volume growth and subsidy arrear of ` 8 Cr.
ROACE improved considerably
Indo Gulf Fertilisers
2010-11 2009-10
Urea Sales (MT) 223,063 194,945
Revenue 226 191
EBITDA 29 16
EBIT 25 11
Capital Employed 271 418
ROACE (Annualised) (%) 35 9
Quarter 1
Rs. Crore ` Crore
3131
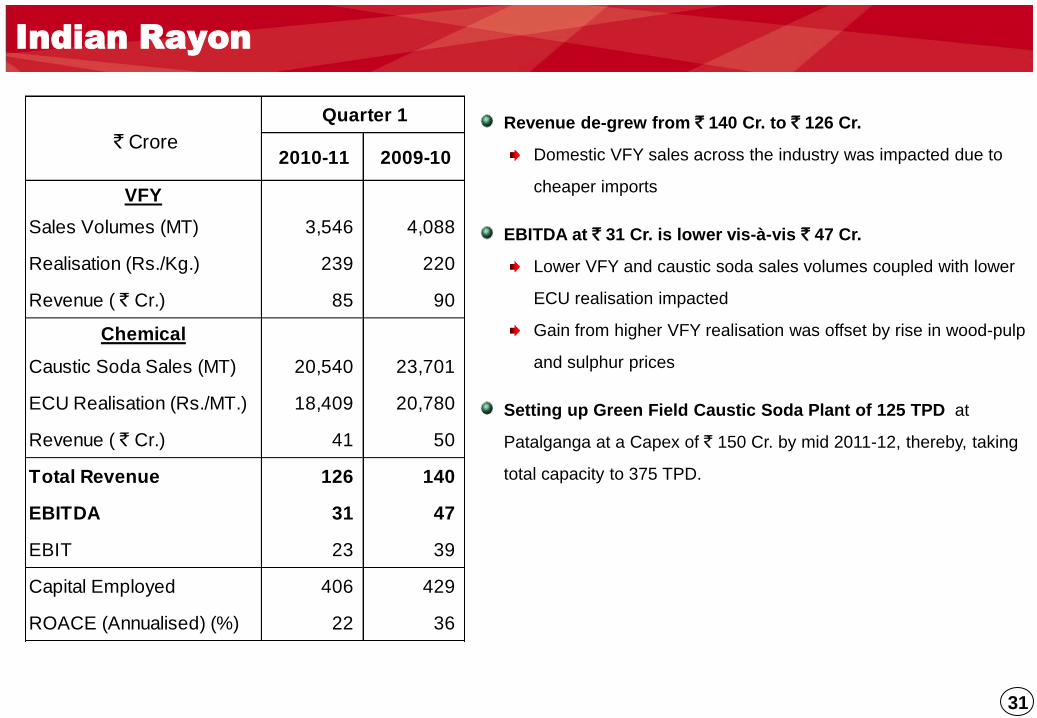
2010-11 2009-10
VFY
Sales Volumes (MT) 3,546 4,088
Realisation (Rs./Kg.) 239 220
Revenue ( ` Cr.) 85 90
Chemical
Caustic Soda Sales (MT) 20,540 23,701
ECU Realisation (Rs./MT.) 18,409 20,780
Revenue ( ` Cr.) 41 50
Total Revenue 126 140
EBITDA 31 47
EBIT 23 39
Capital Employed 406 429
ROACE (Annualised) (%) 22 36
Quarter 1
Rs. Crore ` Crore
Indian Rayon
Revenue de-grew from ` 140 Cr. to ` 126 Cr.
Domestic VFY sales across the industry was impacted due to
cheaper imports
EBITDA at ` 31 Cr. is lower vis-à-vis ` 47 Cr.
Lower VFY and caustic soda sales volumes coupled with lower
ECU realisation impacted
Gain from higher VFY realisation was offset by rise in wood-pulp
and sulphur prices
Setting up Green Field Caustic Soda Plant of 125 TPD at
Patalganga at a Capex of ` 150 Cr. by mid 2011-12, thereby, taking
total capacity to 375 TPD.
3232
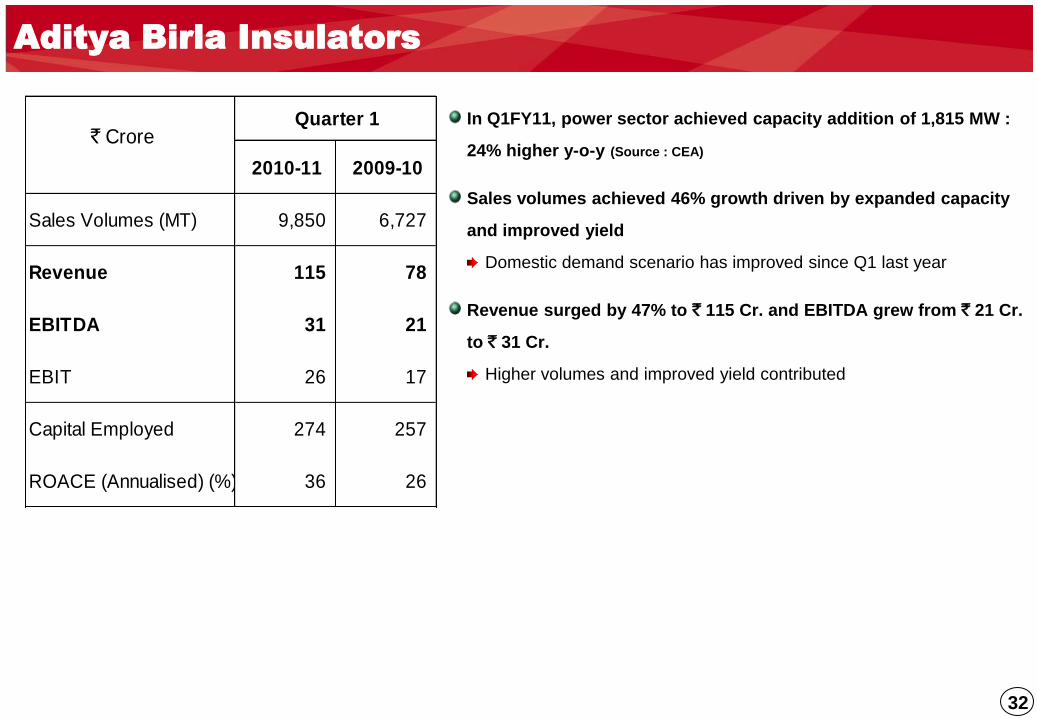
Aditya Birla Insulators
In Q1FY11, power sector achieved capacity addition of 1,815 MW :
24% higher y-o-y (Source : CEA)
Sales volumes achieved 46% growth driven by expanded capacity
and improved yield
Domestic demand scenario has improved since Q1 last year
Revenue surged by 47% to ` 115 Cr. and EBITDA grew from ` 21 Cr.
to ` 31 Cr.
Higher volumes and improved yield contributed
2010-11 2009-10
Sales Volumes (MT) 9,850 6,727
Revenue 115 78
EBITDA 31 21
EBIT 26 17
Capital Employed 274 257
ROACE (Annualised) (%) 36 26
Quarter 1
Rs. Crore ` Crore

3333
Jaya Shree Textiles
2010-11 2009-10
Linen Segment 64 37
Wool Segment 114 95
Revenue 178 131
EBITDA 22 10
EBIT 17 5
Capital Employed 196 316
ROACE (Annualised) (%) 28 5
Rs. Crore
Quarter 1 ` Crore
Revenue surged by 36% to ` 178 Cr. and EBITDA more than
doubled to ` 22 Cr.
Led by robust demand in Linen Yarn & Linen Fabric segments
Higher wool prices reflected in higher revenue in Wool segment
In Q1 last year usage of high priced stock impacted profitability
due to sudden fall in commodity prices
ROACE improved considerably led by better working capital
management and improved earnings
Removal of import duty on flax fibre, a input material for linen
yarn, is encouraging for the business
Focus on increasing share of high margin retail segment under
“Linen Club” brand
Currently at 32 stores, plans are underway to add 8 more
franchise stores (buy & sell model without any capex)

3434
Manufacturing
Textiles1
Carbon Black1
Rayon1
Agri-Business1
IT-ITeS2
(88.28%)
Fashion &
Lifestyle1
Financial
ServicesTelecom3 #
(25.38%)
Asset Management3
(50%) *
Life Insurance2
(74%)*
NBFC2
Private Equity2
Broking (75%)2
Wealth management2
General Insurance Advisory2
Insulators1
Represent Joint Ventures
Represent Subsidiaries
*JV with Sun Life Financial, Canada
Note : Percentage figures indicated above represent
ABNL‟s shareholding in its subsidiaries /JV‟s
Represent Divisions
# Listed, Aditya Birla Group holds 46.98%
1
2
3
Annexure II : Reporting Structure
StandaloneSubsidiaries & Joint Ventures
Consolidated

3535
35
* VNB as a % of first year regular premium and 10% of single premium as reported to IRDA
Note : Pl. refer to the basis of preparation and assumptions on slide no. 37
Birla Sun Life Insurance Growing profitably : Value of New Business created
FY 2009-10 ` Crore
Embedded Value 3,816
Insurance Business Value 3,430
Adjusted Net Worth 386
Value of New Business 506
Implied VNB margins of
22.5%* in FY2009-10
(20.3%* FY2008-09)
Annexure III : EV & VNB of Birla Sun Life Insurance

3636
3,060
+ 311
+ 506
+ 450 - 317
- 35 - 72 - 86 3,816
EV 31st
March 2009
Expected
Inforce
Contribution
Value of New
Business
Capital
Injection
Acquisition
Cost
Overrun
Maintenance
Overrun
(incl. change
in future
cost
overrun)
Change in
Risk
Discount
Rate
Other
Variances
EV 31st
March 2010
2,684
3,430
376 386
Expected Inforce Contribution
Value of New Business
Other Variances
Capital Infusion
AcquisitionCost Overrun
Maintenance Cost Overrun
(Including change in future cost overruns)
Change in Risk Discount Rate
Insurance Business Value as on 31st March 2009
Adjusted Net Worth as on 31st March 2009
Insurance Business Value as on 31st March 2010
Adjusted Net Worth as on 31st March 2010
36
As on 31st March 2010, Embedded Value at ` 3,816 Cr. grew y-o-y by 25%
Reconciliation of Embedded Value
Embedded Value
as on 31st March 2009
Embedded Value
as on 31st March 2010
Annexure III : EV & VNB of Birla Sun Life Insurance
( ` Crore)

3737
37
EV & VNB – Key Assumptions
Annexure III : EV & VNB of Birla Sun Life Insurance
Operating Assumptions
The key economic and operating assumptions used in preparing the EV and VNB results as shown on slide 35 of this
presentation are:
Economic Assumptions
Asset Class Expected Returns
Cash/Money Market Instruments 6.50%
Government Bonds 7.25%
Corporate Bonds 8.25%
Equities 12.25%
Other Parameters Assumption
Tax Rate 14.16%
Risk Discount Rate (RDR) 12.50%
The RDR has been increased from 12% last year.
Using an RDR of 12% would increase the Embedded Value of
the company by 2.6% and the VNB by 5.7%.
Using an RDR of 13% would decrease the Embedded Value of
the company by 2.4% and the VNB by 5.4%.
Operating Assumptions
The demographic and business assumptions such as
morbidity, mortality, premium persistency, policy persistency
reflect our best estimate view of future experience in light of
actual past experience.
The expense assumptions are based on our latest approved
5-year business plan.
As per the business plan, the expense allowances are
projected to be 95% of the Operating Expenses in FY 2012-13
from the current position of 71% in FY 2009-10. This could be
favourably impacted by a stronger shift to long-term business
and / or better persistency.
Regulatory environment
The projections assume no significant changes in future regulatory environment. Any impact, positive or negative, resulting from
changes in regulatory environment (e.g. New ULIP Guidelines effective from 1st September 2010) have not been considered.

3838
Embedded Value (EV) – EV is the aggregate of:
Insurance Business Value (IBV), which is the present value of after-tax statutory profits expected to emerge in
future from in-force business at the valuation date, discounted at the risk discount rate, less the cost of holding
required capital to support the in-force business.
Adjusted Net Worth (ANW), which is the market value of assets in excess of statutory reserves.
Value of New Business (VNB): VNB is defined as the present value, from the point of sale, of after-tax statutory
profits expected to emerge in future from the new business written in the period, discounted at the risk discount rate,
less the cost of holding required capital to support the new business.
Basis of preparation :
The EV and VNB are computed based on a traditional EV methodology.
Group business is not considered in arriving at the results.
The EV includes the value of tax losses carried forward as at the valuation date.
An allowance has been made in the IBV for the expected maintenance expense overruns. No allowance has been
made in the VNB for the acquisition expense overrun arising in the period.
EV & VNB – Definitions and Basis of Preparation
In the EV and VNB, the cost of capital is calculated as the nominal value of the required capital less the present value, at
the risk discount rate, of the projected after-tax investment earnings and future releases of the required capital.
The methodology, assumptions and results for individual business have been reviewed by Towers Watson. The
conclusions of Towers Watson „s review are shown in the Appendix.
Annexure III : EV & VNB of Birla Sun Life Insurance

3939
Towers Watson has reviewed the methodology and assumptions used to determine the EV and VNB as at 31st March 2010 for the
individual business of Birla Sun Life Insurance Company Limited (“BSLI”).
Towers Watson has concluded that:
• The methodology used is consistent with recent industry practice in India as regards the calculation and reporting of traditional
embedded values on a deterministic basis;
• The economic assumptions used are internally consistent and have been set with regard to current economic conditions;
• The operating assumptions, taken in aggregate, have been set with appropriate regard to past, current and expected future
experience, noting the exception of BSLI‟s approach to setting the acquisition and maintenance expense assumptions, and
resultant cost overrun shown in various parts of this presentation including the Key Assumptions section, and noting the
difficulty in setting ultimate persistency assumptions, where management‟s expectations have been used because of the limited
experience data with which to determine these assumptions; and
• Allowance for risk has been made through the use of a single risk discount rate and an explicit assumption for the level and
cost of holding solvency capital. Whilst this is in line with recent industry practice as regards traditional actuarial embedded
value calculations, this may not correspond to a capital markets valuation of the risks (a so called “market consistent
valuation”).
Towers Watson has also performed limited high-level checks on the results of the calculations and has confirmed that any issues
discovered do not have a material impact on the disclosed embedded value and value of new business. Towers Watson has not,
however, performed detailed checks on the models and processes involved. Please note that the scope of our work did not
include a review of the Reconciliation of Embedded Value shown in this presentation.
In arriving at these conclusions, Towers Watson has relied on data and information provided by BSLI. This opinion is made solely
to BSLI in accordance with the terms of Towers Watson‟s engagement letter. To the fullest extent permitted by applicable law,
Towers Watson does not accept or assume any responsibility, duty of care or liability to anyone other than BSLI for or in
connection with its review work, the opinions it has formed, or for any statement set forth in this opinion.39
Appendix - Towers Watson Opinion
4040
Disclaimer
Certain statements made in this presentation may not be based on historical information or facts and may be “forward looking statements” including,
but not limited to, those relating to general business plans & strategy of Aditya Birla Nuvo Limited ("ABNL"), its future outlook & growth prospects,
future developments in its businesses, its competitive & regulatory environment and management's current views & assumptions which may not
remain constant due to risks and uncertainties. Actual results may differ materially from these forward-looking statements due to a number of
factors, including future changes or developments in ABNL's business, its competitive environment, its ability to implement its strategies and
initiatives and respond to technological changes and political, economic, regulatory and social conditions in the countries in which ABNL conducts
business. Important factors that could make a difference to ABNL‟s operations include global and Indian demand supply conditions, finished goods
prices, feed stock availability and prices, cyclical demand and pricing in ABNL‟s principal markets, changes in Government regulations, tax regimes,
competitors actions, economic developments within India and the countries within which ABNL conducts business and other factors such as
litigation and labour negotiations.
This presentation does not constitute a prospectus, offering circular or offering memorandum or an offer to acquire any shares and should not be
considered as a recommendation that any investor should subscribe for or purchase any of ABNL's shares. Neither this presentation nor any other
documentation or information (or any part thereof) delivered or supplied under or in relation to the shares shall be deemed to constitute an offer of
or an invitation by or on behalf of ABNL.
ABNL, as such, makes no representation or warranty, express or implied, as to, and does not accept any responsibility or liability with respect to,
the fairness, accuracy, completeness or correctness of any information or opinions contained herein. The information contained in this presentation,
unless otherwise specified is only current as of the date of this presentation. ABNL assumes no responsibility to publicly amend, modify or revise
any forward looking statements on the basis of any subsequent developments, information or events or otherwise. Unless otherwise stated in this
document, the information contained herein is based on management information and estimates. The information contained herein is subject to
change without notice and past performance is not indicative of future results. ABNL may alter, modify or otherwise change in any manner the
content of this presentation, without obligation to notify any person of such revision or changes. This presentation may not be copied and
disseminated in any manner.
INFORMATION PRESENTED HERE IS NOT AN OFFER FOR SALE OF ANY EQUITY SHARES OR ANY OTHER SECURITY OF ABNL
This presentation is not for publication or distribution, directly or indirectly, in or into the United States, Canada or Japan. These
materials are not an offer of securities for sale in or into the United States, Canada or Japan.
Aditya Birla Nuvo Limited
Regd. Office: Indian Rayon Compound, Veraval – 362 266 (Gujarat)
Corporate Office: 4th Floor „A‟ Wing, Aditya Birla Center, S.K. Ahire Marg, Worli, Mumbai – 400 030
Website: www.adityabirlanuvo.com or www.adityabirla.com or Email: [email protected]