STOCK AND RECRUITMENT RELATIONSHIPS IN PANULIRUS CYGNUS…fishbull.noaa.gov/80-3/morgan.pdf ·...
12
STOCK AND RECRUITMENT RELATIONSHIPS IN PANULIRUS CYGNUS,1 THE COMMERCIAL ROCK (SPINY) LOBSTER OF WESTERN AUSTRALIA G. R. MORGAN,2 B. F. PHILLIPS,S AND L. M. JOLL4 ABSTRACT Abundance of the breeding stock, level of settlement of the puerulus stage, juvenile densities, and recruits to the fishery for Panulirus cygnus from 1969 to 1979 are examined. A dome-shaped relationship between the index of abundance of the breedingstock and subsequent puerulus settlement indicates that stock-dependent effects during the planktonic larval stages apparently control the level of puerulus settlement. However. density-dependent relationships (characterized by more asymptotic relationships between the various life history stages) dominate after settlement of the puerulus on the coastal reefs and control the level of recruitment to the fishery and eventually to the breeding stock. The relationship between the settlement of the puerulus stage and the catch rates of the recruits entering the fishery 4 years later is adequately described by a Ricker's stock-recruitment curve as is the level of puerulus settlement to the subsequentabundance of the breeding stock. The relationship between the level of puerulus settlement and the later abun- dance of juveniles at various ages is not clear and possible reasons for this are suggested. The significance ofthe stock-dependent relationship between breedingstock and puerulus and the density-dependent relationship between puerulus and breedingstock in maintaining recruitmentto the fishery is discussed. The importance of understanding the stock-re- cruitment relationship in exploited fish popula- tions has been recognized for many years and has been the subject of several workshops and sym- posia (e.g., Parrish 1973), as well as a great deal of research. While the importance of such rela- tionships in exploited invertebrate stocks has been equally recognized, quantitative data, par- ticularly for crustaceans, has been virtually non- existent (Hancock 1973). . Like many fish species, crustaceans in general and spiny (rock) lobsters in particular, pass through several distinct stages in their life his- tory and, as Hancock (1973) pointed out, a proper understanding of the overall stock-recruitment relationship can be gained only by considering the relationship between successive stages over a number of years. Hancock's belief is reinforced by the studies of Larkin et al. (1964) and Paulik (1973) who, having considered the theoretical western rock lobster is referred to as P. longipes or P. Ion(J!pes cygnus in some of the literature quoted; these are synonymOUS with P. cygnus. 2Department of Fisheries and Wildlife. 108 Adelaide Ter- race, Perth, 6000, Western Australia. 3CSIRO, Division of Fisheries Research, P.O. Box 21, Cro- nulla. N.S.W. 2230 Australia. B 'CSIRO, Division of Fisheries Research, P.O. Box 20, North each, W.A. 6020 Australia. Manuscript accepted January 1982. FISHERY BULLETIN: VOL. 80, NO.3, 1982. forms of a stock-recruitment relationship in- volving such multistage life histories, showed that several stable equilibrium points can exist in the overall spawning stock-recruitment curve, depending on the relationships existing between the various life history stages. The western rock lobster, Panulirus cygnus George, the object of an important fishery in Western Australia (Morgan and Barker 1979) passes through several major stages during its life history. These include a series of phyllosoma larvae, a puerulus stage, and juvenile and adult stages. After a planktonic life of 9-11 mo(Chittle- borough and Thomas 1969; Phillips et al. 1979), the surviving phyllosoma larvae metamorphose into a puerulus stage and settle between Septem- ber and January each year in shallow coastal areas. The younger juveniles concentrate on shallow limestone reefs to depths of 10 m, with some larger juveniles to 20 m. At about 4 or 5 yr of age (Le., 4 or 5 yr from hatching) juveniles mi- grate from the shallow reef areas onto the conti- nental shelf into depths of 30-150 m where ma- turity is reached, mating takes place, and the life cycle is completed. Chittleborough and Phillips (1975) reported that, based on the data available at that time, in- dices of year-class strengths obtained from the 475
Transcript of STOCK AND RECRUITMENT RELATIONSHIPS IN PANULIRUS CYGNUS…fishbull.noaa.gov/80-3/morgan.pdf ·...
STOCK AND RECRUITMENT RELATIONSHIPS INPANULIRUS CYGNUS,1 THE COMMERCIAL
ROCK (SPINY) LOBSTER OF WESTERN AUSTRALIA
G. R. MORGAN,2 B. F. PHILLIPS,S AND L. M. JOLL4
ABSTRACT
Abundance of the breeding stock, level of settlement of the puerulus stage, juvenile densities, andrecruits to the fishery for Panulirus cygnus from 1969 to 1979 are examined.
A dome-shaped relationship between the index of abundance of the breedingstock and subsequentpuerulus settlement indicates that stock-dependent effects during the planktonic larval stagesapparently control the level of puerulus settlement. However. density-dependent relationships(characterized by more asymptotic relationships between the various life history stages) dominateafter settlement of the puerulus on the coastal reefs and control the level of recruitment to the fisheryand eventually to the breeding stock. The relationship between the settlement of the puerulus stageand the catch rates of the recruits entering the fishery 4 years later is adequately described by aRicker's stock-recruitment curve as is the level of puerulus settlement to the subsequent abundanceof the breeding stock. The relationship between the level of puerulus settlement and the later abundance of juveniles at various ages is not clear and possible reasons for this are suggested.
The significance ofthe stock-dependent relationship between breedingstock and puerulus and thedensity-dependent relationship between puerulus and breedingstock in maintaining recruitment tothe fishery is discussed.
The importance of understanding the stock-recruitment relationship in exploited fish populations has been recognized for many years and hasbeen the subject of several workshops and symposia (e.g., Parrish 1973), as well as a great dealof research. While the importance of such relationships in exploited invertebrate stocks hasbeen equally recognized, quantitative data, particularly for crustaceans, has been virtually nonexistent (Hancock 1973).. Like many fish species, crustaceans in generaland spiny (rock) lobsters in particular, passthrough several distinct stages in their life history and, as Hancock (1973) pointed out, a properunderstanding of the overall stock-recruitmentrelationship can be gained only by consideringthe relationship between successive stages over anumber of years. Hancock's belief is reinforcedby the studies of Larkin et al. (1964) and Paulik(1973) who, having considered the theoretical
IT~e western rock lobster is referred to as P. longipes or P.Ion(J!pes cygnus in some of the literature quoted; these aresynonymOUS with P. cygnus.
2Department of Fisheries and Wildlife. 108 Adelaide Terrace, Perth, 6000, Western Australia.
3CSIRO, Division of Fisheries Research, P.O. Box 21, Cronulla. N.S.W. 2230 Australia.B 'CSIRO, Division of Fisheries Research, P.O. Box 20, North
each, W.A. 6020 Australia.
Manuscript accepted January 1982.FISHERY BULLETIN: VOL. 80, NO.3, 1982.
forms of a stock-recruitment relationship involving such multistage life histories, showedthat several stable equilibrium points can existin the overall spawning stock-recruitment curve,depending on the relationships existing betweenthe various life history stages.
The western rock lobster, Panulirus cygnusGeorge, the object of an important fishery inWestern Australia (Morgan and Barker 1979)passes through several major stages during itslife history. These include a series of phyllosomalarvae, a puerulus stage, and juvenile and adultstages. After a planktonic life of9-11 mo(Chittleborough and Thomas 1969; Phillips et al. 1979),the surviving phyllosoma larvae metamorphoseinto a puerulus stage and settle between September and January each year in shallow coastalareas. The younger juveniles concentrate onshallow limestone reefs to depths of 10 m, withsome larger juveniles to 20 m. At about 4 or 5 yrof age (Le., 4 or 5 yr from hatching) juveniles migrate from the shallow reef areas onto the continental shelf into depths of 30-150 m where maturity is reached, mating takes place, and the lifecycle is completed.
Chittleborough and Phillips (1975) reportedthat, based on the data available at that time, indices of year-class strengths obtained from the
475
FISHERY BULLETIN: VOL. 80, NO.3
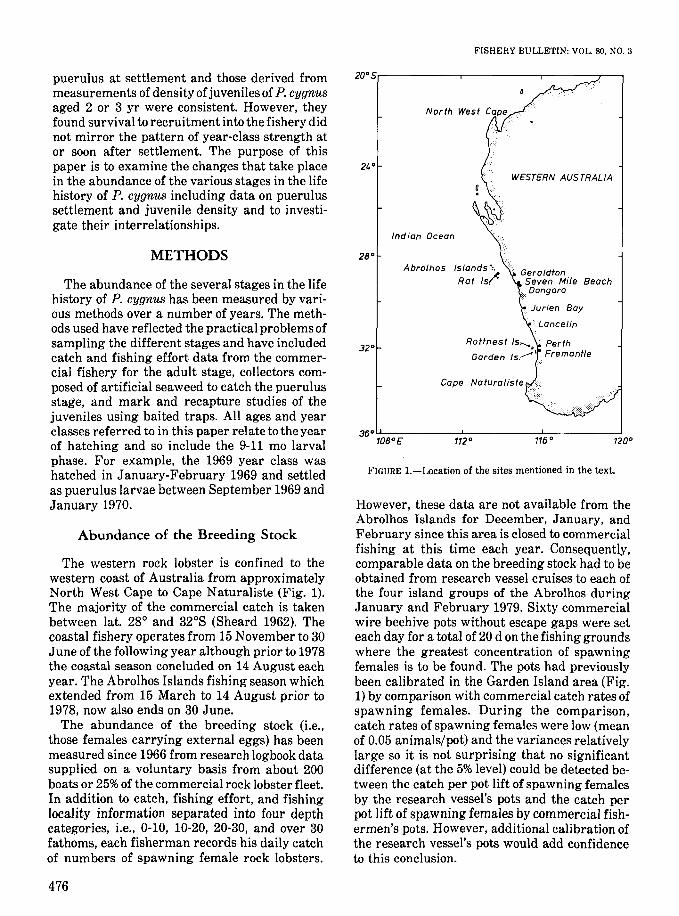
FIGURE I.-Location of the sites mentioned in the text.
20·s,...--------r-----,----.--,
WESTERN AUSTRALIA
However, these data are not available from theAbrolhos Islands for December, January, andFebruary since this area is closed to commercialfishing at this time each year. Consequently,comparable data on the breeding stock had to beobtained from research vessel cruises to each ofthe four island groups of the Abrolhos duringJanuary and February 1979. Sixty commercialwire beehive pots without escape gaps were seteach day for a total of 20 d on the fishing groundswhere the greatest concentration of spawningfemales is to be found. The pots had previouslybeen calibrated in the Garden Island area (Fig.1) by comparison with commercial catch rates ofspawning females. During the comparison,catch rates of spawning females were low (meanof 0.05 animals/pot) and the variances relativelylarge so it is not surprising that no significantdifference (at the 5% level) could be detected between the catch per pot lift of spawning femalesby the research vessel's pots and the catch perpot lift of spawning females by commercial fishermen's pots. However, additional calibration ofthe research vessel's pots would add confidenceto this conclusion.
Cape
Indian Ocean
AbrolhosMETHODS
The abundance of the several stages in the lifehistory of P. cygnus has been measured by various methods over a number of years. The methods used have reflected the practical problems ofsampling the different stages and have includedcatch and fishing effort data from the commercial fishery for the adult stage, collectors composed of artificial seaweed to catch the puerulusstage, and mark and recapture studies of thejuveniles using baited traps. All ages and yearclasses referred to in this paper relate to the yearof hatching and so include the 9-11 mo larvalphase. For example, the 1969 year class washatched in January-February 1969 and settledas puerulus larvae between September 1969 andJanuary 1970.
puerulus at settlement and those derived frommeasurements of density of juveniles of P. cygnusaged 2 or 3 yr were consistent. However, theyfound survival to recruitment into the fishery didnot mirror the pattern of year-class strength ator soon after settlement. The purpose of thispaper is to examine the changes that take placein the abundance of the various stages in the lifehistory of P. cygnus including data on puerulussettlement and juvenile density and to investigate their interrelationships.
Abundance of the Breeding Stock
The western rock lobster is confined to thewestern coast of Australia from approximatelyNorth West Cape to Cape Naturaliste (Fig. 1).The majority of the commercial catch is takenbetween lat. 28° and 32°S (Sheard 1962). Thecoastal fishery operates from 15 November to 30June of the following year although prior to 1978the coastal season concluded on 14 August eachyear. The Abrolhos Islands fishing season whichextended from 15 March to 14 August prior to1978, now also ends on 30 June.
The abundance of the breeding stock (i.e.,those females carrying external eggs) has beenmeasured since 1966 from research logbook datasupplied on a voluntary basis from about 200boats or 25% of the commercial rock lobster fleet.In addition to catch, fishing effort, and fishinglocality information separated into four depthcategories, Le., 0-10, 10-20, 20-30, and over 30fathoms, each fisherman records his daily catchof numbers of spawning female rock lobsters.
476
MORGAN ET AL.: STOCK AND RECRUITMENT RELATIONSHIPS IN PANULIRUS CYGNUS
Stock Definition
RESULTS
Since there have been several customs adoptedin the designation of year classes in P. cygnus(e.g., Chittleborough 1970; Morgan 1977) a summary of the convention used in this paper willenable the various relationships presented belowto be followed more easily. The convention usedand the major events in the life history of P.cygnus are as follows:
Based on similarities in catch rates from thecommercial fishery, Morgan (1977) concludedthat although some population parameters suchas growth rates, size at first maturity, etc. variedbetween localities, the western rock lobstercould, as a first approximation, be considered asa single, genetically coherent, unit stock. Thisview is reinforced by the studies of Phillips et al.(1979) who demonstrated the wide dispersal of
November, December yearx -l,January, February,and March year x, withmidpoint taken as 1January of year x.
September year x to January year x + 1.
Year x +1 to x +4 and x+5(ages 1 to 4 or 5).
November and Decemberyear x +4 and x+ 5, withthe majority being x +4.
January and February yearx + 6 and x + 7, with themajority being x + 6.
enables the migrating "whites" to be equatedwith the recruits to the fishery.
Estimates of the abundance of the potentialemigrants from the shallow reefs have beenmade by Chittleborough (1970), although a bettermeasure of their abundance is available from thecatch rate (measured as the catch per pot lift) ofthe commercial fishery during November andDecember when practically all of the commercial catch consists of "white" rock lobsters. Information on catch and fishing effort for Novemberand December each year has been taken from thefishermen's monthly returns, which are completed as a condition of the fishing license by allfishermen.
Hatching of eggs
Settlement ofpuerulus larvae
Juveniles oninshore reefs
Migration of"whites" tooffshore areas
Maturity andfirst breeding
Abundance of Juveniles
Density of age groups (ages 2-7 yr) has beenmeasured on shallow test reefs at Garden Island(since 1965) and Seven Mile Beach (since 1970),using the single census trap-mark-recapturemethod described by Chittleborough (1970).These test reefs are adjacent to the collectorsused to catch the puerulus stage.
Abundance of Recruits tothe Fishery
Abundance of the Puerulus Stage
Phillips (1972) showed that the last larvalstage, the puerulus, of P. cygnus could be captured using collectors composed of artificial seaweed moored at the surface within the protectionof the coastal reefs. Subsequent stlldies by Phillips and Hall (1978) have shown that the catchesfrom these collectors provide a measure of therelative strength of settlement from year toyear.
All collectors used in this study were as described by Phillips (1972). The collectors werechecked monthly after each new moon periodwhen most puerulus settled. All settlement tookplace at the puerulus stage. The western rocklobsters were removed from the collectors eitheras puerulus or after they had molted into verysmall postpuerulus juveniles. Since the planktonic period is 9-11 mo, settlement occurs between September of the year of hatching and thefollowing January.
During late November of each year, largenumbers of immature, newly molted, pale colored rock lobsters migrate into deeper waterfrom the shallow water inshore reefs (which aregenerally inaccessible to fishermen) where theyhave spent the previous 4 or 5 yr. This offshoremovement normally lasts through Decemberand in all lasts about 6 wk. Since they are newlymolted, their food requirements are high (Chittleborough 1975) and consequently their catchability by baited pots is high (Morgan 1974).During this migration the fishermen catch largequantities of these animals which are locallyknown as the "whites" (George 1958). Although asmall number of animals undergo two or perhaps three "white" phases in theIr life cycle, the"white" phase generally occurs only once duringan individual's lifetime (George 1958), and this
477
the phyllosoma larvae in the eastern IndianOcean. Consequently, in the following analyses asingle stock has been assumed, although latitudinal differences in some population parametershave necessitated a simple division of the fisheryinto areas north of lat. 300 S and south of lat.300 S.
The Breeding Stock
From the research logbook information, it wasevident that spawning rock lobsters were concentrated in the 20-30 fathom depth range withan average of 89.9%of the total catch of spawningfemales each year being taken in this depthrange during the period 1966-80. Year-to-yearvariation was small with the percentage rangingfrom 86.4% in 1971 to 92.1% in 1967. In addition,the majority of spawning female rock lobsters(average of 81.4% for the period 1966-79) werecaptured during January and February eachyear with, again, little year-to-year variation.Accordingly, the catch per pot lift of spawningfemales taken in 20-30 fathoms in January andFebruary each year has been used as a basis forthe calculation of an index of abundance ofspawning females. No adjustment for soak timewas made since catch per pot lift has been shownto be independent of soak time (Morgan 1977).The use of catch per pot lift data as an index ofabundance assumes, of course, that catchabilityremains constant from year to year. Morgan(1974) has shown that catchability varies duringa year in response to molt condition, water temperature, and water salinity. Year-to-yearvariation in catchability of spawning P. cygnus females for January and February is likely to besmall, since it would be expected that these animals would be in an intermolt condition, andyear-to-year temperature and salinity variationon the spawning grounds in January and February is smaH (Morgan and Barker 1979).
The average size of the spawning females varies with locality, being larger in southern areas(Morgan and Barker 1979). Average size information on spawning females has been collectedon a regular basis since the 1971-72 season fromcommercial vessels fishing out of the ports ofDongara, Jurien Bay, Lancelin, and Fremantle(Fig. 1). These data have been previously presented in a series of annual reports on the fishery(e.g., Morgan and Barker 1979). Occasional collections of size composition data of spawning females were made prior to the 1971-72 season,
478
FISHERY BULLETIN: VOL. SO. NO.3
particularly at Jurien Bay and Lancelin (B. K.Bowen, unpubl. data). These two sources of datahave been used to calculate the average size ofspawning female P. cygnus for various years.The relationship between size and fecundity(Morgan 1972) has then been used to calculatethe number of eggs produced by a spawning female rock lobster of this average size. Panuliruscygnus spawns only once per year in most areasin the wild (Morgan 1980b).
Data on the catch rates of spawning female P.cygnus taken in 20-30 fathoms in January andFebruary each year, the mean size of thesespawning females, and the resultant fecundityare shown in Table 1, separated into two areas:north of lat. 300 S and south of lat. 300 S.
Index of Abundance ofSpawning Stock
The most appropriate index of spawning success in P. cygnus is the number of first stage phyllosoma larvae released during the hatching period. However, since it has not been possible tomeasure phyllosoma abundance directly, an indirect measure, utilizing the abundance andfecundity of the spawning females, is necessary.Thus the total number of first stage phyllosomalarvae released is approximately equal to (totalnumber of spawning females) X (their averagefecundity).
The number ofspawningfemales in each of thetwo coastal areas (north and south of lat. 300 S)may be estimated from their catch rate (a measure of density) multiplied by the area of thespawning grounds. The area of the spawninggrounds for coastal localities north and south oflat. 300 S is given in Table 2. Thus, for example, ameasure of the total number of spawning femalesnorth of lat. 300 S in 1966 is given by 0.44 (fromTable 1) X 6,690 (from Table 2) = 2,943.6. Itshould be noted that this measure gives a relative, not an absolute, figure for the numbers ofspawning females since a knowledge of the catchability coefficient per unit area, q, would benecessary to convert catch rate (c/g) into absolutenumbers (N) by using the relationship
qXNclg =--
A
where A = area of the spawning grounds.
Catchability has been measured at the Abrol-
MORGAN ET AL.: STOCK AND RECRUITMENT RELATIONSHIPS IN PANULIRUS CYGNUS
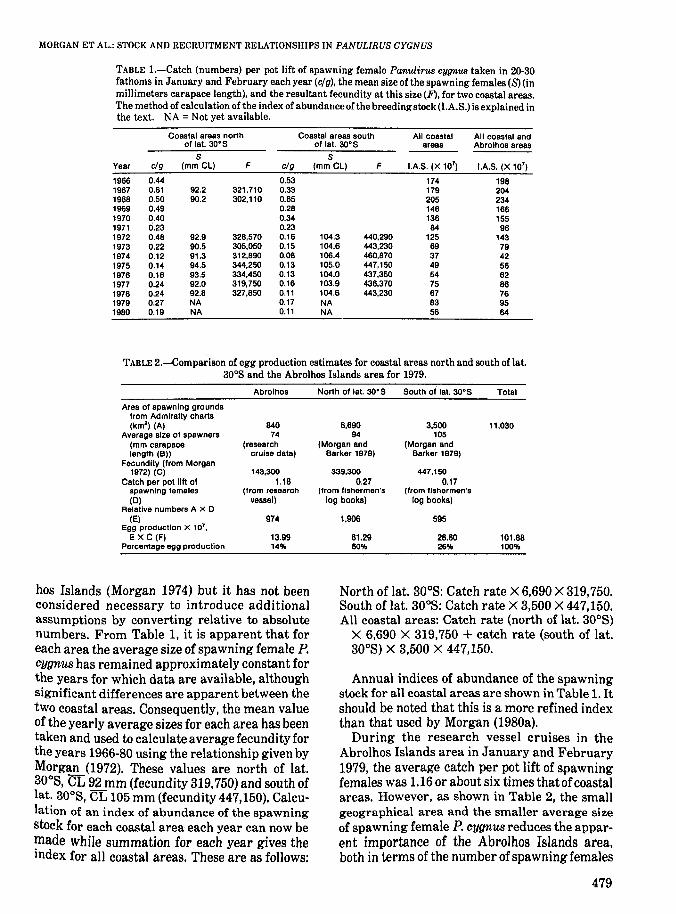
TABLE I.-Catch (numbers) per pot lift of spawning female Panulirus eygnWl taken in 20-30fathoms in January and February each year (elg). the mean size of the spawning females (8) (inmillimeters carapace length), and the resultant fecundity at this size (F). for two coastal areas.The method of calculation of the index of abundance of the breedingstock (I.A.S.) is explained inthe text. NA = Not yet available.
Coastal areas north Coastal areas south All coastal All coastal andof lat. 30·S of lat. 3O·S areas Abrolhos areas
S SYear clg (mm Cl) F clg (mmCl) F lAS. (X 107
) lAS. (X 107)
1966 0.44 0.53 174 1981967 0.61 92.2 321.710 0.33 179 2041968 0.50 90.2 302,110 0.65 205 2341969 0.49 0.28 146 1661970 0.40 0.34 136 1551971 6.23 0.23 84 961972 0.48 92.9 328,570 0.18 104.3 440,290 125 1431973 0.22 90.5 305,050 0.15 104.6 443,230 69 791974 0.12 91.3 312,890 0.08 106.4 460,870 37 421975 0.14 94.5 344,250 0.13 105.0 447,150 49 581976 0.16 93.5 334,450 0.13 104.0 437,350 54 621977 0.24 92.0 319,750 0.16 103.9 436,370 75 861978 0.24 92.8 327,850 0.11 104.6 443,230 67 761979 0.27 NA 0.17 NA 83 951980 0.19 NA 0.11 NA 56 64
TABLE 2.-Comparison of egg production estimates for coastal areas north and south of lat.300 S and the Abrolhos Islands area for 1979,
Abrolhos North of lat. 3O·S South of' lat. 30·S Total
Area of spawning groundsfrom Admiralty charts(km2
) (A) 840 6,690 3,500 11,030Average size of spawners 74 94 105
(mm carapace (research (Morgan and (Morgan andlength (B» cruise data) Barker 1979) Barker 1979)
Fecundity (from Morgan1972) (C) 143,300 339,300 447,150
Catch per pot lilt of 1.18 0.27 0.17spawning females (from research (from fishermen's (from fishermen's(0) vessel) log books) log books)
Reiative numbers A X 0(E) 974 1,906 595
Egg production X 107,
EXC (F) 13.99 61.29 28.80 101.88Percentage egg production 14% 60% 26% 100%
hos Islands (Morgan 1974) but it has not beenconsidered necessary to introduce additionalassumptions by converting relative to absolutenumbers. From Table 1, it is apparent that foreach area the average size of spawning female P.cygnus has remained approximately constant forthe years for which data are available, althoughsignificant differences are apparent between thetwo coastal areas. Consequently. the mean valueof the yearly average sizes for each area has beentaken and used to calculate average fecundity forthe years 1966-80 using the relationship given byMorgan (1972). These values are north of lat.30
0S, CL 92 mm (fecundity 319,750) and south of
lat. 300 S, CL 105 mm (fecundity 447,150). Calculation of an index of abundance of the spawningstock for each coastal area each year can now bemade while summation for each year gives theindex for all coastal areas. These are as follows:
North of lat. 300 S: Catch rate X 6.690 X 319,750.South of lat. 300 S: Catch rate X 3,500 X 447,150.All coastal areas: Catch rate (north of lat. 300 S)
X 6,690 X 319,750 + catch rate (south of lat.300 S) X 3,500 X 447,150.
Annual indices of abundance of the spawningstock for all coastal areas are shown in Table 1. Itshould be noted that this is a more refined indexthan that used by Morgan (1980a).
During the research vessel cruises in theAbrolhos Islands area in January and February1979. the average catch per pot lift of spawningfemales was 1.16 or about six times that ofcoastalareas. However, as shown in Table 2, the smallgeographical area and the smaller average sizeof spawning female P. cygnus reduces the apparent importance of the Abrolhos Islands area,both in terms of the number of spawning females
479
and their egg production, when compared withthe coastal areas.
The Abrolhos Islands area, therefore, contributed only about 14% of total egg production in1979. No data on the catch rates of spawning females at the Abrolhos Islands are available foryears other than 1979, so it has had to be assumedthat the Abrolhos Islands area contributed 14%of the total egg production in each year from1966, although year-to-year variation in the geographical distribution of settling puerulus larvae will no doubt change this value to someextent. The index of abundance of the spawningstock for all coastal and Abrolhos Islands areashas therefore been estimated by multiplying thecoastal index for each year by 1.14. These valuesare also shown in Table 1.
Abundance of Puerulus Stage
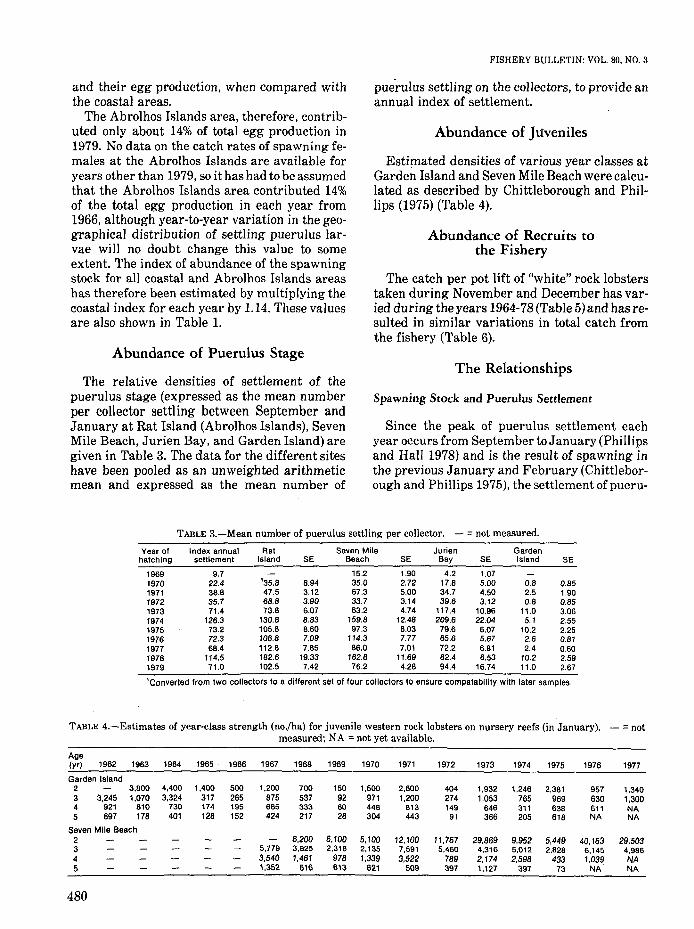
The relative densities of settlement of thepuerulus stage (expressed as the mean numberper collector settling between September andJanuary at Rat Island (Abrolhos Islands), SevenMile Beach, Jurien Bay, and Garden Island) aregiven in Table 3. The data for the different siteshave been pooled as an unweighted arithmeticmean and expressed as the mean number of
FISHERY BULLETIN: VOL. 80, NO.3
pue'rulus settling on the collectors, to provide anannual index of settlement.
Abundance of Juveniles
Estimated densities of various year classes atGarden Island and Seven Mile Beach were calculated as described by Chittleborough and Phillips (1975) (Table 4).
Abundance of Recruits tothe Fishery
The catch per pot lift of "white" rock lobsterstaken during November and December has varied during the years 1964-78 (Table 5) and has resulted in similar variations in total catch fromthe fishery (Table 6).
The Relationships
Spawning Stock and Pueculus Settlement
Since the peak of puerulus settlement eachyear occurs from September to January (Phillipsand Hall 1978) and is the result of spawning inthe previous January and February (Chittleborough and Phillips 1975), the settlement of pueru-
TABLE 3.-Mean number of puerulus settling per collector. - = not measured.
Year of Index annual Rat Seven Mile Jurien Gardenhatching settlement Island SE Beach SE Bay SE Island SE
1969 9.7 15.2 1.90 4.2 1.071970 22.4 '35.8 8.94 35.0 2.72 17.8 5.00 0.8 0.851971 38.8 47.5 3.12 67.3 5.00 34.7 4.50 2.5 1.901972 35.7 68.8 3.90 33.7 3.14 39.6 3.12 0.8 0.851973 71.4 73.8 6.07 83.2 4.74 117.4 10.96 11.0 3.061974 126.3 130.8 8.83 159.8 12.48 209.6 22.04 5.1 2.551975 73.2 105.8 8.60 97.3 6.03 79.6 6.07 10.2 2.251976 72.3 106.8 7.09 114.3 7.77 65.6 5.67 2.6 0.811977 68.4 112.8 7.85 86.0 7.01 72.2 6.81 2.4 0.601978 114.5 182.6 19.33 182.8 11.69 82.4 6.53 10.2 2.591979 71.0 102.5 7.42 76.2 4.28 94.4 16.74 11.0 2.67
'Converled from two collectors to a different set of four COllectors 10 ensure compalability with laler samples.
TABLE 4.-Estimates of year-class strength (no.jha) for juvenile western rock lobsters on nursery reefs (in January). - =notmeasured; NA =not yet available.
Age(yr) 1962 1963 1964 1965 1966 1967 1968 1969 1970 1971 1972 1973 1974 1975 1976 1977
Garden Island2 3,800 4,400 1,400 500 1.200 700 150 1,500 2,600 404 1,932 1,246 2,381 957 1,3403 3,245 1,070 3,324 317 265 875 537 92 971 1,200 274 1,053 765 969 630 1,3004 921 810 730 174 195 685 333 60 448 813 149 646 311 638 611 NA5 697 178 401 128 152 424 217 28 304 443 91 366 205 618 NA NA
Seven Mile Beach2 6,200 6,100 5,100 12,100 11,767 29,869 9,952 5,449 40,163 29,5033 5,779 3,825 2,318 2,135 7,591 5,460 4,316 5,012 2,828 6,145 4,9864 3,540 1,461 978 1,339 3,522 789 2,174 2,598 433 1,039 NA5 1,352 616 613 621 509 397 1,127 397 73 NA NA
480
MORGAN ET AL.: STOCK AND RECRUITMENT RELATIONSHIPS IN PANULIRUS CYGNUS
TABLE 6.-Total catch for the western rock lobster fishery.
TABLE 5.-Catch (kg) per pot lift of rock lobsterstaken by the commercial fishery during Novemberand December for the years 1964-79.
Tolal calch Tolal calchSeason (kg X 10') Season (kg X 10')
1965-66 8.120 1973-74 6.7801966-67 8.635 1974-75 8.8771967-68 9.853 1975-76 8.7311968-69 8.078 1976-77 9.2811969-70 6.918 1977-78 10.7421970-71 8.013 1978-79 11.4291971-72 8.171 1979-80 10.6981972-73 6.809
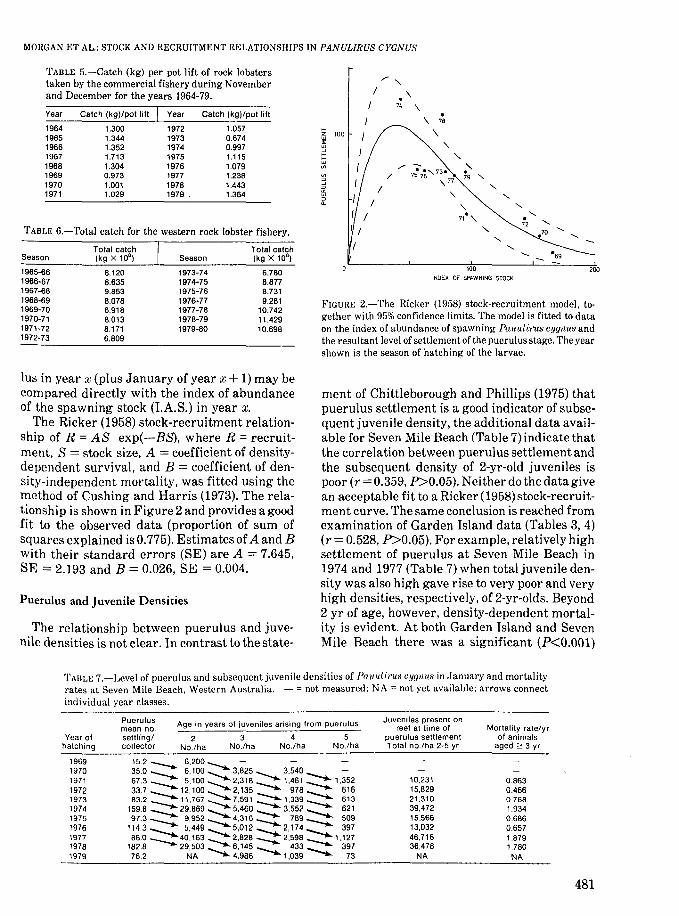
FIGURE 2.-The Ricker (1958) stock-recruitment model, together with 95% confidence limits. The model is fitted to dataon the index of abundance of spawning Panulil'us cygnus andthe resultant level of settlement of the puerulus stage. The yearshown is the season of hatching of the larvae.
200
"-"-
"-......
0......
72 ......"-
070 "-
"- "-......
069
100
INDEX OF SPAWNING STOCK
,..-"/ \
/ 7: \o
I \ 78
I \I "-
"-I ,..". ~ .'73e .'
{ /75
78 \77 79
/I "-/ ,1 / nO,I //
,..~ 100>:
~VJ
VJ
:lffiii'
1.0570.6740.9971.1151.0791.2381.4431.364
Catch (kg)/polliftYear
19721973197419751976197719781979 .
1.3001.3441.3521.7131.3040.9731.0011.029
Catch (kg)/pol liftYear
19641965196619671968196919701971
Ius in year x (plus January of year x + 1) may becompared directly with the index of abundanceof the spawning stock (LA.S.) in year x.
The Ricker (1958) stock-recruitment relationship of R = AS exp(-BS), where R = recruitment, S = stock size, A = coefficient of densitydependent survival, and B = coefficient of density-independent mortality, was fitted using themethod of Cushing and Harris (1973). The relationship is shown in Figure 2 and provides a goodfit to the observed data (proportion of sum ofsquares explained is 0.775). Estimates of A and Bwith their standard errors (SE) are A = 7.645,SE = 2.193 and B = 0.026, SE = 0.004.
Puerulus and Juvenile Densities
The relationship between puerulus and juvenile densities is not clear. In contrast to the state-
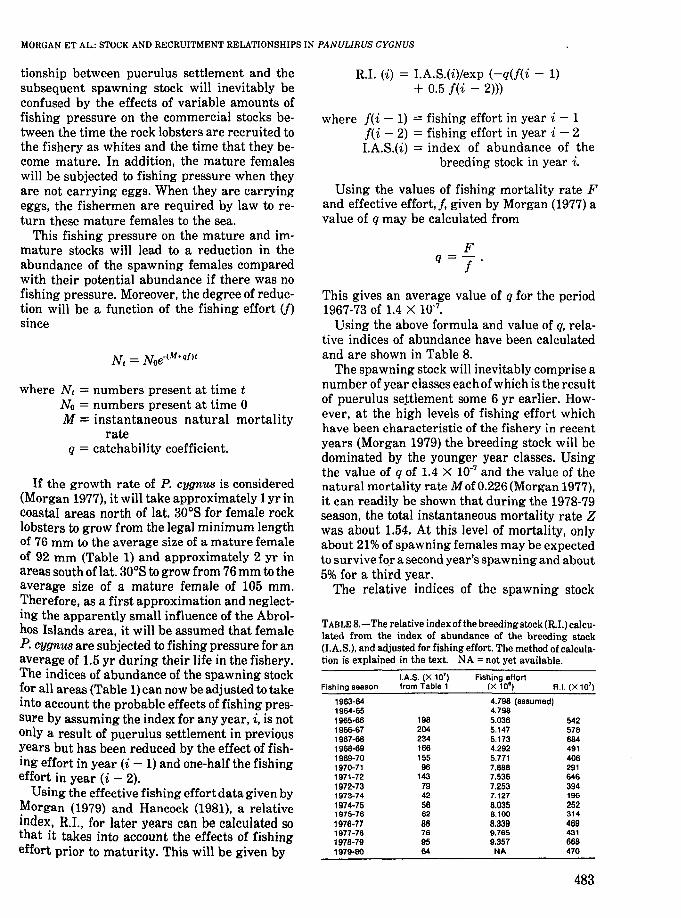
ment of Chittleborough and Phillips (1975) thatpuerulus settlement is a good indicator of subsequent juvenile density, the additional data available for Seven Mile Beach (Table 7) indicate thatthe correlation between puerulus settlement andthe subsequent density of 2-yr-old juveniles ispoor (r = 0.359, P>0.05). Neither do the data givean acceptable fit to a Ricker (1958) stock-recruitment curve. The same conclusion is reached fromexamination of Garden Island data (Tables 3, 4)(r = 0.528, P>0.05). For example, relatively highsettlement of puerulus at Seven Mile Beach in1974 and 1977 (Table 7) when total juvenile density was also high gave rise to very poor and veryhigh densities, respectively, of 2-yr-olds. Beyond2 yr of age, however, density-dependent mortality is evident. At both Garden Island and SevenMile Beach there was a significant (P<O.OOl)
TAIlL~; 7.-Level of puerulus and subsequent juvenile densities of Panull:rus cygnus in January and mortalityrates at Seven Mile Beach. Western Australia. - = not measured; NA = not yet available; arrows connectindividual year classes.
Age in years of juveniles arising from puerulus
Year ofhatching
Puerulusmean no.settlinglcollector
2No.lha
3No.lha
4No.lha
5No.lha
Juveniles present onreef at lime of
puerulus settlementTolal no.lha 2-5 yr
Mortality ratelyrof animals
aged 23 yr
19691970197119721973197419751976197719781979
15.2 --... 6,200.............. -35.0 --.... 6,100 3,825~ 3,540 -.... -67.3 --... 5,100 2,318 -........ 1,461 -.... 1 ,352337 --.... 12.100 2,135 -........ 978 -.... 61683.2 --... 11,767 7.591 -....... 1,339 -.... 613
159.8 --.... 29,869 5,460 -....... 3,552 -..... 62197.3 ---.. 9,952 4.316 -....... 789 509
1143 --. 5,449 5,012 -........ 2,174 -.... 39786.0 --... 40.163 2.828 -....... 2.598 --..... 1 ,127
182.8 29,503"",--. 6,145 -........ 433 __ , 39776.2 NA ~ 4,986 1,039 ~ 73
10,23115,82921.31039,47215.56613,03246,71636,478
NA
0.8630.4660.7681.9340.6860.6571.8791.780
NA
481
correlation between total density of juveniles onthe test reefs and annual mortality rate.
Puerulus Settlement/Juvenile Densities andRecruitment to the Fishery
Chittleborough and Phillips (1975) examinedthe relationship between the density of largerjuveniles on the coastal reefs during the latterpart of the year and the success of the commercial white fishery in adjacent waters. They foundthat, although density-dependent mortality during the juvenile phase ensures reasonably constant recruitment to the fishery over a widerange of initial year-class strengths, in someyears the level of puerulus settlement may be inadequate (Le., below the holding capacity of theshallow-water reefs), and poor recruitment to thefishery may result. They reported that from thedata available at that time only the incidence ofparticularly poor year classes could be used topredict the relative success of the "white" fishery,Le., to forecast poor future recruitment to thefishery.
Thus, as reported by Hancock (1971), following the low settlement of puerulus larvae on thecollectors in 1969-70 (the hatchings of JanuaryMarch 1969) and low density ofearly juveniles, itwas predicted by Chittleborough and Phillips in1971 (Anonymous 1974) that low catch levelswould be likely in 1972-73 and even lower levelslikely at the opening of the 1973-74 season (Le.,the "whites" of November and December 1973).This prediction was borne out by the catches ofthese 2 years (Anonymous 1974), the white season of 1973 being the poorest on record, particularly in the Fremantle area (reflecting trendsobserved in the Garden Island research area).
It was pointed out by Chittleborough and Phillips (1975) that the appearance of a very strongsettlement, such as that resulting from the hatchings of 1974 at Seven Mile Beach, did not necessarily mean that a high level of recruitment tothe fishery could be predicted for the 1977-78and 1978-79 seasons. The preceding year classeswere relatively strong so that the year class of1974 faced intense competition and high mortality while on the "nursery" reefs. Nevertheless,the 1978 "white" catch rate was the second highest on record.
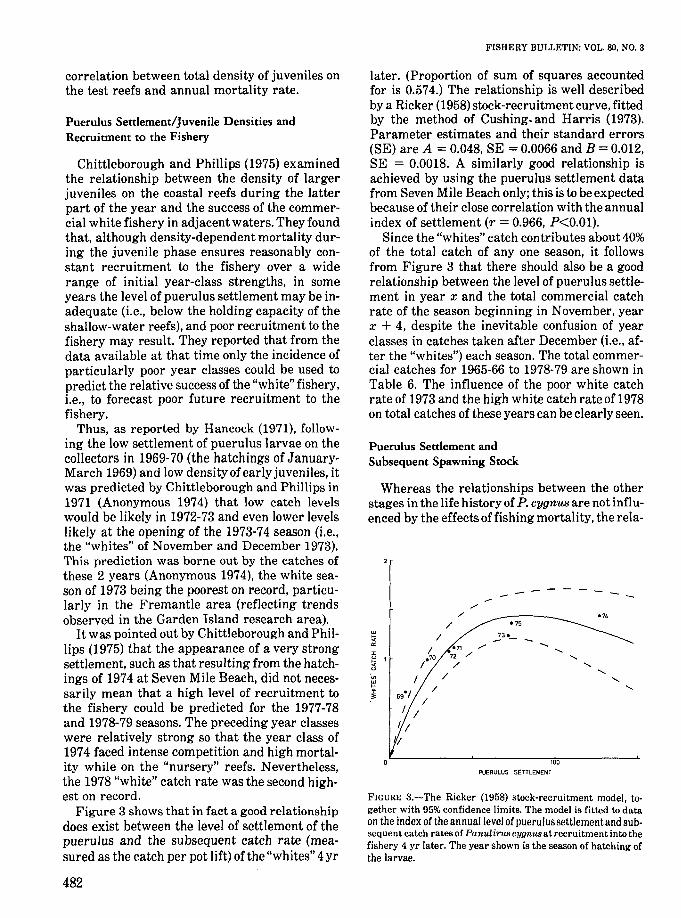
Figure 3 shows thatin fact a good relationshipdoes exist between the level of settlement of thepuerulus and the subsequent catch rate (measured as the catch per pot lift) of the "whites" 4yr
482
FISHERY BULLETIN: VOL. 80, NO.3
later. (Proportion of sum of squares accountedfor is 0.574.) The relationship is well describedby a Ricker (1958) stock-recruitment curve, fittedby the method of Cushing. and Harris (1973).Parameter estimates and their standard errors(SE) are A = 0.048, SE = 0.0066 and B = 0.012,SE = 0.0018. A similarly good relationship isachieved by using the puerulus settlement datafrom Seven Mile Beach only; this is to be expectedbecause of their close correlation with the annualindex of settlement (r = 0.966, P<0.01).
Since the "whites" catch contributes about 40%of the total catch of anyone season, it followsfrom Figure 3 that there should also be a goodrelationship between the level of puerulus settlement in year x and the total commercial catchrate of the season beginning in November, yearx + 4, despite the inevitable confusion of yearclasses in catches taken after December (Le., after the "whites") each season. The total commercial catches for 1965-66 to 1978-79 are shown inTable 6. The influence of the poor white catchrate of 1973 and the high white catch rate of 1978on total catches of these years can be clearly seen.
Puerulus Settlement andSubsequent Spawning Stock
Whereas the relationships between the otherstages in the life history of P. cygnus are not influenced by the effects of fishing mortality, the rela-
// 074
/ 075w
/73 __
:; -a:071 /
I / /.......
u/0
70 72 .......
5 / ......'Vl /
......w / "-I- I ......~ 69
0/
I/ /
/ /
'I
'00PUERUlUS SETTLEMENT
FIGURE 3.-The Ricker (1958) stock-recruitment model, together with 95% confidence limits. The model is fitted to dataon the index of the annual level of pueru!us settlementand subsequent catch rates of Panulirus cygnus at recruitment into thefishery 4 yr later. The year shown is the season of hatching ofthe larvae.
MORGAN ET AL.: STOCK AND RECRUITMENT RELATIONSHIPS IN PANULIRUS CYGNUS
R.L (i) = LA.S.(i)/exp (-q(f(i - 1)+ 0.5 f(i - 2)))
Using the values of fishing mortality rate Fand effective effort, f, given by Morgan (1977) avalue of q may be calculated from
542578684491406
.291646394196252314469431688470
4.798 (assumed)4.7985.0365.1475.1734.2925.7717.8887.5367.2537.1278.0358.1006.3399.7659.357
NA
19820423416615596
1437942568266769564
lAS. (X 107) Fishing effort
from Table 1 (X 10') R.I. (X 107)
1963-641964·651965-661966-671967-681968-691969-701970-711971-721972-731973-741974·751975-761976-771977-781978-791979-80
Fishing season
TABLE B.-The relative index of the breedingstock (R.I.) calculated from the index of abundance of the breeding stock(I.A.S.), and adjusted for fishing effort. The method of calculation is explained in the text. NA = not yet available.
where f(i - 1) = fishing effort in year i-If(i - 2) = fishing effort in year i - 2LA.S.(i) = index of abundance of the
breeding stock in year i.
This gives an average value of q for the period1967-73 of 1.4 X 10⁻⁷
•
Using the above formula and value of q, relative indices of abundance have been calculatedand are shown in Table 8.
The spawning stock will inevitably comprise anumber of year classes eachofwhich is the resultof puerulus se~tlement some 6 yr earlier. However, at the high levels of fishing effort whichhave been characteristic of the fishery in recentyears (Morgan 1979) the breeding stock will bedominated by the younger year classes. Usingthe value of q of 1.4 X 10⁻⁷ and the value of thenatural mortality rate M of 0.226 (Morgan 1977),it can readily be shown that during the 1978-79season, the total instantaneous mortality rate Zwas about 1.54. At this level of mortality, onlyabout 21%of spawning females may be expectedto survive for a second year's spawning and about5% for a third year.
The relative indices of the spawning stock
where Nt = numbers present at time tNo = numbers present at time 0M = instantaneous natural mortality
rateq = catchability coefficient.
tionship between puerulus settlement and thesubsequent spawning stock will inevitably beconfused by the effects of variable amounts offishing pressure on the commercial stocks between the time the rock lobsters are recruited tothe fishery as whites and the time that they become mature. In addition, the mature femaleswill be subjected to fishing pressure when theyare not carrying eggs. When they are carryingeggs, the fishermen are required by law to return these mature females to the sea.
This fishing pressure on the mature and immature stocks will lead to a reduction in theabundance of the spawning females comparedwith their potential abundance if there was nofishing pressure. Moreover, the degree of reduction will be a function of the fishing effort (j)since
If the growth rate of P. cygnus is considered(Morgan 1977), it will take approximately 1yr incoastal areas north of lat. 300 S for female rocklobsters to grow from the legal minimum lengthof 76 mm to the average size of a mature femaleof 92 mm (Table 1) and approximately 2 yr inareas south of lat. 300 S to grow from 76 mm to theaverage size of a mature female of 105 mm.Therefore, as a first approximation and neglecting the apparently small influence of the Abrolhos Islands area, it will be assumed that femaleP. cygnus are subjected to fishing pressure for anaverage of 1.5 yr during their life in the fishery.The indices of abundance of the spawning stockfor all areas (Table 1) can now be adjusted to takeinto account the probable effects of fishing pressure by assuming the index for any year, i, is notonly a result of puerulus settlement in previousyears but has been reduced by the effect of fishing effort in year (i - 1) and one-half the fishingeffort in year (i - 2).
Using the effective fishing effort data given byMorgan (1979) and Hancock (1981), a relativeindex, R.I., for later years can be calculated sothat it takes into account the effects of fishingeffort prior to maturity. This will be given by
483
FISHERY BULLETIN: VOL. 80, NO.3
DISCUSSION
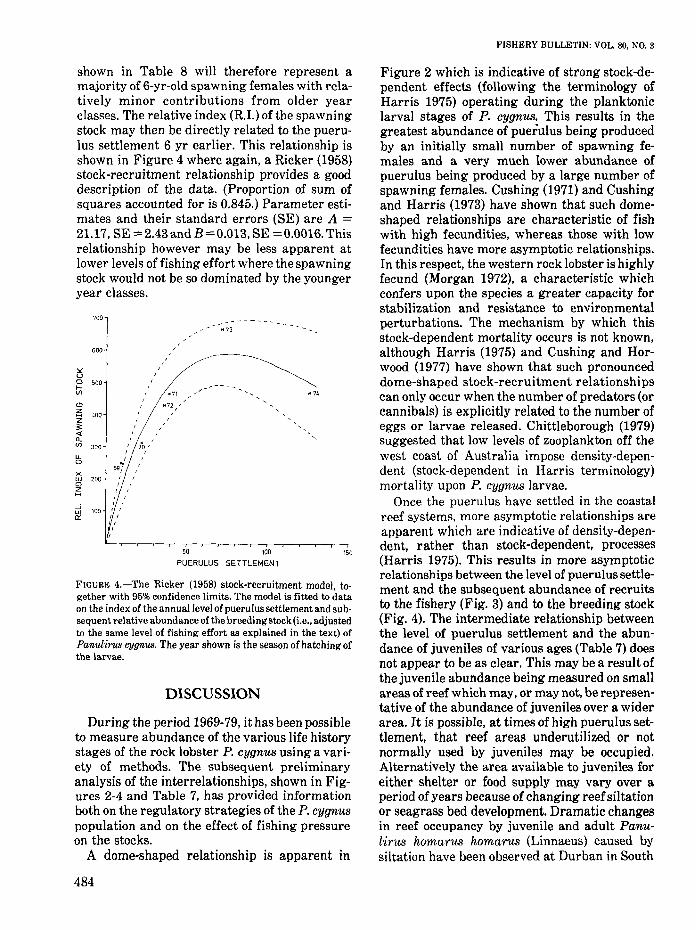
FIGURE 4.-The Ricker (1958) stock-recruitment model, together with 95% confidence limits. The model is fitted to dataon the index of the annual level of puerulus settlement and subsequent relative abundance of the breedingstock (i.e., adjustedto the same level of fishing effort as explained in the text) ofPanulirus (JJJ(JI'tus. The year shown is the season of hatching ofthe larvae.
During the period 1969-79, it has been possibleto measure abundance of the various life historystages of the rock lobster P. cygnus using a variety of methods. The subsequent preliminaryanalysis of the interrelationships, shown in Figures 2-4 and Table 7, has provided informationboth on the regulatory strategies of the P. cygnuspopulation and on the effect of fishing pressureon the stocks.
A dome-shaped relationship is apparent in
Figure 2 which is indicative of strong stock-dependent effects (following the terminology ofHarris 1975) operating during the planktoniclarval stages of P. cygnus. This results in thegreatest abundance of pueiulus being producedby an initially small number of spawning females and a very much lower abundance ofpuerulus being produced by a large number ofspawning females. Cushing (1971) and Cushingand Harris (1973) have shown that such domeshaped relationships are characteristic of fishwith high fecundities, whereas those with lowfecundities have more asymptotic relationships.In this respect, the western rock lobster is highlyfecund (Morgan 1972), a characteristic whichconfers upon the species a greater capacity forstabilization and resistance to environmentalperturbations. The mechanism by which thisstock-dependent mortality occurs is not known,although Harris (1975) and Cushing and Horwood (1977) have shown that such pronounceddome-shaped stock-recruitment relationshipscan only occur when the number of predators (orcannibals) is explicitly related to the number ofeggs or larvae released. Chittleborough (1979)suggested that low levels of zooplankton off thewest coast of Australia impose density-dependent (stock-dependent in Harris terminology)mortality upon P. cygnus larvae.
Once the puerulus have settled in the coastalreef systems, more asymptotic relationships areapparent which are indicative of density-dependent, rather than stock-dependent, processes(Harris 1975). This results in more asymptoticrelationships between the level of puerulus settlement and the subsequent abundance of recruitsto the fishery (Fig. 3) and to the breeding stock(Fig. 4). The intermediate relationship betweenthe level of puerulus settlement and the abundance of juveniles of various ages (Table 7) doesnot appear to be as clear. This may be a result ofthe juvenile abundance being measured on smallareas of reef which may, or may not, be representative of the abundance of juveniles over a widerarea. It is possible, at times of high puerulus settlement, that reef areas underutilized or notnormally used by juveniles may be occupied.Alternatively the area available to juveniles foreither shelter or food supply may vary over aperiod of years because of changing reefsiltationor seagrass bed development. Dramatic changesin reef occupancy by juvenile and adult Panulirus homarus homarus (Linnaeus) caused bysiltation have been observed at Durban in South
'so50 ,00
PUERULUS SETTLEMENT
700 -------- _73
600
'"U0 '00l-V> ·71 _n
0 ~72 /1'/
Z400 /
Z/
, ,:;: ,« , ,ll..V> 300
U.0
xW 2000
~
-" 100Wa:
shown in Table 8 will therefore represent amajority of 6-yr-old spawning females with relatively minor contributions from older yearclasses. The relative index (R.I.) of the spawningstock may then be directly related to the pueruIus settlement 6 yr earlier. This relationship isshown in Figure 4 where again, a Ricker (1958)stock-recruitment relationship provides a gooddescription of the data. (Proportion of sum ofsquares accounted for is 0.845.) Parameter estimates and their standard errors (SE) are A =21.17, SE =2.43andB=0.013, SE =0.0016. Thisrelationship however may be less apparent atlower levels of fishing effort where the spawningstock would not be so dominated by the youngeryear classes.
484
MORGAN ET AL.: STOCK AND RECRUITMENT RELATIONSHIPS IN PANULIRUS CYGNUS
Africa by Smale (1978), and similarly Booth(1979) suggested that varying survival and possible changes in location of juveniles may occurin Jasus edwardsii (Hutton) at Castlepoint inNew Zealand as a result of periodic sand movement in the area. Chittleborough (1975) haspointed out that the availability of food on thecoastal reefs is probably the predominant factorlimiting the survival of juveniles. Studies inprogress should provide further data to examinethis hypothesis. The role of competitors andpredators also requires further examination.
Because of the close relationship between thelevel of puerulus settlement and subsequentabundance of recruits to the fishery, the level ofpuerulus settlement can be taken as an indicatorof the likely level of the future fishery. The datafor Seven Mile Beach, which is near the center ofthe range of population, appears to provide asatisfactory basis for this prediction up to thepresent time. However, its use as the sole measure of puerulus settlement would introduceassumptions regarding the future puerulus distribution. The densities of juveniles on small testreefs do not appear at this time to provide a goodbasis for estimation of the future recruitment tothe fishery.
The combination of a stock-dependent relationship between breeding stock and puerulussettlement and a density-dependent relationshipbetween puerulus and breeding stock will resultin a population which has only one stable equilibrium point of abundance (Paulik 1973), the location of this point being dependent upon the fishing mortality rate on spawning and prespawninganimals. If fishing effort is high the number ofspawning female rock lobsters will be reduced,which, from Figure 2, will lead to a higher levelof puerulus settlement. This higher level ofpuerulus settlement will then result in a;good recruitment of "whites" to the fishery. The possibility of incorporating the relationships betweenthese various life history stages into a productionmodel of the fishery is therefore feasible andwarrants further investigation. However sincethe results presented here are preliminary, inthe sense that a longer time series of data wouldbe needed to add confidence to the relationshipsshown in Figures 2-4, such a production modelmay at present be premature.
ACKNOWLEDGMENTS
Thanks to Norm Hall for computingassistance
and to D. A. Hancock and D. H. Cushing for theirvaluable comments on earlier drafts.
LITERATURE CITED
ANONYMOUS.
1974. 1973-74 rock lobster season poorest for five years.Aust. Fish. 33(9):2.
BOOTH, J. D.1979. Settlement of the rock lobster, Jasus edwardsii
(Decapoda: Palinuridae), at Castlepoint, New Zealand.N.Z. J. Mar. Freshwater Res. 13:395-406.
CHITTLEBOROUGH, R. G.
1970. Studies on recruitment in the Western Australianrock lobster Panulirus longipes cygnus George: densityand natural mortality of juveniles. Aust. J. Mar.Freshwater Res. 21:131-148.
1975. Environmental factors affecting growth and survival of juvenile western rock lobsters Panulirus longipes (Milne-Edwards). Aust. J. Mar. Freshwater Res.26:177-196.
1979. Natural regulation of the population of Panuliruslongipes cygnus George and responses to fishing pressure. Rapp. P.-V. Reun. Cons. Perm. Int. Explor. Mer175:217-221.
CHITTLEBOROUGH, R. G., AND B. F. PHILLIPS.
1975. Fluctuations of year-class strength and recruitment in the western rock lobster Panulirus longipes(Milne-Edwards). Aust. J. Mar. Freshwater Res. 26:317-328.
CHITTLEBOROUGH, R. G., AND L. R. THOMAS.
1969. Larval ecology of the Western Australian marinecrayfish, with notes upon other panulirid larvae fromthe eastern Indian Ocean. Aust. J. Mar. FreshwaterRes. 20:199-223.
CUSHING, D. H.1971. The dependence of recruitment on parent stock in
different groups of fishes. J. Cons. Perm. Int. Explor.Mer 33:340-362.
CUSHING, D. H., AND J. G. K. HARRIS.
1973, Stock and recruitment and the problem of densitydependence. Rapp. P.-V. Reun. Cons. Perm. Int. Explor. Mer 164:142-155.
CUSHING, D. H., AND J. W. HORWOOD.
1977. Development of a model of stock and recruitment.In J. H. Steele (editor), Fisheries mathematics, p. 21-35.Acad, Press, Lond.
GEORGE, R. W.
1958. The status of the "white" crayfish in Western Australia. Aust. J. Mar. Freshwater Res. 9:537-545.
HANCOCK, D. A.1971. Rock lobsters: what of the future? Fish. Ind.
News Servo 4:47.1973. The relationship between stock and recruitment in
exploited invertebrates. Rapp. P.-V. Reun. Cons.Perm. Int. Explor. Mer 164:113-131.
1981. Research for management of the rock lobster fishery of Western Australia. Proc. Gulf Caribb. Fish.Inst.33:207-229.
HARRIS, J. G. K.1975. The effect of density-dependent mortality on the
shape of the stock and recruitment curve. J. Cons.Perm. Int. Exp!or. Mer 36:144-149.
LARKIN, P. A., R. F. RALEIGH, AND N. J. WILIMOVSKY.
1964. Some alternative premises for constructing theo-
485
retical reproduction curves. J. Fish. Res. Board Can.21:477-484.
MORGAN, G. R.1972. Fecundity in the western rock lobster Panulirus
longipes cygnus (George) (Crustacea: Decapoda: Palinuridae). Aust. J. Mar. Freshwater Res. 23:133-141.
1974. Aspects of the population dynamics of the westernrock lobster, Panulirus cygnus George. II. Seasonalchanges in the catchability coefficient. Aust. J. Mar.Freshwater Res. 25:249-259.
1977. Aspects of the population dynamics of the westernrock lobster and their role in management. Ph.D.Thesis, Univ. Western Australia.
1979. Increases in fishing effort in a limited entry fishery - the western rock lobster fishery 1963-1976. J.Cons. Perm. Int. Explor. Mer 39:82-87.
1980a. Population dynamics and management of thewestern rock lobster fishery. Mar. Policy 4:52-60.
198Gb. Population dynamics of spiny lobsters. In J. S.Cobb and B. F. Phillips (editors), The biology and management of lobsters, p. 189-217. Acad. Press, N.Y.
MORGAN, G. R., AN[) E. H. BARKER.1979. The western rock lobster fishery, 1975-1976.
Western Aust. Dep. Fish. Wild\. Rep. 33:1-18.PARRISH, B. B. (editor).
1973. Fish stocks and recruitment. Rapp. P.-V. Reun.Cons. Perm. Int. Explor. Mer 164, 372 p.
PAULIK, G. J.1973. Studies of the possible form of the stock-recruit-
486
FISHERY BULLETIN: VOL. SO. NO.3
ment curve. Rapp. P.-V. Reun. Cons. Perm. Int. Explor. Mer 164:302-315.
PHILLIPS, B. F.1972. A semi-quantitative collector of the puerulus lar
vae of the western rock lobster Panulirwl longipes cygnus George (Decapoda, Palinuridae). Crustaceana22:147-154.
PHILLIPS, B. F., P. A. BROWN, D. W. RIMMER, AND D. D.REID.
1979. Distribution and dispersal of the phyllosoma larvae of the western rock lobster, Panulirwl cygnus, in thesouth-eastern Indian Ocean. Aust. J. Mar. FreshwaterRes. 30:773-783.
PHILLIPS. B. F., AND N. G. HALL.1978. Catches of puerulus larvae on collectors as a mea
sure of natural settlement of the western rock lobsterPanulirus cygnus George. Aust. CSIRO Div. Fish.Oceanogr. Rep. 98, 18 p.
RICKER, W. E.1958. Handbook of computations for biological statistics
of fish populations. Fish. Res. Board Can., Bull. 119,300 p.
SHEARD, K.1962. The Western Australian crayfishery 1944-1961,
(Paterson Brokensha: Perth). 107 p.SMALE, M. J.
1978. Migration, growth and feeding in the Natal rocklobster Panulirwl homarwl (Linnaeus). Oceanogr. Res.Inst. (Durban) Invest. Rep. 47:1-56.