Stochastic modelling of liability accumulation risk · Stochastic modelling of liability ... has a...
45
Emerging Risk Report 2017 Innovation Series Society and Security Stochastic modelling of liability accumulation risk
-
Upload
vuongkhanh -
Category
Documents
-
view
227 -
download
1
Transcript of Stochastic modelling of liability accumulation risk · Stochastic modelling of liability ... has a...

Emerging Risk Report 2017 Innovation Series
Society and Security
Stochastic modelling of liability accumulation risk

02
Stochastic modelling of liability accumulation risk
About Lloyd’s Lloyd's is the world's specialist insurance and
reinsurance market. Under our globally trusted name, we
act as the market's custodian. Backed by diverse global
capital and excellent financial ratings, Lloyd's works with
a global network to grow the insured world –building
resilience of local communities and strengthening global
economic growth.
With expertise earned over centuries, Lloyd's is the
foundation of the insurance industry and the future of it.
Led by expert underwriters and brokers who cover more
than 200 territories, the Lloyd’s market develops the
essential, complex and critical insurance needed to
underwrite human progress.
About Arium Arium specializes in developing risk models primarily for
the reinsurance industry. It tackles problems that are data
poor and considered complex or unpredictable. Its
approach is underpinned by the use of adapted
techniques such as networks and dependency modelling.
Arium has been developing a liability exposure
management tool to help underwriters and management
understand and manage casualty accumulation risk.
Arium is part of AIR Worldwide, a Verisk Analytics
business.
Key Contacts Trevor Maynard
Head of Innovation
Anna Bordon
Executive, Emerging Risks and Research
For general enquiries about this report and Lloyd’s
work on emerging risks, please contact
Robin Wilkinson
CEO, Arium and Vice President and Managing Director
of Casualty Analytics, AIR Worldwide
Florian Loecker
CTO, Arium and Director of Casualty Analytics, AIR
Worldwide
About the authors Trevor Maynard PhD, MSc, FIA has degrees in pure
maths and statistics and is a Fellow of the Institute of
Actuaries. He is Head of Innovation at Lloyd’s including
responsibility for horizon scanning and emerging risks.
Subjects covered in recent years include: the economic
and social implications of a food system shock; the
effects of cyber-attacks on the US energy grid and an
exploration of aggregation modelling methods for liability
risks. He is co-chairman of OASIS, an open modelling
platform for catastrophe models and sits on the Board of
the Lighthill Risk Network.
Robin Wilkinson is CEO of Arium and a Vice President
and Managing Director of Casualty Analytics for AIR
Worldwide. She has been involved in risk analysis since
the early 1990s. She previously served as Head of Legal
Services at British Airways Plc and Associate Counsel at
United International Pictures. She was admitted to the
New York City Bar Association in 1982.
Florian Loecker is Chief Technology Officer at Arium and
a Director of Casualty Analytics for AIR Worldwide. He
has a background in Economics and Applied
Mathematics. He has previously held positions at Lloyd’s
and Willis Re focusing on exposure management and
catastrophe analytics.

03
Stochastic modelling of liability accumulation risk
Acknowledgements Advisen Ltd, for the use of their casualty loss data to
support the historical analysis in the paper.
David D. Brooks, Managing Director, XLCatlin
Leadership Council
Jonathan Clark, Global Head of Business Solutions
Claims, SCOR Global P&C
Caroline Dunn, Underwriting Performance – EL and GL,
Lloyd’s
Julia Graham, Technical Risk Manager, AIRMIC
Michael Kingston, Lawyer, a representative of the
International Union of Marine Insurance at the
International Maritime Organisation
Amanda Langer, Senior Claims Manager, SCOR SE
David Mann, former liability underwriter, founder of
eponymous DP Mann
Graham McKean, former liability broker, former chairman
of BMS, non-executive and expert witness
Andrew Newman, Co-President, Global Head of casualty
& CEO Alternative Strategies, Willis Re
Robert Robinson, Managing Director, Aon Global Risk
Consulting
Brian Samuelson, Head of Risk Aggregation and
Analytics, XLCatlin
David Singh, Head of Exposure Management, MS Amlin
Alice Underwood, Head of Analytics, Willis Re North
America
Paul D Western, U.S. Casualty & Specialty Lines Product
Lead, MS Amlin
Lloyd’s project team Trevor Maynard, Head of Innovation
Keith Smith, Manager, Emerging Risks and Research
Lucy Stanbrough, Executive, Emerging Risks and Research
Anna Bordon, Executive, Emerging Risks and Research
Danial Khan, Analyst, Risk Aggregation
Lloyd’s of London Disclaimer
This report has been co-produced by Lloyd's for general
information purposes only. While care has been taken in
gathering the data and preparing the report Lloyd's does
not make any representations or warranties as to its
accuracy or completeness and expressly excludes to the
maximum extent permitted by law all those that might
otherwise be implied.
Lloyd's accepts no responsibility or liability for any loss or
damage of any nature occasioned to any person as a
result of acting or refraining from acting as a result of, or
in reliance on, any statement, fact, figure or expression of
opinion or belief contained in this report. This report does
not constitute advice of any kind.
© Lloyd’s 2017
All rights reserved
Arium’s disclaimer The methodology and data used in this report is based in
part on government sourced economic and supply chain
data enhanced and owned by Arium and historical data
made available by Advisen. This report is not intended to
constitute professional advice as to any particular
situation. Arium does not make any representations or
warranties about the accuracy or completeness of the
methodology set out in the report, and the report is not
intended to be used as a forecast or prediction. Arium
specifically disclaims any and all responsibilities,
obligations and liability with respect to any decisions or
advice made or given as a result of the methodology or
use thereof and disclaims all warranties, whether express
or implied, with respect to the report, including but not
limited to, warranties of non-infringement, merchantability
or fitness for a particular purpose.
Advisen’s disclaimer This report has been produced by Lloyd’s and Arium
based, in part, on data provided by Advisen. Advisen
makes no representations or warranties regarding such
report, or regarding the data used in the report including,
but not limited to, the accuracy, completeness, quality,
non-infringement, or fitness for a particular purpose.
Date of publication: March 2017
Contents 04
Stochastic modelling of liability accumulation risk
Contents
Executive summary ............................................................................................................................................................... 5
1. Introduction ....................................................................................................................................................................... 8
2. Concepts ........................................................................................................................................................................... 9
2.1 Selected scenarios analysis ........................................................................................................................................ 9
2.2. Economic parameters .............................................................................................................................................. 11
2.3 Trade maps ............................................................................................................................................................... 11
3. Process ........................................................................................................................................................................... 12
3.1 Expert interviews ....................................................................................................................................................... 12
3.2 Historical data ............................................................................................................................................................ 12
3.3 Relevant industries .................................................................................................................................................... 13
4. Shapes ............................................................................................................................................................................ 14
4.1 Corporate shape ........................................................................................................................................................ 16
4.2. Infrastructure/operational shape .............................................................................................................................. 19
4.3 Product/service shapes ............................................................................................................................................. 21
4.3.1 Component/ingredient shape ....................................................................................................................... 22
4.3.2 Finished product/service shape .................................................................................................................... 25
4.4 The “professional claw” ............................................................................................................................................. 29
5. Use of parameterised shapes to generate future scenarios ........................................................................................... 30
5.1 Food-related scenarios .............................................................................................................................................. 30
5.2 Emerging risk: sugar ................................................................................................................................................. 30
6. Outputs ........................................................................................................................................................................... 32
6.1 Exceedance probability curves ................................................................................................................................. 32
6.2 Heat maps and clusters ............................................................................................................................................. 32
7. Conclusions .................................................................................................................................................................... 33
8. Appendix ......................................................................................................................................................................... 34
8.1 Scenarios used .......................................................................................................................................................... 34
8.2 Experts’ observations ................................................................................................................................................ 35
8.3 Occurrence probabilities............................................................................................................................................ 41
8.4 Technical implementation of the concept .................................................................................................................. 41
References .......................................................................................................................................................................... 44

Executive summary 05
Stochastic modelling of liability accumulation risk
Executive summary
Background
Casualty risks accumulate in a variety of different ways
and affect many lines of business. This makes it
challenging for insurers to approach casualty risk
accumulation systematically.
This new Lloyd’s report, published in partnership with
Arium, addresses this challenge by using a new
stochastic approach to modelling liability exposure. This
innovative methodology, designed by Arium and Lloyd’s,
can be used for all classes of business in any given
portfolio, and allows for a systematic assessment of risk
accumulation.
By mapping the economic relationships that reflect the
journey of products and services through the economy,
the methodology creates liability “storm tracks” that
provide a new, structured way of analysing casualty
events, regardless of risk classification.
A systematic approach to modelling liability risk
The report shows how this approach can be used to map
loss scenarios, and finds that certain economic
relationships form patterns consistent with specific types
of loss scenarios. The model uses these patterns to
create building blocks, called “shapes”.
Shapes provide a way of categorising casualty events
based on a company’s business activities, such as
products and services, operations and infrastructure, all
of which may be affected by a casualty event. This data
is then augmented with loss characteristics of the liability
risks connected with these activities in order to create a
stochastic model.
Importantly, the report finds that many different scenarios
can be modelled using a handful of shape types, where
each type can be characterised according to the
parameters of the loss event. Breaking liability risk
modelling down into blocks, which mirrors the way in
which natural catastrophe risks are divided into region-
perils, makes it easier to carry out the modelling.
Executive summary 06
Stochastic modelling of liability accumulation risk
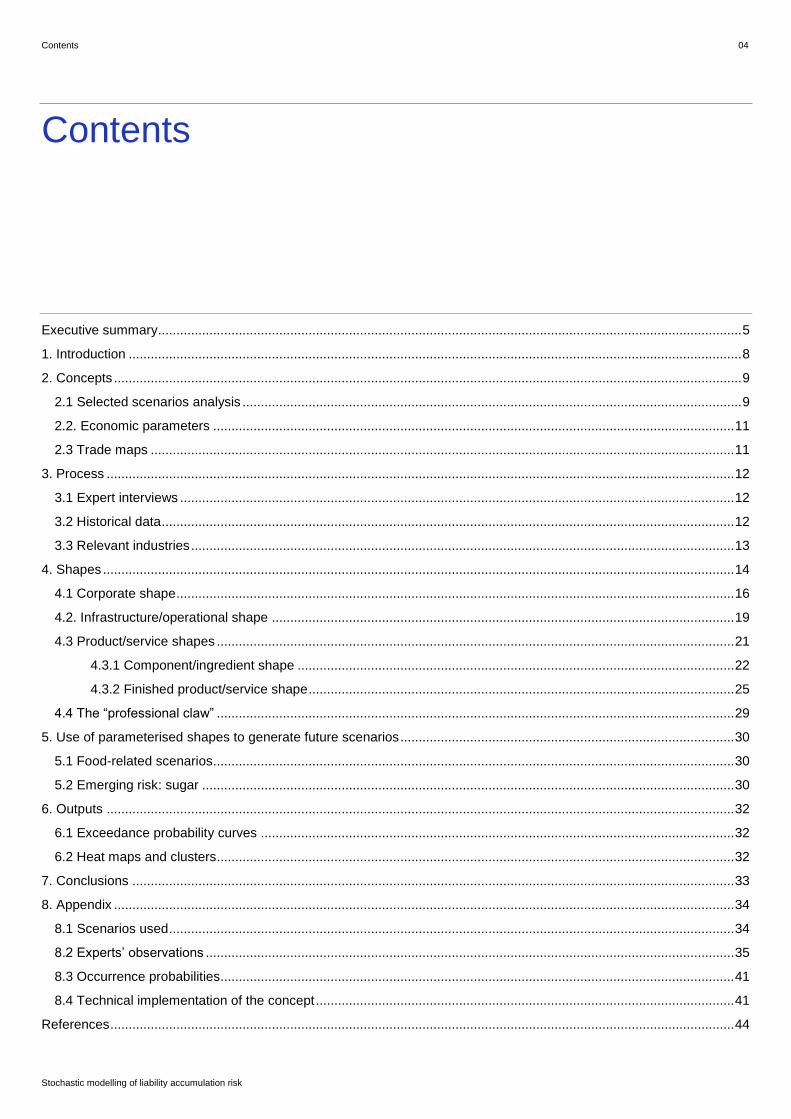
For example, companies affected by fraud or misleading
accounting practices are often the hub of a network of
professional advisers, bankers and competitors, all whom
could be pulled into litigation at varying levels by affected
stakeholders. The shapes for such events (of which
Enron and WorldCom are examples) look like Figure 1
and Figure 2, respectively, and show the bankrupt
company in the centre and its service providers as nodes
around the hub. The arrows show the direction and
relative strength of trade.
Figure 1: Company implosions, Enron
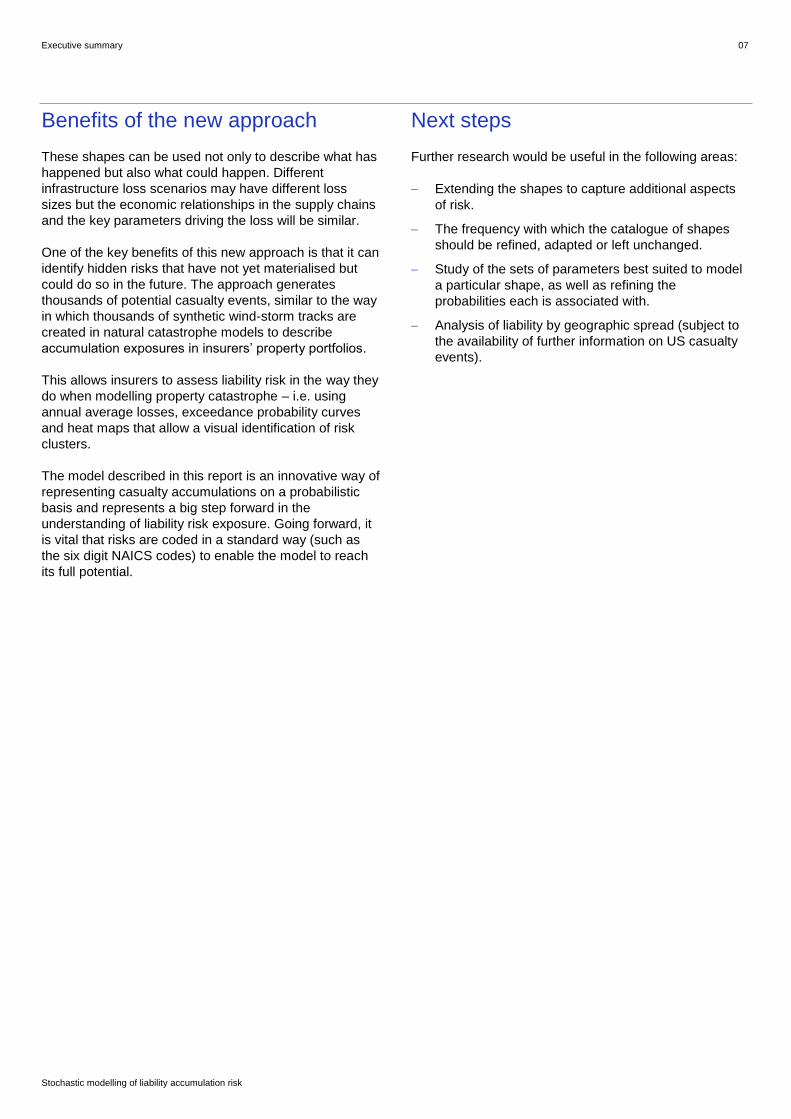
Figure 2: Company implosion, Worldcom
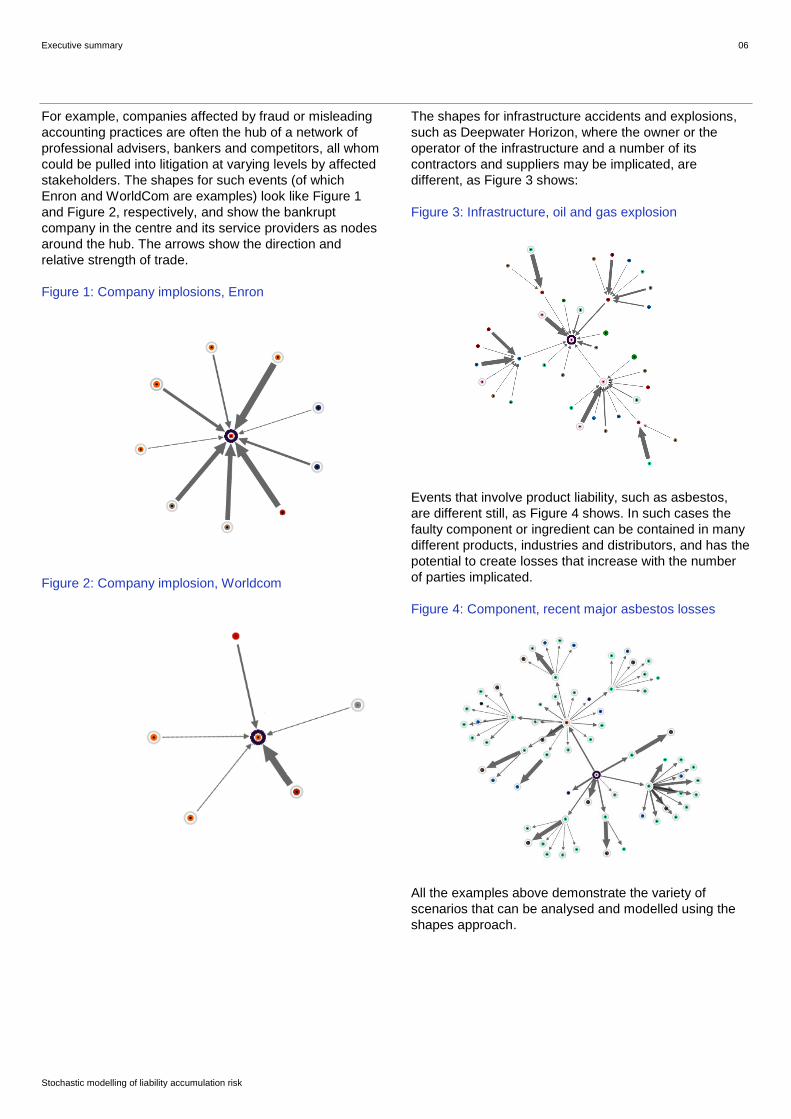
The shapes for infrastructure accidents and explosions,
such as Deepwater Horizon, where the owner or the
operator of the infrastructure and a number of its
contractors and suppliers may be implicated, are
different, as Figure 3 shows:
Figure 3: Infrastructure, oil and gas explosion
Events that involve product liability, such as asbestos,
are different still, as Figure 4 shows. In such cases the
faulty component or ingredient can be contained in many
different products, industries and distributors, and has the
potential to create losses that increase with the number
of parties implicated.
Figure 4: Component, recent major asbestos losses
All the examples above demonstrate the variety of
scenarios that can be analysed and modelled using the
shapes approach.
Executive summary 07
Stochastic modelling of liability accumulation risk
Benefits of the new approach
These shapes can be used not only to describe what has
happened but also what could happen. Different
infrastructure loss scenarios may have different loss
sizes but the economic relationships in the supply chains
and the key parameters driving the loss will be similar.
One of the key benefits of this new approach is that it can
identify hidden risks that have not yet materialised but
could do so in the future. The approach generates
thousands of potential casualty events, similar to the way
in which thousands of synthetic wind-storm tracks are
created in natural catastrophe models to describe
accumulation exposures in insurers’ property portfolios.
This allows insurers to assess liability risk in the way they
do when modelling property catastrophe – i.e. using
annual average losses, exceedance probability curves
and heat maps that allow a visual identification of risk
clusters.
The model described in this report is an innovative way of
representing casualty accumulations on a probabilistic
basis and represents a big step forward in the
understanding of liability risk exposure. Going forward, it
is vital that risks are coded in a standard way (such as
the six digit NAICS codes) to enable the model to reach
its full potential.
Next steps
Further research would be useful in the following areas:
Extending the shapes to capture additional aspects
of risk.
The frequency with which the catalogue of shapes
should be refined, adapted or left unchanged.
Study of the sets of parameters best suited to model
a particular shape, as well as refining the
probabilities each is associated with.
Analysis of liability by geographic spread (subject to
the availability of further information on US casualty
events).
1. Introduction 08
Stochastic modelling of liability accumulation risk
1. Introduction
The basic ideas underlying this paper flow from the report
“Emerging Liability Risks - Designing liability scenarios”
written jointly by Arium and Lloyd’s in 2015 (Lloyd’s,
2015). Its message was that a suitable framework for
modelling liability risks is given by the notion of supply
chains, which may be seen as the storm tracks, and by
the faultlines of liability risks – their footprint. On this
basis, a methodological framework for deriving insured
losses from given risk scenarios was discussed.
Adding a stochastic extension of the methodology
seemed a natural next step. In simplistic terms,
stochastic models applied in insurance are normally a
large set of risk scenarios, each associated with a certain
probability of occurrence. The goal of this paper is to
discuss a way to generate scenarios in large numbers
and thus create a stochastic approach to liability risk
management. It pivots on the concept of “shapes”, which
are classifications of liability risk capturing its mechanics
in terms of supply chain as well as economic factors. The
mechanics determines the classification and is the key to
generating scenarios. In particular, examining a multitude
of liability scenarios along the lines of the supply chain
methodology pointed to many common features for
certain liability risks. These risks could be then bundled
together in a way that their commonalities would be
preserved, while finding stochastic or deterministic ways
to account for the differences that still persisted.
In this sense, shapes are comparable to “region-perils” in
the natural catastrophe modelling sphere, although the
latter appear less ambiguous, at least at a high level.
Liability modelling, by contrast, has traditionally lacked an
equivalent concept.
Shapes are a collection of:
Rules on how to locate the supply chain that
underlies the risk scenario (its footprint)
Rules on how to determine its size and spread, and
how systemic it is using insurance-relevant
parameters
By using the footprints of historical and emerging
scenarios, input from experts and historical data, it
became clear that only a handful of shapes were
necessary to provide the potential spread and losses
associated with different liability scenarios, whether past,
present or future. These shapes cut across different
liability lines of businesses, different industries, different
types of loss and different jurisdictions. The losses and
parameters for those shapes were either suggested
directly by experts or suggested by historical data, using
expert input to help consider how future losses may differ
from the past. The input obtained from experts was
surprisingly consistent and supported by the historical
data when available. The events modelled to date fell into
corporate, infrastructure/operational, product
component/ingredient, finished product/service shapes
plus a professional/financial services shape that can
adhere to almost any node in the shapes (see Section 4,
p14) for a detailed description of shapes’ characteristics.
Unless specifically referenced, historical data and
information on particular historical scenarios is sourced,
with permission, from Advisen.
.

2, Concepts 09
Stochastic modelling of liability accumulation risk
2. Concepts
2.1 Selected scenarios analysis
The starting point of the methodology is also the most
visual aspect of determining the footprint. A footprint is a
map of the supply and distribution chain implicated in a
certain scenario. This is generated through the
mechanisms prescribed in the shape. Shapes of
scenarios mentioned by experts and modelled historical
scenarios were discussed and studied, and recurrent
patterns were noticed. The underlying labelling of
industries follows the NAICS (North American Industry
Classification System) because it is a granular
classification system and it is used by Federal statistical
agencies to classify businesses and provide statistics
related to the U.S. economy. The NAICS is also currently
used in the Lloyd’s Cyber Core Data Requirements
(Lloyd’s, 2017) and the classification system is kept up to
date.
As mentioned in the 2015 Emerging Liability Risks report:
“…analysis is only good as the data on which it is based”.
Indeed there are challenges around the current state of
data quality in the insurance industry, but with the insured
and insurers’ data currently available along with
augmenting and standardising techniques, insurers
already have a starting point to analyse their liability
portfolio and then produce a more accurate and
comprehensive dataset.
Box 1: Approach concepts
Shape: a model of a supply chain elements and
economic parameters associated with a certain type of
liability event.
Parameter: a characteristic that defines part of the
shape.
Footprint: the supply and distribution chain of parties
implicated in a particular liability event. This is
generated through the mechanisms prescribed in the
shape.
Trade maps: universe of supply and distribution
relationships (at an industry level) in an economy.
Systemic events: systemic event as it is used in this
paper involves a footprint with a large number of
implicated parties in some (or all) industries and also
can involve a large number of industries.
2, Concepts 10
Stochastic modelling of liability accumulation risk
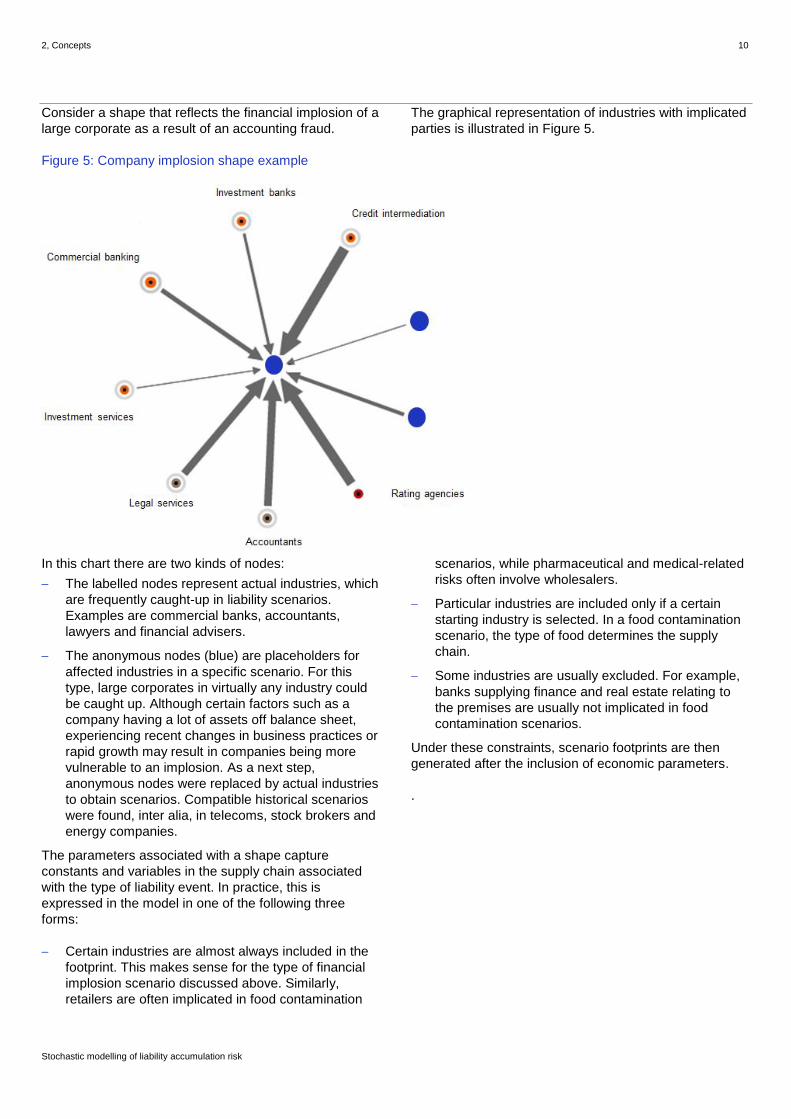
Consider a shape that reflects the financial implosion of a
large corporate as a result of an accounting fraud.
The graphical representation of industries with implicated
parties is illustrated in Figure 5.
Figure 5: Company implosion shape example
In this chart there are two kinds of nodes:
The labelled nodes represent actual industries, which
are frequently caught-up in liability scenarios.
Examples are commercial banks, accountants,
lawyers and financial advisers.
The anonymous nodes (blue) are placeholders for
affected industries in a specific scenario. For this
type, large corporates in virtually any industry could
be caught up. Although certain factors such as a
company having a lot of assets off balance sheet,
experiencing recent changes in business practices or
rapid growth may result in companies being more
vulnerable to an implosion. As a next step,
anonymous nodes were replaced by actual industries
to obtain scenarios. Compatible historical scenarios
were found, inter alia, in telecoms, stock brokers and
energy companies.
The parameters associated with a shape capture
constants and variables in the supply chain associated
with the type of liability event. In practice, this is
expressed in the model in one of the following three
forms:
Certain industries are almost always included in the
footprint. This makes sense for the type of financial
implosion scenario discussed above. Similarly,
retailers are often implicated in food contamination
scenarios, while pharmaceutical and medical-related
risks often involve wholesalers.
Particular industries are included only if a certain
starting industry is selected. In a food contamination
scenario, the type of food determines the supply
chain.
Some industries are usually excluded. For example,
banks supplying finance and real estate relating to
the premises are usually not implicated in food
contamination scenarios.
Under these constraints, scenario footprints are then
generated after the inclusion of economic parameters.
.

1. introduction 11
Stochastic modelling of liability accumulation risk
2.2. Economic parameters
Once a footprint is generated, economic parameters are
added to complete the scenario generation process.
These parameters essentially capture the severity and
spread of a scenario as well as the concentration of
losses in different industries. The most important
examples are:
Size of loss
Distribution of liability between industries (e.g. in
which industries are parties likely to pay most of the
losses).
Number of companies implicated in each industry.
Period of time over which losses materialise.
Relevant jurisdictions.
Depending on the shape, these quantities are either
captured deterministically or by stochastic mechanism,
often through probability distributionsi.
i These distributions are often fitted to historical data and adjusted for
expert input.
2.3 Trade maps
Trade data helps identify the relevant suppliers and
distributors of products and services. This creates the set
of potential supply chain relationships implicated in a
certain type of liability event (see Section 4.3, p21 on
relevant industries on how this set of possible trade
relationships is constrained to the realistic trades for set
of scenarios). Trade relationships can also reveal the
main suppliers of a given industry. Indeed, the total trade
between two industries can be seen as a measure of how
economically important one industry is to the other.
To generate a large number of random credible
scenarios, the shapes are “moved around” the trade
map, so that each synthetic scenario has a starting point
and spreads as per the shape and parameters mentioned
above, constrained by the relevant trade data. The
constraint in the underlying data is that it is necessary to
have a trade from the starting industry to another industry
and from that industry to another, for any industry to be
included in the scenario. For example, with asbestos, if
the product is not sold to shoe manufacturers or to their
suppliers, shoe manufacturers will not be caught in the
scenario.

3. Process 12
Stochastic modelling of liability accumulation risk
3. Process
3.1 Expert interviews
The consultation process engaged a broad variety of
subject experts including casualty brokers, underwriters,
claims managers, lawyers and risk managers in high risk
industries.
All experts referenced various casualty catastrophes,
both historic and emerging. These were then modelled
using the scenario methodology outlined in the 2015
paper (Lloyd’s, 2015). Each interviewee also received a
note of the interview for comment and correction
including a shape for each event for their review. The
scenarios explored are set out later in the paper with
reference to the related shape.
Shapes were parameterised by expert input through
iterative expert interviews, assisted by:
Writing up the narrative as a basis for the next
iteration;
Computer-generated graphics/tables to showcase
quantitative information and prompt further input or
corrections;
Model outputs; and
Historical data.
These initial parameters reflect a plausible set of
assumptions, which will continue to evolve in light of
further input, changes in the socio-economic environment
and to reflect a better understanding of risk.
Whilst the direction of any given observation and which
variable it impacts was often established, and while
historical data provided a useful baseline, the precise
magnitude is much more contentious and often was not
known precisely when creating the model.
Where experts provided non-parametric estimates - for
example in qualitative terms such as low, medium and
high - the model developers used their judgement to
quantify those estimates, but the non-parametric
information helps establish comparative risk. It is
important to note that the process of creating the model
is iterative and model releases will be continually refined,
based upon the initial version.
3.2 Historical data
Historical data used in this paper refers to a set of more than 380,000 liability events researched by Advisen, exceeding US$9 trillion in loss value. The data is classified by risk type and insurance coverages, and group loss events by a common cause of loss.
This data was used in conjunction with input from experts
who commented on the parameterised shapes and
provided opinion on future losses, the kinds of events
that may give rise to large casualty catastrophes, and the
kinds of factors that may drive future events.
Where there were gaps in the parameters, or experts
identified drivers for future loss but could not readily
opine on the size of historic losses, or did not anticipate
that future losses would deviate in nature from historical
losses, the historical data was used as a bridge to
augment the expert input. For example, some experts
thought industrial accidents were largely caused by
human error, and did not anticipate that rates of human
error would change over time, although they
acknowledged that other factors, such as regulation and
risk management, would impact on the frequency and
severity of these events.
3. Process 13
Stochastic modelling of liability accumulation risk
3.3 Relevant industries
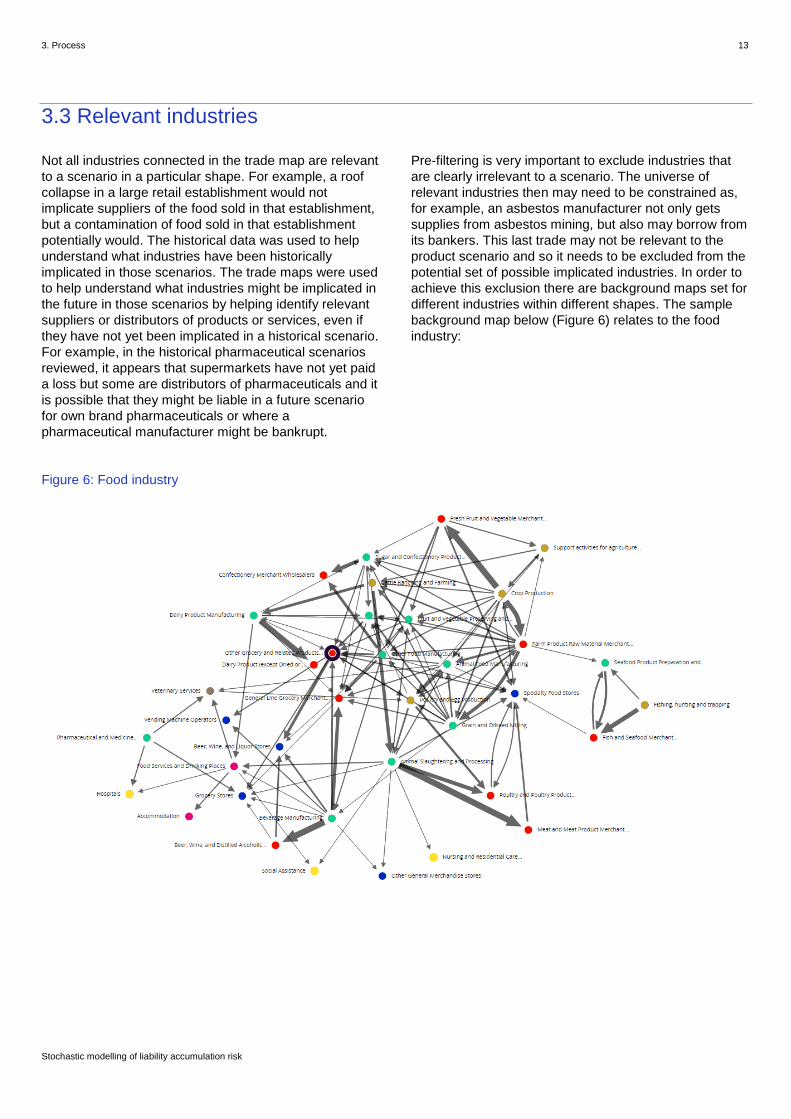
Not all industries connected in the trade map are relevant
to a scenario in a particular shape. For example, a roof
collapse in a large retail establishment would not
implicate suppliers of the food sold in that establishment,
but a contamination of food sold in that establishment
potentially would. The historical data was used to help
understand what industries have been historically
implicated in those scenarios. The trade maps were used
to help understand what industries might be implicated in
the future in those scenarios by helping identify relevant
suppliers or distributors of products or services, even if
they have not yet been implicated in a historical scenario.
For example, in the historical pharmaceutical scenarios
reviewed, it appears that supermarkets have not yet paid
a loss but some are distributors of pharmaceuticals and it
is possible that they might be liable in a future scenario
for own brand pharmaceuticals or where a
pharmaceutical manufacturer might be bankrupt.
Pre-filtering is very important to exclude industries that
are clearly irrelevant to a scenario. The universe of
relevant industries then may need to be constrained as,
for example, an asbestos manufacturer not only gets
supplies from asbestos mining, but also may borrow from
its bankers. This last trade may not be relevant to the
product scenario and so it needs to be excluded from the
potential set of possible implicated industries. In order to
achieve this exclusion there are background maps set for
different industries within different shapes. The sample
background map below (Figure 6) relates to the food
industry:
Figure 6: Food industry

4. Shapes 14
Stochastic modelling of liability accumulation risk
4. Shapes
As mentioned, shapes are an innovative way to categorise casualty events. It is not an imposed categorisation, but one
that emerges, and may continue to emerge, from the events that are modelled. These categories cross different lines of
business, different countries and different industries. Shapes are based on the activities that give rise to the loss such as
the nature of the product or service, whether financial products, goods or services, or operations and infrastructure. The
events modelled to date fell into one of the following footprint shapes, or a variation thereof, plus a “professional claw”.ii
Figure 7: Shapes
Shape Name Description
Corporate Losses: Related to the number of causative parties
Line of business: Professional indemnity, D&O
Systemic: Mostly single, systemic within an industry
Probabilityiii : Stationary
Infrastructure/operational
Losses: Divisible between parties
Line of business: All but primarily general/public liability, employers’ liability/
workers’ comp, environmental
Systemic: Overwhelmingly single, systemic potential within an industry
Probability: Stationary
Product
component/ingredient
Losses: Additive
Line of business: general/public liability, product liability, also employers’
liability/workers’ comp, professional indemnity, environmental
Systemic: between and also within industries
Probability: Non-stationary
ii This refers to professional or financial services that can be provided up and down the supply chain. These services are only a one step link and they
never extend beyond the professional services supplied to their clients.
iii Stationary probabilities are relatively stable over time. Non-stationarity is present when the probability of occurrence depends in a significant fashion
on factors that are time-dependent. For further discussion on probabilities, see Section 8.3 Occurrence probabilities in the Appendix.
4. Shapes 15
Stochastic modelling of liability accumulation risk
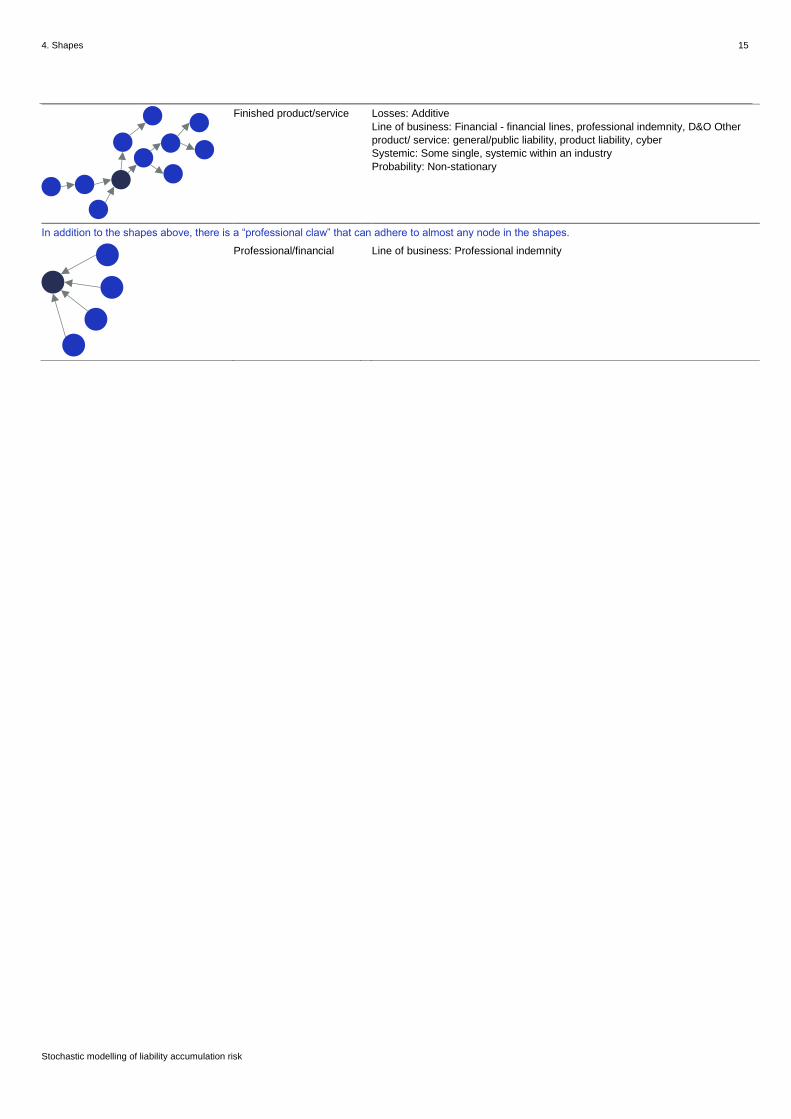
Finished product/service
Losses: Additive
Line of business: Financial - financial lines, professional indemnity, D&O Other
product/ service: general/public liability, product liability, cyber
Systemic: Some single, systemic within an industry
Probability: Non-stationary
In addition to the shapes above, there is a “professional claw” that can adhere to almost any node in the shapes.
Professional/financial Line of business: Professional indemnity

4. Shapes 16
Stochastic modelling of liability accumulation risk
4.1 Corporate shape
This shape emerges from corporate activities, e.g. a
financial wrongdoing, bankruptcy, fraud or securities
class actions, sometimes resulting in the implosion of the
company perpetrating it, and involving its professional
advisers.
Figure 8: Corporate shape
Its associated parameters are:
The losses are proportional to the size of the failed or
sued company.
Most of the losses from a company fraud or
bankruptcy are not systemic, but securities actions
and some failures (e.g. savings and loans crisis),
may be systemic.
The losses are in proportion to the number of
causative implicated companies but will not increase
in proportion to the number of advisers or suppliers
involved.
This scenario could happen in almost any industry but
experts felt was more likely to occur where there were
changes in business practices or rapid growth or
deregulation. Companies with many off-balance sheet
assets were considered to be more vulnerable.
The lines of business usually implicated are professional
indemnity, for financial and professional services, and
also D&O. Scenarios suggested by experts and historical
scenarios analysed include Enron, Worldcom, the
savings and loans crisis of the 1980s and 1990s, MF
Global in 2011 and the great salad-oil swindle of 1963.

4. Shapes 17
Stochastic modelling of liability accumulation risk
4.1.1 Case study: Enron
Figure 9: Enron supply chain and implicated parties (light grey circle)
4.1.2 Scenario summary
In just 15 years, Enron grew from nowhere to be
America's seventh-largest company in 2002, employing
21,000 staff in more than 40 countries and allegedly with
US$63.4bn in assets. But the firm's success turned out to
be based on fraud and the company filed bankruptcy.
Enron was hiding the financial losses of the trading
business and other operations of the company using
mark-to-market accounting. This is used in trading of
securities to determine what the actual value of the
security is at any moment. In Enron's case, the company
would build an asset, such as a power plant, and
immediately claim the projected profit on its books. If the
revenue from the power plant was less than the projected
amount, instead of taking the loss, the company would
then transfer these assets to an off-the-books
corporation, where the loss would go unreported.
Enron shareholders filed a US$40 billion lawsuit after the
company's stock price, which achieved a high of
US$90.75 per share in mid-2000, plummeted to less than
US$1 by the end of November 2001. The US Securities
and Exchange Commission (SEC) began an investigation
and rival Houston competitor Dynegy offered to purchase
the company at a very low price.
The deal failed, and on December 2, 2001, Enron filed for
bankruptcy under Chapter 11 of the United States
Bankruptcy Code. Enron's US$63.4bn in assets made it
the largest corporate bankruptcy in U.S. history until
WorldCom's bankruptcy the year after.
Various competitors (implicated in projects or market
manipulation) and various banks, investment advisers,
accountants, and lawyers were sued as professional
advisers for collusive involvement in fraudulent
transactions with Enron. Enron's auditor, Arthur
Andersen, was found guilty in a US district court of
illegally destroying documents relevant to the SEC
investigation which voided its licence to audit public
companies, effectively closing the business.
Many executives at Enron were indicted for a variety of
charges and some were later given a prison sentence. By
the time the ruling was overturned by the US Supreme
Court, the company had lost the majority of its customers
and had ceased to operate. Employees and shareholders
received limited returns in lawsuits, despite losing billions
in pensions and stock prices.

4. Shapes 18
Stochastic modelling of liability accumulation risk
4.1.3 Correlation: economic loss and starting company
size
In a company implosion such as the Enron scenario
described above the loss amount is correlated to the size
of the imploding company. To model this, one can
connect the economic loss to the company size by
coupling their respective dynamics (i.e. by making one
depend to the other).
A straightforward solution is given by the following two-
steps approachiv:
1. Create a model for company turnover for all
companies in the economy. Turnover is taken
as a proxy for market capitalisation. The model
for turnover does not depend on the economic
loss model associated with the shape.
2. The model for economic loss depends on the
turnover threshold as an input variable. In
particular, larger economic losses are
associated with larger turnover outcomes from
the previous step.
iv In technical terms, this is a two-step procedure where the economic
loss is modelled conditional on the turnover distribution, and both are
assumed to be beta distributions. More specifically, the shape
parameters of the economic loss depend on the turnover, giving the
effect seen in the graph.

4. Shapes 19
Stochastic modelling of liability accumulation risk
4.2. Infrastructure/operational shape
These events arise from business operations (not a
product) that result in infrastructure accidents or
operational losses. The loss, most likely arising from a
single accident, explosion or longer term pollution,
impacts the contractor or owner of the infrastructure and
their suppliers.
Figure 10: Infrastructure/operational shape
The extent of the exposure relates to the nature of the
operation and the infrastructure. For this reason it is
important to differentiate between:
Industrial operations, which result in an accident,
explosion, or pollution involving for example offshore
platforms, power plants, chemical factories, mines,
tend to be larger as they have greater environmental
and pollution potential, and also have the potential to
cause bodily harm to people in the surrounding area
as well as on or inside the infrastructure;
Operations such as passenger ships, passenger
aircraft, hotels, bridges, and tunnels and also injuries
arising from the very nature of the operation itself
(e.g. National Football League (NFL) concussions)
tend to be smaller and cause primarily bodily injury to
those in the transport, infrastructure or building (and
obviously also property damage to that
infrastructure).
Usually both result only in a single loss, not systemic
(except if there is a common mode of failure, perhaps
combined with a cyber-attack) that will be distributed
between the implicated companies and it will not increase
in proportion to the number of parties. No correlation was
found between the number of accounts impacted and the
size of the loss. For example, the Deepwater Horizon
scenario shows a significant loss born by only few
parties.
Almost every line of business could be implicated
especially general/public liability, environmental pollution,
employer’s liability/workmen’s compensation but also
product liability, professional liability, energy, marine, and
even cyber.
This is the only shape with probabilities that are relatively
stable over time (stationary probabilities). This is because
the nature of the events, though manmade, are primarily
based on accidents or explosions arising more from
human error, which is relatively stable, rather than
changes in technologies, regulations or societal norms,
although the degree and effectiveness of risk
management and other mitigation may vary between
industries and jurisdictions.
Experts recognised that regulation tends to correlate with
jurisdiction so the frequency of loss is reduced in
countries with developed regulatory frameworks and,
similarly to property cats where infrastructure can be
made more resilient to earthquakes or hurricanes, risk
management can help limit the severity of infrastructure
events.
Scenarios mentioned by experts and historical scenarios
analysed include Deepwater Horizon, Costa Concordia,
the 2006 Ivory Coast waste dump, the 1981 Hyatt
Regency walkaway collapse, the BP Texas City Refinery
explosion, the 2006 Mecca hostel collapse, the West
Texas Big Spring explosion, NFL concussions, Bhopal,
the Buncefield explosion, the Toulouse Fertiliser
explosion (also known as the Total SA Fertiliser
explosion), Exxon Valdez and the Lac Megantic
derailment.

4. Shapes 20
Stochastic modelling of liability accumulation risk
4.2.1. Case study: Deepwater Horizon
Figure 11: Deepwater Horizon supply chain and implicated parties (light grey circle)
4.2.2 Scenario summary: The Deepwater Horizon explosion occurred on 20 April
2010 and resulted in the world’s largest oil and gas spill.
The incident led to the death of 11 individuals, numerous
personal injuries and the release of millions of gallons of
oil into the Gulf of Mexico. Economic losses to date are
approximately US$52.4 billion and consist of costs for the
extensive four years clean-up, environmental and
economic damages and penalties.
On 20 April, the ultra-deep-water, semi-submersible
mobile offshore oil rig (Deepwater Horizon) experienced
an explosion and a fire, and sank in the Gulf of Mexico,
off the shores of Louisiana. The rig was owned and
operated by Transocean, a Switzerland-based offshore
drilling contractor, and leased to BP.
The blowout and oil spill was caused by a flawed well
plan that did not include enough cement between the
seven-inch production casing and the 9 7/8 inch protection
casing (The Bureau of Ocean Energy Management
Regulation and Enforcement, 2011). The safety-test
failures of the well integrity led to the loss of hydrostatic
control. Ultimately the weakness in the cement design
and testing, quality assurance and risk assessment
caused the blowout to occur (British Petroleum, 2010).
The explosion and fire occurred in spite of specialised oil-
spill prevention equipment called blowout preventer
(BOP) designed to avert this type of disaster. The failure
of the BOP left the well unsecured and leaking from the
marine riser. The amount of oil and gas escaping from
the subsurface well is a matter of dispute, but an
interagency federal panel of scientists led by the US
Geological Survey estimated the spill's size in the range
of 35,000-60,000 barrels of oil a day.
4. Shapes 21
Stochastic modelling of liability accumulation risk
Two separate class-action settlements were agreed
upon. The first compensated individuals and businesses
that suffered private economic loss as a result of the spill
(including lost profits and property damage). The second
compensated people having medical claims in
connection to the spill and also provided them with 21
years of regular medical consultation. In addition, there
were several billion dollars paid in connection with long-
term clean-up issues and payments to states such as
Louisiana, Texas, Florida, and Mississippi for economic
damages (St. Myer, 2015). There was litigation in other
countries such as Mexico and litigations over, for
example, royalties for lost oil that contributed to a
foundation, fines donated to foundations for restoration
work, and harm to endangered or threatened species in
the Gulf (Fausset, 2010).
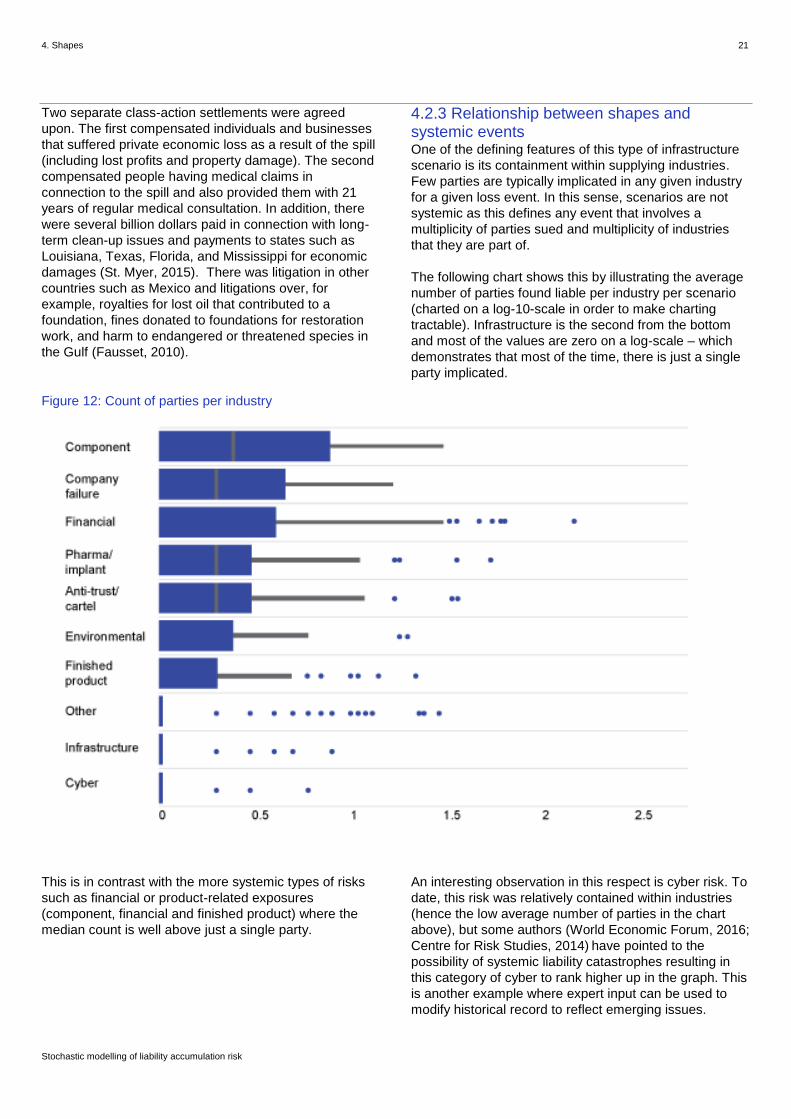
4.2.3 Relationship between shapes and systemic events One of the defining features of this type of infrastructure
scenario is its containment within supplying industries.
Few parties are typically implicated in any given industry
for a given loss event. In this sense, scenarios are not
systemic as this defines any event that involves a
multiplicity of parties sued and multiplicity of industries
that they are part of.
The following chart shows this by illustrating the average
number of parties found liable per industry per scenario
(charted on a log-10-scale in order to make charting
tractable). Infrastructure is the second from the bottom
and most of the values are zero on a log-scale – which
demonstrates that most of the time, there is just a single
party implicated.
Figure 12: Count of parties per industry
This is in contrast with the more systemic types of risks
such as financial or product-related exposures
(component, financial and finished product) where the
median count is well above just a single party.
An interesting observation in this respect is cyber risk. To
date, this risk was relatively contained within industries
(hence the low average number of parties in the chart
above), but some authors (World Economic Forum, 2016;
Centre for Risk Studies, 2014) have pointed to the
possibility of systemic liability catastrophes resulting in
this category of cyber to rank higher up in the graph. This
is another example where expert input can be used to
modify historical record to reflect emerging issues.
4. Shapes 22
Stochastic modelling of liability accumulation risk
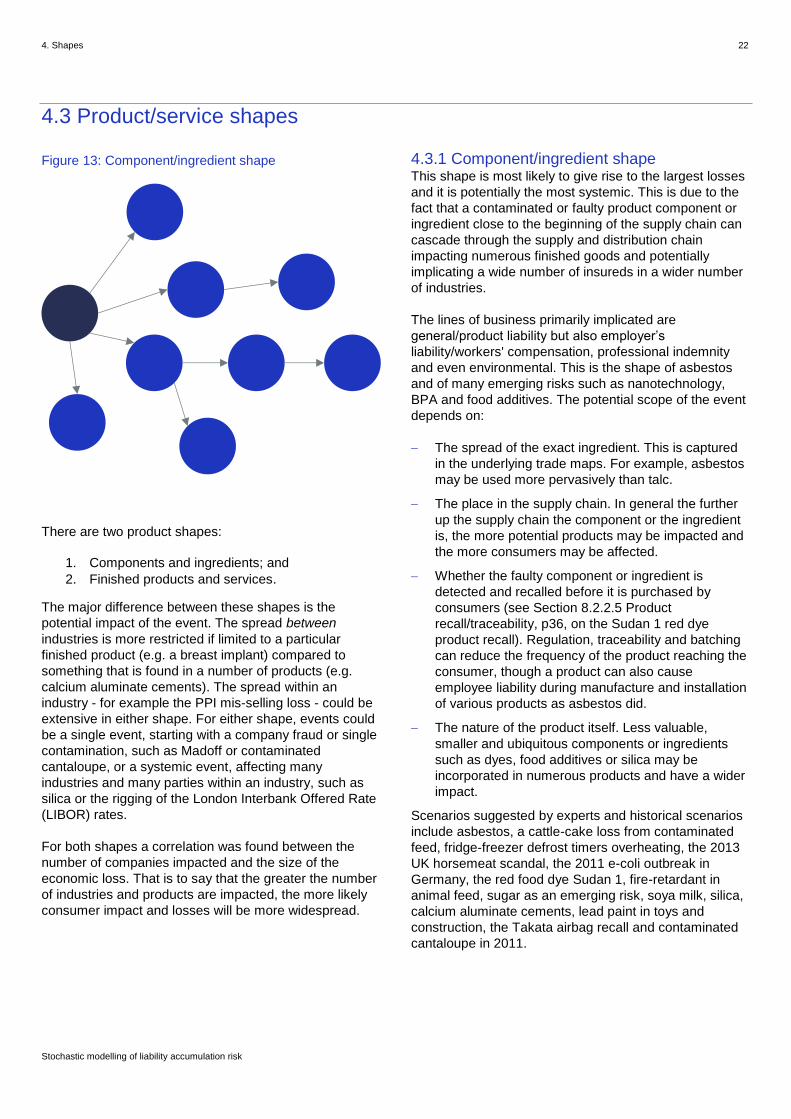
4.3 Product/service shapes
Figure 13: Component/ingredient shape
There are two product shapes:
1. Components and ingredients; and
2. Finished products and services.
The major difference between these shapes is the
potential impact of the event. The spread between
industries is more restricted if limited to a particular
finished product (e.g. a breast implant) compared to
something that is found in a number of products (e.g.
calcium aluminate cements). The spread within an
industry - for example the PPI mis-selling loss - could be
extensive in either shape. For either shape, events could
be a single event, starting with a company fraud or single
contamination, such as Madoff or contaminated
cantaloupe, or a systemic event, affecting many
industries and many parties within an industry, such as
silica or the rigging of the London Interbank Offered Rate
(LIBOR) rates.
For both shapes a correlation was found between the
number of companies impacted and the size of the
economic loss. That is to say that the greater the number
of industries and products are impacted, the more likely
consumer impact and losses will be more widespread.
4.3.1 Component/ingredient shape This shape is most likely to give rise to the largest losses
and it is potentially the most systemic. This is due to the
fact that a contaminated or faulty product component or
ingredient close to the beginning of the supply chain can
cascade through the supply and distribution chain
impacting numerous finished goods and potentially
implicating a wide number of insureds in a wider number
of industries.
The lines of business primarily implicated are
general/product liability but also employer’s
liability/workers' compensation, professional indemnity
and even environmental. This is the shape of asbestos
and of many emerging risks such as nanotechnology,
BPA and food additives. The potential scope of the event
depends on:
The spread of the exact ingredient. This is captured
in the underlying trade maps. For example, asbestos
may be used more pervasively than talc.
The place in the supply chain. In general the further
up the supply chain the component or the ingredient
is, the more potential products may be impacted and
the more consumers may be affected.
Whether the faulty component or ingredient is
detected and recalled before it is purchased by
consumers (see Section 8.2.2.5 Product
recall/traceability, p36, on the Sudan 1 red dye
product recall). Regulation, traceability and batching
can reduce the frequency of the product reaching the
consumer, though a product can also cause
employee liability during manufacture and installation
of various products as asbestos did.
The nature of the product itself. Less valuable,
smaller and ubiquitous components or ingredients
such as dyes, food additives or silica may be
incorporated in numerous products and have a wider
impact.
Scenarios suggested by experts and historical scenarios
include asbestos, a cattle-cake loss from contaminated
feed, fridge-freezer defrost timers overheating, the 2013
UK horsemeat scandal, the 2011 e-coli outbreak in
Germany, the red food dye Sudan 1, fire-retardant in
animal feed, sugar as an emerging risk, soya milk, silica,
calcium aluminate cements, lead paint in toys and
construction, the Takata airbag recall and contaminated
cantaloupe in 2011.
4. Shapes 23
Stochastic modelling of liability accumulation risk
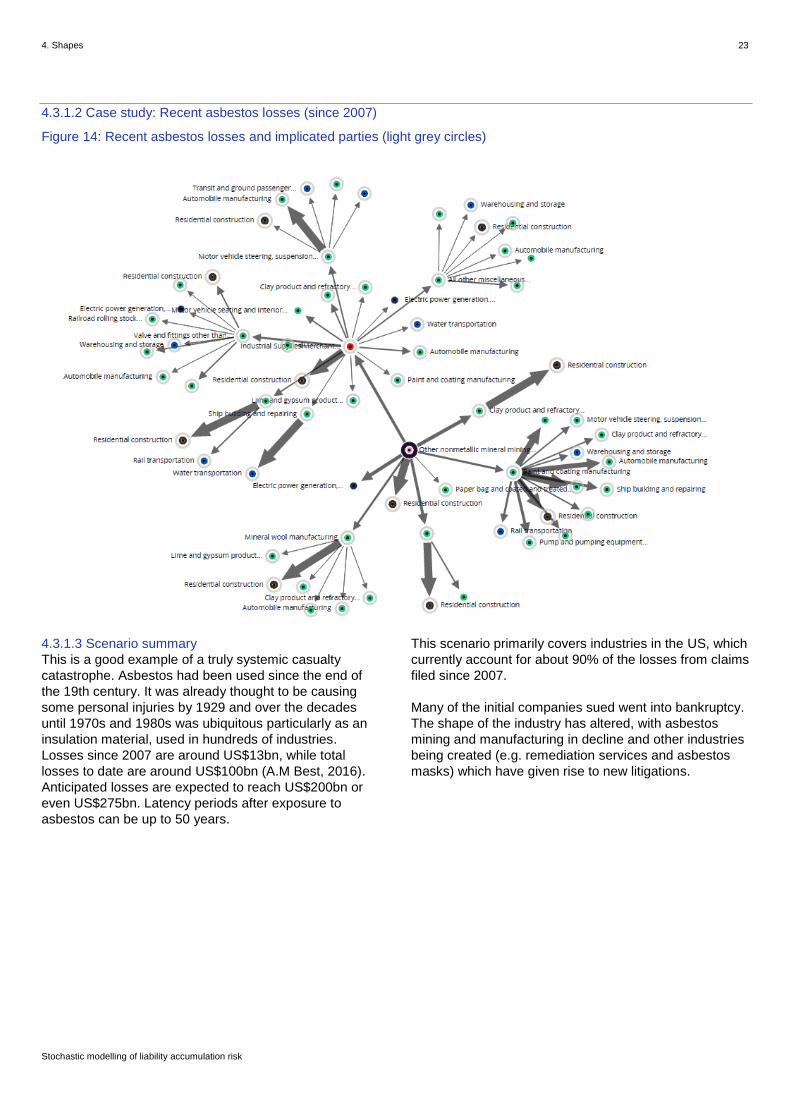
4.3.1.2 Case study: Recent asbestos losses (since 2007)
Figure 14: Recent asbestos losses and implicated parties (light grey circles)
4.3.1.3 Scenario summary
This is a good example of a truly systemic casualty
catastrophe. Asbestos had been used since the end of
the 19th century. It was already thought to be causing
some personal injuries by 1929 and over the decades
until 1970s and 1980s was ubiquitous particularly as an
insulation material, used in hundreds of industries.
Losses since 2007 are around US$13bn, while total
losses to date are around US$100bn (A.M Best, 2016).
Anticipated losses are expected to reach US$200bn or
even US$275bn. Latency periods after exposure to
asbestos can be up to 50 years.
This scenario primarily covers industries in the US, which
currently account for about 90% of the losses from claims
filed since 2007.
Many of the initial companies sued went into bankruptcy.
The shape of the industry has altered, with asbestos
mining and manufacturing in decline and other industries
being created (e.g. remediation services and asbestos
masks) which have given rise to new litigations.

4. Shapes 24
Stochastic modelling of liability accumulation risk
4.3.1.4 Distribution of losses between parties
One key parameter is how losses are distributed between
parties of different sizes.
At a macro level, reviewing all events, including those
with one or a few parties, the historical data observed
shows that below a certain size of economic loss, the
size of the player did not appear relevant to who bore the
loss. However, over a certain threshold of loss, larger
losses are typically paid by larger companies (see Figure
15).
This type of correlation is strong for
“Component/ingredient” or “Finished product” type
shapes but much less pronounced for “Infrastructure”.
Figure 15: Distribution of losses
Experts also made a number of observations relevant to
the distribution of losses between parties. Some
observed that where there is a large corporate in a loss
scenario, it could face a larger share of the claim,
especially when the loss exceeds the capacity of the
smaller players. Some also observed that in certain
industries - e.g. pharmaceuticals, oil and gas, banking -
the corporate itself, for reputational reasons, may be
willing to assume liabilityv, or those reputational issues
may make the courts more likely to find the large
corporate to be liable. Conversely, it was also observed
that a large corporate could use its bargaining power to
get smaller players to assume liability for losses.
The historical data was examined for certain events with
multiple implicated parties to see if the presence of one
or a few larger parties tends to spread the loss. This
pattern was found particularly with respect to:
the component/ingredient shape discussed in this
section (“component”);
the finished product shape with respect to events
involving financial institutions (“financial”), discussed
in Section 4.3.2 (see p26); and
the infrastructure/operational shape with respect to
events having an environmental impact
(“environmental”) discussed in Section 4.2 (see p19).
See Section 8.2.3.6 (p39) in the Appendix for further
details.
Econom
ic L
oss
Company size (revenue)
Most occurrences

4. Shapes 25
Stochastic modelling of liability accumulation risk
4.3.2 Finished product/service shape This shape starts with a faulty finished product, including
financial products and software services. It is limited in
impact to that good or service, but it does implicate
suppliers (of both services and materials) and
distributors. It can be systemic within those industries
and potentially creates large losses depending on the
product or service. Usually implicated are financial lines
and professional indemnity for financial products, general
and product liability for other products and services, and
also cyber where a software service is involved.
Figure 16: Finished product/service shape
The apparent systemic nature (within an industry) of
many of the financial events such as LIBOR and Forex
rigging, PPI and pension mis-selling and subprime, was
discussed with experts (see Section 4.1, p16 for the IPO
laddering cases, savings and loans crisis of the 1980s
and 1990s). They saw the systemic nature of these
losses arising from a common modus operandi: a
fallacious shared business model combined with flawed
practices and conduct failures.
Although criminal acts as underlying Ponzi schemes,
LIBOR and Forex rates-fixing are not covered by
insurance, the fallout may be in terms of D&O/PI claims.
In this shape, the manufacturer or producer of a finished
good may be primarily responsible for the faults, but
some suppliers as well as distributors may be implicated.
As such, this is a more contained and less potentially
systemic event between industries than the
component/ingredient fault shape as it primarily relates to
one type of finished goods, but an event could be
widespread within those industries.
Scenarios suggested by experts and historical scenarios
analysed include LIBOR-fixing, PPI miss-selling, silicone
breast implants, cigarettes, Thalidomide, the 2008
Chinese infant formula milk scandal (melamine),
damaging fertiliser in South Africa, Kitec plumbing,
Bacardi benzene, Electromagnetic fields (EMF) – mobile
phones, Firestone Ford tyres, Toyota unintended
acceleration, Chinese drywall , subprime – Lehmann’s,
hip/knee replacement defects, Fen-Phen and AWS
DDOS event and Madoff.

4. Shapes 26
Stochastic modelling of liability accumulation risk
4.3.2.1 Case study: Silicone breast implants litigation
Figure 17: Silicone breast implants supply chain and implicated parties (light grey circle)
4.3.2.2 Scenario summary Litigation in the 1990s that would cost the industry US$11.2bn, and an FDA ban on any silicone implants for cosmetic purposes, led to all but two small manufacturers departing the silicone breast implant business and the largest manufacturer, Dow Corning, filing for bankruptcy. Nevertheless there is still no scientific evidence that the implants cause serious disease.
The significant size of the losses, the widespread anxiety created about the implants, and the absence of a causal connection with serious injuries has raised concern about how the regulatory and judicial system operated in this context (Miller, 2015; Shiffman, 1994; Kolata, 1995).
4. Shapes 27
Stochastic modelling of liability accumulation risk
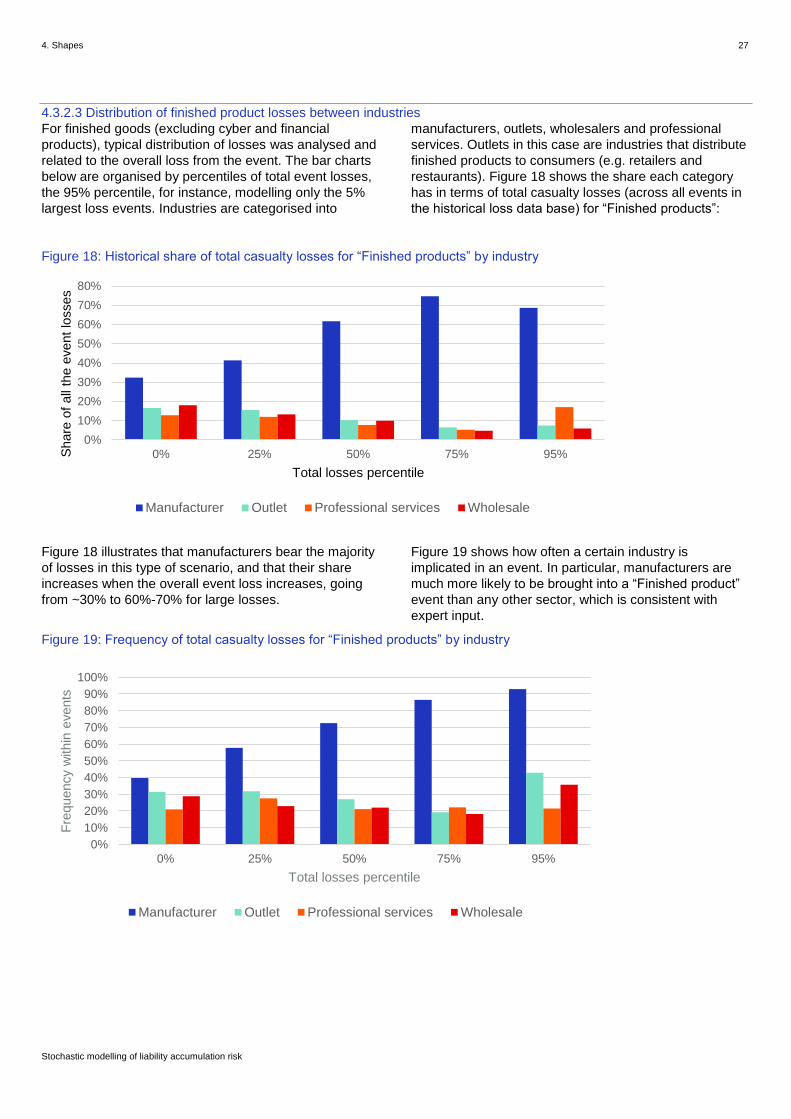
4.3.2.3 Distribution of finished product losses between industries
For finished goods (excluding cyber and financial
products), typical distribution of losses was analysed and
related to the overall loss from the event. The bar charts
below are organised by percentiles of total event losses,
the 95% percentile, for instance, modelling only the 5%
largest loss events. Industries are categorised into
manufacturers, outlets, wholesalers and professional
services. Outlets in this case are industries that distribute
finished products to consumers (e.g. retailers and
restaurants). Figure 18 shows the share each category
has in terms of total casualty losses (across all events in
the historical loss data base) for “Finished products”:
Figure 18: Historical share of total casualty losses for “Finished products” by industry
Figure 18 illustrates that manufacturers bear the majority
of losses in this type of scenario, and that their share
increases when the overall event loss increases, going
from ~30% to 60%-70% for large losses.
Figure 19 shows how often a certain industry is
implicated in an event. In particular, manufacturers are
much more likely to be brought into a “Finished product”
event than any other sector, which is consistent with
expert input.
Figure 19: Frequency of total casualty losses for “Finished products” by industry
0%
10%
20%
30%
40%
50%
60%
70%
80%
0% 25% 50% 75% 95%Share
of
all
the e
vent
losses
Total losses percentile
Manufacturer Outlet Professional services Wholesale
0%
10%
20%
30%
40%
50%
60%
70%
80%
90%
100%
0% 25% 50% 75% 95%
Fre
quency w
ithin
events
Total losses percentile
Manufacturer Outlet Professional services Wholesale

4. Shapes 28
Stochastic modelling of liability accumulation risk
Interestingly, the frequency with which other industries
(outlets, professional services and wholesale) are
implicated is not that dependent on the size of the loss,
and it is generally between 20% and 30%.
Considering the share of loss, Figure 20 illustrates what
share of the overall event loss an industry bears if it is
implicated in the event.
Figure 20: Severity for “Finished product” events expressed as share, by industry
Where the overall loss is smaller, loss severities are
relatively evenly distributed - i.e. manufacturers are not
likely to pick up more of the losses relative to other
industries in the same event.
For larger events, however, manufacturers do receive a
consistently higher share of the culpability relative to
other industries in the same event.
0%
10%
20%
30%
40%
50%
60%
70%
80%
0% 25% 50% 75% 95%
Share
of
the t
ota
l lo
ss
Total losses quartile
Manufacturer Outlet Professional services Wholesale

4. Shapes 29
Stochastic modelling of liability accumulation risk
4.4 The “professional claw”
Figure 21: “Professional claw”
It is important to notice that professional services can be
supplied at any stage of the supply and distribution chain
for any given product or in any shape.
The services supplied depend on the product and could
be financial, legal, accounting, testing, engineering,
design services etc. and, accordingly, the relevant line of
business is professional liability.
Usually professional advisers are held solely responsible
for the advice they provide and for the choices they make
about who or what sources to rely on when providing that
advice. Moreover, professional services may not always
be supplied by external professionals but from within an
organisation (e.g. testing provided by a manufacturer,
actuarial advice to an insurer provided by internal rather
than consulting actuaries) resulting in a decrease of the
frequency of the external professional service claw.
As mentioned, the claw is not a standalone shape except
in the context of fraud and bankruptcy such as Enron,
and it usually “hangs off” another shape. For example in
the Madoff scenario below, the circled supply of services
are the ‘professional claws’.
Figure 22: Occurence of “professional claw” shapes
Madoff
Direct
investors Indirect
investors
Advisor
s
Advisor
s

5. Use of parameterised shapes to generatefuture scenarios 30
Stochastic modelling of liability accumulation risk
5. Use of parameterised shapes to generate future scenarios
One of the critical aspects of shapes is their ability to
describe future and emerging risks as well as types of
past events. In this example involving food events, the
scenarios and drivers mentioned by experts informed the
shapes and parameters that could lead to significant and
widespread future food events.
5.1 Food-related scenarios
Seven out of the 12 product-based scenarios mentioned
by experts related to food. This seemed surprising as a
review of the historical casualty cat losses confirms that
there have been few recent large historic food-related
events in the developed world. However, by applying the
drivers mentioned by the experts to the food-related
scenarios, there appears to be potential for significant
future losses.
Near misses: In the Sudan 1 red-dye loss,
products were recalled before reaching the
consumer. The UK 2013 horsemeat scandal
turned out to be mislabelled food rather than
harmful food. Both “near miss” events
demonstrate the cascading effect of ingredients
through the supply chain and widespread
distribution across national boundaries. Formal
analysis of the events and asking counterfactual
questions about these near-misses could help
underwriters get significant additional insights
into extreme losses and reduce future market
surprises (Woo, 2016).
Food-related losses in the less developed
world: In 2008, a nitrogen-rich substance known
as melamine was added to milk, particularly
infant formula, affecting tens of thousands of
infants in China. Melamine had sometimes been
illegally added to food products to increase their
apparent protein content and it is known to
cause renal failure and kidney stones in humans
and animals (International Risk Governance
Council, 2010).
Food-related losses in previous decades: In
1973, a fire-retardant chemical called
polybrominated biphenyl (PBB) accidentally got
mixed into livestock feed. The accident was not
recognised until long after the bags had been
shipped to feed mills and used in the production
of feed for dairy cattle. Studies estimate 70-90%
of people in Michigan had some exposure to PBB
from eating contaminated milk, meat and eggs.
The Michigan Department of Community Health
(MDCH) says the “overwhelming majority of
those who were exposed to PBB received very
low levels”. However, some individuals had
higher exposure (40 years after toxic mix-up,
researchers continue to study Michiganders
poisoned by PBB, 2014).
Food-related emerging risks: There are a
number of emerging risks related to food
additives (e.g. phosphates and nitrate), to
plasticisers used in food packaging (BPA), to
other technology introduced into the food chain
such as nutraceuticals and to changing society
awareness such as the amount of sugar and salt
in food.
5.2 Emerging risk: sugar
One example referred to by an expert as the "next
tobacco" is the potential loss from excessive, but not
always obvious use of sugar (also salt) in food if
excessive levels of sugar were found to be harmful by
scientific studies and courts found food producers and/or
the distribution chain liable for resulting damages. The
view was that a societal shift may make the addition of
significant amounts of sugar to our food unacceptable,
with liability risks affecting food manufacturers (and
possibly distributors and retailers).
A sample footprint, starting from sugar beet and cane
farming to sugar and confectionary manufacturing and then
spreading to various other food manufacturers, wholesalers,
retailers, and food and drink outlets is shown below.

5. Use of parameterised shapes to generatefuture scenarios 31
Stochastic modelling of liability accumulation risk
The parameterised shape implicated here is the
component shape, which is seen to have the greatest
potential for systemic loss. When overlaid onto the trade
map, the widespread distribution of sugar within the food
industry and the potential to impact many consumers
becomes apparent (Figure 23).
Figure 23: Sugar distribution in the food industry
The nodes represent different industries (using North American Industrial Classification codes – NAICS). Green nodes are (food) manufacturers, red
nodes (food) wholesalers, blue nodes (food retailers), pink nodes other food outlets and the red nodes the growing of cane//beet sugar.
Considering the drivers cited above and mentioned by
experts, it seems that latent damage caused by the
widespread distribution of sugar in a number of different
food products could lead to a systemic scenario.
Technically speaking, this would materialise in a number
of different parties being implicated in a variety of
different industries. Consequently, losses would spread
through the supply chain in accordance to the structure of
the trade data emanating from a particular starting
industry, in this instance sugar beet and cane farming.
For this shape, all relevant supply chains could be
implicated, not just the strongest trades, on the premise
that quite often, it is cheap ingredients that could be
harmful. Historical data suggests that the spread would
also be amplified by the presence of large corporates
with large insurance cover and funds.
6. Outputs 32
Stochastic modelling of liability accumulation risk
6. Outputs
6.1 Exceedance probability curves
The methodology described in this report can produce a
full probabilistic loss curve – in particular, it can deliver
annual average losses and arbitrary loss quantiles.
These loss curves are often used for insurance rating
and capital-setting purposes.
6.2 Heat maps and clusters
Heat mapping is the overlay of the output from the
stochastic model onto the economy. In particular, the
goal of this section is to outline further uses of the
outputs with a view towards visualisation, identification of
clusters and heat mapping.
The underlying idea is to create mappings where:
The sizes of nodes indicate the value of risk metrics,
or contributions of an industry to the portfolio-level
value.
Arrows are used to indicate the correlation between
industries. For example, for each adjacent pair of
industries, how often these two nodes are implicated
in the same event could be computed. Link strengths
can then be defined in terms of return periods: rates
of coincidence for events exceeding a certain return
period.
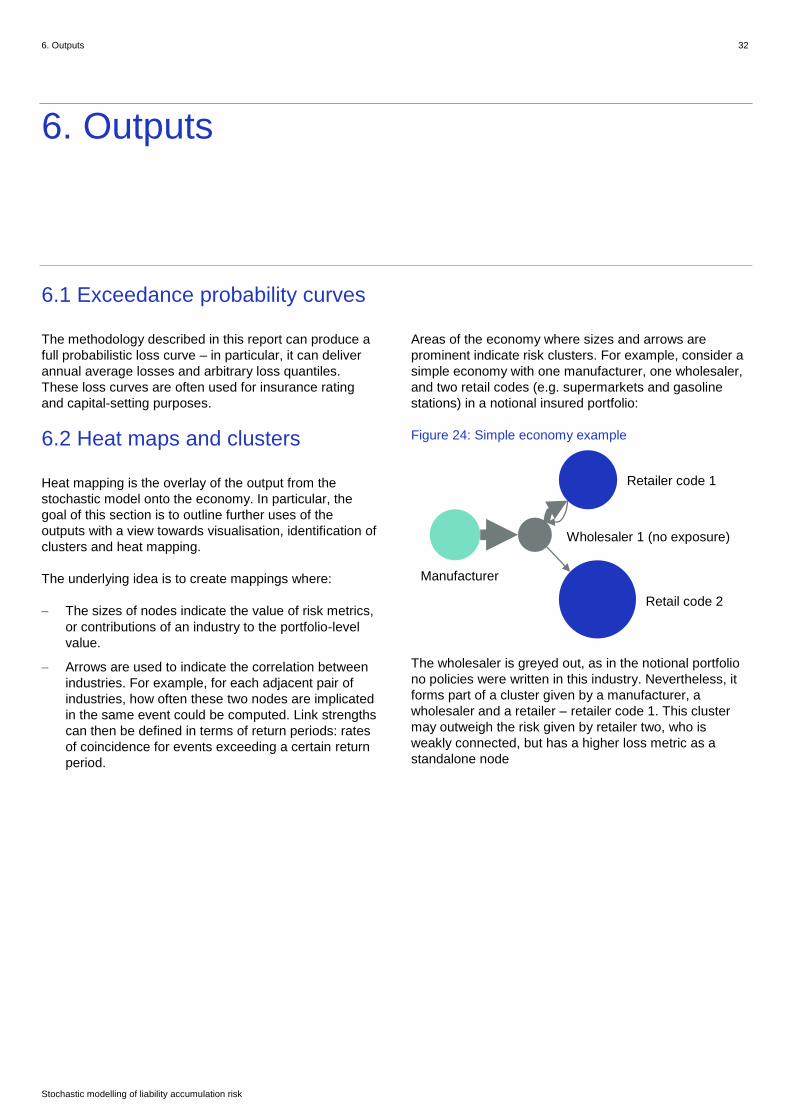
Areas of the economy where sizes and arrows are
prominent indicate risk clusters. For example, consider a
simple economy with one manufacturer, one wholesaler,
and two retail codes (e.g. supermarkets and gasoline
stations) in a notional insured portfolio:
Figure 24: Simple economy example
The wholesaler is greyed out, as in the notional portfolio
no policies were written in this industry. Nevertheless, it
forms part of a cluster given by a manufacturer, a
wholesaler and a retailer – retailer code 1. This cluster
may outweigh the risk given by retailer two, who is
weakly connected, but has a higher loss metric as a
standalone node
Manufacturer
Retailer code 1
Retail code 2
Wholesaler 1 (no exposure)
7. Conclusions 33
Stochastic modelling of liability accumulation risk
7. Conclusions
The basic ideas underlying this paper flow from the report
“Emerging Liability Risks - Designing liability scenarios”
written jointly by Arium and Lloyd’s in 2015 (Lloyd’s,
2015), where causes and conditions of catastrophic
accumulation risks for liability insurance and a
methodology to quantify them was explored.
Casualty risks accumulate in a variety of different ways
and affect multiple lines of business. Using expert input,
corroborated and augmented by historic data, certain
distinct types of liability “storm tracks” were observed,
which are called shapes. These shapes can describe a
multitude of narratives when overlaid on an economic
map, providing building blocks to help model historical
and future casualty events in a systematic way.
The model and process presented here are a big step
forward in the journey of understanding liability risk
exposure. These shapes are used to create a large
catalogue of scenarios, including potential mega- liability
events that exceed asbestos. As a result, the approach
allows a fully probabilistic view and returns all the outputs
familiar from property catastrophe modelling. It can
produce an EP curve that can deliver annual average
losses and arbitrary loss quantiles, as well as heat
maps/hot-spot analyses that make potential
accumulations instantly recognisable.
Future areas of research could expand and enhance this
model along several dimensions:
One reason why the shapes concept is useful is that
it reduces the overwhelming complexity of liability risk
into discrete building blocks that can be handled one-
by-one. Inevitably, however, doing so runs the risk of
oversimplification and approximation. Also, the
nature of liability risk may change over time. It is
therefore important to keep an eye on whether the
given catalogue of shapes should be refined or kept,
should be adapted or left unchanged.
In terms of the parameters and mechanics for each
shape, future refinement may be desirable or
necessary in order to reflect the reality of liability risk.
In particular, parameters informed by expert input are
currently more set in terms of directionality of the
effect and lack an associated magnitude. Future
research may help to further pin down the set of
parameters best suited to model a particular shape.
In particular, the various shapes of some forward-
looking risks such as cyber could be further explored.
Similarly, probabilities associated with each shape
will be subject to monitoring and observation through
further expert elicitation, in particular with emerging
risks experts.
There are currently insufficient non-U.S. events in the
database used for an analysis on distribution of
liability by jurisdiction but this would be a useful
analysis when further information is available.

8. Appendinx 34
Stochastic modelling of liability accumulation risk
8. Appendix
8.1 Scenarios used
The modelled scenarios used to help derive the footprint
shapes in this paper were based on scenarios mentioned
by experts and also historical scenarios using data from
the Advisen database.
8.1.1 Scenarios mentioned by experts
Table 1: Scenarios
Historic scenarios Emerging/emergent risks
Lead paint Bhopal Silica
Kitec plumbing Fire retardant in animal feed EMF
Deepwater Horizon (mentioned twice) Savings and Loans D&O Arctic
Costa Concordia Red food dye Sudan 1 Soya milk
PIP breast implants Horsemeat scandal Sugar emerging risk
Owens Corning fibreglass Damaging fertiliser in South Africa
2008 Chinese milk scandal (melamine)
(mentioned twice)
Fridge freezer defrost timers overheating
2006 Ivory Coast waste dump Big Spring Refinery explosion
Berkeley California balcony collapse Bacardi Benzene
Calcium aluminate cements Great salad oil swindle of 1963
Asbestos Mysterious cattle cake loss
Earl of Malmesbury vs Strutt and Parker Love canal
Thalidomide Libor rigging
Enron Tobacco
1981 Hyatt Regency walkway collapse PPI misselling
2006 Mecca hostel collapse 2011 E-coli outbreak in Germany
NFL concussions
8.1.2 Scenarios modelled on historic data
Table 2: Scenarios modelled from historic data
Scenarios
Lac-Megantic derailment Contaminated cantaloupe 2011 Takata airbag recall
Buncefield explosion Hip/knee replacement defects Lead paint (construction)
Sony Playstation hacks Dow corning breast implant Asbestos ((limited) claims from 2007)
Target payment card breach Lead paint in toys Fen-Phen
Enron Chinese drywall Firestone Ford tyre
PPI misselling Piper Alpha Toulouse Fertiliser explosion
Libor rigging Deepwater Horizon Exxon Valdez
Subprime – Lehmann’s Toyota unintended acceleration

8. Appendinx 35
Stochastic modelling of liability accumulation risk
8.2 Experts’ observations
Historical data does not reveal what factors actually
drove a loss, nor how losses might play out differently in
the future. The views gleaned from experts and
confirmed by historical data helps inform the drivers and
mitigation for the frequency and magnitude of loss, the
distribution of the loss and the impact of jurisdiction.
Expert inputs on these factors were overwhelmingly
consistent and their individual and unattributed
comments are reflected in the factors set out below. The
historic data available was used to examine and confirm
whether there have been correlations between those
factors. The application of the parameters when
combined with shapes can help to show how future
scenarios might differ.
The factors below are a subset of important factors
raised by the experts. They also do not cover in depth
matters of general research particular to liability
insurance, such as how economic downturns often have
an adverse impact on an insurer’s bottom lines. The
parameters also do not address legal issues such as the
impact of laws on joint and several liabilities in the US,
which can shift payment from culpable parties with
insufficient funds to pay the claims to other parties.
It is anticipated that these parameters will be reviewed,
augmented and developed over time.
8.2.1 Risk drivers
8.2.1.1 Societal sensitivities/reputation
It was remarked that societal sensitivities tend to drive
the magnitude of liability events, and environmental
impact is now a major source of regulation and liability.
The industries whose activities are perceived to have an
adverse impact on the environment, on health and safety
or otherwise appear to be socially sensitive (e.g. mining,
oil and gas, pharmaceuticals/medical, automobiles,
banking, financial services and food). As such, they
appear to be susceptible to large accumulation losses,
and are more likely to be held responsible for those
losses with consequent adverse reputational impacts.
8.2.1.2 Societal awareness
It was observed that although the asbestos loss was
partially related to the number of people impacted by it,
even if not actually harmed by it, the magnitude of the
loss was also driven by social awareness.
With asbestos, one expert observed that a handful of
judges opened the floodgates to future claims by
developing the “triple trigger” idea, which means that all
policies in force from the time of initial exposure through
manifestation of illness could apply. This greatly expands
access to policies and possible recoveries (International
Risk Management Institute, 2017; Sweigart, 2012).
The emergence of social media and information sharing
via the internet may mean that risks will emerge quicker,
so that the timespan over which claims materialise
decreases. The compressed time timescale may make it
harder for insurers to pay claims. However, the longer an
issue is outstanding, the more chances it has to spiral out
of control and attract further losses.
8.2.1.3 Technology
It was noted that regulation tends to lag behind
technological change. So where there is rapid
technological change, these less regulated innovations
could lead to more frequent and more systemic losses.
Moreover, particular technological innovations may
change the ways risks materialise. For example, the
“man-machine” interface has historically been important
in different businesses (e.g. aircraft cockpits), but the
more extensive use of computers in ships, manufacturing
and banking increases the vulnerability to cyber risks. For
example, interfering with faulty cargo sensors on an
aircraft could lead to overloading the aircraft, or
interfering with the temperature sensors in the air-
conditioning system of an internet cloud provider could
lead to computers overheating.
8.2.1.4 Economic factors
Economic downturns often have an adverse impact on
insurer’s bottom lines especially in connection to liability
claims. In particular, funds, banks, real estate agents
along with their professional advisers may be targeted by
claimants seeking compensation for financial losses, and
potentially triggering losses on E&O/D&O policies
(Baluch, Mutenga and Parsons, 2016).
It was also noted that pricing pressures may influence the
risk landscape in the longer run:
Soft rates can sometimes lead underwriters to accept
weaker policy wordings, which may increase
exposure to unusual losses.
Pressure to deliver products cheaply can increase
the frequency of lossesvi.
vi For example, in relation to Chinese toy manufacturers using lead
paint, S. Prakash Sethi, a professor at Baruch College, part of the City

8. Appendinx 36
Stochastic modelling of liability accumulation risk
Depressed income caused by a recession may result
in the lack of investments in appropriate equipment
which could then affect large infrastructure or
industrial plants negatively.
8.2.1.5 Timing and latency
How obvious a fault or defect is and how quickly it can be
identified it is critical in mitigating losses. If the hazard is
detected earlier, fewer parties will be exposed and the
overall loss could be lower. The longer it takes to identify
a fault, the more time the product with the undetected
problem could be sold and used, and the greater the
potential damage. It was noted that this depends on the
product and the industry. For example, the food industry
might have a complex supply chain, but it is usually
reasonably apparent if there is a product or systemic fault
(although see the discussion relating to the 2011 German
e-coli outbreak below), whereas in construction it is
harder to detect a fault and determine whether a loss
might be systemic.
8.2.2 Risk mitigation There are a number of mitigating factors mentioned that
can control and limit risks.
8.2.2.1 Regulation
Regulation includes what is specified as well as the
adaption and enforcement of regulations. Regulation
provides a level playing field for insurers and can also
reduce the likelihood of an event happening. In more
regulated industries, once an event happens, policy
frameworks are reactively and frequently brought in to
mitigate future occurrence. For example, after the “New
England Compounding Center” meningitis outbreak
regulations changed to supervise pharmacies’
repackaging of pharmaceuticals (Upton, 2013). After the
Lac Mégantic derailment regulations were announced to
reduce the flammable nature of oil and gas when
undergoing transport by using chemicals (Transport
Canada, 2016).
A highly regulated environment was seen to reduce the
frequency of liability events, which in turn encourages
insurance. In the absence of regulations and the
understanding of risks, it is more challenging for insurers
to operate.
Risk management encouraged by regulatory frameworks
may moderate the severity of an event, or in certain
University of New York, who has acted as an independent monitor of
working conditions in Mattel’s factories for the past 10 years, said:
“There is something to be said about the pressure that American and
European and multinational companies put on Chinese companies to
supply cheap products. The operating margins are razor thin, so you
really should not be surprised that there is pressure to cut corners.”
(The New York Times, 2007).
cases may prevent it altogether. However, the pay-out for
an event that happens in a highly regulated environment
is likely to be far greater than in less regulated
environments. It was also believed that developed
countries usually have more advanced legal liability
regimes.
8.2.2.2 Jurisdiction
As above, jurisdiction tends to correlate with regulation.
Developed countries also tend to have parties who are
more highly insured and have better risk prevention,
whereas developing nations are relatively underinsured
(Lloyd’s, 2012). The corollary is that the damages paid in
developing countries for comparable harm are less than
in developed countries, Bhopal being an example of an
event that would have created greater losses if it had
happened in the developed world.
8.2.2.3 Risk management
Risk management varies by industry and also across the
same industry based on risk culture and risk maturity.
There is also a perceived correlation between high-
hazard industries (industries in which there is not a
voluntary assumption of risk), and industries that have a
low appetite for risk and good risk management.
8.2.2.4 Best practice
Best practice is another risk mitigation implementation
and it is also more a function of industry than a country.
Best practice is usually defined within an industry,
frequently one where there are international standards.
8.2.2.5 Product recall/traceability
The ability to track a faulty product and recall it helps to
mitigate the losses. This is what restricted the potential
product liability in the Sudan 1 red dye case (BBC News,
2005), where a potentially carcinogenic red dye was
supplied by a manufacturer in India and was then found
incorporated in many other products e.g. Worcestershire
sauce, which itself is used in many other products. The
issue was spotted and most products recalled before
being purchased and adversely affecting consumers.
However, where the fault is not obvious or not detected,
or causes more long-term or latent harm, as in the
German E-coli outbreak in 2011, then recall and batching
are less effective. Traceability also varies by industry
(e.g. construction components tend to be less traceable
whereas, for example, food and aviation components
have greater traceability). It was also noted that product
recalls minimise product liability but potentially damage
reputation.
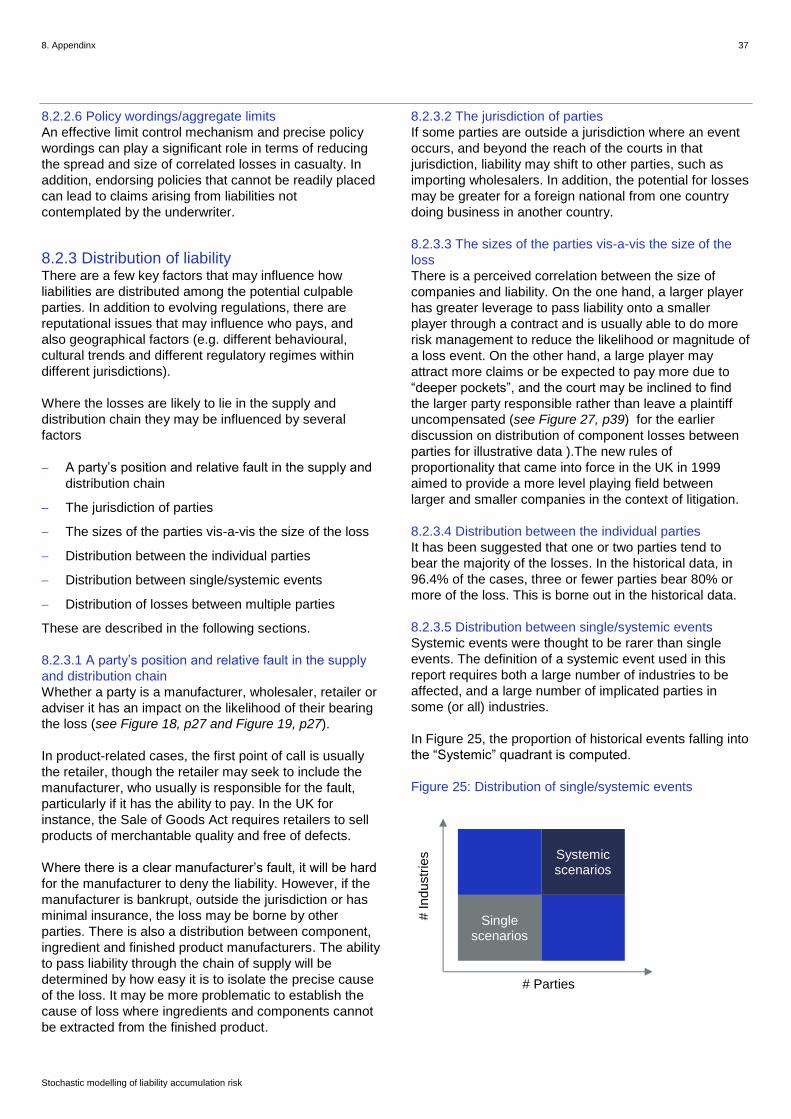
8. Appendinx 37
Stochastic modelling of liability accumulation risk
8.2.2.6 Policy wordings/aggregate limits
An effective limit control mechanism and precise policy
wordings can play a significant role in terms of reducing
the spread and size of correlated losses in casualty. In
addition, endorsing policies that cannot be readily placed
can lead to claims arising from liabilities not
contemplated by the underwriter.
8.2.3 Distribution of liability There are a few key factors that may influence how
liabilities are distributed among the potential culpable
parties. In addition to evolving regulations, there are
reputational issues that may influence who pays, and
also geographical factors (e.g. different behavioural,
cultural trends and different regulatory regimes within
different jurisdictions).
Where the losses are likely to lie in the supply and
distribution chain they may be influenced by several
factors
A party’s position and relative fault in the supply and
distribution chain
The jurisdiction of parties
The sizes of the parties vis-a-vis the size of the loss
Distribution between the individual parties
Distribution between single/systemic events
Distribution of losses between multiple parties
These are described in the following sections.
8.2.3.1 A party’s position and relative fault in the supply
and distribution chain
Whether a party is a manufacturer, wholesaler, retailer or
adviser it has an impact on the likelihood of their bearing
the loss (see Figure 18, p27 and Figure 19, p27).
In product-related cases, the first point of call is usually
the retailer, though the retailer may seek to include the
manufacturer, who usually is responsible for the fault,
particularly if it has the ability to pay. In the UK for
instance, the Sale of Goods Act requires retailers to sell
products of merchantable quality and free of defects.
Where there is a clear manufacturer’s fault, it will be hard
for the manufacturer to deny the liability. However, if the
manufacturer is bankrupt, outside the jurisdiction or has
minimal insurance, the loss may be borne by other
parties. There is also a distribution between component,
ingredient and finished product manufacturers. The ability
to pass liability through the chain of supply will be
determined by how easy it is to isolate the precise cause
of the loss. It may be more problematic to establish the
cause of loss where ingredients and components cannot
be extracted from the finished product.
8.2.3.2 The jurisdiction of parties
If some parties are outside a jurisdiction where an event
occurs, and beyond the reach of the courts in that
jurisdiction, liability may shift to other parties, such as
importing wholesalers. In addition, the potential for losses
may be greater for a foreign national from one country
doing business in another country.
8.2.3.3 The sizes of the parties vis-a-vis the size of the
loss
There is a perceived correlation between the size of
companies and liability. On the one hand, a larger player
has greater leverage to pass liability onto a smaller
player through a contract and is usually able to do more
risk management to reduce the likelihood or magnitude of
a loss event. On the other hand, a large player may
attract more claims or be expected to pay more due to
“deeper pockets”, and the court may be inclined to find
the larger party responsible rather than leave a plaintiff
uncompensated (see Figure 27, p39) for the earlier
discussion on distribution of component losses between
parties for illustrative data ).The new rules of
proportionality that came into force in the UK in 1999
aimed to provide a more level playing field between
larger and smaller companies in the context of litigation.
8.2.3.4 Distribution between the individual parties
It has been suggested that one or two parties tend to
bear the majority of the losses. In the historical data, in
96.4% of the cases, three or fewer parties bear 80% or
more of the loss. This is borne out in the historical data.
8.2.3.5 Distribution between single/systemic events
Systemic events were thought to be rarer than single
events. The definition of a systemic event used in this
report requires both a large number of industries to be
affected, and a large number of implicated parties in
some (or all) industries.
In Figure 25, the proportion of historical events falling into
the “Systemic” quadrant is computed.
Figure 25: Distribution of single/systemic events
Systemic scenarios
Single scenarios
# Parties
# Ind
ustr
ies

8. Appendinx 38
Stochastic modelling of liability accumulation risk
Specifically, based on data, Figure 26 plots the observed proportions of parties and industries in excess of a given
percentile compared to the expected pattern if they were evenly distributed - i.e. systemic events are not special and
happen as often as other events (relative to the size of their quadrants)vii
. Charting these below, we see a clear
difference in that systemic events are rarer than under the “Expected” hypothesis:
Figure 26: Expected and observed losses
For example, the 50% value on the x-axis is interpreted as the events that exceed the median on both metrics, number
of industries and number of parties per industry: for all events where both a larger than median number of implicated
parties per industry and a larger than median number of industries are observed, the expected proportion of all events
under an even distribution would be 25%. The observed proportion is lower at 12.5%, much lower than an even
distribution.
vii
Technically speaking, the concept used here is a copula, and the chart is effectively looking at successive values of the copula along the 45-degree
line. The chart shows that the dependence pattern has a heavy-tailed behaviour and a Pareto power law with exponent 1.5 seems to capture the
dynamics.
0%
10%
20%
30%
40%
50%
60%
70%
80%
90%
10% 20% 30% 40% 50% 60% 70% 80% 90%
Expected Observed

8. Appendinx 39
Stochastic modelling of liability accumulation risk
8.2.3.6 Distribution of losses between multiple parties
The historical data was also examined for certain events
with multiple implicated parties to see if the presence of
one or a few larger parties tends to spread the loss so
that, for example, the larger parties are bearing more of
the loss. In particular, experts observed that where there
is a large corporate in a loss scenario, the large
corporate could face a larger share of the claim,
especially when the loss exceeds the capacity of the
smaller players. Some also observed that in certain
industries - e.g. pharmaceuticals, oil and gas, banking -
the corporate may be willing to assume liability for
reputational reasons, or those reputational issues may
make the courts more likely to find the large corporate to
be liable. Conversely, it was also observed that a large
corporate could use its bargaining power to get smaller
players to assume liability for losses.
Figure 27: Correlation of losses
-3.5
-2.5
-1.5
-0.5-1.6 -1.4 -1.2 -1 -0.8 -0.6 -0.4 -0.2 0
Spre
ad o
f lo
ss
Average-to-max revenue (log)
Component
-3.5
-3
-2.5
-2
-1.5
-1
-0.5
0
-1.6 -1.4 -1.2 -1 -0.8 -0.6 -0.4 -0.2 0
Spre
ad o
f lo
ss
Average-to-max revenue (log)
Environmental
-3.5
-3
-2.5
-2
-1.5
-1
-0.5
0
-1.6 -1.4 -1.2 -1 -0.8 -0.6 -0.4 -0.2 0
Spre
ad o
f lo
ss
Average-to-max revenue (log)
Financial

8. Appendinx 40
Stochastic modelling of liability accumulation risk
1. The average-to-max ratio of revenues of players
implicated for a given loss event. If the ratio is
small, then there is a large corporate relative to
the other players. The larger the value, the more
homogeneous the players are in terms of their
revenues.
2. The spread of losses through the supply chain.
Essentially, this is the average share of the loss
for all industries implicated in a loss event. The
lower this is the more losses are shared
throughout the supply chain. If this value is high,
then losses are relatively concentrated.
If both values are low, then the existence of a big player
coincides with a bigger spread of losses in the supply
chain. If both values are high, then a homogeneous set of
players coincides with a concentrated loss.
A positive correlation between both values would
corroborate expert observations, and this is indeed the
case. In particular a positive correlation was found,
specially with respect to the component/ingredient shape
discussed in this section (“component”); the finished
product shape with respect to events involving financial
institutions (“financial”), discussed in Section 4.1 (see
p16); and the infrastructure/operational shape with
respect to events having an environmental impact
(‘environmental’) discussed in Section 4.2 (see p19). This
is demonstrated by Figure 27, where the above metrics
are charted one against the other on a log-scaleviii
: By
means of comparison to other types of shapes, this
correlation is still detectable but weaker for other
“finished product” type scenarios, and very weak for
“infrastructure”.
viii
The log-scale is used in order to magnify observations where both
dispersion of losses and average-to-max ratio are small.

8. Appendinx 41
Stochastic modelling of liability accumulation risk
8.3 Occurrence probabilities
Occurrence probabilities are the mathematical vehicle to
describe how often in a given period of time a realisation
from a particular shape occurs. The shapes described
tend to have different occurrence probabilities associated
with them.
8.3.1 Stationary probabilities Stationary probabilities are relatively stable over time. Of
course, the precise meaning of this is subject to
convention, but typically human error rates are seen as a
relatively stable quantity, although the degree and
effectiveness of risk management and other mitigation
may vary between industries and jurisdictions.
8.3.2 Non-stationary probabilities Non-stationarity is present when the probability of
occurrence depends in a significant fashion on factors
that are time-dependent.
For example, whereas there are currently no truly
systemic cyber-loss scenarios on historical record,
several studies have suggested that their occurrence is
now a possibilityix. Similarly, it may be argued that certain
scenarios that have materialised in the past would not
repeat as a loss scenario because the underlying
mechanics would now be prevented by a better
understanding of the hazard, or a different legal
landscape.
ix For example the Sybil logic bomb cyber catastrophe scenario (Centre
for Risks Studies, 2014 )
8.4 Technical implementation of the concept
8.4.1 Process architecture This section presents an overview of the workflow as it
was implemented during this project. The first step was to
translate expert knowledge, historical loss data and
supply chain data into parameterised forms.
The first step consists in capturing the shapes and can
be divided in:
Determining the set of possible starting nodes.
Understanding if the shape model scenarios that
implicate suppliers and/or customers.
Exploring how far-reaching the event is (i.e. if it
extends to first-, second-, third-tier suppliers).
The second step consists in the parameterisation of
shapes and it includes:
Specifying liability-related variables.
Specifying dependence and/or correlation between
these variables as well as between variables and the
structure of the supply chain as per step one above.
These initial parameters reflect a plausible set of
assumptions, which over time will continue to evolve in
light of further input, changes in the socio-economic
environment and to reflect a better understanding of risk.

8. Appendinx 42
Stochastic modelling of liability accumulation risk
8.4.2 Hierarchical representation of shapes The first step in the process of deriving loss scenarios is capturing the shape in order to fix the set of industries that are
part of a particular shape, as well as the footprint of the supply chain (its extent and depth).
A crucial question is how to represent uncertainty in the structure of the supply chain. One way to achieve this is to
relate node groups by means of a hierarchical tree that serves to capture the connections between groups.
To start off, node groups are a collection of industries with same properties from a modelling point of view. This occurs
either because two industries actually have the same loss characteristic or there is no meaningful information available
for further differentiationx. A root node, which may be chosen flexibly depending on the risk scenario, is usually the set of
industries where a particular risk scenario may emanate from (e.g. the manufacturer in the “Finished product” shape).
Schematically, original and grouped representations can be represented as follows:
Figure 28: Representation examples
Above, the “root Industry” (ROOT IND) is supplied by industries 1-8 (the “Corporate” shape is similar to this). These
industries are then grouped - for example industries 1-3 form group 1 (GRP1). These groups form the skeleton for all
further parameterisation, such as the shares of loss attributable to each. In the latter example, these shares are
specified either as deterministic or stochastic variables. Groups may appear several times in a given shape, as would be
the case with professional advisory firms that may be implicated at several points in the same supply chain.
Nodes are then related by supplier-to-customer and/or customer-to-supplier relationshipsxi as shown below for a
situation when industries from groups 1 and 2 supply industries in group 3, which in turn supply the root node industries.
x In statistics, this is often referred to as a “uniform prior”.
xi In terms of the hierarchical tree, these are the parent-child relationships.
IND5 ROOT
IND
IND6
IND4
IND3
IND2
IND1
IND8
IND7
ROOT IND
GRP2 GRP1
GRP3
Original industry codes Grouped representation

8. Appendinx 43
Stochastic modelling of liability accumulation risk
Figure 29: Representation examples
The representation is hierarchical as in this instance
GRP3 supplies into ROOT IND, and in turn GRP1 and
GRP2 supply GRP3.
These supply-chain relationships are also parameterised.
For example, links may or may not be associated with
trade strength data, depending on whether doing so
makes sense for the shape at hand. With the corporate
shape for example there is no association to trade as the
amount of trade between relevant professional advisory
services and the imploding company is not expected to
impact the scenario outcome. On the other side, trade
data can be used to effectively identify supply chains that
are used to manufacture certain goods or provide certain
services. However, in this context, the reader is reminded
that the outcomes of this process are in major part
determined by pre-selecting the industries that make up
the shape.
It is important to note that in terms of the underlying trade
map, there are situations when the link is indirect within
the economic network. In other words, links may be direct
or indirectxii
in terms of the trade data, and part of the
parameters capture the number of steps (or maximum
number of steps to go). Similarly, deterministic or
stochastic rules may be used to decide which links are
followed or not. A typical case would be a scenario where
a faulty component causes liability to multiple finished
product manufacturers versus just one.
8.4.3 Sampling scenarios Once shapes are parameterised, it is then possible to
sample concrete realisations to create scenarios at
xii
For example, retailers can be supplied directly by the manufacturer, or
indirectly through a wholesaler.
economy-level (i.e. making no reference to any insured
portfolio) by:
1. Sampling a set of concrete industry codes from
abstract representation.
2. Sampling a concrete realisation of event
parameters from abstract representation.
Finally, one can then calculate losses for a given insured
portfolio. The vehicle for this is the loss-allocation
methodology that is part of the methodology outlined in
the previous paper (Lloyd’s, 2015). For convenience, the
essence of this approach is reiterated in the next two
sections.
8.4.4 Methodological limitations From a capital perspective, insurers and regulatory
frameworks are usually concerned about assessing tail
risks over the short- to medium-term - normally one year.
However, it is not uncommon for liability claims to take
months or years from notification to settlement. This long-
tail nature means that accurate reserving may play a
more important role relative to premium risk than, for
example, in property insurance, as the relevant
information about property losses often materialises more
quickly. For reserving, deterministic scenario modelling
may be more suitable, because an event that has already
occurred is modelled. The solution advocated here is to
make use of deterministic risk scenario modelling,
presented in the paper “Designing liability scenarios”,
which complements outputs from the stochastic model. In
particular, deterministic scenarios can be blended with
outputs from the stochastic model, for example by using
the former to model tail risk (for capital setting purposes)
and the latter to cover the bulk of the distribution (more
relevant for rating).
ROOT IND
GRP2
GRP1
GRP3 ROOT
IND GRP3
GRP1
GRP3
GRP2
GRP3
Grouped representation Grouped hierarchical representation
References 44
Stochastic modelling of liability accumulation risk
References
Michigan Radio. 2014. 40 years after toxic mix-up, researchers continue to study Michiganders poisoned by PBB
[online]. ]Available at: http://michiganradio.org/post/40-years-after-toxic-mix-researchers-continue-study-michiganders-
poisoned-pbb
A.M Best. 2016. AM Best Special Report: AM Best Increases Estimate for Net Ultimate US Asbestos Losses to $100
Billion [online]. Available at: http://www3.ambest.com/ambv/bestnews/presscontent.aspx?refnum=24668&altsrc=23
Baluch, F., Mutenga, S. and Parsons, C. 2016. Insurance, systemic risk and the financial crisis. [online]. Available at:
http://www.cassknowledge.com/sites/default/files/article-
attachments/369~~chrisparsons_insurance_and_the_financial_crisis.pdf
BBC News. 2005. Food recalled in cancer dye scare [online]. Avaialble at:
http://news.bbc.co.uk/1/hi/health/4277677.stm
British Petroleum. 2010. Deepwater Horizon accident investigation report: September 8, 2010. [online]. Available at:
http://www.bp.com/content/dam/bp/pdf/sustainability/issue-
reports/Deepwater_Horizon_Accident_Investigation_Report.pdf
Centre for Risk Studies. 2014. Sybil Logic Bomb Cyber Catastrophe [online]. Available at:
http://cambridgeriskframework.com/page/25
Fausset, R. 2010. 3 environmental groups sue BP over gulf oil spill. Los Angeles Times [online].Available at:
http://articles.latimes.com/2010/oct/21/nation/la-na-bp-lawsuit-20101021
International Risk Governance Council. 2010. Emerging risks: Melamine-tainted milk in China Emerging food safety
risks: Melamine-tainted milk in China. [online]. Available at: http://irgc.org/wp-
content/uploads/2012/04/Emerging_risks_Melamine.pdf
International Risk Management Institute. 2017. Triple trigger theory [online]. Available at:
https://www.irmi.com/online/insurance-glossary/terms/t/triple-trigger-theory.aspx
Kolata, G. 1995. A Case of Justice, or a Total Travesty?; How the Battle Over Breast Implants Took Dow Corning to
Chapter 11 1The New York Times. 13 Jun.
Lloyd’s. 2012. Lloyd’s global underinsurance report. [online]. Available at: https://www.lloyds.com/~/media/files/news and
insight/360 risk insight/global_underinsurance_report_311012.pdf
Lloyd’s. 2015. Emerging Liability Risks: Designing liability scenarios. [online]. Available at:
https://www.lloyds.com/~/media/files/news and insight/risk insight/2015/emerging liability risks20151130.pdf
Lloyd’s. 2017. Cyber core data requirements [online]. Available at: http://www.lloyds.com/news-and-insight/risk-
insight/emerging-risks-team/cyber-core-data-requirements
Miller, H.I. 2015. The sad saga of silicone breast implants Forbes Science and Technology. [online] 5 Mar. Available at:
https://www.forbes.com/sites/henrymiller/2015/03/04/infuriating-titbits-about-silicone-breast-implants/#3edb05321416
http://www.lloyds.com/news-and-insight/risk-insight/emerging-risks-team/cyber-core-data-requirements

References 45
Stochastic modelling of liability accumulation risk
The New York Times, 2007. Mattel Recalls 19 Million Toys Sent From China [online]. Available at:
http://www.nytimes.com/2007/08/15/business/worldbusiness/15imports.html
St. Myer, T. 2015. Funds to benefit economic development in NW Florida Pensacola News Journal. [online]. Available
at: http://www.pnj.com/story/news/local/pensacola/beaches/2015/08/18/funds-benefit-economic-development-nw-
florida/31934487/
Shiffman, M.A. 1994. Silicone breast implant litigation (Part 1). Medicine and law, [online] 13(7-8), pp.681–716. Available
at: http://www.ncbi.nlm.nih.gov/pubmed/7731351
Sweigart, R.L. 2012. UK Supreme Court Pulls Trigger on Asbestos Liability Insurance. Perspectives on Insurance
Recovery Newsletter.
The Bureau of Ocean Energy Management Regulation and Enforcement. 2011. Report regarding the causes of the April
20, 2010 Macondo Well Blowout. [online]. Available at:
https://docs.lib.noaa.gov/noaa_documents/DWH_IR/reports/dwhfinal.pdf
Transport Canada. 2016. Increasing safety of Canadians by investing in rail improvements [online]. Available at:
http://news.gc.ca/web/article-
en.do;jsessionid=f9b2cb359f777831ec72b8ec6cfac6cb3b74f4a1494338d7cd0a1b71c9b0a8f6.e34Rc3iMbx8Oai0Tbx0S
axuRb3n0?crtr.sj1D=&crtr.mnthndVl=12&mthd=advSrch&crtr.dpt1D=6695&nid=1136529&crtr.lc1D=&crtr.tp1D=1&crtr.yr
StrtVl=2015&crt
Upton, F. 2013. H.R.3204 - 113th Congress (2013-2014): Drug Quality and Security Act [online]. Available at:
https://www.congress.gov/bill/113th-congress/house-bill/3204
Woo, G. 2016. Counterfactual disaster risk analysis (article in press) Variance. [online] Available at:
http://www.variancejournal.org/issues/articlesinpress/Counterfactual-Woo.pdf
World Economic Forum. 2016. Understanding Systemic Cyber Risk: Global Agenda Council on Risk & Resilience.
[online]. Available at: http://www3.weforum.org/docs/White_Paper_GAC_Cyber_Resilience_VERSION_2.pdf