Angular Correlation of Gamma Rays 1. Angular Correlation ...

arX
iv:1
311.
3976
v2 [
astr
o-ph
.GA
] 2
2 Ju
l 201
4
Mon. Not. R. Astron. Soc. 000, 1–15 (2013) Printed 20 February 2018 (MN LATEX style file v2.2)
Stochastic angular momentum slews and flips and their
effect on discs in galaxy formation models
Nelson D. Padilla1,2⋆, Salvador Salazar-Albornoz3,4,1, Sergio Contreras1, Sofıa A.
Cora5,6,7, Andres N. Ruiz7,8,91Instituto de Astrofısica, Pontificia Universidad Catolica de Chile, Santiago, Chile2Centro de Astro-Ingenierıa, Pontificia Universidad Catolica de Chile, Santiago, Chile3Universitats-Sternwarte Munchen, Scheinerstrasse 1, 81679 Munich, Germany4Max-Planck-Institut fur extraterrestrische Physik, Giessenbachstrasse 1, 85748 Garching, Germany5Instituto de Astrofısica de La Plata (CCT La Plata, CONICET, UNLP), Paseo del Bosque s/n, B1900FWA, La Plata, Argentina.6Facultad de Ciencias Astronomicas y Geofısicas, Universidad Nacional de La Plata, Paseo del Bosque s/n, B1900FWA, La Plata, Argentina.7Consejo Nacional de Investigaciones Cientıficas y Tecnicas, Rivadavia 1917, Buenos Aires, Argentina8Instituto de Astronomıa Teorica y Experimental (CCT Cordoba, CONICET, UNC), Laprida 854, Cordoba, X5000BGR, Argentina9Observatorio Astronomico de Cordoba, Universidad Nacional de Cordoba, Laprida 854, Cordoba, X5000BGR, Argentina
Accepted –. Received –; in original form –
ABSTRACTThe angular momentum of galactic discs in semi-analytic models of galaxy formationis usually updated in time as material is accreted to the disc by adopting a constantdimensionless spin parameter and little attention is paid to the effects of accretionwith misaligned angular momenta. These effects are the subject of this paper, wherewe adopt a Monte-Carlo simulation for the changes in the direction of the angularmomentum of a galaxy disc as it accretes matter based on accurate measurementsfrom dark-matter haloes in the Millennium II simulation. In our semi-analytic modelimplementation, the flips seen the dark matter haloes are assumed to be the same forthe cold baryons; however, we also assume that in the latter the flip also entails a dif-ficulty for the disc to increase its angular momentum which causes the disc to becomesmaller relative to a no-flip case. This makes star formation to occur faster, speciallyin low mass galaxies at all redshifts allowing galaxies to reach higher stellar massesfaster. We adopt a new condition for the triggering of starbursts during mergers. Asthese produce the largest flips it is natural to adopt the disc instability criterion toevaluate the triggering of bursts in mergers instead of one based on mass ratios as inthe original model. The new implementation reduces the average lifetimes of discs bya factor of ∼ 2, while still allowing old ages for the present-day discs of large spiralgalaxies. It also provides a faster decline of star formation in massive galaxies and abetter fit to the bright end of the luminosity function at z = 0.
Key words: galaxies: structure, galaxies: general, galaxies: fundamental parameters,galaxies: evolution
1 INTRODUCTION
The formation and evolution of galactic discs in a universedominated by dark matter poses great challenges that stillneed to be solved. For instance, only recently grand designdiscs such as that of the Milky Way have been producedin hydrodynamical simulations with a better treatment ofmultiple gas phases and feedback (Scannapieco et al., 2006)and with the hybrid lagrangian cell code AREPO (Springel,2010). On the other hand, it is difficult to produce largeenough samples of galaxies with these codes to make statis-tical comparisons with galaxy samples extracted from large
⋆ E-mail:[email protected]
surveys such as the Sloan Digital Survey (York et al., 2000)due to the large computational resources required for this incomparison to simulations that only follow dark matter (seefor instance Bower, Benson & Crain, 2012).
In recent years, these problems have been partiallysolved by different approaches such as (i) using resimula-tions of chosen haloes in large dark matter only simulationsto much higher resolutions, as is the case of the Aquariussimulations (Springel et al., 2008). These haloes resembleour own Milky Way′s (MW), and simulations of galaxieswithin these are expected to reproduce the large disc of theMW at least in some cases. These simulations have beenextensively analyzed and different hydrodynamical codeshave been run using the Aquarius simulations (the Aquila
c© 2013 RAS

2 N.D. Padilla et al.
project, Scannapieco et al., 2012), and in some cases theirresults are promising showing grand-design spiral galaxiesin a fraction of the haloes (Marinacci, Pakmor & Springel,2013). (ii) Resimulating larger portions of the MillenniumSimulation (Springel et al. 2005) corresponding to differ-ent environments, of low, average and high matter density;this is the case of the GIMIC project (Galaxies-Intergalacticmedium Interaction Calculation, Crain et al., 2009). How-ever, it turned out that the resulting stellar mass functionof the GIMIC galaxy population is not compatible with theobserved one (Bower, Benson & Crain, 2012). The limitationof this approach is evident since due to the high computa-tional demand of this project, it was not possible to re-runit many times with changing parameters until the resultinggalaxy population matched the observed one. (iii) Currently,the EAGLE project (Evolution of Galaxies and their Envi-ronment, Bower, Benson & Crain, 2012) seems the mostpromising way to obtain fully hydrodynamical simulationsof a galaxy population with the right stellar mass function,that is, with a reasonable galaxy population in which eachgalaxy has evolved embedded in a dark matter halo, withall the associated physical effects, including those involvedin the formation and evolution of galactic discs.
Still, even though cosmological volumes are being sim-ulated using reasonable hydrodynamics, in some cases thereare still issues regarding the resulting efficiency of early starformation, which can be higher than observed (e.g. Powellet al., 2011, Brook et al., 2011, Nagamine 2010, and ref-erences therein). The proposed solution to this appears tocome from adopting higher resolution and introducing addi-tional sources of feedback (e.g. Hopkins et al., 2011, Tasker2011, Kannan et al., 2013).
Another solution to the problem of making large galaxysamples from simulations comes from semi-analytic modelsof galaxy formation. These models are necessarily extremelysimplified versions of the hydro simulations, since a small setof simple equations describes the evolution of, for instance,an entire gas phase in a galaxy (Kauffmann et al., 1999, Coleet al., 2000, see also the reviews by Baugh, 2006, Benson,2010, Silk & Mammon, 2012); this is, however, the reasonwhy it is feasible to generate large galaxy populations withthese models. In particular, the process of star formation isgenerally modeled according to the observed proportionalitybetween star formation rate and projected gas density (e.g.Kennicut, 1998). The proportionality constant involves anefficiency parameter, which is fixed so as to fit the observed z= 0 galaxy luminosity function, among other properties. No-tice that the early over-efficiency of star formation affectingsome hydrodynamical simulations is therefore not presentin semi-analytic models, since they directly fix the efficiencyof star formation by reproducing the observed total mass instars at z = 0.
The ingredients involved in the star formation processin semi-analytics are the disc dynamical time and the massof cold gas contained in the disc (e.g. Cole et al., 2000, Cro-ton et al., 2006, Lagos, Cora & Padilla, 2008, among others).Of the two, the dynamical time is the most delicate in thesense that it depends strongly on the size of the disc, andthis is a challenging quantity as it involves many compli-cated evolutionary processes. For instance, we need to knowthe angular momentum of the disc and which is the influ-ence of the bulge in its final size. Practical answers to these
questions were given by Mo, Mao & White (1998, MMW),by studying the behaviour of discs in numerical simulations.For relaxed haloes, they were able to provide formulae forthe typical disc size that depend on the dark matter halomass, its specific angular momentum, λ, the fraction of massresiding in the disc, and the fraction of mass in the bulge.
However, haloes acquire mass continuously, either in asmooth way or via mergers, and in both cases, the angularmomentum of the halo suffers slews and flips, some of themsmall but others as high as 90 degrees or even more. Bett& Frenk (2012) studied the frequency of flips in dark mat-ter only simulations. They showed that flips are more likelyin mergers, but that they still occur when there is smoothaccretion. If the hot gas is relaxed within the dark matterhalo, as it cools it is highly likely that the disc sitting in thecenter will have a different angular momentum. Analysingthe GIMIC galaxies, Sales et al. (2012) showed that thiseffect can destroy discs completely, making their life moreepisodic than is usually obtained in semi-analytic models,where unless a merger or a disc instability takes place, thedisc keeps growing (on average). In the same line, Aumer etal. (2013) find that the last misaligned accretion influencesthe disc fraction of a galaxy. Other studies of disc galaxiesshow the complex physics of discs. Saha & Naab (2013) findthat the alignment of the angular momentum direction ofthe disc and halo produce stronger bars, which in princi-ple could suggest that not even aligned discs are guaranteedto survive long. In a more cautious note, Bird et al. (2013)analysed the Eris ensemble of resimulated haloes (Guedeset al., 2011), and point out that initial conditions have animportant influence on the final state of the disc of a galaxy.
The aim of this paper is to evaluate the impact onthe properties of galactic discs of the angular momentumslews and flips suffered by dark matter halos using the semi-analytic model of galaxy formation SAG (Cora, 2006; Lagos,Cora & Padilla, 2008; Lagos, Padilla & Cora, 2009a; Tecceet al. 2010). Although the version of the model described inTecce et al. (2010), to which we will refer as the base model,makes full use of the MMW formulae to determine disc sizes,it does not take into account the change of the angular mo-mentum of the discs as they accrete matter. In this paperwe will improve upon this recipe by taking this effect intoaccount, to some degree, developing a new version of thismodel that we will refer to as the flip model. For this pur-pose, we construct a statistics of angular momentum slewsusing the Millennium II simulation (Boylan-Kolchin et al.,2009) and, with the aid of a Monte-Carlo simulation, applyslews in the discs of the semi-analytic galaxies. The result-ing properties of galactic discs impact directly the frequencyof disc instability events suffered by a galaxy, in which thedisc is transferred to the galactic bulge with all the coldgas available being consumed in a starburst. The chance ofbursts increases with the amplitude of the flip of the an-gular momentum of the discs, which makes us implementone additional modification to our model regarding the trig-gering of starbursts during galaxy mergers. Instead of usingmass ratios of the merging galaxies to classify them as majormergers with starburst or minor mergers with and withoutstarbursts, as is considered in the base model, we now applythe disc instability criterion to the remnant galaxy.
One of the possible consequences of introducing angu-lar momentum flips in galaxy discs in the model is that it
c© 2013 RAS, MNRAS 000, 1–15
Angular momentum flips and galaxy formation 3
could affect the rate at which star formation occurs at highredshift. Since a few years back there has been some ten-sion between the observed abundance of massive galaxiesat high redshift and those predicted by semi-analytic mod-els (e.g. de Lucia et al., 2006). Several observational studiespointed at larger populations of high stellar mass galaxiesthan predicted (e.g. Perez-Gonzalez et al., 2008, Ferreras etal., 2009), but with the advent of mid-infrared imaging ofhigh redshift galaxies, this situation was somewhat allevi-ated, as shown by Marchesini et al. (2010). They point outthat if dusty templates are included in the analysis of pho-tometric samples of galaxies with mid-IR coverage, then thetension with the models is reduced. With an increased starformation activity at high redshifts, our new model couldhelp to reduce even further this controversy.
This paper is organised as follows. In Section 2 wepresent the statistics on angular momentum slews extractedfrom the Millennium II simulation (Boylan-Kolchin et al.,2009), and we briefly describe the aspects of the semi-analytic model relevant to the present study and the im-provements introduced regarding the slews of dark matterangular momentum; Section 3 shows the effects of these spe-cific changes on the typical lifetimes of discs in galaxies. Sec-tion 4 shows how with this new model we can follow burstsin mergers using only the disc instability criterion instead ofmass ratios as in the base model. In Section 5 we explore theconsequences of this new treatment on the general propertiesof the model galaxy population, and Section 6 summarisesour results.
2 ANGULAR MOMENTUM SLEWS ANDFLIPS IN A SEMI-ANALYTIC MODEL
We use the SAG (Semi-Analytic Galaxies) semi-analyticmodel of galaxy formation which is based on the one de-scribed by Springel et al. (2001), with improvements on thechemical element production by Cora (2006), the implemen-tation of Active Galactic Nucleus (AGN) feedback in La-gos, Cora & Padilla (2008), and the inclusion of MMW discsizes by Tecce et al. (2010). SAG is run on subhalo mergertrees extracted from a dark-matter only N-body simulation.This simulation is based on the standard ΛCDM scenario,characterized by the cosmological parameters Ωm = 0.28,Ωb = 0.046, ΩΛ = 0.72, h = 0.7, n = 0.96, σ8 = 0.82,according to the WMAP7 cosmology (Jarosik et al., 2011).The simulation was run using GADGET-2 (Springel 2005)using 6403 particles in a cubic box of comoving sidelengthL = 150 h−1Mpc.
In this paper, we introduce angular momentum slewsand flips that will directly affect the galaxy discs. One simpleway to do this is to follow the angular momentum vector ofthe dark matter halo which changes with time, and assumethat the hot gas always carries it, even when cooling downto top up the cold gas supply of the disc. The incomingcold gas brings angular momentum parallel to that of thehalo, but if the halo changed its spin with respect to thetime when the disc was formed, the cooling gas will havea different angular momentum than the disc. Using massweighted averages of the angular momenta of the incomingcold gas and the galaxy disc, Lagos, Padilla & Cora (2009a)followed the changes in the angular momentum of the galaxy
Figure 1. Cumulative distributions of the cosine of αflip, theangle between the angular momenta of a dark matter substructurein the Millennium II simulation before and after accreting matter;these angular momentum changes are commonly referred to asslews or flips. Top and bottom panels correspond to accretionevents between 0 < z < 1 and 1 < z < 5, respectively. Dashedlines show the distribution of flips in merger events, whereas solidlines are for accretion of individual dark matter particles. Thedifferent colors correspond to two different representative rangesin relative mass accretion, corresponding to 0.003 < ∆M/M <0.007 and 0.03 < ∆M/M < 0.1, as indicated in the figure key.
disc. They went even further and extended this to the spinof the black hole (see also Lagos et al., 2011, and Guo et al.,2011).
However, the direction of the angular momentum ofhaloes is difficult to measure accurately; for haloes with lessthan 1000 particles the direction is subject to large con-tributions from numerical noise (e.g. Bett & Frenk, 2012).Therefore, the changes in the direction of the angular mo-mentum of haloes in this case is larger than it would be if
c© 2013 RAS, MNRAS 000, 1–15
4 N.D. Padilla et al.
the haloes were followed with higher resolution. In our case,therefore, we either need to smooth this effect to some de-gree (as was done in Lagos, Padilla & Cora, 2009a), or usea statistical measurement of the typical angular momentumflips of haloes to apply it to a semi-analytic model.
We opt for the latter, for which the first step is to ob-tain a full statistical distribution of flips from a numericalsimulation with enough resolution so that the full dynamicalrange of haloes populated by SAG is covered by our statis-tics. The Millennium II simulation (Boylan-Kolchin et al.,2009) provides us with subhaloes of M > 1010h−1M⊙ withmore than 1000 particles each, fulfilling this requirement. 1
We will use subhaloes instead of haloes from the start,to avoid the influence in the measured angular momentumfrom other substructures. This way satellites will slew ac-cording to the angular momentum of their host substruc-tures and not of their host halo as a whole. Furthermore,central galaxies are this way unaffected by the changes inthe angular momentum of their satellites, which should notcontribute to the central galaxy′s angular momentum untilthe event of a merger.
Figure 1 shows the probability distributions for the co-sine of the angle between the initial and final angular mo-mentum (αflip) of subhaloes that suffer changes in their massby the relative amount indicated in the key (these rela-tive mass ranges are chosen as examples, the actual statis-tics cover a wide range of mass accretion ranging up to∆M/M > 0.5). These angular momentum changes are com-monly referred to as slews or flips. Different line types cor-respond to whether the increase in mass was by a merger(dashed lines) or smooth accretion (solid lines). The statis-tics for smooth accretion are obtained analysing subhaloesthat have not suffered mergers in consecutive snapshots ofthe simulation. To construct this for the case of mergers,we take only subhaloes that are the result of at least onemerger since the previous snapshot and measure their flips.In the case when the merged subhalo mass is larger thanthe sum of its progenitor masses, we assume that the excessmass came from smooth accretion. In this case we lower theamplitude of the flip from mergers using the statistics forsmooth accretion which are measured first. Only after thiscorrection is made we use it for the statistics of mergers.The upper solid (dashed) line indicates that a higher rela-tive mass accretion (merger) increases the chances of a givenangular momentum flip. The upper panel corresponds to lowredshifts, 0 < z < 1, whereas the lower panel to 1 < z < 5,and as can be seen, the chance of angular momentum flipsis higher at higher redshifts.
2.1 Episodic discs
Our application of the probability of slews and flips as away to follow the evolution of the angular momentum ofsemi-analytic galaxy discs is simple. In each snapshot of thesimulation, we calculate the fractional increase in the galaxydisc mass. We then assign a disc angular momentum flip fol-lowing the statistical distributions measured from the Mil-
1 The Millennium II simulation data were obtained usingthe German Astrophysical Virtual Observatory GAVO, athttp://gavo.mpa-garching.mpg.de/MyMillennium/
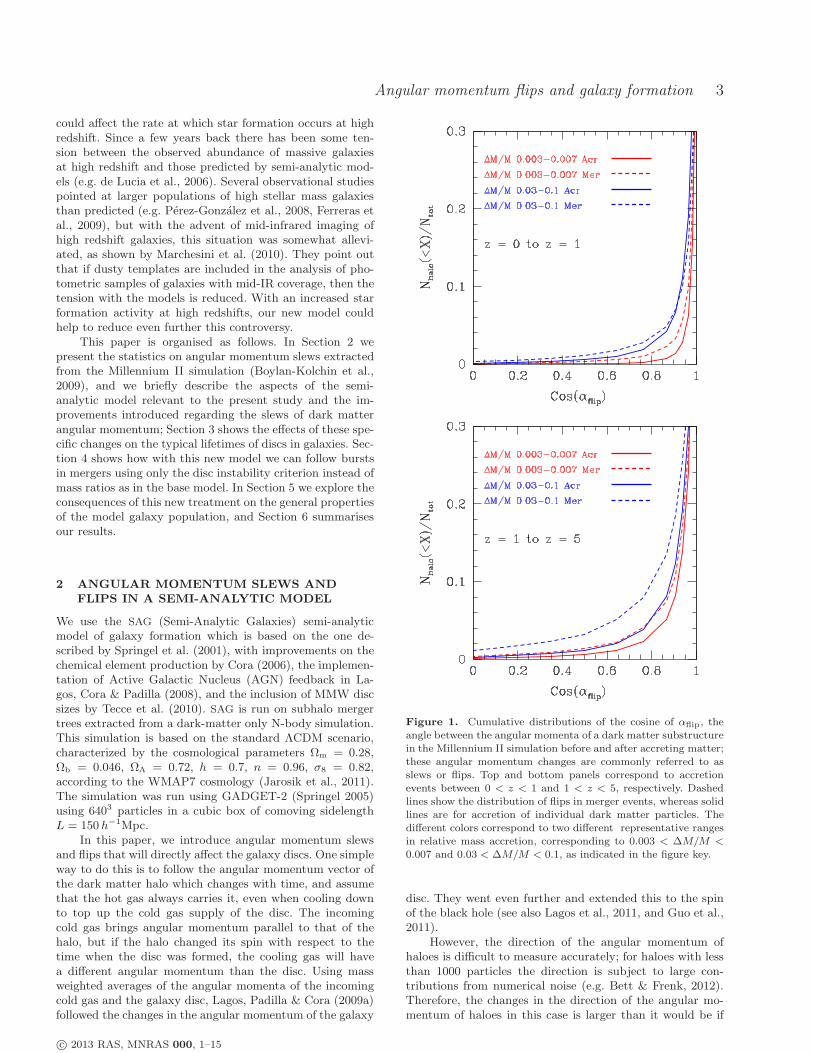
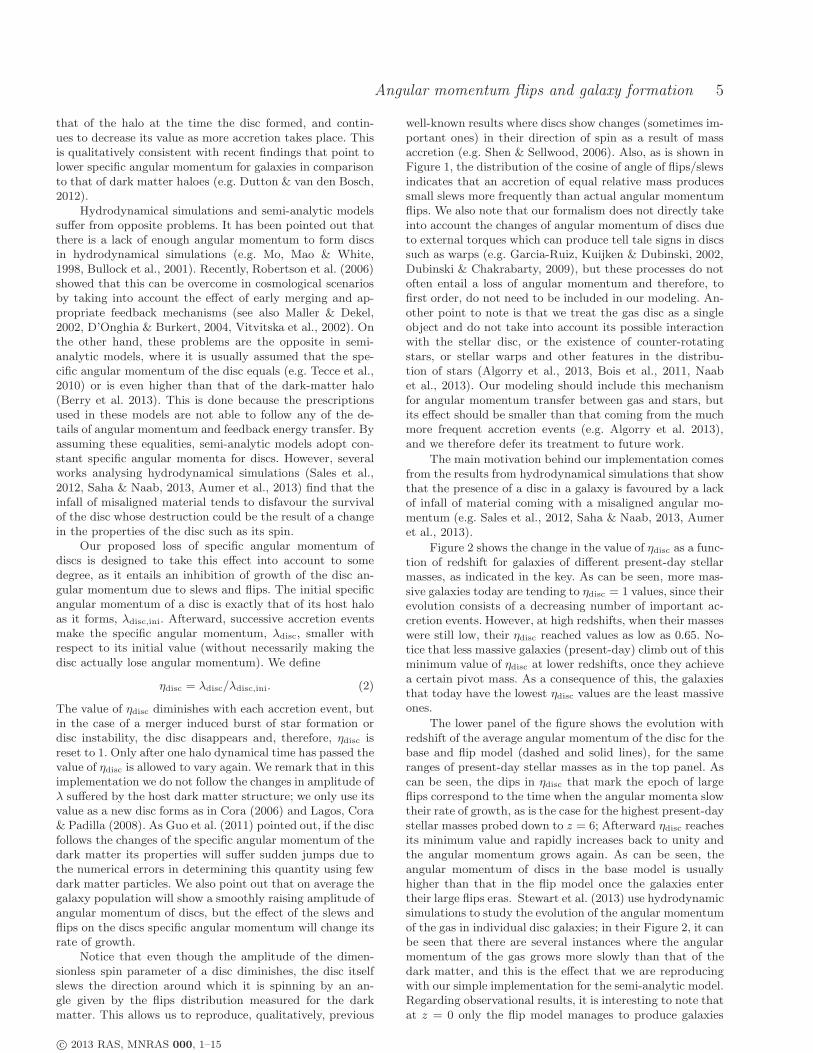
Figure 2. Top: average ηdisc values as a function of redshift forgalaxies with present-day stellar masses in four different ranges,as shown by the different colours indicated in the figure key. Bot-tom: average angular momentum of galaxy discs as a function ofredshift, for the same present-day stellar mass ranges as the toppanel (different colours), for the base and flip model shown asdashed and solid lines, respectively.
lennium II subhaloes, assuming that the same slews or flipsare suffered by the baryons in their centres.
However, the most important assumption is that whenthe disc suffers a flip that amounts to an angle αflip, be-tween the “old” and “new” angular momenta, this lowersthe specific angular momentum of the disc by the followingamount,
λdisc = λdisc,old cos(αflip). (1)
The angle αflip accumulates successive slews suffered byan individual disc in a statistical way. As a result, the spe-cific angular momentum of the disc is generally lower than
c© 2013 RAS, MNRAS 000, 1–15
Angular momentum flips and galaxy formation 5
that of the halo at the time the disc formed, and contin-ues to decrease its value as more accretion takes place. Thisis qualitatively consistent with recent findings that point tolower specific angular momentum for galaxies in comparisonto that of dark matter haloes (e.g. Dutton & van den Bosch,2012).
Hydrodynamical simulations and semi-analytic modelssuffer from opposite problems. It has been pointed out thatthere is a lack of enough angular momentum to form discsin hydrodynamical simulations (e.g. Mo, Mao & White,1998, Bullock et al., 2001). Recently, Robertson et al. (2006)showed that this can be overcome in cosmological scenariosby taking into account the effect of early merging and ap-propriate feedback mechanisms (see also Maller & Dekel,2002, D’Onghia & Burkert, 2004, Vitvitska et al., 2002). Onthe other hand, these problems are the opposite in semi-analytic models, where it is usually assumed that the spe-cific angular momentum of the disc equals (e.g. Tecce et al.,2010) or is even higher than that of the dark-matter halo(Berry et al. 2013). This is done because the prescriptionsused in these models are not able to follow any of the de-tails of angular momentum and feedback energy transfer. Byassuming these equalities, semi-analytic models adopt con-stant specific angular momenta for discs. However, severalworks analysing hydrodynamical simulations (Sales et al.,2012, Saha & Naab, 2013, Aumer et al., 2013) find that theinfall of misaligned material tends to disfavour the survivalof the disc whose destruction could be the result of a changein the properties of the disc such as its spin.
Our proposed loss of specific angular momentum ofdiscs is designed to take this effect into account to somedegree, as it entails an inhibition of growth of the disc an-gular momentum due to slews and flips. The initial specificangular momentum of a disc is exactly that of its host haloas it forms, λdisc,ini. Afterward, successive accretion eventsmake the specific angular momentum, λdisc, smaller withrespect to its initial value (without necessarily making thedisc actually lose angular momentum). We define
ηdisc = λdisc/λdisc,ini. (2)
The value of ηdisc diminishes with each accretion event, butin the case of a merger induced burst of star formation ordisc instability, the disc disappears and, therefore, ηdisc isreset to 1. Only after one halo dynamical time has passed thevalue of ηdisc is allowed to vary again. We remark that in thisimplementation we do not follow the changes in amplitude ofλ suffered by the host dark matter structure; we only use itsvalue as a new disc forms as in Cora (2006) and Lagos, Cora& Padilla (2008). As Guo et al. (2011) pointed out, if the discfollows the changes of the specific angular momentum of thedark matter its properties will suffer sudden jumps due tothe numerical errors in determining this quantity using fewdark matter particles. We also point out that on average thegalaxy population will show a smoothly raising amplitude ofangular momentum of discs, but the effect of the slews andflips on the discs specific angular momentum will change itsrate of growth.
Notice that even though the amplitude of the dimen-sionless spin parameter of a disc diminishes, the disc itselfslews the direction around which it is spinning by an an-gle given by the flips distribution measured for the darkmatter. This allows us to reproduce, qualitatively, previous
well-known results where discs show changes (sometimes im-portant ones) in their direction of spin as a result of massaccretion (e.g. Shen & Sellwood, 2006). Also, as is shown inFigure 1, the distribution of the cosine of angle of flips/slewsindicates that an accretion of equal relative mass producessmall slews more frequently than actual angular momentumflips. We also note that our formalism does not directly takeinto account the changes of angular momentum of discs dueto external torques which can produce tell tale signs in discssuch as warps (e.g. Garcia-Ruiz, Kuijken & Dubinski, 2002,Dubinski & Chakrabarty, 2009), but these processes do notoften entail a loss of angular momentum and therefore, tofirst order, do not need to be included in our modeling. An-other point to note is that we treat the gas disc as a singleobject and do not take into account its possible interactionwith the stellar disc, or the existence of counter-rotatingstars, or stellar warps and other features in the distribu-tion of stars (Algorry et al., 2013, Bois et al., 2011, Naabet al., 2013). Our modeling should include this mechanismfor angular momentum transfer between gas and stars, butits effect should be smaller than that coming from the muchmore frequent accretion events (e.g. Algorry et al. 2013),and we therefore defer its treatment to future work.
The main motivation behind our implementation comesfrom the results from hydrodynamical simulations that showthat the presence of a disc in a galaxy is favoured by a lackof infall of material coming with a misaligned angular mo-mentum (e.g. Sales et al., 2012, Saha & Naab, 2013, Aumeret al., 2013).
Figure 2 shows the change in the value of ηdisc as a func-tion of redshift for galaxies of different present-day stellarmasses, as indicated in the key. As can be seen, more mas-sive galaxies today are tending to ηdisc = 1 values, since theirevolution consists of a decreasing number of important ac-cretion events. However, at high redshifts, when their masseswere still low, their ηdisc reached values as low as 0.65. No-tice that less massive galaxies (present-day) climb out of thisminimum value of ηdisc at lower redshifts, once they achievea certain pivot mass. As a consequence of this, the galaxiesthat today have the lowest ηdisc values are the least massiveones.
The lower panel of the figure shows the evolution withredshift of the average angular momentum of the disc for thebase and flip model (dashed and solid lines), for the sameranges of present-day stellar masses as in the top panel. Ascan be seen, the dips in ηdisc that mark the epoch of largeflips correspond to the time when the angular momenta slowtheir rate of growth, as is the case for the highest present-daystellar masses probed down to z = 6; Afterward ηdisc reachesits minimum value and rapidly increases back to unity andthe angular momentum grows again. As can be seen, theangular momentum of discs in the base model is usuallyhigher than that in the flip model once the galaxies entertheir large flips eras. Stewart et al. (2013) use hydrodynamicsimulations to study the evolution of the angular momentumof the gas in individual disc galaxies; in their Figure 2, it canbe seen that there are several instances where the angularmomentum of the gas grows more slowly than that of thedark matter, and this is the effect that we are reproducingwith our simple implementation for the semi-analytic model.Regarding observational results, it is interesting to note thatat z = 0 only the flip model manages to produce galaxies
c© 2013 RAS, MNRAS 000, 1–15
6 N.D. Padilla et al.
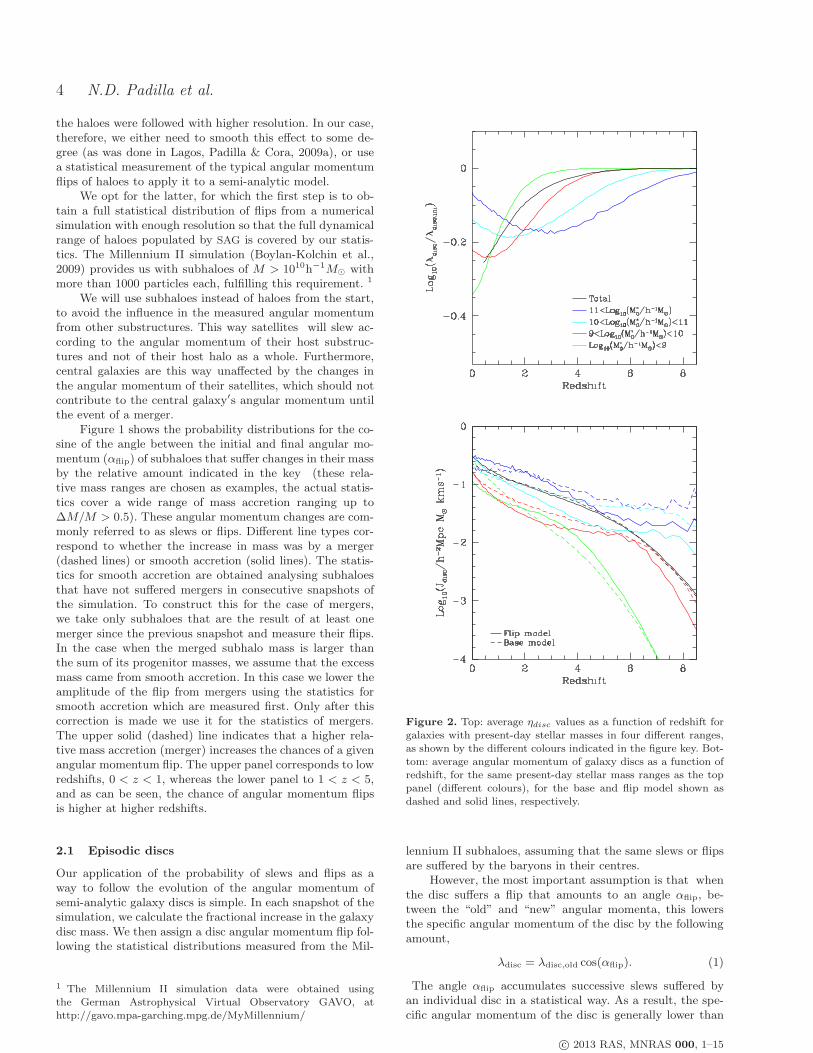
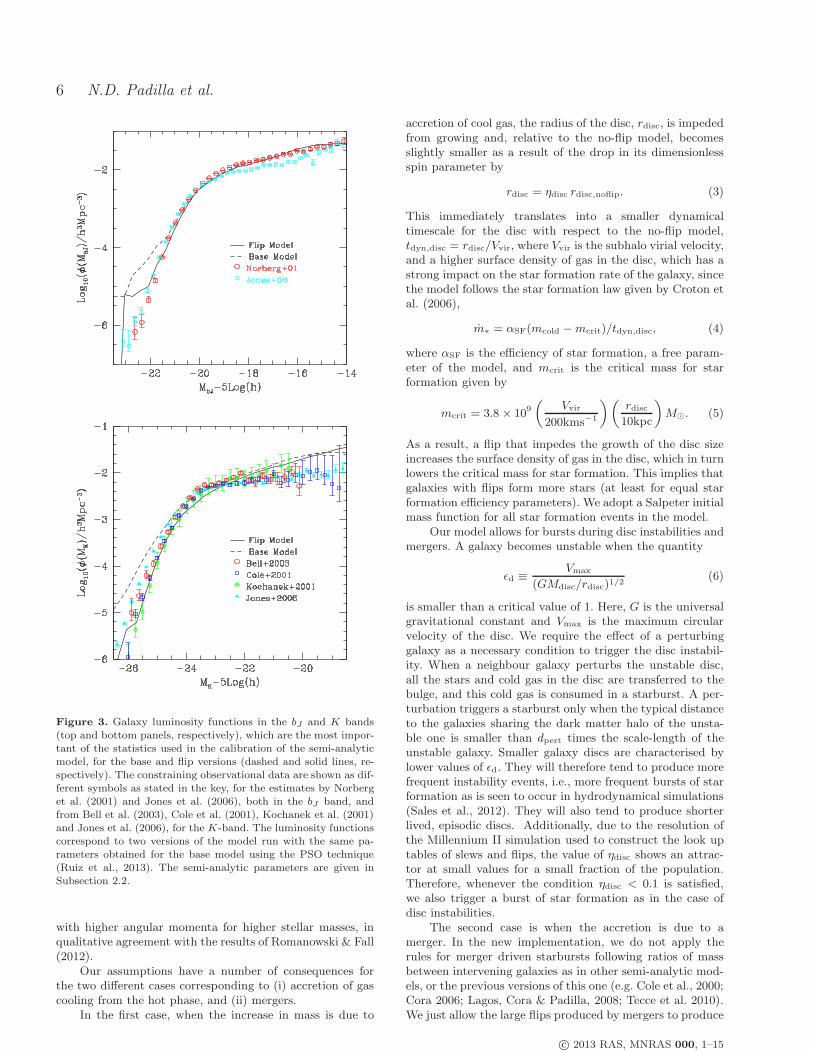
Figure 3. Galaxy luminosity functions in the bJ and K bands(top and bottom panels, respectively), which are the most impor-tant of the statistics used in the calibration of the semi-analyticmodel, for the base and flip versions (dashed and solid lines, re-spectively). The constraining observational data are shown as dif-ferent symbols as stated in the key, for the estimates by Norberget al. (2001) and Jones et al. (2006), both in the bJ band, andfrom Bell et al. (2003), Cole et al. (2001), Kochanek et al. (2001)and Jones et al. (2006), for the K-band. The luminosity functionscorrespond to two versions of the model run with the same pa-rameters obtained for the base model using the PSO technique(Ruiz et al., 2013). The semi-analytic parameters are given inSubsection 2.2.
with higher angular momenta for higher stellar masses, inqualitative agreement with the results of Romanowski & Fall(2012).
Our assumptions have a number of consequences forthe two different cases corresponding to (i) accretion of gascooling from the hot phase, and (ii) mergers.
In the first case, when the increase in mass is due to
accretion of cool gas, the radius of the disc, rdisc, is impededfrom growing and, relative to the no-flip model, becomesslightly smaller as a result of the drop in its dimensionlessspin parameter by
rdisc = ηdisc rdisc,noflip. (3)
This immediately translates into a smaller dynamicaltimescale for the disc with respect to the no-flip model,tdyn,disc = rdisc/Vvir, where Vvir is the subhalo virial velocity,and a higher surface density of gas in the disc, which has astrong impact on the star formation rate of the galaxy, sincethe model follows the star formation law given by Croton etal. (2006),
m∗ = αSF(mcold −mcrit)/tdyn,disc, (4)
where αSF is the efficiency of star formation, a free param-eter of the model, and mcrit is the critical mass for starformation given by
mcrit = 3.8 × 10⁹(
Vvir
200kms−1
)(
rdisc10kpc
)
M⊙. (5)
As a result, a flip that impedes the growth of the disc sizeincreases the surface density of gas in the disc, which in turnlowers the critical mass for star formation. This implies thatgalaxies with flips form more stars (at least for equal starformation efficiency parameters). We adopt a Salpeter initialmass function for all star formation events in the model.
Our model allows for bursts during disc instabilities andmergers. A galaxy becomes unstable when the quantity
ǫd ≡
Vmax
(GMdisc/rdisc)1/2(6)
is smaller than a critical value of 1. Here, G is the universalgravitational constant and Vmax is the maximum circularvelocity of the disc. We require the effect of a perturbinggalaxy as a necessary condition to trigger the disc instabil-ity. When a neighbour galaxy perturbs the unstable disc,all the stars and cold gas in the disc are transferred to thebulge, and this cold gas is consumed in a starburst. A per-turbation triggers a starburst only when the typical distanceto the galaxies sharing the dark matter halo of the unsta-ble one is smaller than dpert times the scale-length of theunstable galaxy. Smaller galaxy discs are characterised bylower values of ǫd. They will therefore tend to produce morefrequent instability events, i.e., more frequent bursts of starformation as is seen to occur in hydrodynamical simulations(Sales et al., 2012). They will also tend to produce shorterlived, episodic discs. Additionally, due to the resolution ofthe Millennium II simulation used to construct the look uptables of slews and flips, the value of ηdisc shows an attrac-tor at small values for a small fraction of the population.Therefore, whenever the condition ηdisc < 0.1 is satisfied,we also trigger a burst of star formation as in the case ofdisc instabilities.
The second case is when the accretion is due to amerger. In the new implementation, we do not apply therules for merger driven starbursts following ratios of massbetween intervening galaxies as in other semi-analytic mod-els, or the previous versions of this one (e.g. Cole et al., 2000;Cora 2006; Lagos, Cora & Padilla, 2008; Tecce et al. 2010).We just allow the large flips produced by mergers to produce
c© 2013 RAS, MNRAS 000, 1–15
Angular momentum flips and galaxy formation 7
Parameter value
αSF 0.20
ǫ 0.25
fBH 0.026
κAGN 1.4× 10⁻³
dpert 21.8
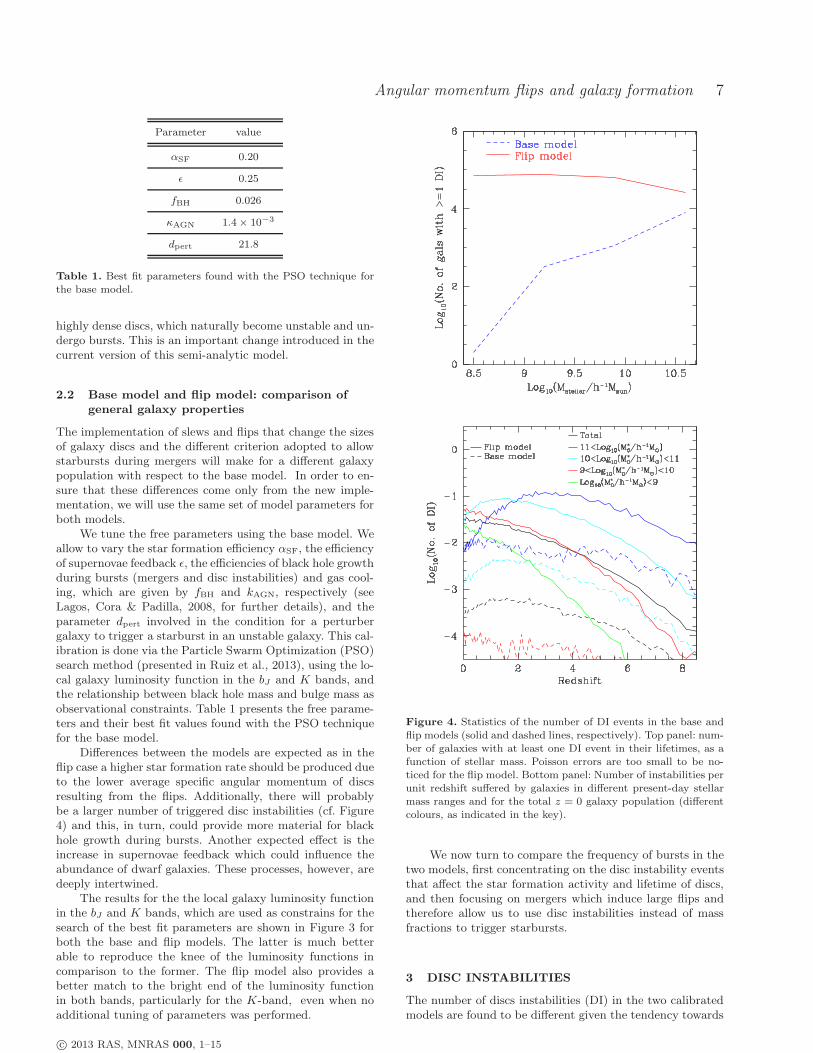
Table 1. Best fit parameters found with the PSO technique forthe base model.
highly dense discs, which naturally become unstable and un-dergo bursts. This is an important change introduced in thecurrent version of this semi-analytic model.
2.2 Base model and flip model: comparison ofgeneral galaxy properties
The implementation of slews and flips that change the sizesof galaxy discs and the different criterion adopted to allowstarbursts during mergers will make for a different galaxypopulation with respect to the base model. In order to en-sure that these differences come only from the new imple-mentation, we will use the same set of model parameters forboth models.
We tune the free parameters using the base model. Weallow to vary the star formation efficiency αSF, the efficiencyof supernovae feedback ǫ, the efficiencies of black hole growthduring bursts (mergers and disc instabilities) and gas cool-ing, which are given by fBH and kAGN, respectively (seeLagos, Cora & Padilla, 2008, for further details), and theparameter dpert involved in the condition for a perturbergalaxy to trigger a starburst in an unstable galaxy. This cal-ibration is done via the Particle Swarm Optimization (PSO)search method (presented in Ruiz et al., 2013), using the lo-cal galaxy luminosity function in the bJ and K bands, andthe relationship between black hole mass and bulge mass asobservational constraints. Table 1 presents the free parame-ters and their best fit values found with the PSO techniquefor the base model.
Differences between the models are expected as in theflip case a higher star formation rate should be produced dueto the lower average specific angular momentum of discsresulting from the flips. Additionally, there will probablybe a larger number of triggered disc instabilities (cf. Figure4) and this, in turn, could provide more material for blackhole growth during bursts. Another expected effect is theincrease in supernovae feedback which could influence theabundance of dwarf galaxies. These processes, however, aredeeply intertwined.
The results for the the local galaxy luminosity functionin the bJ and K bands, which are used as constrains for thesearch of the best fit parameters are shown in Figure 3 forboth the base and flip models. The latter is much betterable to reproduce the knee of the luminosity functions incomparison to the former. The flip model also provides abetter match to the bright end of the luminosity functionin both bands, particularly for the K-band, even when noadditional tuning of parameters was performed.
Figure 4. Statistics of the number of DI events in the base andflip models (solid and dashed lines, respectively). Top panel: num-ber of galaxies with at least one DI event in their lifetimes, as afunction of stellar mass. Poisson errors are too small to be no-ticed for the flip model. Bottom panel: Number of instabilities perunit redshift suffered by galaxies in different present-day stellarmass ranges and for the total z = 0 galaxy population (differentcolours, as indicated in the key).
We now turn to compare the frequency of bursts in thetwo models, first concentrating on the disc instability eventsthat affect the star formation activity and lifetime of discs,and then focusing on mergers which induce large flips andtherefore allow us to use disc instabilities instead of massfractions to trigger starbursts.
3 DISC INSTABILITIES
The number of discs instabilities (DI) in the two calibratedmodels are found to be different given the tendency towards
c© 2013 RAS, MNRAS 000, 1–15

8 N.D. Padilla et al.
smaller sizes of discs in the flip model. The upper panel ofFigure 4 shows the number of galaxies that suffered at leastone disc instability event in their lifetimes (excluding insta-bilities triggered by mergers in the flip model), as a functionof stellar mass. The solid line corresponds to the flip modelin which, as can be seen, more galaxies suffered bursts of starformation triggered by disc instabilities by even more thantwo orders of magnitude, more so for lower mass galaxies.The lower panel shows this excess in more detail. Galaxieswith high present-day stellar masses have had more instabil-ities per unit redshift in the flip model at all redshifts, andgalaxies with different present-day masses all tend to reachsimilar maximum average numbers of DIs per unit redshift.In the base model, however, galaxies with low present-daymasses suffered very little DIs in comparison with higherpresent-day mass galaxies. The increase in instabilities inthe flips versus the base model becomes more important atlower redshifts, with differences of 2 orders of magnitude ormore.
The increase in the frequency of disc instabilities whicheffectively destroy discs translates into different times of discsurvivability. We explore these changes in Figure 5, wherethe top panel shows the time since the last destruction of adisc by triggered disc instabilities (i.e. not including mergerdriven starbursts), as a function of stellar mass. In this casewe are showing the median for the full galaxy population, soin some cases there may not actually be discs in the sample,particularly for high stellar mass central galaxies where theAGN feedback is able to prevent a new disc from forming,or for satellite galaxies which do not receive further supplyof cool gas. However, in the cases where a disc is present,this time corresponds to the age of the disc that survives toz = 0. As can be seen, surviving discs in the flip model showa trend of larger ages for higher stellar masses, ranging from∼ 3Gyr to ∼ 5Gyr for galaxies of M∗ = 3 × 10⁸ h−1 M⊙
to M∗ = 1011 h−1 M⊙, with a large scatter that extendsup to ∼ 8Gyr. The base model shows a similar trend, butsurviving discs are roughly a couple of gigayears older thanin the flip model, with a slightly larger difference for highermass galaxies. Notice that in both models discs in smallgalaxies are relatively young, but discs in massive galaxiesare older, as is the case of the Milky Way (e.g. Jimenez et al.,1998, Purcell et al., 2008, Kazantzidis et al., 2008, Hopkinset al., 2008). In particular, both models allow the existenceof very old discs for grand-design spiral galaxies.
The lower panel of Figure 5 shows the average time be-tween consecutive destructions of the disc down to the lastburst driven by disc instabilities, i.e., it does not include thelast surviving disc of the upper panel. Also, as in the toppanel, this statistics does not include merger induced bursts.The base model presents a clear trend, where low massgalaxies have a higher average time between disc destruc-tion events of 5.5Gyr to 3.8Gyr for M∗ = 3 × 10⁸ h−1 M⊙
and M∗ = 1011 h−1 M⊙, respectively. In the flip model thetrend is similar, with a change from 4.3Gyr to 1.9Gyr forthe same stellar masses, but more importantly, the typicaldisc lifetime is shorter; discs are more episodic. This is due,in part, to the fact that slews and flips affect more intenselygalaxies while they are in a fast growth regime; in this case,the angular momentum flips are more important since theinfalling mass is often a large fraction of the previous discmass. Even galaxies that reached high masses at z = 0 went
Figure 5. Statistics of disc lifetimes in the base and flip models(dashed and solid lines, respectively). Top panel: time since thelast disc instability event, which can be interpreted as the ageof present-day discs, as a function of galaxy stellar mass. Bot-tom: median time between consecutive disc instabilities, whicheffectively represents the typical lifetime of discs previous to thesurviving disc (whose age is represented in the top panel), forgalaxies that have suffered at least one disc instability. Errorbarscorrespond to the 20 and 80 percentiles of the distribution, shownonly for the flip model for clarity.
through this stage at some point, and therefore show a loweraverage disc lifetime than in the base model. In the latter,on the other hand, disc instabilities take more time to oc-cur since only when they reach a critical mass they becomeunstable. In both models, high mass galaxies grew in massduring an epoch of faster mass growth (e.g. Lagos, Padilla& Cora, 2009b) than lower present-day mass galaxies and,thus, show lower average times between consecutive destruc-tions of the disc.
A possible shortcoming of the flip model is that the frac-
c© 2013 RAS, MNRAS 000, 1–15

Angular momentum flips and galaxy formation 9
Figure 6. Fraction of galaxies that have suffered at least onedisc instability in the last 3, 5, and 7 gigayears (red, blue andgreen lines, respectively), as a function of stellar mass, for thebase and flip models (dashed and solid lines, respectively).
tion of galaxies that have suffered instabilities could havegrown to an unacceptable level. However, we find thatthe increase in frequency of instabilities is presentmostly at low stellar masses and high look backtimes (LBT), as can be seen in Figure 6. For stel-lar masses Mstellar > 1011h−1M⊙ the flip model showsonly about 50 percent more instabilities per galaxythan the base model for LBT< 3Gyr. For the samemass range, for LBT< 5 and 7Gyr, the flip modelshows about twice as many instabilities as the basemodel. Notice that a LBT of 3Gyr is about one orderof magnitude longer than a typical dynamical time,and therefore present day massive galaxies shouldshow signs of a recent disc instability in only ∼ 10−15percent of the cases, for both models. The main dif-ference is that in the flip model, this percentage re-mains roughly constant with stellar mass down toMstellar = 108h−1M⊙.
4 DISC INSTABILITY DRIVEN STARBURSTSIN MERGERS
As was mentioned in Section 2, in the flip model we donot make use of mass ratios to decide whether a galaxythat has just undergone a merger suffers a burst of starformation; rather we simply check whether the disc of theremnant galaxy is stable or not.
As the actual mergers of galaxies are governed by themerger trees extracted from the numerical simulation, bothversions, the base and flip models, will have the same totalnumber of mergers between galaxies. However, since the evo-lution of the baryons in each model is different, the fractionof mergers with baryonic mass ratios above a given thresholdcan be different. Furthermore, the conditions for the trigger-ing of bursts are completely different between the models,
Figure 7. Frequency of mergers per galaxy per gigayear, sepa-rated into events with different mass ratios between the merginggalaxies corresponding to major (mass ratios > 0.3, top panel)and minor (bottom) mergers. The flip and base models are rep-resented by solid and dashed lines, respectively. Different coloursdenote wet and dry mergers (see the figure key), where the formercorrespond to events where a starburst was triggered, whereas thelatter refer to mergers with no ensuing star formation.
and therefore the number of mergers with starbursts are alsonot expected to be the same.
In the base model, the parameters that are used to de-cide whether there is a burst in a merger are (i) fmajor = 0.3,the mass ratio that defines a major merger such that if twocolliding galaxies are characterised by a higher mass ratio,all the cold gas will be turned into stars and sent to thebulge, along with any other stars in the discs of the merg-ing galaxies; since in rare cases there will be no cold gas inthe colliding galaxies, the fraction fgas,major = 0.6 is usedto define the major merger as dry or wet, depending onwhether the fraction of gas in the disc of the accreted satel-
c© 2013 RAS, MNRAS 000, 1–15
10 N.D. Padilla et al.
lite is below or above this threshold (Jimenez et al., 2011);notice, however, that fgas,major is not a parameter of themodel as it does not affect the evolution of the galaxies. (ii)fdisc,burst = 0.6 is the fraction of gas in the larger of thegalaxies involved in a minor merger (i.e. with a mass ratiolower than fmajor), above which there will be a burst thatwill transform all the available cold gas into stars and addthem to the bulge, with the stars in the disc left untouchedin this case, and (iii) fburst = 0.05, the minimum mass ratiofor the fdisc,burst condition to take place; if this is not sat-isfied, there is no burst. The flip model drops three of theparameters of the base model by simply producing a burstif the disc of the remnant galaxy is unstable, considering themerger itself sufficient enough a perturbation to trigger theinstability. This way the flip model greatly diminishes theparameter space freedom typical of semi-analytic models.
We compare the frequency of mergers either with orwithout a starburst in the base and flip models in Figure7. We separate the statistics in major and minor mergersaccording to the ratio of the masses of the merging galax-ies and show the results in the upper and lower panels ofthe figure, respectively, for the flip and base models (solidand dashed lines, respectively). The colours help distinguishbetween dry and wet mergers. In the latter type of mergera starburst takes place, whereas in dry mergers there is noimmediate star formation as a result of the merger. The ex-ception to this rule are dry major mergers in the base modelwhich correspond to the case when the satelite cold gas massfraction is below fgas,major.
As can be seen, given that the merger trees extractedfrom the numerical simulation set the total frequency ofmergers, the overall merger rates in both models appear sim-ilar at first sight. However, there are important differencesbetween them. The flip model presents a larger quantity ofdry major mergers, by about a factor of 2 compared to thebase model. Given that a major merger produces an impor-tant flip in the angular momentum of a galaxy disc, andtherefore impedes the growth of the size of the galaxy, thefact that there are no bursts in these cases is an indicationthat the remnant galaxy is not massive enough to becomeunstable and thus trigger a starburst. In the base model, anyavailable gas will undergo a burst. However, as was shown inthe previous section, in the flip model the frequency of discinstabilities is much higher than in the base model, whichacts to balance the offset in merger driven starbursts in themodel, causing little difference to the galaxy colours and tothe morphological fractions as a function of stellar mass, forinstance (cf. following Section and Figure 9).
In the case of minor mergers, the results are very similarbetween the two models, with only a 15 percent deficit (in-crement) of dry (wet) minor mergers in the flip with respectto the base model. Another difference with respect to themajor merger case is then that this slight excess of minorwet mergers is not counteracted by the bursts driven by DIs(cf. previous section), since both effects go in the same direc-tion of having more bursts when the accretion of baryonicmatter carries small amounts of matter.
In the following sections we will then use the flip modelwith disc instabilities as the only driver of starbursts ingalaxies, both in perturbed galaxies and in the remnantgalaxies of mergers, bearing in mind the possible influence of
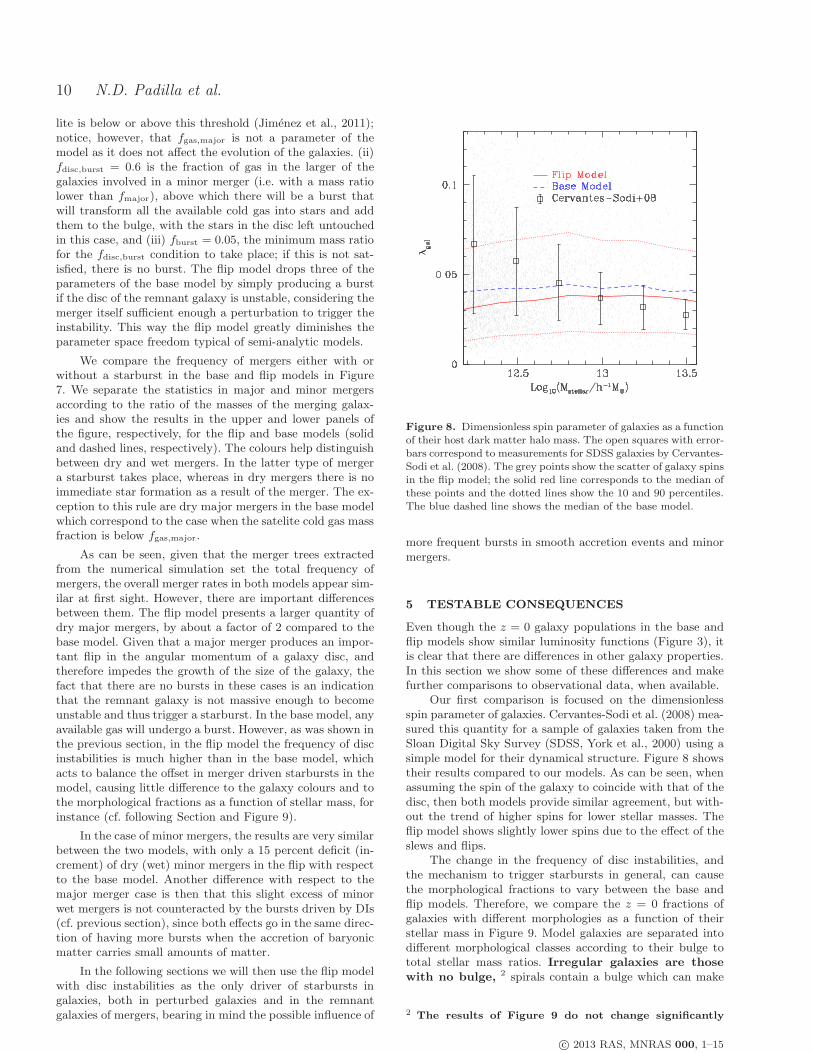
Figure 8. Dimensionless spin parameter of galaxies as a functionof their host dark matter halo mass. The open squares with error-bars correspond to measurements for SDSS galaxies by Cervantes-Sodi et al. (2008). The grey points show the scatter of galaxy spinsin the flip model; the solid red line corresponds to the median ofthese points and the dotted lines show the 10 and 90 percentiles.The blue dashed line shows the median of the base model.
more frequent bursts in smooth accretion events and minormergers.
5 TESTABLE CONSEQUENCES
Even though the z = 0 galaxy populations in the base andflip models show similar luminosity functions (Figure 3), itis clear that there are differences in other galaxy properties.In this section we show some of these differences and makefurther comparisons to observational data, when available.
Our first comparison is focused on the dimensionlessspin parameter of galaxies. Cervantes-Sodi et al. (2008) mea-sured this quantity for a sample of galaxies taken from theSloan Digital Sky Survey (SDSS, York et al., 2000) using asimple model for their dynamical structure. Figure 8 showstheir results compared to our models. As can be seen, whenassuming the spin of the galaxy to coincide with that of thedisc, then both models provide similar agreement, but with-out the trend of higher spins for lower stellar masses. Theflip model shows slightly lower spins due to the effect of theslews and flips.
The change in the frequency of disc instabilities, andthe mechanism to trigger starbursts in general, can causethe morphological fractions to vary between the base andflip models. Therefore, we compare the z = 0 fractions ofgalaxies with different morphologies as a function of theirstellar mass in Figure 9. Model galaxies are separated intodifferent morphological classes according to their bulge tototal stellar mass ratios. Irregular galaxies are thosewith no bulge, 2 spirals contain a bulge which can make
2 The results of Figure 9 do not change significantly
c© 2013 RAS, MNRAS 000, 1–15

Angular momentum flips and galaxy formation 11
Figure 9. Fractions of galaxies with elliptical and irregular mor-phology (red and black, respectively), as a function of stellar mass,for the base (dashed lines) and flip (solid lines) models. The sym-bols with errorbars show the results for nearby galaxies obtainedby Conselice (2006) for the same galaxy types.
up for up to 80 percent of the total stellar mass, and el-lipticals contain more than 80 percent of their stellar massin a bulge. Since the total population of galaxies is dividedinto one of these three types, we only show the results forirregular and elliptical galaxies. As can be seen, the basemodel shows good agreement for the elliptical andirregular galaxies, with only a slight excess of ellip-ticals around Mstellar = 109h−1M⊙ and of irregularsat Mstellar = 108h−1M⊙. In the case of the flip model,the higher frequency of disc instabilities is respon-sible for a drop in the frequency of galaxies with nobulge, which is only slightly at odds with the dataand at the lowest stellar masses the agreement im-proves. The flip model shows reasonable agreementwith the observed fraction of elliptical galaxies, al-though slightly less so than the base model. Noticethough that the flip model parameters were not re-calibrated to fit any observables, and the agreementwhich is already reasonable could improve furtherwith a slightly different set of parameters. Also, weremind the reader that the flip model does quali-tatively improve the agreement with the knee andbright end of the luminosity functions (cf. Figure3); these tests simply show that it also provides areasonable frequency of bulges.
Figure 10 shows a comparison of the cold gas mass andstar formation rate density as a function of redshift (top andbottom panels, respectively) resulting from the two models,for the full galaxy population and for galaxies with differentpresent-day stellar masses, as indicated in the figure key. Thestar formation rate densities of the models are further com-
when changing the upper limit in bulge-to-total stellar
mass ratio for irregulars from 0 to 5 percent.
Figure 10. Top panel: cold gas mass for all the z = 0 galax-ies in each model (black) and different present-day stellar massranges (colours, see the figure key), for the base and flip models(dashed and solid lines, respectively). Bottom: star formation ratedensity as a function of redshift for the full z = 0 galaxy popula-tion (black) and different present-day stellar mass ranges for thebase and flip models (same colours and line types as top panel).The grey points with errorbars correspond to the observationalcompilation by Behroozi et al. (2013).
pared to the data compiled by Behroozi et al. (2013). Themodel star formation rate densities were divided by 1.515 toconvert them to the Chabrier initial mass function adoptedby Behroozi et al.. In both panels, the solid lines representthe flip model, whereas the dashed lines correspond to thebase model. As expected, due to the lower star formationactivity in the latter, the amount of cold gas in galaxies ishigher in the base model, particularly at low redshifts; theflip model spends more cold gas as a result of the slowergrowth of angular momentum due to the action of the slewsand flips. In terms of the full galaxy population, the differ-
c© 2013 RAS, MNRAS 000, 1–15
12 N.D. Padilla et al.
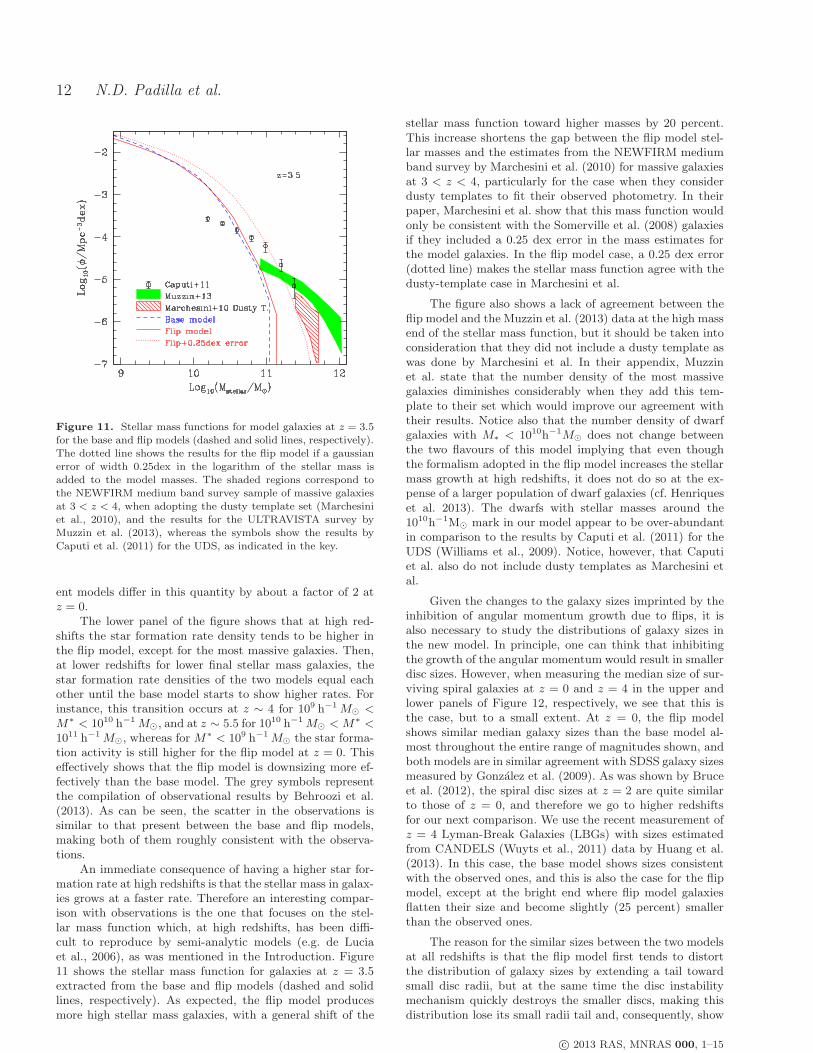
Figure 11. Stellar mass functions for model galaxies at z = 3.5for the base and flip models (dashed and solid lines, respectively).The dotted line shows the results for the flip model if a gaussianerror of width 0.25dex in the logarithm of the stellar mass isadded to the model masses. The shaded regions correspond tothe NEWFIRM medium band survey sample of massive galaxiesat 3 < z < 4, when adopting the dusty template set (Marchesiniet al., 2010), and the results for the ULTRAVISTA survey byMuzzin et al. (2013), whereas the symbols show the results byCaputi et al. (2011) for the UDS, as indicated in the key.
ent models differ in this quantity by about a factor of 2 atz = 0.
The lower panel of the figure shows that at high red-shifts the star formation rate density tends to be higher inthe flip model, except for the most massive galaxies. Then,at lower redshifts for lower final stellar mass galaxies, thestar formation rate densities of the two models equal eachother until the base model starts to show higher rates. Forinstance, this transition occurs at z ∼ 4 for 109 h−1 M⊙ <M∗ < 1010 h−1 M⊙, and at z ∼ 5.5 for 1010 h−1 M⊙ < M∗ <1011 h−1 M⊙, whereas for M
∗ < 109 h−1 M⊙ the star forma-tion activity is still higher for the flip model at z = 0. Thiseffectively shows that the flip model is downsizing more ef-fectively than the base model. The grey symbols representthe compilation of observational results by Behroozi et al.(2013). As can be seen, the scatter in the observations issimilar to that present between the base and flip models,making both of them roughly consistent with the observa-tions.
An immediate consequence of having a higher star for-mation rate at high redshifts is that the stellar mass in galax-ies grows at a faster rate. Therefore an interesting compar-ison with observations is the one that focuses on the stel-lar mass function which, at high redshifts, has been diffi-cult to reproduce by semi-analytic models (e.g. de Luciaet al., 2006), as was mentioned in the Introduction. Figure11 shows the stellar mass function for galaxies at z = 3.5extracted from the base and flip models (dashed and solidlines, respectively). As expected, the flip model producesmore high stellar mass galaxies, with a general shift of the
stellar mass function toward higher masses by 20 percent.This increase shortens the gap between the flip model stel-lar masses and the estimates from the NEWFIRM mediumband survey by Marchesini et al. (2010) for massive galaxiesat 3 < z < 4, particularly for the case when they considerdusty templates to fit their observed photometry. In theirpaper, Marchesini et al. show that this mass function wouldonly be consistent with the Somerville et al. (2008) galaxiesif they included a 0.25 dex error in the mass estimates forthe model galaxies. In the flip model case, a 0.25 dex error(dotted line) makes the stellar mass function agree with thedusty-template case in Marchesini et al.
The figure also shows a lack of agreement between theflip model and the Muzzin et al. (2013) data at the high massend of the stellar mass function, but it should be taken intoconsideration that they did not include a dusty template aswas done by Marchesini et al. In their appendix, Muzzinet al. state that the number density of the most massivegalaxies diminishes considerably when they add this tem-plate to their set which would improve our agreement withtheir results. Notice also that the number density of dwarfgalaxies with M∗ < 1010h−1M⊙ does not change betweenthe two flavours of this model implying that even thoughthe formalism adopted in the flip model increases the stellarmass growth at high redshifts, it does not do so at the ex-pense of a larger population of dwarf galaxies (cf. Henriqueset al. 2013). The dwarfs with stellar masses around the1010h−1M⊙ mark in our model appear to be over-abundantin comparison to the results by Caputi et al. (2011) for theUDS (Williams et al., 2009). Notice, however, that Caputiet al. also do not include dusty templates as Marchesini etal.
Given the changes to the galaxy sizes imprinted by theinhibition of angular momentum growth due to flips, it isalso necessary to study the distributions of galaxy sizes inthe new model. In principle, one can think that inhibitingthe growth of the angular momentum would result in smallerdisc sizes. However, when measuring the median size of sur-viving spiral galaxies at z = 0 and z = 4 in the upper andlower panels of Figure 12, respectively, we see that this isthe case, but to a small extent. At z = 0, the flip modelshows similar median galaxy sizes than the base model al-most throughout the entire range of magnitudes shown, andboth models are in similar agreement with SDSS galaxy sizesmeasured by Gonzalez et al. (2009). As was shown by Bruceet al. (2012), the spiral disc sizes at z = 2 are quite similarto those of z = 0, and therefore we go to higher redshiftsfor our next comparison. We use the recent measurement ofz = 4 Lyman-Break Galaxies (LBGs) with sizes estimatedfrom CANDELS (Wuyts et al., 2011) data by Huang et al.(2013). In this case, the base model shows sizes consistentwith the observed ones, and this is also the case for the flipmodel, except at the bright end where flip model galaxiesflatten their size and become slightly (25 percent) smallerthan the observed ones.
The reason for the similar sizes between the two modelsat all redshifts is that the flip model first tends to distortthe distribution of galaxy sizes by extending a tail towardsmall disc radii, but at the same time the disc instabilitymechanism quickly destroys the smaller discs, making thisdistribution lose its small radii tail and, consequently, show
c© 2013 RAS, MNRAS 000, 1–15

Angular momentum flips and galaxy formation 13
Figure 12. Galaxy radii containing 50 percent of the total flux,as a function of absolute magnitude, for the base and flip models(dashed and solid lines, respectively). Top panel: z = 0 results forspirals, as a function of r-band absolute magnitude, compared toresults from the Sloan Digital Sky Survey Main Galaxy Samplefrom Gonzalez et al. (2009). Bottom: z = 4 sizes of star form-ing galaxies in the models, and Lyman Break Galaxies (dottedlines, Huang et al., 2013) from the CANDELS survey (Wuyts etal., 2011). The errorbars are shown only for the flip model, andindicate the error on the mean.
a similar median value to that of the base model. This effectis present at all luminosities at both redshift ranges.
6 CONCLUSIONS
In this work we presented the implementation of angular mo-mentum slews and flips in a semi-analytic galaxy formationmodel. The aim in doing this was to reproduce in a morerealistic way the fact that often the angular momentum ofdiscs and that of the matter they accrete are not aligned.This lack of alignment is thought to be responsible for the
destruction of discs within dark matter haloes that do notnecessarily undergo a dramatic event such as a merger. Theinteraction of the infalling material with the disc as it arrivesproduces the discs to become unstable, undergo bursts, andfeed new stars to a bulge.
From the hydrodynamical side, Sales et al. (2012) usedthe GIMIC galaxies to show that most of the discs that sur-vive at z = 0 show angular momentum vectors that are bet-ter aligned with the matter at turn around than particles ina spheroid component. This indicates that misaligned infallcould be responsible for the formation of bulges. A possiblereason behind this is that the dark matter halo that hosts agalaxy suffers several stochastic changes in its angular mo-mentum vector as shown by Bett & Frenk (2012). If the hotgas that cools toward the disc is relaxed in this dark matterhalo, in most cases the cooling gas will have an angular mo-mentum that will not necessarily be parallel to that of thecold disc it is destined to feed.
In most semi-analytic models, the resolution of the par-ent dark matter simulation does not allow for the directionof the angular momentum of the halo to be measured withhigh accuracy. For this, at least 1000 particles per halo areneeded, and most semi-analytic models use haloes with ofthe order of 10 or more particles. Therefore, we measuredthe probability of angular momentum flips by a given angleusing subhaloes of the Millennium II simulation (Boylan-Kolchin et al., 2009) after they change their mass by a cer-tain relative amount, in different redshift ranges. We con-struct different probability distributions for when the accre-tion is smooth or due to mergers. In particular, we find thatat high redshifts the same relative increase in mass produceslarger flips in the angular momentum of haloes. This is alsothe case for mergers in comparison to smooth accretion.
We apply flips to the semi-analytic model SAG (Cora2006; Lagos, Cora & Padilla, 2008, Lagos, Padilla & Cora,2009; Tecce et al. 2010) by using Monte-Carlo simulationsfor the flips suffered by the galaxy angular momenta. To dothis, we assume that the distributions of flips measured inthe subhaloes apply as well to the baryons at their centresand that, in addition, their effect is that of slowing downthe growth of angular momentum of discs with respect totheir host haloes. The motivation behind this assumptioncomes from the results of hydrodynamical simulations thatshow that infalling material with misaligned angular mo-menta with respect to the galaxy disc could be responsiblefor its repeated destruction (Sales et al., 2012, Aumer etal., 2013). In our new implementation, the net effect of theflips is that the average disc slows down its angular momen-tum acquisition during its most active growth phase to thencontinue growing at later times. The discs that are more af-fected by this are those which accrete mass with misalignedangular momentum, and are those more prone to undergoinstabilities and to be added to their bulge.
Even though discs are more unstable in the flip model,the galaxies that reach high present-day stellar masses havenot been subject to disc instabilities in just as long a timeas in a model with no flips, i.e., grand-design spiral discsare also old in the flip model. However, the past history ofthese galaxies includes shorter lived previous incarnationsof discs, i.e. more episodic discs, since the flips are moreimportant while a galaxy is still small as it is growing in size
c© 2013 RAS, MNRAS 000, 1–15
14 N.D. Padilla et al.
in larger relative fractions of its mass compared to highermass galaxies.
As the inclusion of flips increases the star formationactivity at high redshifts, the stellar mass function of highredshift galaxies reaches slightly higher masses slightly im-proving the agreement with observations at high redshift.
We also take advantage of the large flips suffered bygalaxies during mergers to use the disc instability conditionto produce bursts in mergers. This way our model reduces itsparameter space, dispensing of three parameters that, in thebase model, are used to determine whether there are burstsvia conditions on different mass ratios of the merging galax-ies. The resulting fractions of wet mergers (i.e. with burstsof star formation) in the flip model are reduced comparedto the base model, but the higher frequency of bursts due toother disc instability events in the former compensates forthis and makes a final galaxy population that is similar inthe two models in terms of colours and morphologies.
Massive galaxies in the flip model form starsmore rapidly at early times, and have less availablecold gas for star formation at later times providinga better fit to the steep fall off of the bright end ofthe luminosity function.
ACKNOWLEDGEMENTS
This work was supported in part by Fondecyt Regular No.1110328, BASAL PFB-06 ”Centro de Astronomia y Tecnolo-gias Afines”. NP and SC acknowledge support by the Eu-ropean Commissions Framework Programme 7, through theMarie Curie International Research Staff Exchange SchemeLACEGAL (PIRSES-GA-2010-269264). We have benefit-ted from fruitful discussions with Yuval Birnboim, DavidWilman, Bruno Henriques, Francoise Combes, Laura Sales,Noam Libeskind, Simon White and Carlos Frenk. We thankthe anonymous referee for helpful comments. NP thanks thehospitality of the Max Planck Institute for Astrophysics atGarching, where part of this work was done and several help-ful discussions were held. The Geryon cluster at the Centrode Astro-Ingenieria UC was extensively used for the calcula-tions performed in this paper. The Anillo ACT-86, FOND-EQUIP AIC-57, and QUIMAL 130008 provided funding forseveral improvements to the Geryon cluster. This work waspartially supported by the Consejo Nacional de Investiga-ciones Cientıficas y Tecnicas (CONICET, Argentina), Secre-tarıa de Ciencia y Tecnologıa de la Universidad Nacional deCordoba (SeCyT-UNC, Argentina), Universidad Nacionalde La Plata (UNLP, Argentina), and Instituto de Astrofısicade La Plata (IALP, Argentina). SAC acknowledges grantsfrom CONICET (PIP-220), Argentina, Agencia Nacional dePromocion Cientıfica y Tecnologica (PICT-2008-0627), Ar-gentina, and Fondecyt No. 1110328, Chile. The MillenniumII Simulation database used in this paper and the web ap-plication providing online access to them were constructedas part of the activities of the German Astrophysical VirtualObservatory (GAVO).
REFERENCES
Algorry, D., Navarro, J., Abadi, M., Sales, L., Steinmetz, M.,Piontek, F., 2013, MNRAS, arXiv:1311.1215
Aumer, M., White, S., Naab, T., Scannapieco, C., 2013,arXiv:1304.1559
Baugh, C., 2006, RPPh, 69, 3101Behroozi, P., Wechsler, R., Conroy, C., 2013, ApJ, 770, 57
Bell, E., McIntosh, D., Katz, N., Weinberg, M., 2003, ApJS, 149,289
Benson, A., 2010, PhR, 495,33Berry, M, Somerville, R., Haas, M., Gawiser, E., Maller,
A., Popping, G., Trager, S., 2013, submitted to MNRAS,arXiv:1308.2598
Bett, P., Frenk, C., 2012, MNRAS, 420, 3324Bird, J., Kazantzidis, S., Weinberg, D., Guedes, J., Callegari, S.,
Mayer, L., Madau, P., 2013, ApJ, 773, 438
Bois, M., et al., 2011, MNRAS, 416, 1654Bower, R., Benson, A., Crain, R., 2012, MNRAS, 422, 2816
Boylan-Kolchin, M., Springel, V., White, S., Jenkins, A., Lemson,G., 2009, MNRAS, 398, 1150
Brook, C. B., et al. 2011, MNRAS, 415, 1051Bruce V., et al., 2012, MNRAS,427, 1666
Bullock, J., et al., 2001, MNRAS, 321, 559Caputi, K. I., Cirasuolo, M., Dunlop, J. S., McLure, R. J., Farrah,
D., & Almaini, O. 2011, MNRAS, 413, 162
Cole, S., Lacey, C., Baugh, C., Frenk, C., 2000, MNRAS, 319, 168Cole, S., et al., 2001, MNRAS, 326, 255
Conselice, J.C., 2006, MNRAS, 373, 1389Cora, S., 2006, MNRAS, 368, 1540
Crain, R., et al., 2009, MNRAS, 399, 1773
Croton, D., et al., 2006, MNRAS, 367, 864De Lucia, G., Springel, V., White, S., Croton, D., Kauffmann, G.,
2006, MNRAS, 366, 499
D’Onghia, E., Burkert, A., 2004, ApJ, 612, 13Dubinski, J. & Chakrabarty, D. 2009, ApJ, 703, 2068
Dutton, A., van den Bosch, F., 2012, MNRAS, 421, 608Ferreras I., Lisker T., Pasquali A., Khochfar S., Kaviraj S., 2009,
MNRAS, 396, 1573
Garca-Ruiz, I., Kuijken, K. & Dubinski. J. 2002, MNRAS, 337,459
Gonzalez, J., Lacey, C., Baugh, C., Frenk, C., Benson, A., 2009,
MNRAS, 397, 1254Guedes, J., Callegari, S., Madau, P., Mayer, L., 2011, ApJ, 742,
438
Guo, X. et al., 2011, MNRAS, 413, 101Henriques, B., White, S., Thomas, P., Angulo, R., Guo, Q., Lem-
son, G., Springel, V., 2013, MNRAS, 431, 3373
Hopkins P., et al. 2008, ApJ 688, 757Hopkins, P. F., Quataert, E., Murray, N. 2011, MNRAS, 417, 950
Huang, K.-H., Ferguson, H., Ravindranath, S., Su, J., 2013, ApJ,765, 68
Jarosik, N., et al., 2011, ApJS, 192, 14
Jimenez R., et al. 1998, MNRAS 299, 515
Jimenez N., Cora, S., Bassino, L., Tecce, T., Smith Castelli, A.,2011, MNRAS, 417, 785
Jones, D., Peterson, B., Colless, M., Saunders, W., 2006, MNRAS,369, 25
Kannan, R., Stinson, G. S., Maccio, A. V., Brook, C., Weinmann,S. M., Wadsley, J., & Couchman, H. M. P. 2013, MNRAS, inpress, arXiv:1302.2618
Kauffmann, G, Colberg, J, Diaferio, A., White, S., 1999, MNRAS,303, 188
Kazantzidis S., et al. 2008, ApJ 688, 254Kennicutt, R., 1998, ApJ, 498, 541
Kochanek, C., et al., 2001, ApJ, 560, 566
Lagos, C., Cora, S., Padilla, N., 2008, MNRAS, 388, 587Lagos, C., Padilla, N., Cora, S., 2009a, MNRAS, 395, 625
Lagos, C., Padilla, N., Cora, S., 2009b, MNRAS, 397, 31LLagos C.D.P., Padilla N., Strauss M., Cora S., Hao L., 2011, MN-
RAS, 414, 2148
Maller, A., Dekel, A., 2002, MNRAS, 335, 487
c© 2013 RAS, MNRAS 000, 1–15
Angular momentum flips and galaxy formation 15
Marchesini D. et al., 2010, ApJ, 725, 1277Marinacci F., Pakmor R. & Springel, V. 2013, arXiv1305.5360McCracken et al. 2012, A&A, 544, A156.Mo, H., Mao, S., White, S., 1998, MNRAS, 295, 319Muzzin, A. et al., 2013, arXiv:1303.4409Naab, T., et al. 2013, MNRAS, arXiv:1311.0284
Nagamine, K. 2010, Advances in Astronomy, 2010Norberg, P., et al. 2001, 328, 64Perez-Gonzalez P., et al., 2008, ApJ, 675, 234Powell, L., Slyz, A., Devriendt, J., 2011, MNRAS, 414, 3671Purcell, C., et al. 2008, arXiv:0810.2785Robertson, B., Bullock, J., Cox, T., Di Matteo, T., Hernquist, L.,
Springel, V., Yoshida, N., 2006, ApJ, 645, 986Romanowsky, A., & Fall, M., 2012, ApJSS, 203, 17Ruiz, A., Cora, S., Padilla, N., Dominguez, M., Tecce, T., Orsi,
A., Yaryura, Y., Lambas, D., Gargiulo, I., Munoz, A., 2013,submitted to MNRAS, arXiv:1310.7034
Saha, K., Naab, T., 2013, MNRAS, 434, 1287Sales, L., Navarro, J., Theuns, T., Schaye, J., White, S., Frenk,
C., Crain, R., Dalla Vecchia, C., 2012, MNRAS, 423, 1544Scannapieco et al. 2012, MNRAS, 423, 1726Scannapieco, C., Tissera, P., White, S., Springel, V., 2006, MN-
RAS, 371, 1125Shen, J. & Sellwood, J. A. 2006, MNRAS, 370, 2Silk, J., Mamon, G., 2012, RAA, 12, 917Somerville, R., Hopkins, P., Cox, T., Robertson, B., Hernquist,
L., 2008, MNRAS, 391, 481Springel V., 2005, MNRAS, 364, 1105Springel, V., et al., 2005, Nature, 435, 629Springel, V., Wang, J., Vogelsberger, M., Ludlow, A., Jenkins,
A., Helmi, A., Navarro, J. F., Frenk, C. S., White, S. D. M.,2008, MNRAS, 391, 1685
Springel, V., 2010, MNRAS, 41, 791Stewart, K., Brooks, A., Bullock, J., Maller, A., Diemand, J.,
Wadsley, J., Moustakas, L., 2013, ApJ, 769, 74Tasker, E. J. 2011, ApJ, 730, 11Tecce, T., Cora, S., Tissera, P., Abadi, M., Lagos, C., 2010, MN-
RAS, 408, 2008Vitvitska, M., Klypin, A., Kravtsov, A., Wechsler, R., Primack,
J., Bullock, J., 2002, ApJ, 581, 799Williams, R. J., Quadri, R. F., Franx, M., van Dokkum, P., &
Labbe, I. 2009, ApJ, 691, 1879Wuyts, S., et al., 2011, ApJ, 742, 96York, D. et al., 2000, AJ, 120, 1579
c© 2013 RAS, MNRAS 000, 1–15