Stimulus Spending Had Spillover Effects, Thanks to …/media/Publications/Regional Economist... ·...
2
I n response to the most recent recession, the U.S. government enacted its largest fiscal stimulus since President Franklin Delano Roosevelt’s New Deal in the wake of the Great Depression. e law, the American Recovery and Reinvestment Act of 2009 (ARRA), had a total budget impact of $840 billion. e apportionments consisted of tax relief, spending on transfer programs such as unemployment insurance benefits, and government spending on goods and services. According to one study, this third category constituted $350 billion of the ARRA. 1 e spending component included, for example, money for public school salaries, green technology, highways, railroads, city buses, local law enforcement, water quality improvement, basic scientific research, federal government vehicle procurement and new facilities for the National Institutes of Health. In all, more than 30 federal agencies and departments helped distribute ARRA funds. Some macroeconomists argue that, at least in theory, government spending is a particu- larly effective way to combat recessions. e immediate impact of a government purchase is to increase gross domestic product (GDP) and hours worked directly because govern- ment spending is one component of GDP. According to the theory, with more income in workers’ hands, there is a second-round effect because these workers use their addi- tional income to buy more consumer goods, leading to even more output and hours worked. e multiplier effect doesn’t stop there. Firms that produce these consumer goods, in turn, put more wage income into the hands of other workers, and the process continues. e process is known as the “gov- ernment spending multiplier.” Although posited as a theory, whether this stimulus mechanism operates in reality has been a hard question for economists to answer. 2 e main stumbling block is lack of data. Here is where the ARRA comes in. e ARRA legislated the collection of data on spending, which is usually highly disaggregated. e recipients of every grant, contract and loan were required to file quar- terly reports that contained ZIP code-level records of dollar amounts (among other information). Peter McCrory, a Ph.D. student in econom- ics at the University of California–Berkeley and former Federal Reserve Bank of St. Louis research analyst, and I used this ARRA data to study the multiplier effect empirically. 3 Our starting point is the observation that roughly one-third of workers in a typical county are employed outside of their county of residence. Commuters working in one county who earn income based on government stimulus spending are likely to return to their home county and purchase additional local goods and services in their county of residence. rough this process, government spend- ing is likely to propagate itself geographically through commuter flows. Using U.S. Census Journey to Work data, McCrory and I organized the U.S. into roughly 1,300 distinct local labor markets, or regions. We then partitioned each of these regions into two subregions. e first is a large subregion, which is the largest county in the region, and the second is a satellite subregion, made up of the combina- tion of the remaining counties within the region. On the figure, I plotted the map of Pennsylvania, one of the states used in our study. Any contiguous mapping of a single color represents a specific regional market, with the large county subregion represented by a darker tone. Black ovals indicate cities in Pennsylvania; the size of the oval is pro- portional to the city’s population. 4 We then asked: How does government spending in one subregion affect its own economic activity, as well as that of its partner subregion? We measured economic activity by each subregion’s employment level and wage bill (total amount paid to workers). 5 We refer to the effect of spending within a subregion as the “direct effect’’; the spending occurring in the neighboring sub- region is referred to as the “spillover effect.’’ We estimated the direct effect by compar- ing the employment and wage bill outcomes of subregions receiving a large amount of ARRA spending to the employment and wage bill outcomes of subregions receiving little ARRA spending. We estimated the spillover effect by comparing the employ- ment and wage bill outcomes of subregions Stimulus Spending Had Spillover Effects, Thanks to Commuters RECOVERY AND REINVESTMENT ACT By Bill Dupor © THINKSTOCK/ISTOCK/3DAN3 The spending component included, for example, money for public school salaries, green technology, highways, railroads, city buses, local law enforcement, water quality improvement, basic scientific research, federal government vehicle procure- ment and new facilities for the National Institutes of Health. 14 The Regional Economist | October 2015
Transcript of Stimulus Spending Had Spillover Effects, Thanks to …/media/Publications/Regional Economist... ·...
In response to the most recent recession, the U.S. government enacted its largest
fiscal stimulus since President Franklin Delano Roosevelt’s New Deal in the wake of the Great Depression. The law, the American Recovery and Reinvestment Act of 2009 (ARRA), had a total budget impact of $840 billion. The apportionments consisted of tax relief, spending on transfer programs such as unemployment insurance benefits, and government spending on goods and services. According to one study, this third category constituted $350 billion of the ARRA.1
The spending component included, for example, money for public school salaries, green technology, highways, railroads, city buses, local law enforcement, water quality improvement, basic scientific research, federal government vehicle procurement and new facilities for the National Institutes of Health. In all, more than 30 federal agencies and departments helped distribute ARRA funds.
Some macroeconomists argue that, at least in theory, government spending is a particu-larly effective way to combat recessions. The immediate impact of a government purchase is to increase gross domestic product (GDP)and hours worked directly because govern-ment spending is one component of GDP. According to the theory, with more income in workers’ hands, there is a second-round
effect because these workers use their addi-tional income to buy more consumer goods, leading to even more output and hours worked. The multiplier effect doesn’t stop there. Firms that produce these consumer goods, in turn, put more wage income into the hands of other workers, and the process continues. The process is known as the “gov-ernment spending multiplier.”
Although posited as a theory, whether this stimulus mechanism operates in reality has been a hard question for economists to answer.2 The main stumbling block is lack
of data. Here is where the ARRA comes in. The ARRA legislated the collection of data on spending, which is usually highly disaggregated. The recipients of every grant, contract and loan were required to file quar-terly reports that contained ZIP code-level records of dollar amounts (among other information).
Peter McCrory, a Ph.D. student in econom-ics at the University of California–Berkeley and former Federal Reserve Bank of St. Louis research analyst, and I used this ARRA data to study the multiplier effect empirically.3 Our starting point is the observation that roughly one-third of workers in a typical county are employed outside of their county of residence. Commuters working in one county who earn income based on government stimulus
spending are likely to return to their home county and purchase additional local goods and services in their county of residence. Through this process, government spend-ing is likely to propagate itself geographically through commuter flows.
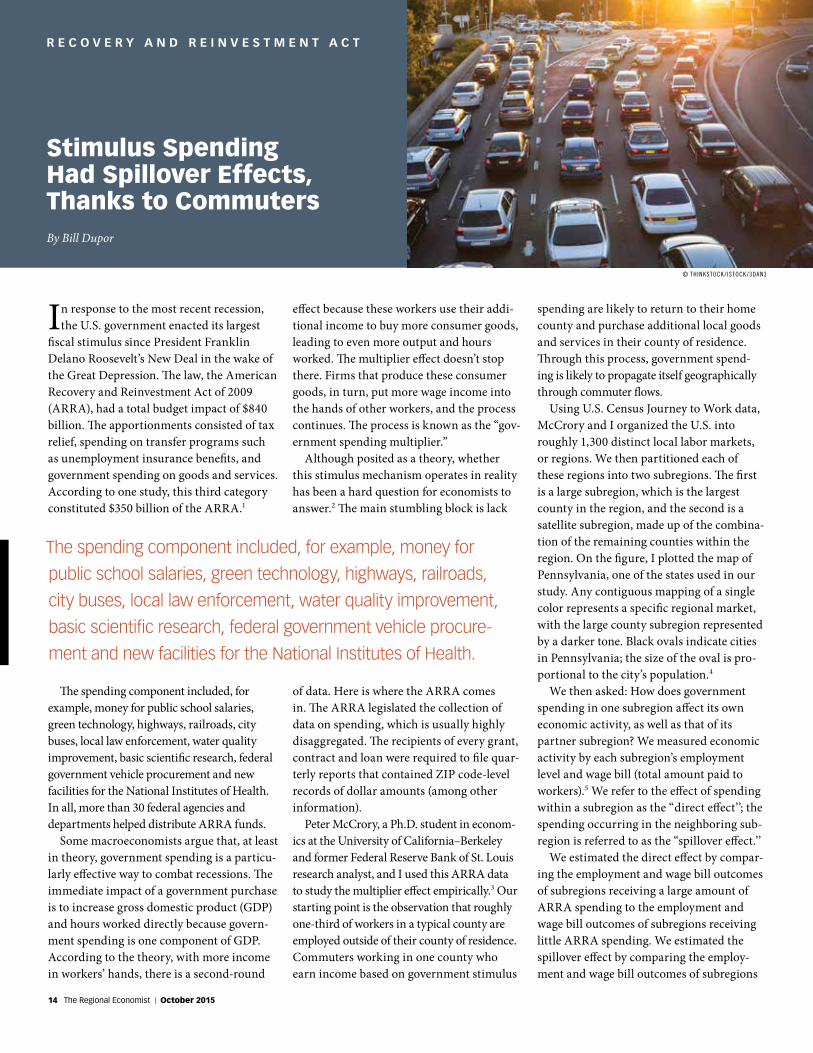
Using U.S. Census Journey to Work data, McCrory and I organized the U.S. into roughly 1,300 distinct local labor markets, or regions. We then partitioned each of these regions into two subregions. The first is a large subregion, which is the largest county in the region, and the second is a satellite subregion, made up of the combina-tion of the remaining counties within the region. On the figure, I plotted the map of Pennsylvania, one of the states used in our study. Any contiguous mapping of a single color represents a specific regional market, with the large county subregion represented by a darker tone. Black ovals indicate cities in Pennsylvania; the size of the oval is pro-portional to the city’s population.4
We then asked: How does government spending in one subregion affect its own economic activity, as well as that of its partner subregion? We measured economic activity by each subregion’s employment level and wage bill (total amount paid to workers).5 We refer to the effect of spending within a subregion as the “direct effect’’; the spending occurring in the neighboring sub-region is referred to as the “spillover effect.’’
We estimated the direct effect by compar-ing the employment and wage bill outcomes of subregions receiving a large amount of ARRA spending to the employment and wage bill outcomes of subregions receiving little ARRA spending. We estimated the spillover effect by comparing the employ-ment and wage bill outcomes of subregions
Stimulus Spending Had Spillover Effects, Thanks to Commuters
R E C O V E R Y A N D R E I N V E S T M E N T A C T
By Bill Dupor
© THINKSTOCK / ISTOCK /3DAN3
The spending component included, for example, money for
public school salaries, green technology, highways, railroads,
city buses, local law enforcement, water quality improvement,
basic scientific research, federal government vehicle procure-
ment and new facilities for the National Institutes of Health.
14 The Regional Economist | October 2015
E N DNO T E S
1 See Drautzburg and Uhlig. 2 The Keynesian multiplier theory itself has a few
problems. Most notably, government spending today that is financed by deficits likely implies higher future taxes. Foreseeing higher future taxes, households may cut consumer spending today, which may partly or fully offset the expan-sionary effects of the government spending.
3 See Dupor and McCrory. 4 In the figure, a gray-colored county represents
either a single-county region or a county belong-ing to a subregion where the large county subre-gion lies outside of Pennsylvania.
5 Data on GDP and its components are not available at the county level.
6 In constructing these estimates, we implemented two econometric adjustment procedures. First, we controlled for additional subregion-specific differ-ences, such as prerecession employment and wage trends. Second, we used instrumental variables to correct for the possibility that ARRA allocations were made to subregions that were hit hardest by the recession.
7 In this study, one job refers to one job-year, that is, one year of employment for a person.
R E F E R E N C E S
Drautzburg, Thorsten; and Uhlig, Harald. “Fiscal Stimulus and Distortionary Taxation.” Working Paper 13-46, Federal Reserve Bank of Philadel-phia, November 2013. See www.philadelphiafed.org/research-and-data/publications/working-papers/2013.
Dupor, Bill; and McCrory, Peter. “A Cup Runneth Over: Fiscal Policy Spillovers from the 2009 Recovery Act.” Working Paper 2014-029C, Federal Reserve Bank of St. Louis, October 2014, revised August 2015. See https://research.stlouis-fed.org/wp/2014/2014-029.pdf.
that have neighboring subregions with gen-erous ARRA allocations to subregions with neighbors that received few ARRA dollars.6
We found substantial direct and spillover effects within regions interconnected by commuter flows. Stimulus spending in one county increased employment and wage pay-ments in places two to three counties away, as long as the areas were sufficiently connected, as measured by commuting patterns.
One dollar of ARRA spending in a subre-gion increased wage payments in that subre-gion by $0.64 and increased wage payments in the neighboring subregion by $0.50. Thus, combining both the direct and spillover effects, there is a greater than one-for-one increase in the wage bill with respect to an increase in the stimulus spending.
We found similar effects when we replaced the wage bill with the employment level as our economic activity measure. During the first two years following the ARRA’s enactment, $1 million of stimulus in one part of a local labor market increased employment by 10.3 persons and increased employment in the rest of the local labor market by 8.5 persons.7
Besides providing evidence in favor of a government spending multiplier, our results should provide caution to other research-ers, as well as to policymakers. Failing to
Determining How the Stimulus Money Spread
SOURCES: Dupor and McCrory, and the Census Bureau.
NOTE: To determine whether the federal government’s recent stimulus spending program had a spillover effect (spilling over from the county where the money was sent to adjoining areas), one of the first steps was to break the United States down into 1,300 local labor markets. The map of Pennsylvania is an example of the sort of portioning that occurred. Each color represents a specific regional market, with the largest county in the region represented by a darker tone of the color and secondary counties in the same region represented by a lighter tone of the same color. A gray-colored county represents either a single-county region or a county associated with a larger region that is anchored outside of the state. Black ovals indicate cities; the size of the oval is proportional to the city’s population.
take into account positive spillovers could lead policymakers to underestimate the total social benefit of government fiscal intervention.
Research on fiscal policy spillovers is far from complete. In particular, there are other potential spillovers besides those given by geographic proximity. For example, another spillover may arise because the location of government spending may not coincide with the place at which the taxes to cover that spending will be paid. Suppose that New Jersey residents pay a larger share of the federal tax bill relative to residents of other states. Stimulus spending in another state could have a negative spillover effect on New Jersey even if the two states are far apart geographically. This could occur if citizens in New Jersey reduce investment in anticipation of higher future taxes that will need to be paid to finance the out-of-state stimulus.
Bill Dupor is an economist at the Federal Re-serve Bank of St. Louis. For more on his work, see https://research.stlouisfed.org/econ/dupor.
The Regional Economist | www.stlouisfed.org 15