Stimulating usage problem generation: An urban mobility ...
36
HAL Id: hal-02265560 https://hal.archives-ouvertes.fr/hal-02265560v2 Submitted on 27 Aug 2019 HAL is a multi-disciplinary open access archive for the deposit and dissemination of sci- entific research documents, whether they are pub- lished or not. The documents may come from teaching and research institutions in France or abroad, or from public or private research centers. L’archive ouverte pluridisciplinaire HAL, est destinée au dépôt et à la diffusion de documents scientifiques de niveau recherche, publiés ou non, émanant des établissements d’enseignement et de recherche français ou étrangers, des laboratoires publics ou privés. Stimulating usage problem generation: An urban mobility case study Ouail Al Maghraoui, Flore Vallet, Jakob Puchinger, Bernard Yannou To cite this version: Ouail Al Maghraoui, Flore Vallet, Jakob Puchinger, Bernard Yannou. Stimulating usage prob- lem generation: An urban mobility case study. Design Studies, Elsevier, 2019, 64, pp.27-63. 10.1016/j.destud.2019.07.001. hal-02265560v2
Transcript of Stimulating usage problem generation: An urban mobility ...

HAL Id: hal-02265560https://hal.archives-ouvertes.fr/hal-02265560v2
Submitted on 27 Aug 2019
HAL is a multi-disciplinary open accessarchive for the deposit and dissemination of sci-entific research documents, whether they are pub-lished or not. The documents may come fromteaching and research institutions in France orabroad, or from public or private research centers.
L’archive ouverte pluridisciplinaire HAL, estdestinée au dépôt et à la diffusion de documentsscientifiques de niveau recherche, publiés ou non,émanant des établissements d’enseignement et derecherche français ou étrangers, des laboratoirespublics ou privés.
Stimulating usage problem generation: An urbanmobility case study
Ouail Al Maghraoui, Flore Vallet, Jakob Puchinger, Bernard Yannou
To cite this version:Ouail Al Maghraoui, Flore Vallet, Jakob Puchinger, Bernard Yannou. Stimulating usage prob-lem generation: An urban mobility case study. Design Studies, Elsevier, 2019, 64, pp.27-63.�10.1016/j.destud.2019.07.001�. �hal-02265560v2�

1
Stimulating usage problem generation: An urban mobility case study
Ouail Al Maghraoui1,2; Flore Vallet1,2; Jakob Puchinger1,2 ; Bernard Yannou1
1 Laboratoire Genie Industriel, CentraleSupélec, Université Paris-Saclay 2 IRT SystemX, Paris-Saclay
Abstract
Designers improve urban mobility solutions by investigating archetypal usage problems in existing
mobility systems. User-centred design methods help accomplish this task, but lack effectiveness when not
supported by appropriate tools. Here we posit that the use of a traveller-centred stimulus improves the
effectiveness of travel problem generation. To test this hypothesis, an experiment is conducted with two
control groups as a baseline for non-stimulated problem generation and two experimental groups that
are provided with a traveller-centred stimulus. The two sets of groups are composed of one group of
urban mobility experts and one group of non-experts. Results show that stimulated groups generate novel
ideas with a greater variety covering most of the traveller experience dimensions than non-stimulated
groups.
Keywords – User centred design, user participation, design problem(s), case study, stimulus
Introduction
Framing problems in design practice can be a hard task if designers are not familiar with the problem they
are dealing with (Dorst, 2011). This is why designers systematically take time to first accumulate and order
the knowledge they need to assimilate the problem at hand (Lawson, 2005: p 34). Maher and Poon (1996)
and Dorst and Cross (2001) describe a design process as an alternation between relevant questions and
answer exploration for the designer. This co-evolution model of design explains the developing
relationship between the “problem space” and the “solution space”, see also (Yu, Gu, Ostwald, & Gero,
2014); it has according tothem a close correlation with the occurrence of design creativity as it has also
been shown by Wiltschnig et al. (2013). However, most of innovative design processes are practically
described as a sequence of problem identification, ideation and solution design; let us mention Design
Thinking, Radical Innovation Design (Yannou et a., 2016), Blue Ocean Strategy (Kim & Mauborgne, 2005),
Business Model Canvas (Osterwalder et al., 2014). Kruger and Cross (2006) show that using a problem
driven design strategy tends to produce the best results in terms of the balance of both overall solution
quality and creativity. However, the problem itself can be understood differently among designers
(Harfield, 2007). Indeed, in the BMC process (Osterwalder et al., 2014), the problem is described as a
series of customer profiles defined as a triplet of pains, gains and jobs – personal and professional -. In
general, the problem to start with is expressed by negative aspects of user experience as well positive and
expected aspects. Yannou et al. (2016) and Lamé, Yannou, & Cluzel (2018) argue that the most tangible
and less questionable way to model the design problem is to focus on user pains or problems in their
activities or usage situations and that they can be detected by appropriate observations. In the same way,
for the need-seeker innovation strategy described by Jaruzelski, Staack, and Goehle (2014), the idea that
rather than looking for technological breakthroughs and pushing them on consumers (techno-push
2
innovation), designers can pull products from thorough analysis of the behaviour and problems met by
users. Finally, TRIZ methodology (Savransky, 2000) also favours expressing the problem in negative terms
as contradictions – these two performances are not possible at the same time -.
This is why, in this paper, we will focus on the negative aspects of traveller experience as a primary,
necessary and less questionable way to express the design problem. Being conscious that a more holistic
view of traveller experience would be to consider both negative and positive aspects.
The wider the spectrum of usage problems, the more successful the user-centred innovation is likely to
be, as the system design will be made to meet users’ wants and needs rather than manufacturer-centric
goals (von Hippel, 2005). Involving users in the design process is consequently vital to any user-centred
design endeavour (Abras et al., 2004).
User-centred design practice involves users in different ways and forms (Hanington, 2003). Most user-
centred methods involve users in more than just usability-testing (Vredenburg et al., 2002) and also
include diagnosis of existing systems, where users are asked to express the problems they experience
using these systems, typically in the form of interviews or focus groups (Céret et al., 2013). However,
diagnosing an existing system remains a technically-centred process that uses the knowledge of the users
as an input to improve technical solutions or solve technical problems (Gasson, 2003).
Human-centred design aims to meet users’ goals and interests (Boy & Narkevicius, 2014). Designers then
become facilitators, setting the design framework where users can co-create with them (Sanders &
Stappers, 2008). This human-systems integration process designing social-technical systems rather than
purely technical ones involves the natural design ability that all users have (Boy & Narkevicius, 2014;
Norman et al., 2016; Cross, 1999). However, for this participatory design practice to be successful,
appropriate tools should be used in order to catalyse user voice (Sanders, 2002). Various methods have
been employed in design context to stimulate participants to reflect on their experiences, for example
ethnographic material (Buur, & Sitorus, 2007), mock ups (Ehn & Kyng, 1991) or cultural probes to provide
inspirational data (Gaver, Dunne & Pacenti. 1999). In ideation sessions, users are supported with stimuli
to unlock broader exploration of different areas of their knowledge network (Santanen et al., 2004). If
external stimuli are proved to be useful to inspire designers, these may also cause fixation effects
(Vasconscelos and Crilly, 2016). Stimuli for ideation present various representation modes, like for
instance text, real objects, images or videos (Vasconscelos and Crilly, 2016).
This paper is a part of a research project dealing with human-centred innovation in the context of urban
mobility. Urban mobility has recently gained increased attention from design communities, as it poses
challenges when it comes to designing mobility systems as a simple set of products and services (Wartzack
et al., 2017), and from manufacturers and transport operators as they seek to shift towards a more
traveller-centred vision of urban mobility systems design (OECD, 2014).
People travel from A to B within a geographical area using multiple transportation means and services,
and these systems are produced and operated by different providers (Mitchell et al., 2016), which leads
to travellers experiencing multiple problems (travel problems) when using a combination of these systems
in a door-to-door travel experience. This accounts for the unique challenges of the urban mobility context.
Consequently, the process, models, knowledge, and expertise used in design need to take into account
the complexity of urban mobility systems (Sussman et al., 2005) as an endeavour of designing a complex
system (Buchanan, 1992).

3
Regarding problem identification (Morgan, 1997: p 13), focus groups bring out the global view that users
have concerning a system that they use collectively, such as an urban mobility system (Grosvenor, 2000).
However, transportation design research rarely considers travel problems identification as an design
knowledge output (Coughlin, 2001; Kerschner & Aizenberg, 2004; Cunningham et al., 2000). Even when
travellers are asked to express the problems they encounter, they are not supported to open up and tell
more about their traveller experience. Their experience is often split into travel stages or reduced to the
interaction that occurs between a traveller and an artefact. Without a traveller-centred stimulus, they end
up expressing a handful of problems that cover a narrow range of dimensions of the traveller experience.
Kelly & Matthews (2014) underline the importance of considering other relevant relationships in rich
context experiences. The user in the context of urban mobility should be considered as a traveller in order
to take into account his/her interaction with other travellers, with multiple systems through time and
space in a door-to-door experience.
The research question we address in this paper is: What is the effect of a traveller-centred stimulus on the
effectiveness travel problems generation?
To answer this question, an experiment is conducted with four different groups: two control groups are
used as a baseline for a non-stimulated focus group, and two experimental groups are provided with a
model adapted from TXCM—a Traveller eXperience Conceptual Model (Al Maghraoui et al., 2017).
Working out from four main sources of problems (technical, personal, contextual, and activity-related),
eleven categories are developed as archetypal perceived travel problems.
Section 1 examines the transportation research using user-centred methods to identify usage problems
of urban mobility systems. It then reviews ideation effectiveness metrics to set a basis for evaluating travel
problem generation. Section 2 discusses testing such a design tool in the form of an experiment. The
traveller-centred design tool is then presented as the stimulus that focus group participants use for travel
problem generation. The experimental setup shows how different ideation metrics are evaluated from
the four focus groups. Section 3 analyses the results to uncover how each of the selected ideation
effectiveness metrics is affected by the use of the traveller-centred design tool. This analysis then goes on
to discuss the merits of involving users in developing design tools and how this practice can be improved
for usage problem identification (sections 4 and 5).
1. Background
The knowledge that designers obtain from users can be acquired through the whole design process (Buur
& Matthews, 2008). The ideas that designers get from users through design methods are not only about
the solution but can encompass every single basic element of thought contributing to advancing design
knowledge (Jonson, 2005). Good ideas need appropriate ideation components for users to produce the
targeted knowledge (Hernandez et al., 2010).
Reviewing of the transportation research dealing with the identification of travel problems highlights how
considering the point of view of travellers is crucial to diagnosing urban mobility systems. Reviewing
selected metrics for assessing problems ideation sets a basis for evaluating travel problems as ideas.
1.1. Identification of travel problems
Using user-centred methods in transport systems research helps emerge insightful problems that
travellers may experience during their use of urban mobility systems.

4
In diagnosing public transportation systems for users with cognitive disabilities, Fischer & Sullivan Jr.
(2002) involved university researchers, assistive technology specialists, transportation planners, and
technology developers. Traveller input came from answers to surveys and feedback from interviews with
an assistive care community group. Sammer et al. (2012) led a more in-depth analysis of the specific needs
and experiences of impaired-mobility travellers. In addition to surveys, they used face-to-face interviews
to collect information about trips and personal attitudes to social and transport issues with their
impairments, and thus set up a typology of problems based on respondents’ answers.
Katzev (2003) approached transportation problems from the perspective of urban communities. In
demonstrating how car-sharing could be a good solution for environmental and social issues, he studied
car-sharing and car-owning communities through the lens of their mobility behaviour. The main metrics
for trip behaviour were miles and frequencies. No substantial qualitative material about this behaviour
was gathered other than the reasons people had for joining car-sharing communities. A deeper behaviour
analysis was conducted by Sopjani et al.(2016) who canvassed new users of an electric carpooling system
for their views and thoughts on how their habits have changed. This allowed them to create user profiles
including variables such as lifestyle, perceived newness, and awareness.
Splitting service quality into different attributes, the trip into different stages, and users into different
profiles, Woodcock et al.(2013) and Ettema et al. (2016) led productive investigations on user satisfaction
with intermodal trips. Differentiation of service quality attributes allowed them to evaluate overall
satisfaction regarding each travel stage and to set each quality attribute. However, they did not elicit the
problems that contribute to travellers’ dissatisfaction nor the causality between different travel stages
(e.g. the effect of a bus delay on satisfaction with waiting time at the next transport mode).
The same limitations remerge when designing user-oriented information for transportation systems
(Hörold et al., 2013). When the trip is modelled as a set of tasks and the information is designed on that
basis, it loses fluidity through the whole journey, especially when travellers are not familiar with using the
online smartphone platforms (Beul-Leusmann et al., 2013). Kremer et al. (2017) proposed a holistic view
of user experience journeys in a bike-sharing system to tackle this lack of through-trip fluidity. They
consider approaches such as emotional dynamics and interaction steps, but the process of defining usage
problems still keep the travel stages separate.
Read et al. (2017) used a large set of human factors methods for transport analysis and design. Interviews
helped uncover the decision-making process of travellers while crossing the railway system, and user
scenarios unfolded the course of the crossing episode. However, in improving the crossing experience,
the study limited the problems definition to “unplanned events that critically affect objectives”.
Consequently, not all of the essential problems related to the traveller’s physical or psychological
condition or to the design of the railway system’s components were considered. Moreover, even when
users actively participate as stakeholders in the format of focus groups, they only serve as a means for
concept idea evaluation, and are not actually involved in the problems definition.
Transportation research is increasingly using focus groups as a design method to improve transportation
solutions (Coughlin, 2001; Kerschner & Aizenberg, 2004; Cunningham et al., 2000; Santana et al., 2018).
The common denominator to this scholarship is their pre-defined focus on traveller problem-solving.
Indeed, they set the problem first, and then ask participants questions about their experience regarding
the problem at stake.

5
In summary, urban mobility research does not usually integrate enough contextual complexity in
identifying travel problems. Moreover, most often, it considers travel problems as fragmented travel
episodes, ignoring their links to other episodes. Furthermore, user-centred methods have been used in
cases but as a means to answer predefined research questions that under-involve users. Given the lack of
traveller experience-relevant dimensions for setting travel problems, a solution to assist travel problems
ideation needs metrics to be evaluated.
1.2. Effectiveness of travel problems ideation
The conclusions of an ideation experiment can diverge when the measures of quality of ideas are changed
(Reinig et al., 2007). It is therefore important to carefully set the metrics that would reflect the
effectiveness to be measured and the insights it brings besides quantity.
For an idea to be considered as a piece of design knowledge, it needs to accomplish its function. It should allow the designer to attain his design goal (Reich, 1995). The evaluation can concern either the ideation process or the ideation outcomes. Shah (2003) demonstrates the difficulties involved in measuring the effectiveness of cognitive ideation processes, and therefore proposes novelty, variety, quality, and quantity as basic metrics defining ideation outcome effectiveness. It is the designer’s job to pick the right meaning for each metric depending on the nature of ideas to be evaluated, the design goal, and whether ideas are to be evaluated separately or in groups. One of the rare examples in the scholarship dealing with problems as ideation outcomes uses quantity, creative quality, and time spent in divergent thought on problem-finding as metrics (Basadur et al., 1982). However, in this example, the scope of problem-finding effectiveness is tailored to training for industrial actors in problem-solving creativity.
If ideas are design concepts, quality can be defined as the technical feasibility of an idea and how well it
meets the design specifications (Shah et al., 2000). Dean et al. (2006) went a step further and defined
workability, relevance, and specificity as sub-metrics for quality. These metrics remain relevant only for
design concept generation, but in Shah’s definition, the quality of an idea is a distance between the idea
and some reference, regardless of the idea’s nature. If the design goal is to identify usage problems, ideas
should be grounded in users’ real-world practice as a pragmatic piece of knowledge (Creswell, 2009).
Both novelty and variety need a basis of comparison in order to be measured (Verhaegen et al., 2013).
Novelty sets the originality of an idea among other ideas or a group of ideas compared to another group
of ideas (Peeters et al., 2010). Variety needs a tree-structured concept space as reference for how function
is satisfied (Shah, 2003) but only works for design concept generation. Disregarding the nature of ideas,
the tree structure stands for the genealogy of idea abstraction, which can be applied to every kind of idea.
What is important is that there is an abstract structure of ideas. If the ideas of two groups of participants
are to be compared in terms of novelty and variety, they need a concept space that is embedded in the
reality of the problems. The genealogy of the problem space should reflect the diversity of usage reality
and not just physical and working principles as for technical solution ideas.
Quantity is a generic metric that can be applied to any kind of ideas by counting. However, when the
design tool to be evaluated uses examples, it becomes vital to consider design fixation (Jansson & Smith,
1991) in setting quantity metrics. As quantity sub-metrics for design fixation concerns, Atilola et al. (2016)
set quantity of non-redundant ideas, number of repeated example features, and percentage of example
features used. If travel problems are related to each other, then no redundant problem will be identified

6
as long as each problem is a cause or consequence of a previous one. Moreover, ideation flow would be
sustained by the emergence of new problems that would themselves be used in generating other ones.
The scholarship considering usage problems as ideas fails to consider the effectiveness of framing usage
problems as an ideation process and problems as ideation outcomes. Therefore, to answer the research
question of this paper, an experiment is set up with metrics tailored to measure the effect of using a
stimulus on the effectiveness of problem framing.
2. Research method
Identifying usage problems in urban mobility systems starts with an exploratory problem identification
study, for which small-sized focus groups are a suitable ideation format (Morgan, 1997, p 13; Tang & Davis,
1995). The participants must be made to interact while responding to the facilitator’s questions, because
urban mobility problems are mostly experienced collectively. This study is therefore a small-scale design
experiment that needs to be rigorously set (Cash et al., 2012).
Based on the problem framing (as ideation) effectiveness metrics in section 1.2, this paper evaluates a
stimulus (a design tool) for emerging the travel problems (as ideation outcomes) generated in traveller
focus groups. Quality of the outcomes is assumed as taken for granted, as the travellers themselves
generate the ideas. In comparison with no stimulus, quantity (H1) and variety (H2) are hypothesized to
improve, given the fact that the stimulus takes into account the complexity and travel stages in urban
mobility. Novelty (H3) is assumed to be positive (Figure 1. .
Figure 1. The expected effect of the traveller-centred stimulus on effectiveness of problem framing
First, the treatment (the stimulus) is set (Nemeth, 2004, p.299). Then, the experimental procedure,
variables, data collection, and analysis are presented.
2.1. Pilot test
In line with previous research work (Al Maghraoui et al., 2019), and compared to ethnographic material,
mock ups or cultural probes, the choice of the text stimulus to stimulate the expression of people’s
experiences is quick and easy to mobilize in a limited time with a focus group. It is moreover adapted to
the urban mobility context, beyond the experience of a single product.
A stimulus was designed and refined in the pilot test phase. Vasconcelos and Crilly (2016) suggest that
stimuli have the following properties: modality of representation, fidelity of representation, quantity,
proximity to the problem, diversity, novelty, and finally timing of stimulation.

7
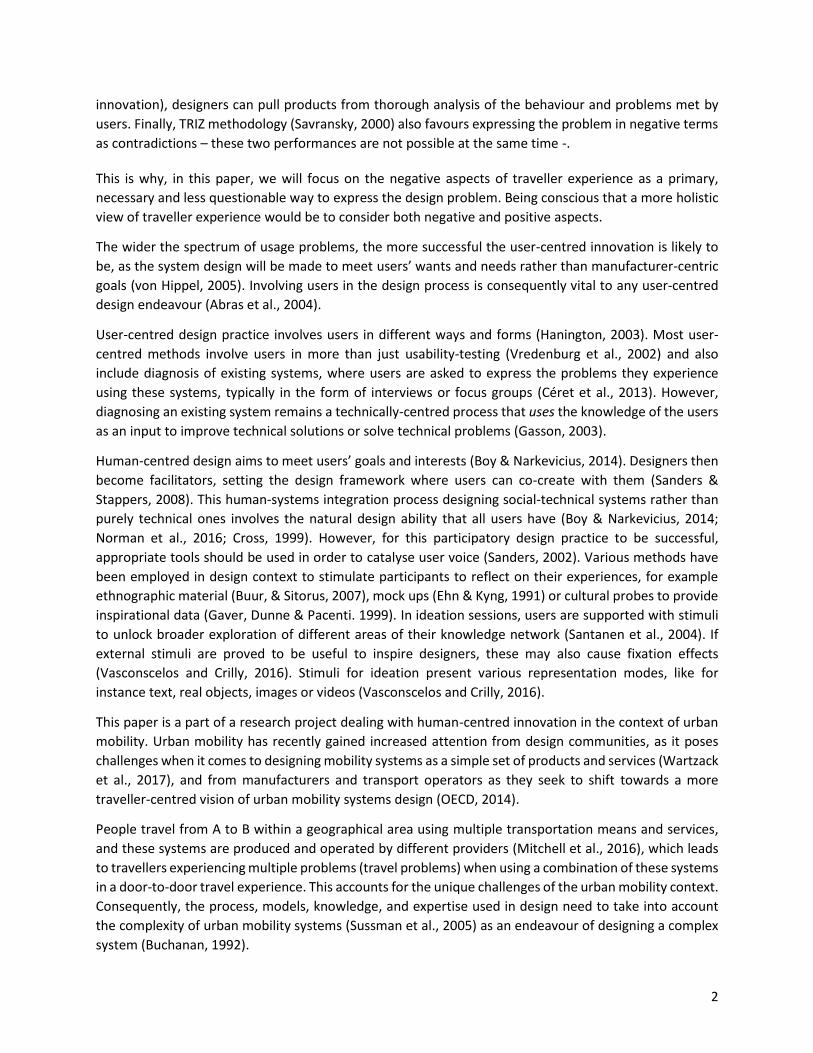
In our case, a single text stimulus was chosen to facilitate the emergence of travel problems, and it was introduced in the middle of the process, when already engaged in problem generation. The stimulus went through several iterations before being used in the experiment as the treatment. A conceptual model of traveller experience built upon travellers’ observations, interviews, and the urban mobility literature (Al Maghraoui et al., 2019) generated a travel problems taxonomy. Subjective dimensions and travel-problem sources were identified from lead user interviews (Von Hippel, 1986) and generated a travel-problem sources network. Finally, eleven problematic sources were extracted to form the so-called “stimulus” used in the experiment (Table 1). A pilot experiment was conducted to test the format of the stimulus and define a logic for coding problems (Figure 2). The stimulus took the form of a taxonomy presented with instances for each of its categories. The taxonomy was composed of four main “sources of problems” related to state of the technical system, personal state and reactions, contextual elements, and activity-related constraints. The codes were used to label the problems generated.
This preliminary experiment consisted of two groups of three participants. Both groups were asked to
identify usage problems with a major urban train line that all participants frequently use. One group was
provided with the stimulus (Table 1) after 15 min of no-stimulus problem generation. The second group
did the same exercise without any support. The outputs of this workshop allowed to formalize the logic
with which problems were classified in the thirteen categories and subcategories for variety calculation.
Moreover, we were able to refine some aspects of the experiment protocol using observations during the
workshop, feedback from participants, and the problems generated (Table 2). Some findings are
consistent with the highlights of Vasconcelos and Crilly (2016).
Table 1. Pilot test stimulus for potential sources of travel problems
Sources Categories Sub-
categories Code Instances
Technical
Physical
Essential TPE Few seats in the bus, shaky railroad, no shelter at the
bus stop, non-adjustable car seat, hilly city
Accidental TPA Frozen and slippery ground, broken/cold seats, wagon
overheated, door blocked
Functional
Essential TFE 20-min gap between two trains
Accidental TFA
Train late/cancelled, screen shows wrong information,
train terminates before destination, portico out of
order
Personal
State
Physical PSP Sick, with huge luggage, tired, in a wheelchair,
pregnant, blind, deaf
Emotional PSE Stressed, angry, surprised, disgusted
Cognitive PSC Lost, confused, unable to read
(Re)action PA Wait, find alternative, inform colleagues, get slowed
down, slip/fall, hit pedestrians, sweat
Contextual
Weather CW Rain, cold, wind, sun, hot
Behaviour of fellow
travellers or the
system’s agents
CUB
Smoking, not respecting the queue, brusque
movement in a shared lane, drivers shouting,
disagreeable agent
Simultaneous use CSU Crowds, queues, no parking places left, congestion,
cycling with pedestrians
8
Activity-
related
Condition AC Arrival time obligations (meeting), need to arrive in
good condition, no parking spaces, no showers
Effect AE Arrive late, miss flight, stressed at work, delay/cancel
tasks
Figure 2. Stimulus construction phases
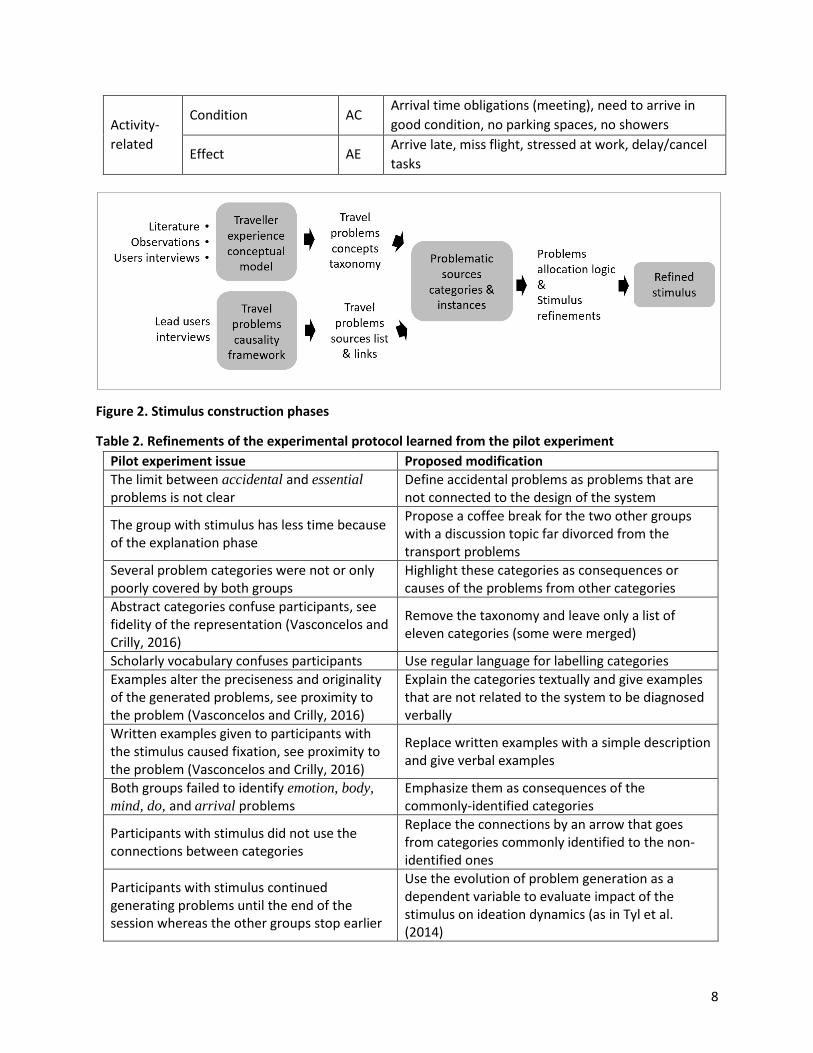
Table 2. Refinements of the experimental protocol learned from the pilot experiment
Pilot experiment issue Proposed modification
The limit between accidental and essential problems is not clear
Define accidental problems as problems that are not connected to the design of the system
The group with stimulus has less time because of the explanation phase
Propose a coffee break for the two other groups with a discussion topic far divorced from the transport problems
Several problem categories were not or only poorly covered by both groups
Highlight these categories as consequences or causes of the problems from other categories
Abstract categories confuse participants, see fidelity of the representation (Vasconcelos and Crilly, 2016)
Remove the taxonomy and leave only a list of eleven categories (some were merged)
Scholarly vocabulary confuses participants Use regular language for labelling categories
Examples alter the preciseness and originality of the generated problems, see proximity to the problem (Vasconcelos and Crilly, 2016)
Explain the categories textually and give examples that are not related to the system to be diagnosed verbally
Written examples given to participants with the stimulus caused fixation, see proximity to the problem (Vasconcelos and Crilly, 2016)
Replace written examples with a simple description and give verbal examples
Both groups failed to identify emotion, body,
mind, do, and arrival problems Emphasize them as consequences of the commonly-identified categories
Participants with stimulus did not use the connections between categories
Replace the connections by an arrow that goes from categories commonly identified to the non-identified ones
Participants with stimulus continued generating problems until the end of the session whereas the other groups stop earlier
Use the evolution of problem generation as a dependent variable to evaluate impact of the stimulus on ideation dynamics (as in Tyl et al. (2014)

9
Participants said more than they wrote Give the instruction: if someone wants to speak, they need to write down his/her idea as a problem
Some problems had a complex formulation that places them in more than one category
Set the problems labelling logic
The final stimulus consists of eleven categories of travel problems. They are presented to participants as
potential archetypal sources of travel problems to stimulate their memory of using the urban mobility
system under study. Each category is explained by a name and a description. Category blocks are
presented as two sets. ‘Design’, ‘operation’, ‘system problem’, ‘operation problem’, ‘weather’, and
‘people’ represent the “objective” categories recognized by the pilot experiment participants from both
groups, while ‘do’, ‘body’, ‘mind’, ‘emotion’, and ‘arrival’ represent the “subjective” categories where no
problem was identified by either group (Table 3). There is a causality that operates between the two sets,
which participants are invited to think through.
Table 3. Traveller experience stimulus: traveller-centred sources of travel problems
Category Source of problems
Ob
ject
ive
Design For me, the system is not well designed
Operation For me, the system is not well operated
System problem Problems occur accidentally with the system
Operation problem Problems occur accidentally with the system’s operation
Weather The weather can cause me problems with my trip
People - The behaviour of the people around me can be a problem for me
- Problems emerge when many people use the system at the same time
Sub
ject
ive
Do - When there is a problem with my trip, I react or do something about it
- What I do with my trip can cause me problems with it
Body - My body feels troubled when there is a problem with my trip
- I can be physically challenged in my trip
Mind - My mind feels troubled when there is a problem with my trip
- My mind can prove a source of the problem for my trip
Emotion - My emotions feel troubled when there is a problem with my trip
- My emotions can prove a source of the problem for my trip
Arrival - What I do when I arrive is affected by problems with my trip
- My destination facilities & activities I do can cause problems in my trip
Because some problems were formulated in a complex way, they fit into more than one category. For
example, “Last week we waited inside the train for more than 30 min” is labelled both “Do” and “Op
problem” as the participants expressed what they did in the train that had an operational problem.
Other kinds of problem labels were not clearly identifiable, especially operation problems. For example,
“the headways are not well planned. Sometimes two trains arrive within 4min when other times there is
a 20 min gap, even at the same point of the day” is an operational problem insofar as it talks about a train
that is behind or ahead of its schedule. On the other hand, it is an observation of a fault in the global train
line system’s operations. As the problem is formulated explicitly as “not well planned” and the delay issue

10
is labelled both “operation” and “Op problem”, there is no room for interpretation on labelling. If a
problem is not explicitly formulated, it is not labelled.
Less identifiable labels are found in problems formulated with the word “problem” without further
explanation. For example, “problems with suspicious luggage” can be classified in almost all the
categories. Indeed, it depends the meaning projected for the word “problem”: if we are talking about the
fear felt by a traveller when he or she sees unattended luggage, it would be labelled “emotion”, whereas
if we are talking about the delays it causes in train-line schedules, it would be labelled “op problem”. To
prevent generating this kind of problem, participants are told not to use the word “problem” or any other
generic word that could be given any kind of meaning in the scope of travel problems identification.
Adverbs of time concerning the system’s design or operation, such as “sometimes”, “always”, or “often”,
systematically label the problem as “system problem” or “operation problem”.
2.2. Experiment design
The aim of this study is to test a stimulus that reflects the objective and subjective sources of traveller-
perspective travel problems, and that has an observable impact in terms of effectiveness of travel
problems generation (as ideation outputs). The stimulus is hypothesized as the treatment that would
increase the quantity, the variety, and the novelty of travel problems due to the fact that it considers the
traveller’s perspective when built into the ensuing model.
2.2.1. Experimental procedure
The experiment consists of four teams, each made up of three participants. It takes place in two phases
(15 and 30 min) following an introductory brief (Figure 3). All the teams are given the same initial input:
- A verbal brief setting the boundaries of the system to be evaluated.
- A verbal brief on how problems should be written down.
Figure 3. Experimental procedure

11
The brief is presented by a researcher who acts as facilitator and timekeeper (Figure 4). Each group has
one participant who is responsible for recording the problems generated by his/her group as well as
participating in the problem generation exercise.
Controlled variables are variables that are assumed to influence the experiment outputs but are outside
the scope of this research. We elected to neutralize their effect (Nemeth, 2004, P.300). This experiment
was exposed to two kinds of controlled variables:
Variables related to participants as subjects and as users of the system of study: no background
in design; identical commute and shared boundaries of travel.
Variables related to problem framing (task-related): identical material and instructions, measure
to avoid fixation, limited interactions with the facilitator, systematic recording of ideas.
The system of study is a rapid transit bus line connecting a public transport hub to a business area where
all the participants commute to work every day. They all take the same route from the hub to their work
location. The boundaries are made clear to the participants, and include their transition from the hub to
the bus station, and through to their arrival at the office.
Figure 4. Setting of the experiment
The brief states how problems should be framed to facilitate allocations to categories for data analysis.
The sole restriction was to avoid using generic words such as “problem” or “issue”. The intent is to get as
many details as possible on participants’ experience with using the system of study. However, participants
are not given written examples, as a measure to avoid fixation on how the example is framed and what
dimension of the traveller experience it concerns (Vasconcelos and Crilly, 2016). They are only given a few
verbal examples unrelated to the system of study, and only if asked for. Moreover, to allow a record of all
the problems discussed, participants are asked to write down what they want to say before voicing their
points. Questions are only allowed in the beginning, and not during the course of the activity, to avoid
possible between-group variation in assimilation of the brief.
All groups use the same material. Each group is given the same set of pens and post-its, a table, and a
computer open on an Excel spreadsheet that records a time label.

12
When Group 1 (G1, no treatment) and Group 2 (G2, placebo) are invited to have a coffee break and a
discussion outside of the experiment scope, the two experimental groups are given additional input 15
minutes after the beginning of the problems generation session, i.e.:
- A verbal brief on how to use the stimulus.
- Two sheets of paper containing Table 3 and Figure 3.
During both experimental phases, a second researcher observed the synchronicity between what
participants said and what they recorded. The objective was to ensure that most of the problems were
reported.
2.2.2. Groups
Twelve participants with a mean age of 29 years (7 male, 5 female) were volunteers selected from the
research institute the authors work in. All of them are working with both academic and industrial
structures. They were personally invited two weeks before the workshop was held, and were all familiar
with problems concerning this bus line and route.
Considering the independent variables (S, noS) and (E, noE), we used four focus groups composed of
participants where the task was problem identification (Morgan, 1997, p.13). Moreover, the usage of
public transportation systems needs to be discussed collectively in order to emerge problems that are
commonly experienced by users (Grosvenor, 2000).
Groups 1 and 2 are control groups for Stimulus as a treatment (Solomon, 1949). Groups 1 and 3 are control
groups for urban mobility Expertise as a placebo treatment (Adair et al., 1990).
Group sizes range between three and five participants per group, with no significant variability on the idea
generation outputs (Baltes et al., 2002). Therefore, as it was hard to get users of the same system traveling
the same route every morning and working at the same place all together on the experiment day, the
minimal focus group size was adopted.
For analysis of the results, travel problems generated by G1 and G2 are aggregated into the noS group,
G3 and G4 into the S group, G1 and G3 into the noE group, and G2 and G4 into the E group.
2.2.3. Independent and dependent variables
The summary of variables and hypotheses appear in Table 4.
The focus of the experiment is set on the stimulus and its effect on travel problem framing outputs.
Therefore, the main independent variable is use of the stimulus. However, as the stimulus was designed
using interviews of experts on urban mobility issues, “urban mobility expertise" is assumed to co-
contribute to the effectiveness of travel problem framing outputs, we also set a placebo baseline (Adair
et al., 1990). One example of expertise is agent-based transport simulation. The knowledge covered by
this expertise is very likely to increase expert participants’ consideration of varied travel problems
objective problem categories.
Therefore, two variables to observe the experiment’s output variations are:
- The use of the (task-related) stimulus: S and noS
- The urban mobility expertise of the (subject-related) participants: E and noE

13
To test the three parts of the experiment’s hypothesis, dependent variables were selected for each part,
as follows.
The use of the stimulus increases the quantity of travel problems (H1).
Quantity of travel problems in the 1st phase (Q1): the number of problems generated in the first
phase of the experiment.
Quantity of travel problems in the 2nd phase (Q2): the number of problems generated in the
second phase of the experiment. All ideas are counted as recorded on the excel tables.
Rate of growth in quantity of travel problems (Q3): 𝑄2− 2𝑄1
2𝑄1, the growth ratio of travel problems
between the two experiment phases (knowing that the second phase lasts twice as long as the
first phase).
The use of the stimulus increases the variety of travel problems (H2).
Allocation to problem categories was performed by two independent researchers with a high enough
inter-research Pearson’s correlation rate (r=0.82) to fulfil the experiment conditions (Clark-Carter, 1997).
Each problem was assigned from one to four labels out of the eleven pre-defined categories. Final
category allocations were approved by the two researchers (Appendix 1).
Coverage of travel problem categories in the 1st phase (V1): percent coverage of travel problems
among the predefined categories in the first phase of the experiment.
Coverage of travel problem categories in the n the 2nd phase (V2): percent coverage of travel
problems among the predefined categories in the second phase of the experiment.
Growth in travel problem variety (V3): 𝑉2 − 𝑉1 ,: the growth in variety of travel problems between
the two phases of the experiment.
The use of the stimulus increases the novelty of travel problems (H3).
Novelty only applies in categories that contain at least one problem for the group that it concerns.
Novelty 𝑁𝑖𝑗𝑘in phase 𝑖 of the experiment, in group 𝑗, proportionally to the total number of problems
dispatched through the eleven categories (𝑇𝑖𝑗), is equal to 1 if the problem is unique to its category k
(Equation 1(a)), equal to 0 if the problem is repeated four times or more in its category k (Equation 1(b)).
Otherwise it is calculated as in Equation 1(c) (inspired from (Peeters et al., 2010) and (Linsey et al., 2011));
𝑁𝑖𝑗𝑘 =
{
(𝑎) 1 , 𝑛𝑖𝑗𝑘 ≤
𝑇𝑖𝑗
11
(𝑏) 0 , 𝑛𝑖𝑗𝑘 ≥4𝑇𝑖𝑗
11
(𝑐) 2 × (0.5 − (1
10×
𝑛𝑖𝑗𝑘−𝑇𝑖𝑗
11𝑇𝑖𝑗
11
)), 𝑇𝑖𝑗
11< 𝑛𝑖𝑗𝑘 <
4𝑇𝑖𝑗
11
; ∀𝑖 ∊ {1,2}; ∀𝑗 ∊ [1,4]; ∀𝑘 ∊ [1,11](1)
𝑛𝑖𝑗𝑘 is the number of problems in phase i, in group j, per category k. 𝑇𝑖𝑗 is the total number of problems
generated in phase i, by group j, through all eleven categories.
For example, 𝑁248 = 1 in phase 2, in Group 4, for the eighth category “body”. Indeed, 𝑛248 = 1, which is
less than (26
11) as maximal value to score a novelty of 1.
14
In phase 2, in Group 1, for the fourth category “operation”, 𝑁214 = 2 × (0.5 − (1
10×
8−26
1126
11
)) = 0.523
Novelty in the 1st phase (N1)
Novelty in the 2nd phase (N2)
Novelty growth (N3): 𝑁2 −𝑁1, the growth in novelty of travel problems between the two phases
of the experiment.
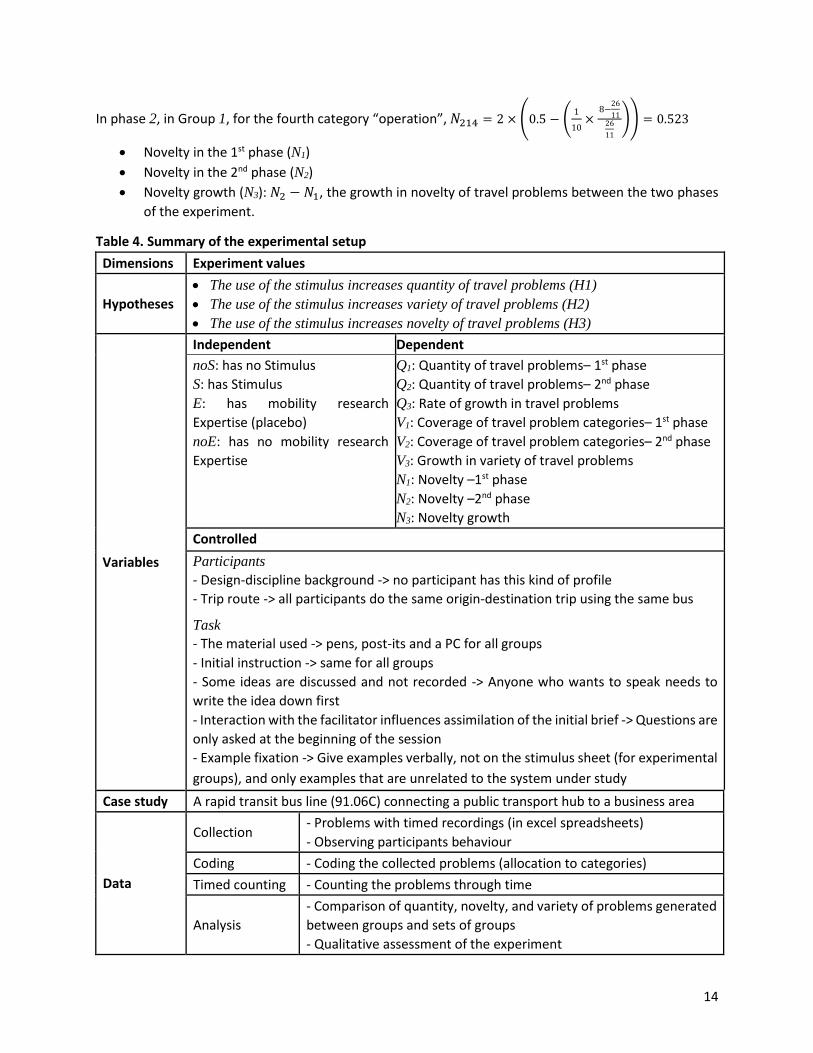
Table 4. Summary of the experimental setup
Dimensions Experiment values
Hypotheses
The use of the stimulus increases quantity of travel problems (H1)
The use of the stimulus increases variety of travel problems (H2)
The use of the stimulus increases novelty of travel problems (H3)
Variables
Independent Dependent
noS: has no Stimulus
S: has Stimulus
E: has mobility research
Expertise (placebo)
noE: has no mobility research
Expertise
Q1: Quantity of travel problems– 1st phase
Q2: Quantity of travel problems– 2nd phase
Q3: Rate of growth in travel problems
V1: Coverage of travel problem categories– 1st phase
V2: Coverage of travel problem categories– 2nd phase
V3: Growth in variety of travel problems
N1: Novelty –1st phase
N2: Novelty –2nd phase
N3: Novelty growth
Controlled
Participants
- Design-discipline background -> no participant has this kind of profile
- Trip route -> all participants do the same origin-destination trip using the same bus
Task
- The material used -> pens, post-its and a PC for all groups
- Initial instruction -> same for all groups
- Some ideas are discussed and not recorded -> Anyone who wants to speak needs to
write the idea down first
- Interaction with the facilitator influences assimilation of the initial brief -> Questions are
only asked at the beginning of the session
- Example fixation -> Give examples verbally, not on the stimulus sheet (for experimental
groups), and only examples that are unrelated to the system under study
Case study A rapid transit bus line (91.06C) connecting a public transport hub to a business area
Data
Collection - Problems with timed recordings (in excel spreadsheets)
- Observing participants behaviour
Coding - Coding the collected problems (allocation to categories)
Timed counting - Counting the problems through time
Analysis
- Comparison of quantity, novelty, and variety of problems generated
between groups and sets of groups
- Qualitative assessment of the experiment

15
3. Results
The results of the experiment consider the sum of the two experimental groups (G3 and G4) as a single
experimental group (S group). The sum of the placebo group (G2) and the no treatment group (G1) is
analysed to gauge the influence of mobility expertise on the results (noS group).
First, quantity is examined by counting the problems generated between groups and over the two phases
of the experiment. Then, variety is studied for each group, calculating the coverage of problems in each
of the pre-defined categories. Finally, novelty is calculated for each group.
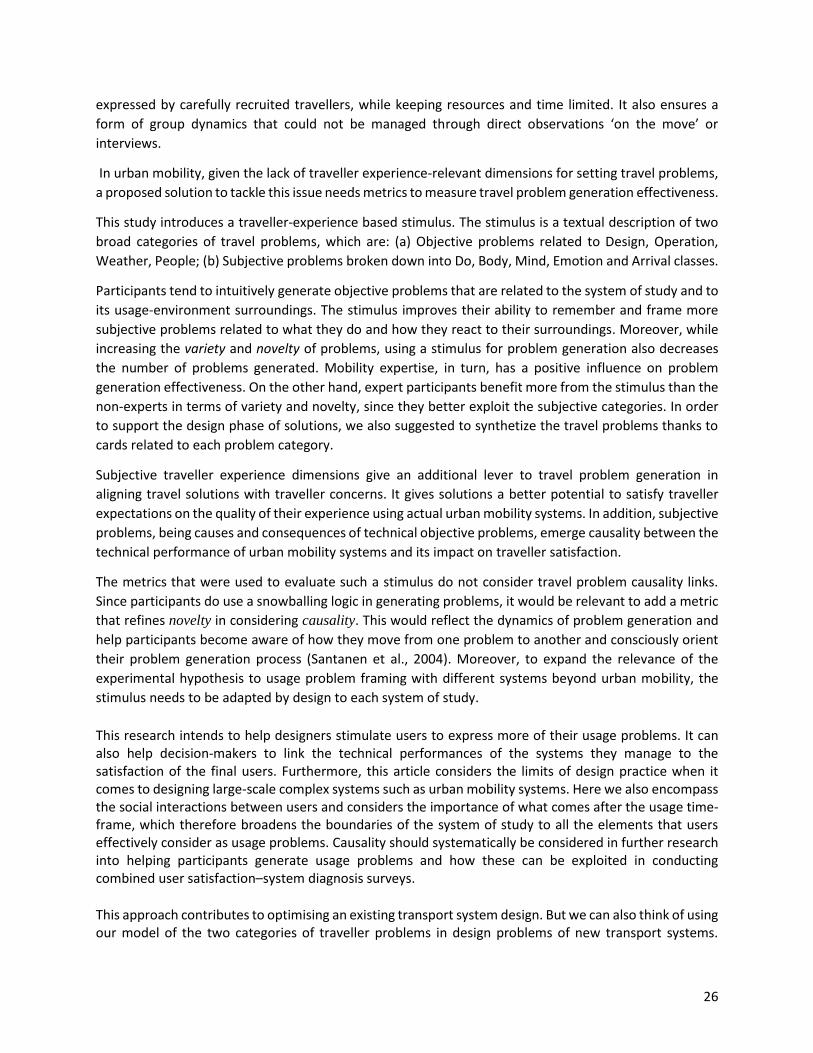
3.1. Effect on the quantity of travel problems
Table 5 presents the number of travel problems generated throughout the experiment (with 5-min
intervals), and between phase 1 and phase 2 of the experiment for the four groups and per set of two
groups. The groups together scored a total of 111 problems during the 50 minutes of the experiment.
The stimulus is designed to help participants dig deeper into their memory to generate more problems
than the situations they would spontaneously remember. Therefore, it was hypothesized that the quantity
of problems generated would be more for the S groups compared to noS group and would increase from
the first phase to the second phase. However, there was no increase in quantity of travel problems from
phase 1 to phase 2 nor from noS to S in phase 2. Indeed, the noS groups together generated 10 more
problems than the S groups together, and scored better on quantity growth rate: -5% for NoS compared
to -25% for S.
Table 5. Travel problem quantities as recorded
Time-frame (min) G1 G2 G3 G4
0–5 3 0 2 2
5–10 5 2 4 4
10–15 5 6 4 4
Break
20–25 1 0 1 1
25–30 1 5 3 4
30–35 5 6 2 3
35–40 3 6 4 2
40–45 4 3 2 2
45–50 2 4 4 2
Quantity / phase G1 G2 G3 G4
1st phase (Q1) 13 8 10 10
2nd phase(Q2) 16 24 16 14
Growth rate (Q3) -38% 50% -20% -30%
Quantity / phase noS S
1st phase(Q1) 21 20
2nd phase (Q2) 40 30
Growth rate (Q3) -5% -25%
Quantity / phase noE E

16
1st phase (Q1) 23 18
2nd phase(Q2) 32 38
Growth rate (Q3) -30% 6%
During the initial phase, S and noS groups generated a comparable amount of travel problems (resp. 20
and 21), while E and noE scored a relatively different amount of problems (resp. 18 and 23). This difference
was created between G1 and G2 (resp. 13 and 8). Indeed, G2 was late at typing down the problems
generated and spent most of the first phase discussing and taking notes on post-its.
Three out of four groups experienced a decrease in problem quantity, which would be explained by
cognitive inertia in ideation (Briggs & Reinig, 2010). However, G2 showed a different growth rate
compared to the other groups. Indeed, at the beginning of the second experiment phase, the group voiced
its ambition to score the highest among all the groups, which was noticeable in the 25–40 min interval of
the experiment. So, if we exclude the atypical group (G2) from E-group analysis, it could be said that the
non-expert group G3 profited more from the stimulus by generating two more problems than the expert
group G4 (resp. 16 and 14).
All participants were asked to generate as many problems as they could with as much detail as possible.
Variety and novelty were chosen to assess this second aspect of the problems generated.
3.2. Effect on the variety of travel problems
Table 6 highlights representative examples of travel problems within each of the predefined categories.
Table 7 presents the distribution of the generated travel problems through the eleven predefined
categories, per group (1,2,3, and 4) and per set of groups (noS, S, E, and noE). The Kruskal and Wallis test
on phase 1 confirmed that G1, G2, G3, and G4 showed identical distributions in terms of coverage of travel
problem categories (χ.952 =7.815, p=.559).
Table 6. Examples of travel problems in the eleven pre-defined categories
Category Example from groups Gr
Design Signage problem: lack of visibility G1
Operation Low frequency after 19:00h G2
Sys problem Sometimes the display is blank G2
Op problem Buses cancelled at the end of the day without warning G1
People Many people waiting for the bus -> full bus G4
Weather Bus windows are not tinted, which amplifies the effect of the heat from the sun G2
Do Often people run from the train station to catch the bus, or from the bus to the train station, and that may cause panic for some users
G2
Body Body aches and dizziness from fatigue or having to stand on the way G3
Mind The logic of opening the doors is not clear (the back doors are not always open) G3
Emotion When the bus is full, attitudes of a few people can be disturbing (sometimes people do not even say sorry when they push you ...)
G3
Arrival If we carry a lot of stuff, then the bus is not at all a good choice (bringing my lunch to work)
G4

17
The stimulus is designed to help participants uncover new aspects of their urban mobility experience. This
includes their introspective experience and what happens with their activities before departure and after
arrival. It was therefore hypothesized that the variety of problems generated would be more for group S
compared to noS and would increase from the first phase to the second one. Variety was found to
decrease for group S in the second phase (from 100% to 91%). This was due to problems generated by G3,
in the first phase, that were rather expected in the second phase. However, taken separately, variety
increased for G4 while decreasing for G3 (resp. +10% and -18%). Indeed, all the categories that were not
covered in the first phase for both groups were covered in the second phase (emotion, arrival, and
weather for G4; body for G3). Conversely, other categories were not covered in the second phase (system
problem for G4; weather, arrival and system problem for G3). In the second phase, novelty was higher in
group S than in group noS (resp. 91% and 82%).
Similarly to quantity, expert groups scored more variety than non-expert groups (+18% for E and -9% for
noE), as both expert groups scored 100% novelty in the first phase.
Table 8 presents the distribution of the problems generated through the two sets of the eleven pre-
defined categories. Group S clearly focused more on the Objective set of categories in the second phase
than group noS did (46% for S and 15% for noS). On the other hand, this set of categories increased more
for group S than group noS (resp. +17% and +6%). Moreover, the non-expert group (G3) used the stimulus
more than the expert group (G4) (resp. +34% and -3%). For instance, Figure 5 shows the difference in
evolution of travel problems in objective and subjective sets of categories for G1 and G3.
The categories that were not covered by the noS groups through the two phases together (i.e. scoring a
total of three or less) were body, mind, emotion, and arrival. The only different category was “do” where
G2 scored 6 problems at the second phase, as seen in the second-phase subjective categories score (22%
compared to 4% for G1).
Table 7. Variety in travel problems generated
Phase 1 G1 G2 G3 G4 noS S noE E All
People 5 3 3 2 8 5 8 5 13
Weather 1 0 1 0 1 1 2 0 2
Design 4 1 3 2 5 5 7 3 10
Operation 5 5 1 3 10 4 6 8 14
Sys problem 1 0 1 2 1 3 2 2 4
Op problem 2 2 6 1 4 7 8 3 11
Do 0 0 1 2 0 3 1 2 3
Body 2 0 0 1 2 1 2 1 3
Mind 0 0 1 3 0 4 1 3 4
Emotion 0 1 1 0 1 1 1 1 2
Arrival 0 0 1 0 0 1 1 0 1
Total 20 12 19 16 32 35 39 28 67
Variety (V1) 64% 45% 91% 73% 73% 100% 100% 82% 100%
Phase 2 G1 G2 G3 G4 noS S noE E All
People 4 4 4 4 8 8 8 8 16
Weather 2 5 0 2 7 2 2 7 9
Design 4 9 4 5 13 9 8 14 22

18
Operation 8 6 3 3 14 6 11 9 20
Sys problem 1 3 0 0 4 0 1 3 4
Op problem 6 5 4 3 11 7 10 8 18
Do 0 6 5 3 6 8 5 9 14
Body 0 1 3 1 1 4 3 2 5
Mind 1 2 4 1 3 5 5 3 8
Emotion 0 0 6 2 0 8 6 2 8
Arrival 0 0 0 2 0 2 0 2 2
Total 26 41 33 26 67 59 59 67 126
Variety (V2) 64% 82% 73% 91% 82% 91% 91% 100% 100%
V growth (V3) 0% +36% -18% +10% +9% -9% -9% +18% na
Table 8. Category coverage of travel problems generated
Phase 1 G1 G2 G3 G4 noS S noE E
Objective 90% 92% 79% 62% 91% 71% 85% 75%
Subjective 10% 8% 21% 38% 9% 29% 15% 25%
Phase 2 G1 G2 G3 G4 noS S noE E
Objective set 96% 78% 45% 65% 85% 54% 68% 73%
Subjective set 4% 22% 55% 35% 15% 46% 32% 27%
Subjective set growth
-6% +14% +34% -3% +6% +17% +17% +2%
Figure 5. Comparison of the evolution of travel problems in objective & subjective sets for G1 & G3
0
5
10
15
20
25
30
35
40
45
00:00:00 00:05:00 00:10:00 00:15:00 00:20:00 00:25:00 00:30:00 00:35:00 00:40:00 00:45:00 00:50:00
G1_Objective G1_Subjective
G3_Objective G3_Subjective
Bre
ak

19
3.3. Effect on the novelty of travel problems
Table 9 presents the novelty of travel problems in each of the pre-defined categories, per group (1,2,3,
and 4) and per set of groups (noS, S, E, and noE).
The model underlying the stimulus assumes that each of the traveller experience aspects (translated into
travel problem categories) are important for describing a traveller experience problem. This is why it was
hypothesized that the stimulus would increase travel problem category novelty by showing participants
new aspects of their traveller experience. Indeed, average novelty in the second phase was higher in teh
S group than the noS group (resp. 94.8% and 91.8%). However, average novelty remained constant for
the S group yet increased by 5% in the noS group. Once again, this was related to G2 that scored an
increase of 17%, which is higher than all the other groups together, although it had the lowest novelty
score in the first phase (75.3%). Group E and noE scored very similar on average novelty (resp. 94.5% and
94%) and growth in average novelty (resp. +2.6% and +1.6%).
The lowest novelty scores—scoring under 75%—, as highlighted in grey, were found mainly in the
objective set of categories in both the first and the second phases of the experiment. Moreover, in the
second phase, only G1 and G2 (noS groups) scored low on novelty. Group E scored low on novelty in the
design category and group noS score low on novelty in the operation category. Figure 6 shows how the
problems are distributed through the eleven pre-defined categories comparing S to noS groups
(SD(S)=3.01, SD(noS)=5.03).
Table 9. Travel problem categories novelty per group
Phase 1 G1 (%) G2 (%) G3 (%) G4 (%) noS (%) S (%) noE (%) E (%)
People 65 65 85.3 92.5 65 88.6 74.9 80.7
Weather 100 na 100 na 100 100 100 na
Design 76 100 85.3 92.5 85.6 88.6 80.5 96.4
Operation 65 28.3 100 78.8 51.3 94.9 86.2 57.1
Sys problem 100 na 100 92.5 100 100 100 100
Op problem 98 83.3 50.5 100 92.5 76.0 74.9 96.4
Do na na 100 92.5 na 100 100 100
Body 98 na na 100 100 100 100 100
Mind na na 100 78.8 na 94.9 100 96.4
Emotion na 100 100 na 100 100 100 100
Arrival na na 100 na na 100 100 na
Novelty (N1) 86 75.3 92.1 90.9 86.8 94.8 92.4 91.9
Phase 2 G1 (%) G2 (%) G3 (%) G4 (%) noS (%) S (%) noE (%) E (%)
People 86.2 98.5 93.3 86.2 93.7 90.2 90.2 93.7
Weather 100 93.2 na 100 97 100 100 97
Design 86.2 71.7 93.3 77.7 77.3 86.4 90.2 74
Operation 52.3 87.8 100 94.6 74 97.6 79 90.4
Sys problem 100 100 na na 100 na 100 100
Op problem 69.2 93.2 93.3 94.6 83.9 93.9 82.7 93.7

20
Do na 87.8 86.7 94.6 100 90.2 100 90.4
Body na 100 100 100 100 100 100 100
Mind 100 100 93.3 100 100 100 100 100
Emotion na na 80 100 na 90.2 97.6 100
Arrival na na na 100 na 100 na 100
Novelty (N2) 84.8 92.5 92.5 94.8 91.8 94.8 94 94.5
N growth (N3) -1.2 +17.1 -0.4 +3.8 +5 0 +1.6 +2.6
Figure 6. Travel problems distribution through the eleven pre-defined categories
3.4. Qualitative insights
Both the researcher who observed the groups during the experiment and the facilitator reported some
insightful comments.
The first uncontrolled variable that influenced the course of the experiment was a technical problem that
G4 and G1 experienced using the excel spreadsheet. Indeed, the time recording cells displayed the same
time in some of the recorded problems in the first phase of the experiment. This momentarily interrupted
the groups concerned, but the issue was quickly fixed. The problems that were not recorded at their
genuine time have been distributed uniformly through the appropriate period of experiment time. G3
modified its fifth problem, which altered the G3 timeline but was fixed by roughly re-establishing the initial
timeline.
The second important uncontrolled variable that influenced the experiment’s outputs is a difference
between the written reporting and the verbal expression of problems by participants. In the controlled
variables, the fact that participants tend to say more than what they write was controlled. However, the
difference between how they formulate the problems verbally and how they type them in the excel table
was not controlled. Indeed, the category allocation depends solely on what is written down, and is
neutralized—as far as practicable—from any interpretation. Therefore, if a participant verbally expresses
a problem by talking in the first-person form, the problem would probably include a Cat2-categories label.
For example, in G3, one of the comments was “I almost fell to the ground”. This was reported as
“catastrophic driving”, which would add a “do” label to the problem if written down. Moreover, the

21
control assumed over spoken vs. written problems was not enough. Indeed, it was noted that some
participants talk about a problem that is more of a personal perception, but do not type it down, showing
a kind of auto-censorship. For instance, “I don’t see fire extinguishers when I get into the bus” was
recorded by the observer-researcher but could not be found in the excel tables. Making an audio recording
of the complete workshop for each group would help avoid missing any of these unrecorded problems.
However, it would also require identifying, from group conversations, what is considered a problem and
what is not, whereas this is precisely the role of participants in the workshop.
G2 was observed to not be recording problems on the PC but rather on post-its. This explains the low
number of problems in the first ten minutes (2 compared to 6 and 8 for other groups). Moreover, the
times that are displayed in the time recording cells are different from the actual point in time the problems
were verbally expressed by participants. Indeed, the delay includes the time for expression, the
formulation proposed to the person responsible for typing it, and the time for typing it (that sometimes
took more than a minute).
We observed a degree of snowballing between series of generated problems. This was sometimes
expressed verbally by participants (e.g. “this joins that problem”). For instance, four of the first seven
problems from G1 were related to crowding. The problems are expressed in general terms in the
beginning and then expanded into other aspects of the traveller experience.
The competitive spirit of participants varied from one group to the other and was observed strongly in G2
which was the only group that kept asking how much time they had left. G4 was observed discussing a lot
without recording, which affected their quantity score (G4 posted the lowest).
By the end of the second phase of the experiment, more silent moments were observed in all the groups.
4. Discussion
The hypotheses of the experiment are evaluated against the different dependent and independent
variables. The value of the stimulus is discussed for different stakeholders who are involved in its usage in
the urban mobility systems design process.
4.1. Evaluation of the hypotheses
Table 10 presents a roll-up of the dependent and independent variables that served to evaluate the
experiment’s hypotheses. Q1, V1, and N1 are used to calculate Q3, V3, and N3 respectively.
Table 10. Roll-up of values for the hypotheses variables from the mobility expertise perspective
Variables noE E
noS S noS S
Quantity (H1) Q2 29 26 32 24
Q3 -38% -20% 50% -30%
Variety (H2) V2 64% 73% 82% 91%
V3 0% -18% 36% 10%
Novelty (H3) N2 84.8% 92.5% 92.5% 94.8%
N3 -1.2% -0.4% 17.1% 3.8%

22
When no urban mobility expert is involved (noE groups), invalidation is found in V3 where the S group
unexpectedly scored a high variety score in the first phase of the experiment. Validation is only found in
V2 and N2. Q2, Q3, and N3 are discussable. In Q2, the difference between noS and S is only 3 problems,
which represents a difference of 5.4% (29 (noE, noS) +26 (noE, S)). Moreover, the stimulus appeared to
mitigate the deceleration in quantity for group S (Q3: -20% for S compared to -38% for noS). Finally, there
was no difference in decrease in novelty between the S and noS groups (N3: -0.4% for S compared to -
1.2% for noS). Nevertheless, novelty still decreased even with the stimulus, which invalidates the
hypothesis on N3 in H3. This means that providing a stimulus to non-expert travellers enhances their travel
problems generation effectiveness in terms of variety and novelty but not necessarily quantity.
On the other hand, in E groups, the atypical results of G2 (noS, E) invalidated H1 on both Q2 and Q3. Group
E scored 8 more problems than group S (14.3% of (32+24)) and an 80% difference in Q3. Nevertheless, the
(S, E) group scored better in V2 and N2 and its variety and novelty increased when provided with the
stimulus, so we cannot conclusively confirm that the stimulus hinders expert participants in generating
more problems.
Table 11 shows that, even excluding the atypical behaviour of G2 (noS, E) on H1, it nevertheless scored
better than G1 (noS, noE) in all the other variables. This confirms the assumption of a positive influence
of urban mobility expertise on ideation effectiveness.
Regarding the combination of stimulus plus urban mobility expertise, there was no noticeable difference
in problem quantity in Q2. However, the quantity growth was slightly higher in the noE group, which could
mean that expertise hinders the stimulus effect on quantity. Expert participants also scored better in
variety and novelty compared to non-expert participants, which means that expert travellers profit more
than non-experts from the stimulus in terms of problem variety and problem novelty. This could be
explained by the fact that expert travellers become more aware of the subjective categories when given
the stimulus than the non-expert travellers.
Table 11. Roll-up of values for the hypotheses variables from the stimulus use perspective
Variables noS S
noE E noE E
Quantity (H1) Q2 29 32 26 24
Q3 -38% 50% -20% -30%
Variety (H2) V2 64% 82% 73% 91%
V3 0% 36% -18% 10%
Novelty (H3) N2 84.8% 92.5% 92.5% 94.8%
N3 -1.2% 17.1% -0.4% 3.8%
According to the results in Table 12, H1 is invalidated. H2 and H3 are validated regarding V2 and N2that
are better with use of the stimulus than without. H2 is invalidated regarding V3when the stimulus is
introduced. As N3 remained constant through the experiment, H3 cannot be totally validated.
Table 12. Roll-up of values for the hypotheses variables comparing expertise and stimulus effects
Variables noS S
Quantity (H1) Q2 40 30
Q3 -5% -25%

23
Variety (H2) V2 82% 91%
V3 +9% -9%
Novelty (H3) N2 91.8% 94.8%
N3 +5% 0%
4.2. Value of the stimulus
Several stakeholders involved in diagnosing urban mobility systems could benefit from using a traveller-
centred stimulus for emerging travel problems.
The first stakeholders to profit from the stimulus are the participants. The stimulus helps them remember
sequences of their experience to tease out problems that do not intuitively come to mind as such. Indeed,
they gain self-awareness of how their past mobility experience happened. A travel problem is not only
related to what they watch as observers, but it is also about how they feel and how problems can have
knock-on effects on what happens at the destination. The other categories together constitute a wider
picture of an urban mobility experience. Moreover, by using the stimulus, participants produce a more
balanced picture of their mobility experience as they led, giving similar attention to each of its aspects.
The second stakeholder to profit from the stimulus is the designer. Indeed, better-quality problem
generation outcomes should translate into more relevant solutions (Yannou, 2015). The problems that
are generated using the stimulus cover most of the aspects of traveller experience using verbatim from
the users themselves expressing their subjective concerns. The translation that participants tend to
operate on their personal perception to produce more objective and system-oriented problems is
neutralized. Indeed, participants are invited to freely and openly express their thoughts and feelings,
which liberates them from self-censorship. The effect on solution generation is that the problems are
framed including subjective variables that might be correlated to participants’ profiles. Solutions would
thus be more personalized according to the specificity of each respondent’s profile. For example, G4
provided this problem in the second phase: “we feel less safe/comfortable when there are a lot of people
around in the bus”. This feeling might be shared by everyone. By reviewing who the respondent is, the
designer can know which user profile this problem fits, and design the solution accordingly (e.g.
personalizing a proposed itinerary depending on comfort-feeling preferences). Moreover, the feeling is
expressed regarding a situation that happens around the traveller, which concurrently links into a problem
of unsafety and discomfort but also its cause, which is the crowd on the bus. The solution would, in this
case, include both the capacity to increase the feeling of safety and comfort if the crowd happens and, at
the same time, its capacity to reduce that crowd. This causality value can be further enhanced by
proposing an ideation session that pushes participants to identify the links between problems they have
and think of new consequences and causes as new problems to be reported.
The insights that a designer gains from travel problems can be exploited by a transportation operator
when the data are quantitatively significant. Indeed, tailored surveys can be designed in response to
outputs from focus groups conducted with specific samples of travellers. Having more detailed
preferences matching with travellers’ profiles would allow operators to add more human-centric
performance indicators. The diagnosis of the mobility system they operate would then show them flaws
that directly impact traveller satisfaction and connect these flaws to their original technical problems.

24
The two metrics that represent variety and novelty are meant to fill the gap left in ideation outputs evaluation by quantity alone. Indeed, Briggs & Reinig (2010) show that value in idea-quantity is insufficient to establish gains in idea-quality. Therefore, in asking travellers to state the problems they experience using some urban mobility solution, a support is needed so that they can generate problems that most reflect their experience. Classical design tools that are not tailored to the nature of the system to be diagnosed fail to produce problems that cover relevant dimensions of the user experience related to the system of study. For instance, Kremer et al.(2017), even with a user-centred approach, still lacks travel stages integration and considers a segmented evaluation of the experience without taking into account the destination as part of the experience nor the causality between subjective and technical problems.
For these reasons, this experiment highlights that it is vital to involve users (of the system to be diagnosed) in the design of stimuli for problem identification, not just design concepts generation.
The groups that did not receive the stimulus represented the classical way participants in focus groups are asked to generate problems. Results showed that these groups score less in variety of problems and novelty than groups that receive a traveller-centred stimulus.
The results of this experiment would be more reliable if the experiment was repeated several times over. This would allow to test whether G2 would confirm its (atypical) behaviour—especially for Q3. Moreover, it would consolidate the conclusions made on novelty and variety. It is, however, difficult to recruit participants who are using a system on the same route and find a time-slot where everyone is available for the experiment.
4.3. The stimulus as a design support
In diagnosing urban mobility systems, we saw that usage problems are richer when they include
contextual elements such as what happens before and after the travel. For instance, in “Always crowded,
so we arrive without motivation to work” [Group 3] we can see the consequence of a crowded bus
(operational accidental state involving people) on the mood (emotion) after the travel (arrival). In “If we
carry a lot of stuff, then the bus is not at all a good choice (bringing my lunch to IRT (work))” [Group 4]
we can see a reversed causality between what happens after travel (having lunch) on the condition of the
travel in the bus that is not designed for travellers carrying objects. Moreover, we saw that the subjective
experience of a travel brings out relevant ideas about how the system could be designed.
From what we learnt from this experiment, we propose a three-step approach to help participants in a
problem framing focus group provide a complete and rich traveller experience feedback (Figure 7).
Figure 7 : Steps of problem framing in focus group
A preparatory phase consists on letting participants freely talk about their travel problems and only ask
them to write the problems down before talking.

25
1. The first phase defines the nature of the generated problems in the predefined categories so that we
can address the distribution of all the problems and identify the less populated categories. Some real life
photos could be added to the summary card to improve the visualization of some travel problems. We
propose a summary card per category (Figure 8). We define a frequency score per category as the number
of problems within this category. Figure 8 represents the ‘Arrival’ category.
2. The second phase identifies causality between categories. We define a causality score per category as
the couple (Cai,Coi) where Cai is the number of problems where the category is a cause and Coi is the
number of problems where the category is a consequence.
3. The third phase completes the less detailed categories in both problem frequency and causality. We
propose to aim the mean frequency of the distribution for the less filled categories and to have at least
one causation link outgoing and one incoming per category.
A final phase is an ideation phase that consists of generating solutions for each of the travel problems.
Figure 8: ‘Arrival’ card of travel problems
5. Conclusion and perspectives
This study shows that a stimulus that has been designed with users who have some expertise helps to
generate greater variety and novelty of usage problems. The paper evaluates the effects of a traveller-
centred stimulus on the effectiveness of travel problem generation. Many user centred methods are
useful to uncover unspoken usage problems, by engaging communication with users (e.g. interviews,
focus groups, think aloud…), understanding user behaviours (direct observations, video ethnography,
shadowing …) or a combination of both (Daae & Boks, 2015). However, the methods need to be fitted to
complex door-to-door mobility experiences of travellers, with multiple stages, interactions with artefacts
and other people. Indeed, traveller experience involves more diverse issues than a user experience with
a simple artefact in a private environment.
Moreover, focus groups appear to be on interesting format to help travellers elicit usage problems in a
mobility context. It is an interesting compromise that enables to capture a broad range of problems
26
expressed by carefully recruited travellers, while keeping resources and time limited. It also ensures a
form of group dynamics that could not be managed through direct observations ‘on the move’ or
interviews.
In urban mobility, given the lack of traveller experience-relevant dimensions for setting travel problems,
a proposed solution to tackle this issue needs metrics to measure travel problem generation effectiveness.
This study introduces a traveller-experience based stimulus. The stimulus is a textual description of two
broad categories of travel problems, which are: (a) Objective problems related to Design, Operation,
Weather, People; (b) Subjective problems broken down into Do, Body, Mind, Emotion and Arrival classes.
Participants tend to intuitively generate objective problems that are related to the system of study and to
its usage-environment surroundings. The stimulus improves their ability to remember and frame more
subjective problems related to what they do and how they react to their surroundings. Moreover, while
increasing the variety and novelty of problems, using a stimulus for problem generation also decreases
the number of problems generated. Mobility expertise, in turn, has a positive influence on problem
generation effectiveness. On the other hand, expert participants benefit more from the stimulus than the
non-experts in terms of variety and novelty, since they better exploit the subjective categories. In order
to support the design phase of solutions, we also suggested to synthetize the travel problems thanks to
cards related to each problem category.
Subjective traveller experience dimensions give an additional lever to travel problem generation in
aligning travel solutions with traveller concerns. It gives solutions a better potential to satisfy traveller
expectations on the quality of their experience using actual urban mobility systems. In addition, subjective
problems, being causes and consequences of technical objective problems, emerge causality between the
technical performance of urban mobility systems and its impact on traveller satisfaction.
The metrics that were used to evaluate such a stimulus do not consider travel problem causality links.
Since participants do use a snowballing logic in generating problems, it would be relevant to add a metric
that refines novelty in considering causality. This would reflect the dynamics of problem generation and
help participants become aware of how they move from one problem to another and consciously orient
their problem generation process (Santanen et al., 2004). Moreover, to expand the relevance of the
experimental hypothesis to usage problem framing with different systems beyond urban mobility, the
stimulus needs to be adapted by design to each system of study.
This research intends to help designers stimulate users to express more of their usage problems. It can also help decision-makers to link the technical performances of the systems they manage to the satisfaction of the final users. Furthermore, this article considers the limits of design practice when it comes to designing large-scale complex systems such as urban mobility systems. Here we also encompass the social interactions between users and considers the importance of what comes after the usage time-frame, which therefore broadens the boundaries of the system of study to all the elements that users effectively consider as usage problems. Causality should systematically be considered in further research into helping participants generate usage problems and how these can be exploited in conducting combined user satisfaction–system diagnosis surveys.
This approach contributes to optimising an existing transport system design. But we can also think of using our model of the two categories of traveller problems in design problems of new transport systems.

27
Indeed, such a data model could serve to build a large database of existing traveller problems along with socio-demographic data of the travellers. Based on real life experiences, such a database could then serve to generate a synthetic population of travellers for a given multi-agent simulation for assessing new mobility solutions in the light of the most frequent problems they meet. This is indeed a challenge in the transport domain to develop richer simulation models integrating preference attributes to the mode choice mechanism of agents (Kamel et al., 2019). First results show that taking into account user preferences in the case of shared mobility simulations substantially change the outputs of the future scenarios (Kamel et al., 2019).
Similar issues may be found whenever users have multiple profiles, involved in complex daily life activities in interaction with various products and services. We can mention specific industrial tasks where the elicitation of operators’ pains is very important, see for instance the case of wastewater treatment processes (Buur & Matthews, 2008).
Nowadays, challenges in the design of health and care systems are gaining momentum, mainly due to an ageing population in the UK (Clarkson, 2018), but also in Europe. The developed approach could be helpful for healthcare design to support experience-based design with patients (Bate & Robert, 2006). The stimulus could support the integration of ‘People perspective’ in the design of healthcare systems, taking into account the “diversity in the patient and carer population” (Clarkson, 2018). This is in line with the intent to tackle usage problems with a systems perspective considering the systemic combination of people, processes, infrastructure, information, organisations and services (Clarkson, 2018).
References
Abras, C., Maloney-Krichmar, D., & Preece, J. (2004). User-centered design. In William Sims Bainbridge (Ed.), Berkshire Encyclopedia of Human-Computer Interaction (Vol. 37, pp. 445–456). Massachusetts: Berkshire Publishing Group LLC.
Adair, J. G., Sharpe, D., & Huynh, C. L. (1990). The Placebo Control Group. The Journal of Experimental Education, 59(1), 67–86.
Al Maghraoui, O., Vallet, F., Puchinger, J., and Yannou, B. (2017). Framing key concepts to design a human centred urban mobility system. In : 21st International Conference on Engineering Design (ICED 17), Vol. 3, 91-100, Vancouver, Canada.
Al Maghraoui O., Vallet F., Puchinger J., and Yannou B. (2019). Modeling traveler experience for designing urban mobility systems, Design Science, 5, E7.
Atilola, O., Tomko, M., & Linsey, J. S. (2016). The effects of representation on idea generation and design fixation: A study comparing sketches and function trees. Design Studies, 42, 110–136.
Baltes, B. B., Dickson, M. W., Sherman, M. P., Bauer, C. C., & LaGanke, J. S. (2002). Computer-mediated communication and group decision making: A meta-analysis. Organizational Behavior and Human Decision Processes, 87(1), 156–179.
Basadur, M. S., Graen, G. B., & Green, S. G. (1982). Training in creative problem solving in an industrial research organization. Organizational Behavior and Human Performance, 30, 41–70.
Bate, P., & Robert, G. (2006). Experience-based design: from redesigning the system around the patient to co-designing services with the patient. Quality & safety in health care, 15(5), 307–310.

28
Beul-Leusmann, S., Jakobs, E. M., & Ziefle, M. (2013). User-centered design of passenger information systems. IEEE International Professional Communication Conference.
Boy, G., & Narkevicius, J. (2014). Unifying Human Centered Design and Systems Engineering for Human Systems Integration. Complex Systems Design & Management, 151–162.
Briggs, R. O., & Reinig, B. A. (2010). Bounded Ideation Theory. Journal of Management Information Systems, 27(1), 123–144.
Buchanan, R. (1992). Wicked Problems in Design Thinking. Design Issues, Volume 8(2nd issue), Page 5-21.
Buur, J., & Sitorus, L. (2007). Ethnography as design provocation. In Ethnographic Praxis in Industry Conference Proceedings, (1), 146-157.
Buur, J., & Matthews, B. (2008). Participatory innovation. International Journal of Innovation Management, 12(3), 255–273.
Cash, P., Elias, E., Dekoninck, E., & Culley, S. (2012). Methodological insights from a rigorous small scale design experiment. Design Studies, 33(2), 208–235.
Céret, E. ., Dupuy-Chessa, S. ., Calvary, G. ., Front, A. ., & Rieu, D. . (2013). A taxonomy of design methods process models. Information and Software Technology, 55(5), 795–821.
Clark-Carter, D. (1997). Doing quantitative psychological research: from design to report (Psychology). UK: Taylor & Francis.
Clarkson, J. (2018). What has engineering design to say about healthcare improvement? Design Science,
4, E17.
Coughlin, J. (2001). Transportation and older persons : Perceptions and Preferences. Washington DC.
Creswell, J. (2009). Research Design: Qualitative, Quantitative and Mixed Methods Approaches. Journal of Chemical Information and Modeling, 53(9), 1689–1699.
Cross, N. (1999). Natural intelligence in design. Design Studies, 20(1), 25–39.
Cunningham, L., Young, C., & Lee, M. (2000). Methodological Triangulation in Measuring Public Transportation Service Quality. Transportation Journal, 40(1), 35–47.
Daae J., Boks C. (2015). A classification of user research methods for design for sustainable behaviour,
Journal of Cleaner Production, Vol 106, 680-689.
Dean, D. L., Hender, J. M., Rodgers, T. L., & Santanen, E. L. (2006). Identifying Quality, Novel, and Creative Ideas: Constructs and Scales for Idea Evaluation. Journal of the Association for Information Systems, 7(10), 646–698.
Dorst, K. (2011). The core of “design thinking” and its application. Design Studies, 32(6), 521–532.
Dorst, K., & Cross, N. (2001). Creativity in the design process: co-evolution of problem–solution. Design Studies, 22(5), 425–437.
Ehn, P. & Kyng, M. (1991). Cardboard Computers: Mocking-it-up or Hands-on the Future. In J. Greenbaum and M. Kyng (eds) Design at Work: Cooperative Design of Computer Systems. Hillsdale, N.J.: Lawrence Erlbaum Associates. pp. 169-195.

29
Ettema, D. F., Abenoza, R. F., & Susilo, Y. O. (2016). Satisfaction with intermodal trips in Stockholm: How do service attributes influence satisfaction with the main mode and with the journey as a whole? Transportation Research Board 95th Annual Meeting. No. 16-2247, 46(January), 1–16.
Fischer, G., & Sullivan Jr., J. F. (2002). Human-centered public transportation systems for persons with cognitive disabilities: Challenges and insights for participatory design. Participatory Design Conference (PDC’02), 194–198.
Gasson, S. (2003). Human-Centered Vs. User-Centered approaches to information system design. JITTA: Journal of Information Technology Theory and Application, 5(2), 29–46.
Gaver, W., Dunne, A. & Pacenti, E. (1999). Design: Cultural Probes. interactions, 6(1), 21-29.
Grosvenor, T. (2000). Qualitative Research in the Transport Sector. TRB Transportation Research Circular E-C008, 1–20.
Hanington, B. (2003). Methods in the Making: A Perspective on the State of Human Research in Design. Design Issues, 19(4), 9-18.
Harfield, S. (2007). On design “problematization”: Theorising differences in designed outcomes. Design Studies, 28(2), 159–173.
Hernandez, N. V., Shah, J. J., & Smith, S. M. (2010). Understanding design ideation mechanisms through multilevel aligned empirical studies. Design Studies, 31(4), 382–410.
Hörold, S., Mayas, C., & Krömker, H. (2013). User-oriented information systems in public transport. Contemporary Ergonomics and Human Factors 2013, 160–167.
Jansson, D. G., & Smith, S. M. (1991). Design fixation. Design Studies, 12(1), 3–11.
Jaruzelski, B., Volker S.,& Brad G.. (2014). Proven paths to innovation success. Ten years of research reveal the best R&D strategies for the decade ahead, Strategy+ Business, Booz&Co winter. 77, 1-18.
Jonson, B. (2005). Design ideation: The conceptual sketch in the digital age. Design Studies, 26(6), 613–624.
Kamel, J., Vosooghi, R., Puchinger, J., Ksontini, F., Sirin, G. (2019). Exploring the impact of user preferences on shared autonomous vehicle modal split: a multi-agent simulation approach. Transportation Research Procedia 37, 115–122.
Katzev, R. (2003). Car Sharing: A New Approach to Urban Transportation Problems. Analyses of Social Issues and Public Policy, 3(1), 65–86.
Kelly, J., & Matthews, B. (2014). Displacing use: Exploring alternative relationships in a human-centred design process. Design Studies, 35(4), 353–373.
Kerschner, H., & Aizenberg, R. (2004). Focus group participants reflect on transportation. In 27th Proceedings of Transportation in an Aging Society (Vol. 27, pp. 293–301). TRB.
Kim, C.W., Mauborgne, R. (2005). Blue ocean strategy - How to create uncontested market space and make the competition irrelevant, Boston, USA/MA: Harvard Business School press.
Kremer, S., Krahl, T., & Lindemann, U. (2017). User Experience Journeys. In 21st International Conference on Engineering Design (ICED17) (Vol. 4, pp. 483–492). Vancouver, Canada,.

30
Kruger, C., & Cross, N. (2006). Solution driven versus problem driven design: strategies and outcomes. Design Studies, 27(5), 527–548.
Lamé, G., Yannou, B., Cluzel, F. (2018). Analyzing RID methodology through the lens of innovative abduction, In International Design Conference, May 21-24, Dubrovnik, Croatia.
Lawson, B. (2005). How Designers Think: The Design Process Demystified (4th ed.). UK: Architectural Press is an imprint of Elsevier.
Linsey, J. S., Clauss, E. F., Kurtoglu, T., Murphy, J. T., Wood, K. L., & Markman, A. B. (2011). An Experimental Study of Group Idea Generation Techniques: Understanding the Roles of Idea Representation and Viewing Methods. Journal of Mechanical Design, 133(3), 031008.
Maher, M. L., & Poon, J. (1996). Modelling design exploration as co-evolution. Microcomputers in Civil Engineering, 11, 195–210.
Mitchell, D., Claris, S., & Edge, D. (2016). Human-Centered Mobility: A New Approach to Designing and Improving Our Urban Transport Infrastructure. Engineering, 2(1), 33–36.
Morgan, D. (1997). The focus group guidebook (Vol. 1). Sage publications.
Nemeth, C. (2004). Human Factors Methods for Design - Making systems Human centered.
Norman, D. A., Stappers, P. J., Donald, C. A., & Norman, A. (2016). DesignX: Complex Sociotechnical Systems, 83–106.
OECD. (2014). Transport for a changing World. International Transport Forum Annual Summit, Report,
[online] https://www.itf-oecd.org/2014-annual-summit-highlights-transport-changing-world-session-
summaries, Accessed 24/04/17.
Osterwalder, A., Pigneur,Y., Bernarda, G., Smith, A. & Papadakos P.(2014). Value Proposition Design, Hoboken, New Jersey: John Wiley & Sons, Inc.
Peeters, J., Verhaegen, P., Vandevenne, D., & Duflou, J. R. (2010). Refined Metrics for Measuring Novelty in Ideation. Proceedings of IDMME - Virtual Concept 2010, (January), 1–4.
Read, G. J. M., Beanland, V., Lenne, M. G., Stanton, N. A., & Salmon, P. M. (2017). Integrating Human Factors Methods and Systems Thingking for Transport Analysis and Design. Loughborough University: CRC Press.
Reich, Y. (1995). Measuring the value of knowledge. International Journal of Human-Computer Studies, 42(1), 3–30.
Reinig, B., Briggs, R., & Nunamaker, J. (2007). On the Measurement of Ideation Quality. Journal of Management Information Systems, 23(4), 143–161.
Sammer, G., Uhlmann, T., Unbehaun, W., Millonig, A., Mandl, B., Dangschat, J., & Mayr, R. (2012). Identification of Mobility-Impaired Persons and Analysis of Their Travel Behavior and Needs. Transportation Research Record: Journal of the Transportation Research Board, 2320(2320), 46–54.
Sanders, E. (2002). From user-centered to participatory design approaches. In J. Frascara (Ed.), Design and the Social Sciences Making connections (pp. 1–8). London: Taylor & Francis.
Sanders, E., & Stappers, P. J. (2008). Co-creation and the new landscapes of design. CoDesign, 4(1), 5–18.

31
Santana, F. E., Cardoso, C. C., Ferreira, M. G. G., Catapan, M. F., Montanha, I. R., & Forcellini, F. A. (2018). Towards a more inclusive service development process for the wider population. Design Studies, 55, 146–173.
Santanen, E. L., Briggs, R. O., & Vreede, G.-J. DE. (2004). Causal Relationships in Creative Problem Solving: Comparing Facilitation Interventions for Ideation. Journal of Management Information Systems, 20(4), 167–198.
Savransky, S.D.(2000). Engineering of creativity - Introduction to TRIZ Methodology of Inventive Problem Solving, CRC Press.
Shah, J. (2003). Metrics for measuring ideation effectiveness. Design Studies, 24(2), 111–134.
Shah, J., Kulkarni, S., & Vargas-Hernandez, N. (2000). Evaluation of Idea Generation Methods for
Conceptual Design: Effectiveness Metrics and Design of Experiments. Journal of Mechanical Design,
122(4), 377-384.
Solomon, R. L. (1949). An extension of control group design. Psychological Bulletin, 46(2), 137–150.
Sopjani, L., Stier, J. J., & Ritzén, S. (2016). User involvement in disruptive innovation – A study on users of a light electric vehicle sharing system. Proceedings of the 23rd Innovation and Product Development Management Conference. Glasgow, UK, (July 2017).
Sussman, J., Sgouridis, S., & Ward, J. (2005). New Approach to Transportation Planning for the 21st Century: Regional Strategic Transportation Planning as a Complex Large-Scale Integrated Open System. Transportation Research Record: Journal of the Transportation Research Board, 1931(1), 89–98.
Tang, K. C., & Davis, a. (1995). Critical factors in the determination of focus group size. Family Practice, 12(4), 474–475.
Tyl, B., Legardeur, J., Millet, D., & Vallet, F. (2014). A comparative study of ideation mechanisms used in eco-innovation tools. Journal of Engineering Design, 25(10–12), 325–345.
Vasconcelos, L., & Crilly, N. (2016). Inspiration and fixation: Questions, methods, findings, and challenges. Design Studies, 42, 1-32.
Verhaegen, P. A., Vandevenne, D., Peeters, J., & Duflou, J. R. (2013). Refinements to the variety metric for idea evaluation. Design Studies, 34(2), 243–263.
von Hippel, E. (2005). Democratizing innovation: The evolving phenomenon of user innovation. Journal Fur Betriebswirtschaft, 55(1), 63–78.
Von Hippel, E. (1986). Lead Users: A Source of Novel Product Concepts. Management Science, 791–805.
Vredenburg, K., Mao, J.-Y., Smith, P. W., & Carey, T. (2002). A survey of user-centered design practice. Proceedings of the SIGCHI Conference on Human Factors in Computing Systems Changing Our World, Changing Ourselves - CHI ’02, (1), 471.
Wartzack, S., Vietor, T., Sevtsuk, A., & Hartley, J. (2017). Design and Mobility: Call for a Thematic Collection of Articles for the Design Science Journal. Design Science, (Design and Mobility), 1.
Wiltschnig, S., Christensen, B. T., & Ball, L. J. (2013). Collaborative problem–solution co-evolution in creative design. Design Studies, 34, 515-542.

32
Woodcock, A., Topolavic, S., & Osmond, J. (2013). The Multi-faceted Public Transport Problems Revealed by a Small Scale Transport Study. In Advances in human aspects of road and rail transportation (pp. 321–330).
Yannou, B. (2015). Supporting need seeker innovation : the Radical Innovation Design (RID) methodology. In ICED 15.
Yannou B., Cluzel F. &Farel R.(2016). Capturing the relevant problems leading to pain and usage driven innovations: the DSM Value Bucket algorithm. Concurrent Engineering - Research And Applications (CERA), 1-16.
Yu R., Gu N., Ostwald M. J. &Gero J.(2014). Empirical support for problem–solution coevolution in a parametric design environment, Artificial intelligence for engineering design analysis and manufacturing 29(01),1-12.
Appendix
1. Travel problems recorded through the experiment
Category Do Body Mind Emotion Arrival People Weather Design Operation System problem
Operation problem
Code do bo mi emo ar pe we de op sys opa
Problem categories codes
Time Travel problems of G1 Code
0:03:08 Not enough seating de
0:03:18 Bus always crowded opa, pe
0:04:29 Temperature sometimes excessive, lack of air conditioning in some buses bo, we, de
0:05:01 Signage problem: lack of visibility de
0:05:24 Signage problem: late notification of mission change op
0:06:35 No queuing, jostling at the entrance of the buses pe, bo, op
0:07:46 Only the 91.06 bus dock is crowded in rush hour pe, op
0:08:56 Drivers are uncomfortable at times (aggressive response to a request for information)
pe
0:10:07 Service schedules are difficult to read de
0:11:18 Aggressive driving, sometimes dangerous. Sometimes sudden braking pe, opa
0:12:28 Bus status not always satisfactory (buses added to increase frequency) op
0:13:39 Stops not marked if bus full and no on-demand stops op
0:16:00 Information screens inside still display excuses: information not available sys
0:25:21 No adaptation to problems encountered in other modes of transport (train!) op
0:27:53 Unsatisfactory service during off-peak hours op
0:30:13 Lengthening journey times over time (between Massy and Corbeville) we, opa
0:32:01 Unpleasant odours -> Maintenance, aeration, cleaning op, sys
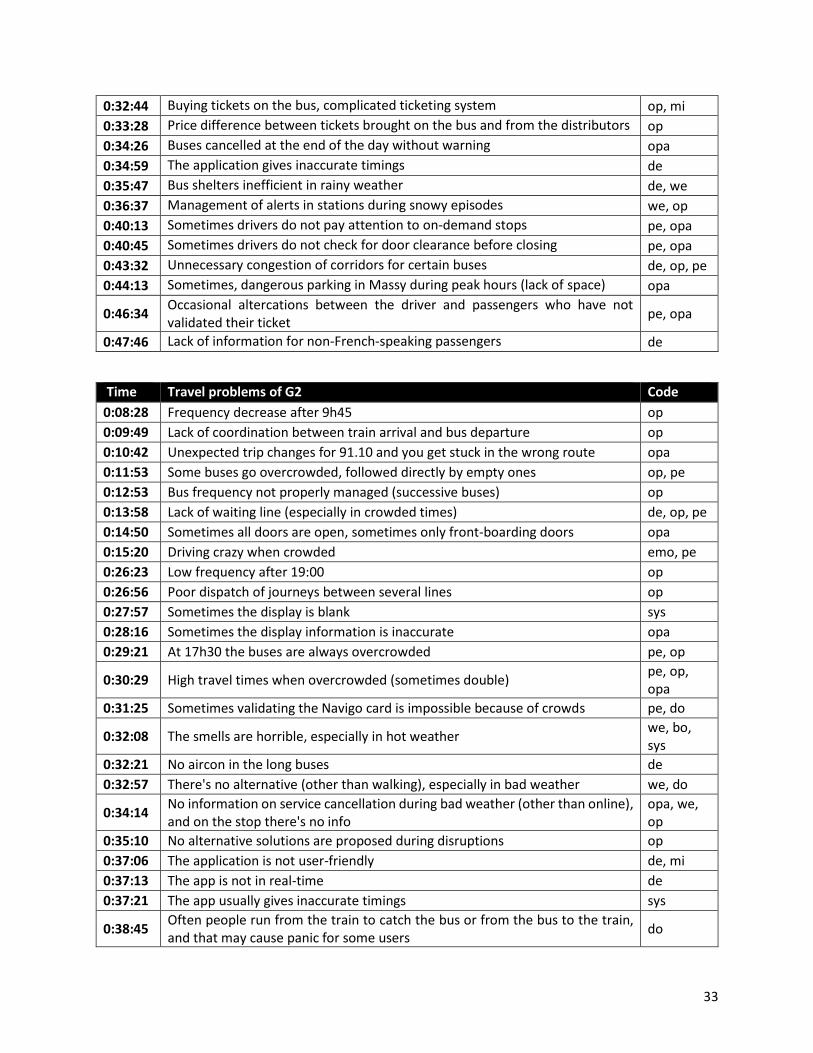
33
0:32:44 Buying tickets on the bus, complicated ticketing system op, mi
0:33:28 Price difference between tickets brought on the bus and from the distributors op
0:34:26 Buses cancelled at the end of the day without warning opa
0:34:59 The application gives inaccurate timings de
0:35:47 Bus shelters inefficient in rainy weather de, we
0:36:37 Management of alerts in stations during snowy episodes we, op
0:40:13 Sometimes drivers do not pay attention to on-demand stops pe, opa
0:40:45 Sometimes drivers do not check for door clearance before closing pe, opa
0:43:32 Unnecessary congestion of corridors for certain buses de, op, pe
0:44:13 Sometimes, dangerous parking in Massy during peak hours (lack of space) opa
0:46:34 Occasional altercations between the driver and passengers who have not validated their ticket
pe, opa
0:47:46 Lack of information for non-French-speaking passengers de
Time Travel problems of G2 Code
0:08:28 Frequency decrease after 9h45 op
0:09:49 Lack of coordination between train arrival and bus departure op
0:10:42 Unexpected trip changes for 91.10 and you get stuck in the wrong route opa
0:11:53 Some buses go overcrowded, followed directly by empty ones op, pe
0:12:53 Bus frequency not properly managed (successive buses) op
0:13:58 Lack of waiting line (especially in crowded times) de, op, pe
0:14:50 Sometimes all doors are open, sometimes only front-boarding doors opa
0:15:20 Driving crazy when crowded emo, pe
0:26:23 Low frequency after 19:00 op
0:26:56 Poor dispatch of journeys between several lines op
0:27:57 Sometimes the display is blank sys
0:28:16 Sometimes the display information is inaccurate opa
0:29:21 At 17h30 the buses are always overcrowded pe, op
0:30:29 High travel times when overcrowded (sometimes double) pe, op, opa
0:31:25 Sometimes validating the Navigo card is impossible because of crowds pe, do
0:32:08 The smells are horrible, especially in hot weather we, bo, sys
0:32:21 No aircon in the long buses de
0:32:57 There's no alternative (other than walking), especially in bad weather we, do
0:34:14 No information on service cancellation during bad weather (other than online), and on the stop there's no info
opa, we, op
0:35:10 No alternative solutions are proposed during disruptions op
0:37:06 The application is not user-friendly de, mi
0:37:13 The app is not in real-time de
0:37:21 The app usually gives inaccurate timings sys
0:38:45 Often people run from the train to catch the bus or from the bus to the train, and that may cause panic for some users
do
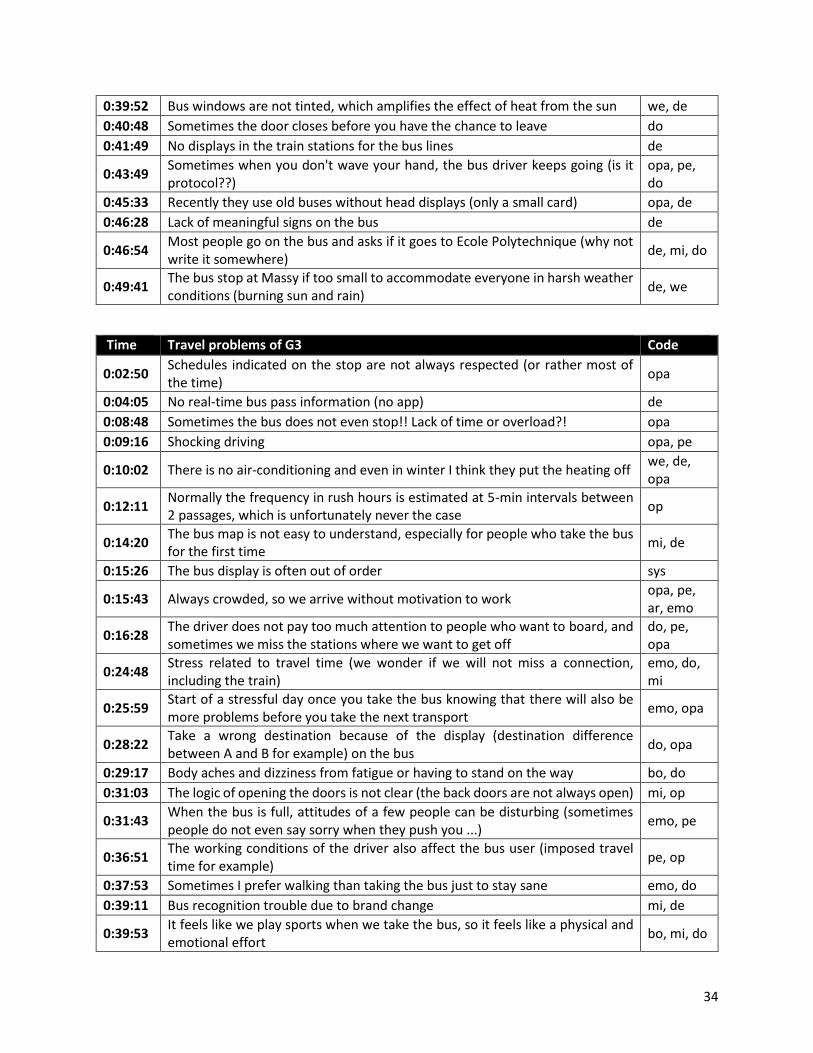
34
0:39:52 Bus windows are not tinted, which amplifies the effect of heat from the sun we, de
0:40:48 Sometimes the door closes before you have the chance to leave do
0:41:49 No displays in the train stations for the bus lines de
0:43:49 Sometimes when you don't wave your hand, the bus driver keeps going (is it protocol??)
opa, pe, do
0:45:33 Recently they use old buses without head displays (only a small card) opa, de
0:46:28 Lack of meaningful signs on the bus de
0:46:54 Most people go on the bus and asks if it goes to Ecole Polytechnique (why not write it somewhere)
de, mi, do
0:49:41 The bus stop at Massy if too small to accommodate everyone in harsh weather conditions (burning sun and rain)
de, we
Time Travel problems of G3 Code
0:02:50 Schedules indicated on the stop are not always respected (or rather most of the time)
opa
0:04:05 No real-time bus pass information (no app) de
0:08:48 Sometimes the bus does not even stop!! Lack of time or overload?! opa
0:09:16 Shocking driving opa, pe
0:10:02 There is no air-conditioning and even in winter I think they put the heating off we, de, opa
0:12:11 Normally the frequency in rush hours is estimated at 5-min intervals between 2 passages, which is unfortunately never the case
op
0:14:20 The bus map is not easy to understand, especially for people who take the bus for the first time
mi, de
0:15:26 The bus display is often out of order sys
0:15:43 Always crowded, so we arrive without motivation to work opa, pe, ar, emo
0:16:28 The driver does not pay too much attention to people who want to board, and sometimes we miss the stations where we want to get off
do, pe, opa
0:24:48 Stress related to travel time (we wonder if we will not miss a connection, including the train)
emo, do, mi
0:25:59 Start of a stressful day once you take the bus knowing that there will also be more problems before you take the next transport
emo, opa
0:28:22 Take a wrong destination because of the display (destination difference between A and B for example) on the bus
do, opa
0:29:17 Body aches and dizziness from fatigue or having to stand on the way bo, do
0:31:03 The logic of opening the doors is not clear (the back doors are not always open) mi, op
0:31:43 When the bus is full, attitudes of a few people can be disturbing (sometimes people do not even say sorry when they push you ...)
emo, pe
0:36:51 The working conditions of the driver also affect the bus user (imposed travel time for example)
pe, op
0:37:53 Sometimes I prefer walking than taking the bus just to stay sane emo, do
0:39:11 Bus recognition trouble due to brand change mi, de
0:39:53 It feels like we play sports when we take the bus, so it feels like a physical and emotional effort
bo, mi, do

35
0:41:13 The dock managers are sometimes disturbing and sometimes make weird decisions and give misinformation
pe, opa; emo
0:43:05 Off rush hour and weekends, there are not enough buses op
0:45:34 Why don’t we have Wi-Fi by bus, or a little music to relax people ! de, emo
0:46:14 No voice messages to inform people or manage the trip de
0:49:07 No respect for signboarded times opa
0:50:50 Maybe think of products that limit the contaminations between people (transmission of diseases)
bo, pe, de
Time Travel problems of G4 Code
0:04:23 Many people waiting for the bus -> full bus pe
0:04:56 No synchronization between the train and this bus line even though it is important as it passes by all the schools
op
0:05:23 No respect for time schedules, no clear schedules mi, op
0:07:29 Bad interior design (security), no balance, no place to grab -> safety de, bo
0:08:28 Waiting line not clear -> people get in with no order pe, do, mi
0:09:43 Not practical for getting in and out (front boarding and back boarding) de, do
0:10:59 Summer schedules + Sundays -> fewer buses op
0:12:14 Screens don't work most of the time -> Can't know which is the stop sys, mi
0:13:29 Waiting times for the next bus don't appear all the time sys
0:16:00 Buses don't always stop at bus stops (in case another bus is already passing by or full)
opa
0:25:00 We don't always find a place to sit do
0:25:25 Stations are not well prepared for sun/rain de, we
0:25:49 Not prepared for disabled people when the bus is full. How do they take the bus?
de, do, pe
0:26:14 After a bad trip, we are not in the right mood for work emo, ar
0:27:04 Sometimes the bus stops at an unsuitable place for getting off opa
0:30:55 Bad synchronization between buses in both directions and cars trying to pass pe, op
0:32:27 Pedestrian passageways neither safe nor practical (near work) de
0:35:04 Some drivers refuse to accept travellers with no ticket and no cash to pay pe, opa
0:37:58 Prices don't motivate people to take the bus, partially as tickets are expensive (imagine taking the car for two days and the bus for the rest of the week)
mi, op
0:39:31 The bus doesn't always depart from its proper station at Massy opa
0:42:55 Buses are not well equipped for hot spells/cold snaps we, de
0:44:38 If we carry a lot of stuff, then the bus is not at all a good choice (bringing my lunch to work)
do, ar, de
0:48:00 The bus could be a good choice on Friday evenings to avoid the traffic op
0:50:00 We feel less safe/comfortable when there are a lot of people around on the bus pe, bo, emo