Stimulating Exploration in the East Kootenays (SEEK ... · the gravity data listings were not in...
48
Stimulating Exploration in the East Kootenays (SEEK Project): The Updated East Kootenay Gravity Database (EKGDB) AND The 2013 St. Mary Gravity Survey Ted Sanders 1 1 Ted Sanders Consulting, Fernie B.C.; [email protected] October 2013 Geoscience BC Report 2013-23
Transcript of Stimulating Exploration in the East Kootenays (SEEK ... · the gravity data listings were not in...
Stimulating Exploration in the East Kootenays
(SEEK Project):
The Updated East Kootenay Gravity Database (EKGDB)
AND
The 2013 St. Mary Gravity Survey
Ted Sanders1
1 Ted Sanders Consulting, Fernie B.C.; [email protected]
October 2013
Geoscience BC Report 2013-23
TABLE OF CONTENTS page
1 INTRODUCTION TO THE GRAVITY DATABASE .................................................................... 3
2 REGION COVERED BY GRAVITY DATABASE ........................................................................ 3
3 DESCRIPTION OF THE EKGDB ................................................................................................... 3 3.1 Database Field Names and Descriptions ..................................................................................... 4
4 GRAVITY DATA SOURCES............................................................................................................ 6 4.1 Data Source Citations .................................................................................................................... 6 4.2 Mineral Titles Online – ARIS ....................................................................................................... 6 4.3 GSC Gravity Database .................................................................................................................. 6 4.4 Contribution by BK 98 Joint Venture Claim Group ................................................................. 6 4.5 2013 ST. MARY GRAVITY SURVEY ........................................................................................ 7
5 EVALUATION OF GRAVITY DATA SOURCES ......................................................................... 7 5.1 Assessment Reports on ARIS Website ......................................................................................... 7 5.2 Digitized Map Data on ARIS website .......................................................................................... 8 5.3 GSC Gravity Data ......................................................................................................................... 8 5.4 BK 98 Joint Venture Claim Group Gravity Data ....................................................................... 8 5.5 2013 st. mary gravity Survey ........................................................................................................ 8
6 The 2013 ST. MARY GRAVITY SURVEY ................................................................................... 10 6.1 Introduction - THE MATTHEW CREEK GRAVITY ANOMALY ...................................... 10 6.2 Report and 2013 St. MARY Gravity SURVEY PROPOSAL ................................................. 11 6.3 2013 St. MARY Gravity SURVEY OVERVIEW ..................................................................... 12 6.4 SURVEY PARAMETERS .......................................................................................................... 12 6.5 DATA PROCESSING ................................................................................................................. 13 6.6 MAPPING AND PRELIMINARY INTERPRETATION ....................................................... 13 6.7 Discussion ..................................................................................................................................... 16
7 REFERENCES .................................................................................................................................. 16
FIGURES
EAST KOOTENAY GRAVITY DATABASE
Figure 1: Location Map for the EKGDB .............................................................................................. 4
2013 St. MARY GRAVITY SURVEY
Figure 2: Regional Gravity Contour Map St. Mary Area using 2012 EKGDB…………………10
Figure 3: Gravimeter on Airport Gravity Base, Helicopter in flight ………………………………12
Figure 4: St Mary River Area Station Location Maps: 2012 & 2013 EKGDB......................……..14
1

Figure 5: Regional Gravity map of the St. Mary Region using the 2013 EKGDB.............……..14
Figure 6: Residual Gravity map of the St. Mary Region using the 2013 EKGDB.............……..15
TABLES
Table 1: EKGDB Field Names and Descriptions…………………………………...…….…………..5
Table 2: EKGDB Field Names and Relevant Information for GSC Stations ………………………9
APPENDICIES
ARIS Survey Specifications and Adjustments……………….………………..……………………17
2013 St. Mary Gravity Survey Specifications………………………………....…………….………38
. 2013 St. Mary Gravity Survey – Interpretive 3D Modeling…………………………………….…40
2
1 INTRODUCTION TO THE GRAVITY DATABASE
The East Kootenay ground station Gravity Database is a component of the Stimulating Exploration in the East Kootenays (SEEK) program. The SEEK program is sponsored by Geoscience BC in partnership with the East Kootenay Chamber of Mines.
The majority of gravity data in the East Kootenay Gravity Database (EKGDB) was obtained from data listings in 19 assessment reports on the Mineral Titles Online ARIS (Assessment Report Indexing System) website (www.empr.gov.bc.ca/mining/geoscience/aris/pages/default.aspx). Other sources include: contributed data from a gravity survey not currently available on the ARIS website, a subset of the Geological Survey of Canada (GSC) database, a digitized Bouguer Anomaly posting map obtained from an ARIS file, and the new 2013 St. Mary Gravity Survey.
All of the original gravity data listings in the ARIS pdf files include Bouguer Anomaly values for each station. However, Bouguer Anomaly values from different contractors used different data reduction formulae and parameters. Some processing errors were also detected in the raw data listings. As a result, leveling adjustments have been made to some of the ARIS GPS survey data, Observed Gravity values, and Bouguer Anomaly data prior to reprocessing and the creation of a uniform Gravity Database. In addition, 30 km Outer Terrain Corrections were calculated for each station as part of data reduction to Bouguer Anomaly values in the database.
This project enables users to download digital (.csv) files of the original ARIS gravity data listings and raw Inner Terrain Correction data. In addition, the complete database (27 fields) can be downloaded and includes raw and reduced Bouguer Anomaly values for all stations using three rock densities.
2 REGION COVERED BY GRAVITY DATABASE
The geographical boundaries for the EKGDB are Latitudes 49o00’ to 50o00’ North, and Longitudes 115o30’ to 117o’00 West, spanning the east half of NTS 82F and the western quarter of 82G (Figure 1). Kootenay Lake is near the western margin of the area and the Purcell Rocky Mountain Trench is near the eastern margin. All station locations are referenced with latitude and longitude coordinates, as well as Universal Transverse Mercator (NAD83) coordinates.
The individual ARIS gravity datasets included in the EKGDB are concentrated in several sub-regions within the area defined above and include the St. Mary Lake/Matthew Creek area, the Wildhorse River and Moyie River drainages, Cranbrook, Crawford Bay, and regions east and west of Yahk, B.C.
3 DESCRIPTION OF THE EKGDB
The updated EKGDB contains records for over 5300 individual ground gravity stations. The four source-types of data described in the introduction share many common fields, but some of the Database fields contain data for only one of the source types. Each data record has been given a unique record number (“vector”). The four database source types are:
1) ARIS (and contributed) data (3888 stations, DB vectors 1-3888); 2) 2013 St. Mary Gravity Survey (217 stations, DB vectors 3889-4105); 3) GSC data (485 stations, DB vectors 4106-4590); and, 4) Tied Bouguer Anomaly values from a digitized map (735 stations, DB vectors 4491-5325).
3
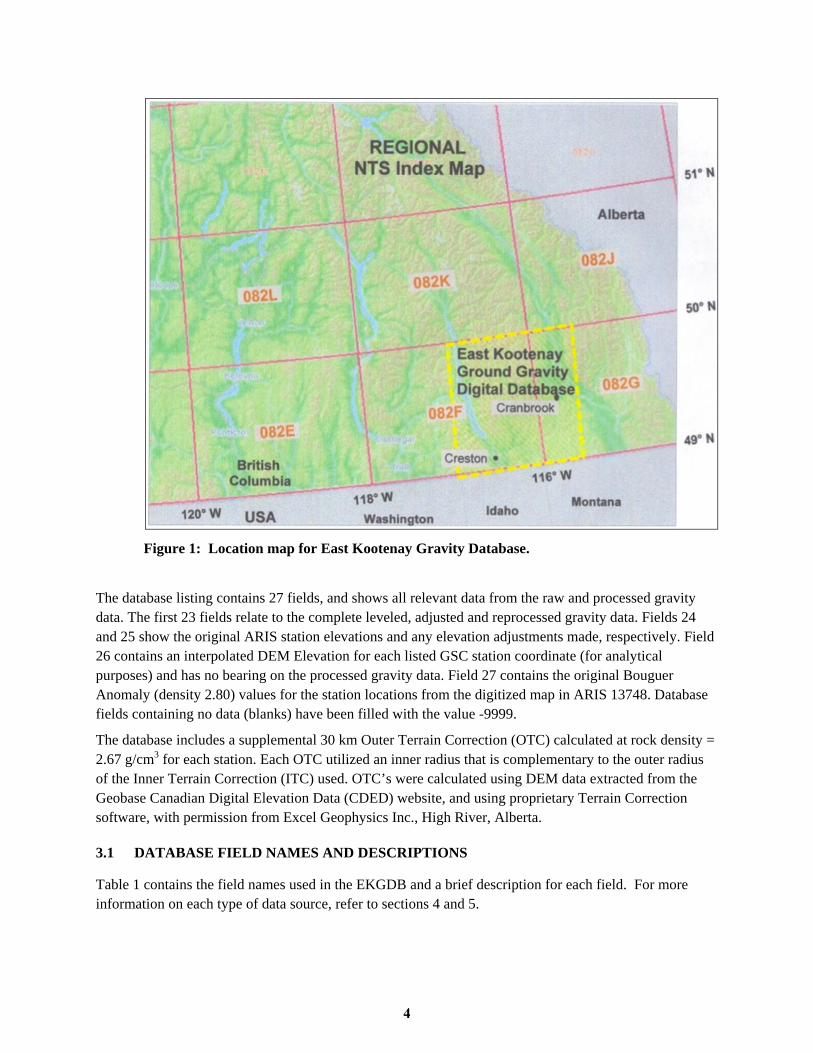
Figure 1: Location map for East Kootenay Gravity Database.
The database listing contains 27 fields, and shows all relevant data from the raw and processed gravity data. The first 23 fields relate to the complete leveled, adjusted and reprocessed gravity data. Fields 24 and 25 show the original ARIS station elevations and any elevation adjustments made, respectively. Field 26 contains an interpolated DEM Elevation for each listed GSC station coordinate (for analytical purposes) and has no bearing on the processed gravity data. Field 27 contains the original Bouguer Anomaly (density 2.80) values for the station locations from the digitized map in ARIS 13748. Database fields containing no data (blanks) have been filled with the value -9999.
The database includes a supplemental 30 km Outer Terrain Correction (OTC) calculated at rock density = 2.67 g/cm3 for each station. Each OTC utilized an inner radius that is complementary to the outer radius of the Inner Terrain Correction (ITC) used. OTC’s were calculated using DEM data extracted from the Geobase Canadian Digital Elevation Data (CDED) website, and using proprietary Terrain Correction software, with permission from Excel Geophysics Inc., High River, Alberta.
3.1 DATABASE FIELD NAMES AND DESCRIPTIONS
Table 1 contains the field names used in the EKGDB and a brief description for each field. For more information on each type of data source, refer to sections 4 and 5.
4

Table 1: EKGDB Field Names and Descriptions.
Field Name Field Description
Vector Unique record number within the database
Source ARIS Report Number (if available), “GSC” for GSC data, SEEK2013 for new survey
Line_Project Line Number (if used), Project Number (for GSC data)
Station Station Number
UTMX UTM Easting (NAD83, zone 11)
UTMY UTM Northing (NAD83, zone 11)
LAT Latitude (NAD83)
LONG Longitude (NAD83)
ELEV Adjusted Elevation (= “ELEV_orig” + “Adjust” value)
OBSGRAV Observed Gravity: tied to Canadian Gravity Standardization Network (CGSN)
LAT_COR Latitude Correction: (uses WGS84 formula - shown below Field Name list)
FA_COR Free-Air Correction (=ELEV * 0.03086)
BG_COR Bouguer Correction (=ELEV * -0.04192 * 2.67 (density))
50mITC 2-50 metre Inner Terrain Correction (density 2.67), ARIS data
55mITC 2-55 metre Inner Terrain Correction (density 2.67), ARIS data
170mITC 2-170 metre Inner Terrain Correction (density 2.67), ARIS data
175mITC 2-175 metre Inner Terrain Correction (density 2.67), ARIS data
30kOTC 30 km Outer Terrain Correction (density 2.67), calculated
GSC22kTC267 Original GSC 22 km Terrain Correction (density 2.67)
GSC30kTC267 22-30 km Terrain Correction for GSC data (density 2.67)
Bougan267 = OBSGRAV – LAT_COR+ FA_COR + BG_COR + ITC* + 30kOTC**
Bougan275 = OBSGRAV – LAT_COR + FA_COR + 2.75/2.67 * (BG_COR + ITC* + 30kOTC**)
Bougan280 = OBSGRAV – LAT_COR + FA_COR + 2.80/2.67 * (BG_COR + ITC* + 30kOTC**)
ELEV_orig Original elevation from ARIS data listing
Adjust Elevation Adjustment (metres)
DEM_elev Interpolated DEM elevation at GSC station location
Orig_Boug280 ARIS Report 13748 original Bouguer Anomaly value for station
* ITC:uses only one of the four ARIS ITC fields or 22kTC267 for GSC data, see Section 5.1
** GSC data uses 30kTC267 for outer terrain corrections instead of 30kOTC
WGS84 Latitude Correction formula used:
978032.67714*(1+0.00193185138639*Sin(LAT)2 )/(1-0.00669437999013*Sin(LAT)2 )0.5
5

4 GRAVITY DATA SOURCES
4.1 DATA SOURCE CITATIONS
BC Ministry of Energy and Mines (2012): ARIS assessment report indexing system; BC Ministry of Energy, Mines and Petroleum Resources, URL <http://aris.empr.gov.bc.ca> [May 2010].
Excel Geophysics Inc., Fort Steele Gravity Survey, Ft. Steele, British Columbia, Canada;
BK 98 Exploration Gravity Joint Venture Claims Fund (December, 2010; April, 2011)
Jones, B. (2013): Saint Mary’s River Gravity Survey Modeling and Interpretation Report, Cranbrook, British Columbia; Excel Geophysics Inc., 8 p.
Natural Resources Canada (2012): Canadian Geodetic Information System; Geoscience Data Repository, Geodetic Survey Division, Earth Sciences Sector, Natural Resources Canada, URL <http://gdrdap.agg.nrcan.gc.ca/geodap/home/Default.aspx?lang=e> [Dec 2011]
National Topographic Data Base (NTDB): Canadian Digital Elevation Data (CDED), B.C. Data Sources > T.R.I.M. 1:20,000, URL ,<http://www.geobase.ca/geobase/en/data/cded/index.html>[Dec 2011]
4.2 MINERAL TITLES ONLINE – ARIS
Older ARIS pdf documents were produced from images of scanned pages of hard-copy reports. Therefore the gravity data listings were not in digital format. Listings of raw and processed gravity data for 3686 individual gravity stations from 19 individual ARIS files were scanned and converted to digital format as part of this project. To date (Sept., 2013), the acquired ARIS files containing gravity listings in the East Kootenays are:
24687 25271 25395 25527 25590 29738
24786 25326 25467 25555 25715 30170
25217 25348 25526 25567 28454 32378 32911
In addition to the ARIS listings above, over 700 station locations with annotated Bouguer Anomaly values were digitized from a Bouguer Anomaly Map in ARIS 13748 (1984).
4.3 GSC GRAVITY DATABASE
Gravity data for 485 stations (acquired between 1954 and 1979) was extracted from the GSC Gravity Database, available on the NRCAN website. See section 5.2 for details.
4.4 CONTRIBUTION BY BK 98 JOINT VENTURE CLAIM GROUP
The BK 98 Gravity Survey Joint Venture Claim Group generously agreed to contribute data to this project. 202 gravity stations were acquired in October 2011 and have been included in the database. The assessment report for this survey (ARIS 33290) is now off-confidentiality but a listing of the gravity data does not appear in the report.
6

4.5 2013 ST. MARY GRAVITY SURVEY
The 2013 St. Mary Gravity Survey was funded by Geoscience BC under the SEEK (Stimulating Exploration in the East Kootenays) program, and stations were acquired during July and September, 2013. 217 unique ground gravity stations were acquired. See Section 6.2 for details.
5 EVALUATION OF GRAVITY DATA SOURCES
5.1 ASSESSMENT REPORTS ON ARIS WEBSITE
Listings containing raw and processed gravity data were located in 19 Mineral Titles Online assessment reports (see section 4.2). Mining companies or prospectors contracted these ground gravity surveys. All data listings contained Bouguer Anomaly values for each gravity station. However, not all listings were complete. In addition, not all gravity surveys were processed to Bouguer Anomaly using the same parameters or reduction formulae, and some minor errors were detected. Therefore, it is not possible to correctly merge the original processed Bouguer Anomaly values from each survey together for mapping.
All gravity station coordinates in the 19 ARIS files were acquired by GPS surveying methods. However, some GPS surveys were not referenced to Canadian Geodetic Control Monuments and used an autonomous GPS fix for base station coordinates. As a result, elevation adjustments (bulk shifts) have been made to a few groups of stations based on a combination of:
1) comparisons of station coordinate elevations to the local Digital Elevation Model, and 2) comparisons of station Bouguer Anomaly values to nearby stations from surveys tied to Geodetic
Control monuments.
The database field labeled “ELEV_orig” displays the original station elevations. The field labeled “Adjust” shows any elevation adjustments (in metres) added to the original elevations to attain the “ELEV” field used for data reduction in the database.
Latitude/Longitude and UTM coordinates for the survey in ARIS 25715 were tied to a GPS base station coordinate established by autonomous fix. All station UTM x, y, z coordinates were found to have a significant GPS positional error and were adjusted. Observed Gravity values for one survey (ARIS 25217) were found to be incorrectly tied to the National Gravity Absolute Network and were corrected. Specifications for the original gravity surveys and any adjustments to original raw data for each ARIS survey have been noted in the appendix.
Four different outer radii for Inner Terrain Corrections were used in the 19 ARIS data listings however each database record only uses one of the four ITC fields shown in the database. Most of the original ARIS gravity data listings did not contain an Outer Terrain Correction (OTC) which is necessary for complete data reduction in mountainous terrain. The database includes a calculated 30 kilometre OTC for each station at rock density = 2.67 g/cm3. Each OTC utilized an inner radius that is complementary to the outer radius of the ITC used. OTC’s were calculated using DEM data extracted from the Geobase CDED website and proprietary Terrain Correction software, with permission from Brian Jones of Excel Geophysics Inc., High River, Alberta.
7

5.2 DIGITIZED MAP DATA ON ARIS WEBSITE
735 station locations were digitized from a 1984 Bouguer Anomaly map obtained from ARIS 13748, and the annotated Bouguer Anomaly values from the map were key-entered for each digitized station location. The digitized UTM coordinates (NAD27) were transformed to NAD83. The original 13748 gravity map data was processed at density 2.80 g/cm3 and included a terrain correction (no radius given). No raw data was included in the ARIS file. The database field “Orig_Boug280” provides the original Bouguer Anomaly values from the map. In 2012, these values were compared to the Bouguer Anomaly values of three reprocessed local GSC stations nearby, and adjusted by constants to tie to the database Bouguer values for the three densities (2.67, 2.75, and 2.80). In 2013, a new gravity survey, funded through Geoscience BC’s SEEK Project (see Section 6), created a gravity base station at the Cranbrook Airport, within 50 metres of some of the gravity stations from this 1984 survey. The Bouguer Anomaly value of the 2013 base station tied to the adjusted values of the ARIS 13748 stations within 0.3 mGal. The Data quality of this survey is considered fair to good.
5.3 GSC GRAVITY DATA
The GSC gravity data is available for free from the Natural Resources Canada (NRCan) website. The vintages of the GSC data in the East Kootenay region range from 1954 to 1979. Relevant information regarding the GSC raw and database fields are provided in Table 2. Data quality is good to very good in areas with roads and culture. In mountainous areas, data quality is less accurate due to estimated station positioning (before GPS availability). In addition, the original 22 km Terrain Correction values included a merged Inner and Outer Terrain Correction. Therefore it was not possible to separate the Inner and Outer Terrain Corrections and recalculate a new Outer Terrain Correction. Instead, a 22-30km Terrain Correction value was created to match other data. Overall, the GSC data quality is good.
The GSC data are made available to users under the terms of the Geogratis Licence Agreement and are copyright © Department of Natural Resources Canada. All rights reserved. The complete agreement can be found at: www.geogratis.ca/geogratis/en/licence.jsp.
5.4 BK 98 JOINT VENTURE CLAIM GROUP GRAVITY DATA
This gravity data was acquired in Oct. 2011 and the ARIS file (33290) pertaining to the survey was released in early 2013. However, a gravity data listing does not appear in the assessment report. The GPS survey for this survey was tied to Geodetic Control Monument 89HP3C near Ft. Steele, BC. The Observed Gravity values were tied to CGSN National Gravity Base 9025-1980 in Cranbrook. The data is of excellent quality. These data are included in records (vector) 3687 to 3888 of the updated database.
5.5 2013 ST. MARY GRAVITY SURVEY
This gravity data was acquired in two phases during July and September, 2013. GPS positional control for both phases was tied to Geodetic Control Monument 89HP3C near Ft. Steele, and CGM 543249 on the St. Mary Lake Road near Matthew Creek. Observed Gravity values were tied to CGSN National Gravity Base 9025-1980 in Cranbrook. Data from both phases of the survey show excellent ties to each other and to existing data in the database. See Section 6.2 for details.
8

Table 2: EKGDB Fields and Relevant Information for GSC Gravity Stations
Field Name Relevant Information for GSC Data
Line_Project Number First four digits: year of survey
Last three digits: specific survey ID number
Geographical Coordinates These were often estimated from cultural markers (i.e. roads, trails, power lines, bridges, railways, etc.) on topographic maps. GSC Station UTM coordinates were converted from Latitude and Longitude (NAD83) provided with the GSC data.
ELEV
(Elevation)
Often used barometric altimeter data. GPS was not available.
OBSGRAV
(Observed Gravity)
Tied to CGSN, rounded to 0.1 mGal
22kTC267
(22km Terrain Correction)
This is the original GSC Terrain Correction. It is the sum of an (2 to 170 m) Inner Terrain Correction (calculated using field estimates at the time of gravity reading) and an (170 m to 22 km) Outer Terrain Correction calculated by hand using Hammer charts and 1:50,000 scale topography maps. It is not possible to separate the two components. Inaccurate Terrain Corrections may exist in mountainous terrain, but adjustments have not been made to this field.
30kTC267
(30km Terrain Correction)
This data field is not included with the original GSC data. It is a supplementary 22-30 km Terrain Correction calculated using the GSC 1 km Digital Terrain File and proprietary Terrain Correction software, by permission from Excel Geophysics, High River, Alberta, in order to provide a matching 30 km Terrain Correction for each station in the Digital Database.
DEM_elev This data field is not included with the original GSC data. It is an interpolated elevation derived from the DEM at the GSC gravity station coordinate. It is for comparative purposes only and has not been used in any database field calculations.
9

6 THE 2013 ST. MARY GRAVITY SURVEY
6.1 INTRODUCTION - THE MATTHEW CREEK GRAVITY ANOMALY
In 2011, a 250 metre grid of the (Total Field) Bouguer Anomaly data (density=2.75) for the Purcell Basin was created from gravity data that is now in the 2012 EKGDB (GBC Report 2012-12). A low-pass filter was applied to the Bouguer Gravity grid to remove short wavelength information coming from shallow-sourced density contrasts in the subsurface. A map of the filtered “Regional Gravity” grid was overlaid on a Surface Geology map (Hoy, Price et al, GM-1995-1) of Southeast British Columbia. A portion of the map covering the St. Mary Lake area is shown in Figure 2 below.
Regions of the Purcell Bain surface geology map that had outcropping rocks of the Aldridge Formation (orange & rose colours) had local gravity highs associated with them relative to areas of outcropping Creston (yellow), Kitchener (blue) or alluvium. This was suspected to be due to the higher density of the Aldridge Formation (inter-layered or cross-cut with dense Moyie Sills) relative to younger rocks of the Purcell Supergroup, and accumulations of alluvium and/or glacial till.
The region of outcropping Aldridge Formation rock in the hangingwall north of the St. Mary Fault had a 30 kilometer wide horseshoe-shaped gravity high associated with it, indicated by the three “+” signs in Figure 2. However, there was an apparent 4-5 mGal gravity low between the highs, in an area dominated by rock of the Lower Aldridge Formation. Subsequent geological research revealed that the location of the gravity anomaly coincided closely with the Matthew Creek Metamorphic Zone (MCMZ - outlined in green) where the small Matthew Creek (pegmatite) Stock outcrops.
Figure 2: Regional Gravity Contour map of St. Mary Area using 2012 EKGDB
10
To confirm that the anomalous gravity low was not related to any near-surface density contrasts between metasediments and gabbro or alluvium, a 2.5D model was created for an E-W profile across the northern third of the MCMZ using the complementary “Residual Gravity” data. The model used a density 2.75 (g/cm3) for Lower Aldridge Formation and 2.65 for pegmatite (granite) in the MCMZ core zone, flanked by thickening layers of Moyie sills (density 3.00) towards the east and west ends of the profile. The model demonstrated that known rock density contrasts coming from less than 1200 metres below surface could be used to model the Residual Gravity profile. At the surface, deposits of alluvium and till greater than 350 metres thick are known to lie in the St. Mary River valley west of St. Mary Lake. Although the Bouguer and Residual Gravity grids showed a 10 mGal low here, the Regional Gravity map showed no anomalous effects from the alluvium, providing evidence that its effects had been removed into the Residual Gravity grid. These two observations strongly suggested that the anomalous Regional Gravity low must come from a deeper source. Geologists have long suspected that the MCMZ had a granitic intrusive as the source of heat for metamorphosis, but there was no geophysical evidence to support this theory. Detailed geological and geochemical work by McFarlane and Pattison in the 1990’s developed a model that “a possible source of magmatic heat to drive the And–Sil metamorphism may have been intrusion of hot (>1000°C) mafic sills during renewed tectonic instability in the Belt–Purcell Basin at 1300–1370 Ma, recognizing that this implies a period of extension and mafic magmatism about 100 Ma later than the emplacement of the Moyie sills in the vicinity of the MCMZ”. The paper also suggested that “the overall relationships exposed in the MCMZ are consistent with extension accompanied by anatexis in the deeper levels of the rifting Purcell Basin at about 1300–1370 Ma, leading to an elevated thermal regime and development of ductile detachments”. The MCMZ research information which led to this conclusion is compelling and the actual cause of metamorphosis may have been a combination of different factors. The Regional Gravity map contours of the grid for the 2012 map ( Figure 2) suggested that the anomalous low extends south beyond the St. Mary Fault. However, there are no gravity stations south of the St. Mary River Forest Service Road and the map contours are a merely a computer-generated interpolation across an area devoid of gravity stations.
6.2 REPORT AND 2013 ST. MARY GRAVITY SURVEY PROPOSAL
A report regarding the Matthew Creek Gravity Anomaly was submitted to Russell Hartlaub (B.C.I.T.) and Geoscience BC by the author in early 2013. In addition to the information provided in the introduction above, the report suggested that a modeled granitoid intrusive (Laccolith), having a density contrast of approximately -0.13 g/cm3 to the surrounding rock, a thickness of ~2000 metres, a depth to top of 2000 metres, and diameter of 6-8 kilometres could be a possible source of the anomalous low seen on the Regional Gravity map. In addition to the report, a proposal to acquire new gravity data around the MCMZ was made. The proposal suggested that new ground gravity data flanking the MCMZ, south of the St. Mary Fault, and west beyond the Hellroaring Creek Stock would provide valuable exploration-related information for the region. The proposal for a new gravity survey was accepted and funded by Geoscience BC through the SEEK program.
11

6.3 2013 ST. MARY GRAVITY SURVEY OVERVIEW
Stations locations for the 2013 gravity survey were laid out to complement the gravity data already in the East Kootenay Gravity Database. Station spacing was approximately one kilometer for stations north of, or near the St. Mary Fault, and two kilometers for stations further than one kilometer south of the fault.
6.4 SURVEY PARAMETERS
The program was divided into two phases. Phase 1 was a standard ground gravity survey, with stations acquired along logging roads and trails. Most of the Phase 2 gravity stations were acquired using a Lacoste & Romberg underwater gravity meter suspended from a 150’ long-line rope beneath a helicopter and lowered to the ground for each gravity station reading. This enabled the acquisition of ground gravity stations in remote locations where the helicopter could not land. GPS positional control for both phases of the survey was tied to Geodetic Control Monuments 89HP3C near Ft. Steele and CGM 543249 on the St. Mary Lake Road near Matthew Creek. Observed Gravity values were tied to a sub-base of CGSN National Gravity Base 9025-1980 in Cranbrook, BC.
Access and travel for Phase 1 station acquisition was by 4x4 truck or ATV from July 23- July 28, 2013. Operators were equipped with Lacoste & Romberg gravimeters and Leica VIVA GPS receivers. 5 to 10 minutes of GPS data were collected at each gravity station to allow accurate post-processing. A gravity reading was taken and inner terrain correction estimates were calculated out to 50 metres from each station. Three stationary GPS base stations were set up in the survey area each day to enable accurate GPS positioning during differential post-processing. 154 unique gravity station readings and 8 repeat readings were made during Phase 1.
Figure 3: Gravimeter on Airport Gravity Base Helicopter in flight
12

Access and travel for most of the Phase 2 survey was in remote mountainous terrain using a Bell 206 helicopter from Sept 12-Sept 17, 2013. A temporary Gravity Base was set up outside High Terrain Helicopter’s hangar at the Cranbrook Airport (Figure 3). The GPS antenna for the survey was connected to the helicopter’s roof on an existing GPS mount behind the main rotor. A fuel cache landing site was set up near the west end of the survey area and a second air-ground Gravity Base was made here by taking gravity readings using both types of gravimeters at different times. Ties between the two systems were excellent, both here and at the Airport Gravity Base.
Both the kinematic GPS and the gravimeter were controlled by an operator in the helicopter using a laptop computer. A set of GPS waypoints was laid out using Google Earth images for reference and downloaded into a separate hand-held GPS unit, and used to select optimum routes to gravity station locations. Each heli-borne gravity reading consisted of travelling to a waypoint and finding a suitably flat location to set the long-line gravimeter on the ground (station location, elevation, terrain, weather, and fuel were all factors to be considered when doing this). After the meter was set on the ground, the rope was slackened and the pilot kept the aircraft hovering. This enabled the meter operator to remotely unlock and level the meter, and take a gravity reading for 3-5 minutes. When the gravity reading was complete, the helicopter hovered directly over the meter with the long-line rope tight. GPS data was collected for 10-20 seconds before the meter was lifted from the ground. 51 stations and five repeat readings were acquired using this method. In addition, 12 new ground stations, and four repeat readings were acquired using land gravimeters during phase 2.
6.5 DATA PROCESSING
After survey completion, the gravity survey contractor provided a file of station records containing station number, GPS location coordinates, Observed Gravity value, and Inner Terrain Correction for each of the 217 new gravity stations. The file also contained data from 17 repeat readings. 30 kilometre Outer Terrain Corrections were calculated for each station using the same 25-metre topography grid data used for the terrain corrections for stations in the 2012 database. Data reduction to Bouguer values were also done in accordance with the 2012 Database. Gravity data records for the 217 new stations have been added to the updated 2013 East Kootenay Gravity Database, available for download with this report.
6.6 MAPPING AND PRELIMINARY INTERPRETATION
The GPS and gravity data for the Airport Base Station was included with the new survey data but lies outside the gravity survey area. However, this location lies within 50 metres of gravity stations from the 1984 digitized Bouguer Anomaly posting map in ARIS 13748 (Section 5.2). The original tie for the 1984 Bouguer map values was a best fit to the Bouguer values from four GSC gravity stations acquired on the same access roads as the 1984 survey. The Bouguer Anomaly value for the Airport Base Station tied to within 0.3 mGal of the adjusted 1984 Bouguer Anomaly values for nearby stations.
Bouguer Anomaly values (density 2.75) for all stations in the updated database were gridded using Surfer 11 in a four-step process to create a final 250 metre Bouguer grid for the Purcell Basin area. The grid had UTM limits: X 526,000-618,000 and Y 5,420,000-5,532,000 covering an area 92 km by 112 km.
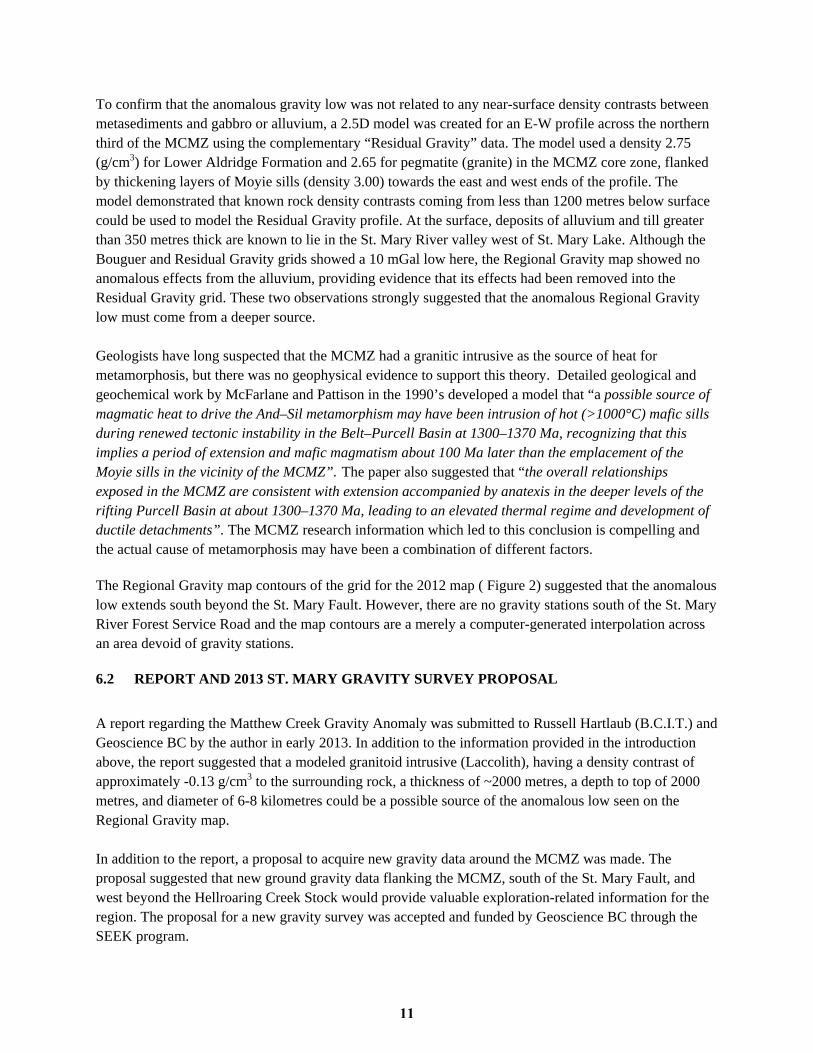
Figure 4 shows the 2012 EKGDB stations for the St. Mary River area, and current coverage using the updated 2013 EKGDB. Both maps are posted on the Southeast BC Geology (Hoy et al- GM-1995-1) for reference.
13
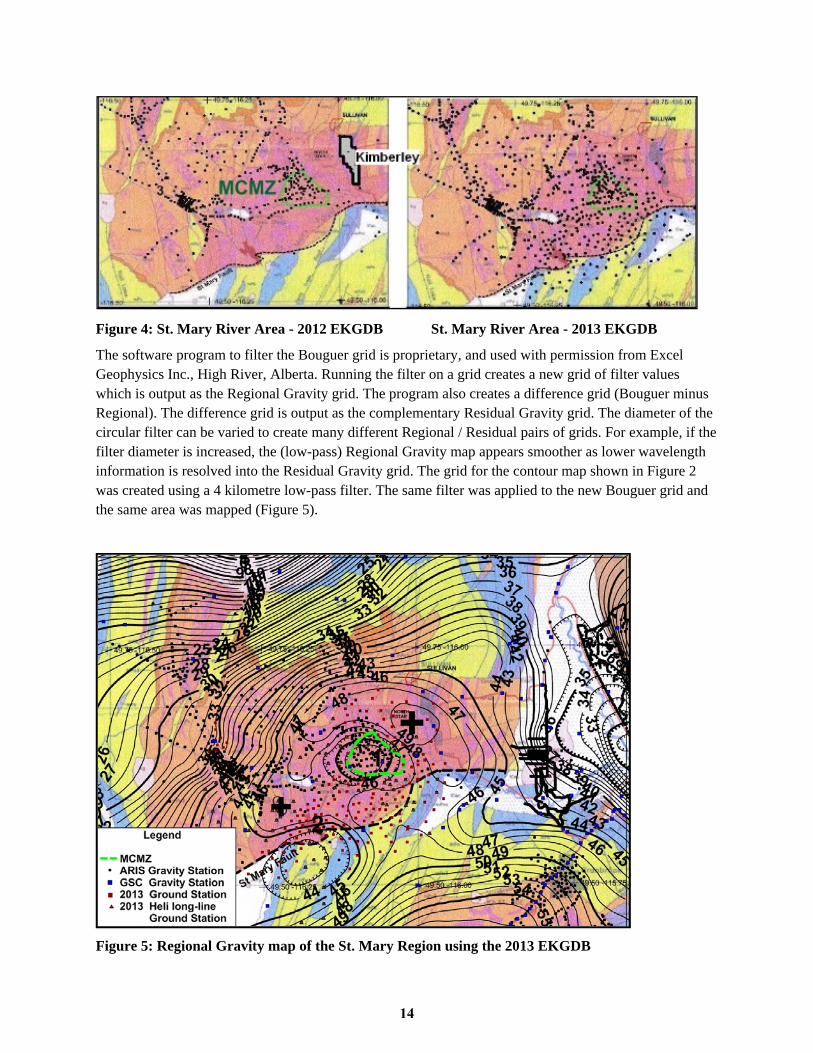
Figure 4: St. Mary River Area - 2012 EKGDB St. Mary River Area - 2013 EKGDB
The software program to filter the Bouguer grid is proprietary, and used with permission from Excel Geophysics Inc., High River, Alberta. Running the filter on a grid creates a new grid of filter values which is output as the Regional Gravity grid. The program also creates a difference grid (Bouguer minus Regional). The difference grid is output as the complementary Residual Gravity grid. The diameter of the circular filter can be varied to create many different Regional / Residual pairs of grids. For example, if the filter diameter is increased, the (low-pass) Regional Gravity map appears smoother as lower wavelength information is resolved into the Residual Gravity grid. The grid for the contour map shown in Figure 2 was created using a 4 kilometre low-pass filter. The same filter was applied to the new Bouguer grid and the same area was mapped (Figure 5).
Figure 5: Regional Gravity map of the St. Mary Region using the 2013 EKGDB
14

The new Regional Gravity contour map (Figure 5) shows a good correlation between the anomalous low and the known outcrop limits of the MCMZ (outlined in green). The map strongly suggests that the source of the Matthew Creek gravity anomaly terminates near the southern limit of the MCMZ. The anomaly amplitude is 4 to 5 mGal. In addition, there is a prominent gravity low centred 15 kilometres southwest the MCMZ, south of the Hellroaring Creek Stock. This low could be a continuation of the low seen running east-west, parallel to and south of the St. Mary Fault, and related to the density contrast between Aldridge and Creston Formation rocks at the Fault. However it appears to be a closed anomaly, 2 mGal in amplitude from a deeper source. The cause could be a deep -sourced intrusive associated with the Cretaceous plutons located along the St. Mary Fault in this area.
The Residual Gravity map for the St. Mary Region (Figure 6) also reveals some interesting new anomalies. In particular, the 3 mGal low around the Hellroaring Creek Stock infers a subsurface pegmatite body 3 km wide and over 4 km long. South of that, the 3 anomalous lows south of the St. Mary Fault are likely related to the Cretaceous plutons that outcrop in the area.
Based on the new maps, the gravity data contractor was requested to model three anomalous lows in the St. Mary Area. Results of the interpretive modeling are included as an appendix in this report.
Figure 6: Residual Gravity map of the St. Mary Region using the 2013 EKGDB
15
6.7 DISCUSSION
The 2103 SEEK gravity survey conducted in the St. Mary Region was primarily intended to confirm two main objectives:
1) To see if the gravity anomaly (only partially constrained due to limited gravity data) seen on a Regional Gravity map (Figure 2) was solely related to the Matthew Creek Metamorphic Zone (MCMZ) and pegmatite stock. This required a complete gravity dataset surrounding the metamorphic zone.
2) Whether the Hellroaring Creek pegmatite stock (12 km to the southwest) had a similar deep-sourced gravity anomaly beneath it or if both stocks were associated with a larger intrusive complex in the area.
The new survey has identified that the source of the Matthew Creek gravity anomaly closely corresponds to the outline for the extent of the MCMZ. The suspected granitoid source of the gravity anomaly may be in part responsible for the domed appearance of the MCMZ. In addition, the new data reveals that there is no deep-sourced anomaly associated with the Hellroaring Creek Stock (HCS).
This information has a link with geologic information suggesting a possible detachment fault along a tectonic boundary above a ductile shear zone in the MCMZ (McFarlane, 1997). Since the HCS has no deep-sourced anomaly associated with it, the new gravity data may suggest that the upper metasediments southwest of the MCMZ have undergone significant relative southwest movement above this low angle fault relative to the MCMZ high strain core zone. Prior to this detachment, the Hellroaring Creek may have been intruded above the level of the detachment in a location very near to, but above, the stratigraphic level of the Matthew Creek Stock.
At this stage, the future exploration implications of these findings are unclear. However, the new SEEK gravity survey has also provided a good set of background data for companies and prospectors with mineral claims in the immediate area. The new dataset was acquired in an area of predominantly Aldridge Formation rock, and thus, has the potential (although remote) of highlighting shallow-sourced density contrasts possibly related to highly mineralized areas. It is therefore hoped that these data will promote a level of additional exploration work in the St. Mary region of the East Kootenays.
7 REFERENCES
Hoy, T., Price, R.A., Legun, A., Grant, B., and Brown, D. (1995): Geoscience Map 1995-1: Purcell Supergroup, Southwestern British Columbia, Geological Compilation Map; BC Ministry of Energy and Mines, BC Geological Survey, Geofile 2007-2, 1 map at 1:250 000 scale, URL < http://www.empr.gov.bc.ca/Mining/Geoscience/PublicationsCatalogue/Maps/GeoscienceMaps/Pages/1995-1.aspx> [October 2013].
McFarlane, C.R.M. (1997): Metamorphism, Structure and Tectonic Evolution of the Matthew Creek Metamorphic Zone, Kimberly, British Columbia, University of Calgary, 400 p.
16
Appendix I: ARIS Survey Specifications and Adjustments
17

Appendix I: ARIS Survey Specifications and Adjustments
ARIS Number: 30170
Project Name: Lone Group Gravity Survey
Project Location: Mause Creek
Month/Year of Survey: August, 2007
Gravity Survey Specs
Gravity Survey Contractor: MEG Systems, Calgary, AB
Gravity Base Station Location: Cranbrook Post Office #9025-1980 (980699.79)
Intermediate Gravity Base Station Location: TBM1_Heritage Motel, Cranbrook - tied to #9025-1980
Intermed. Gravity Base Station Value (mGal): 980697.60 (TBM1)
Gravity Meter(s) Used: Lacoste&Romberg model G-239
Positional Survey Specs
Survey Type / Equipment: GPS / Leica System 500 RT
Positional Control: Established by 15 min. Autonomous Fix
Survey Method: Real-Time and Static Differential
Geodetic Ellipsoid/Datum: WGS84/NAD83
Gravity Data (Listing) Parameters
Number of Stations Acquired: 58
Number of Stations in Listing: 315 (includes 225 stations from ARIS 28454 + 31 from ARIS 29738 + 1 Base(999))
Theoretical Gravity Formula (Latitude Correction): g = 978031.846*(1 + 0.005278895*(sin LAT)^2 + 0.000023462*(sin LAT)^4)
Free-Air Correction: Elevation (ASL) * 0.3086 mGal
Bouguer Correction: Elevation (ASL) * 0.04192 * density (2.45)
Inner Terrain Correction: Hammer zones B, C & D (170m) @ density 2.45
Outer Terrain Correction: 30km (density 2.45)
Density of Bouguer Anomaly values: 2.45
Additional Information
Unique stations for this report are Lines 4_07, 5_07, 6_07, 7_07, 8_07, 9_07
ObsGrav and LatCorr values in listing are rounded to 0.1 mGal
Lat / Long values rounded to 4 decimals in notes, database Lat / Long recalculated from UTM coords.
GPS not tied to Geodetic Control Monuments - Elevation Adjustments made
Latitude Correction formula in report (pdf page 17/53) is incorrect.
No raw ITC data included in report
18
Appendix I: ARIS Survey Specifications and Adjustments
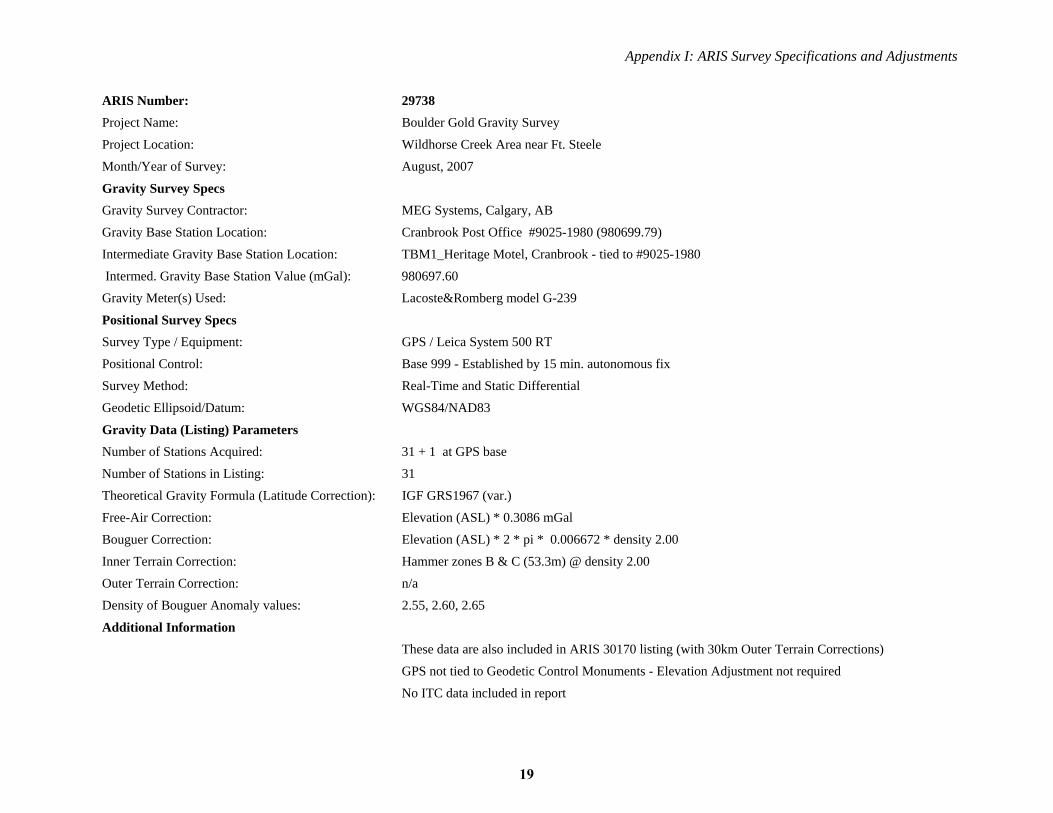
ARIS Number: 29738
Project Name: Boulder Gold Gravity Survey
Project Location: Wildhorse Creek Area near Ft. Steele
Month/Year of Survey: August, 2007
Gravity Survey Specs
Gravity Survey Contractor: MEG Systems, Calgary, AB
Gravity Base Station Location: Cranbrook Post Office #9025-1980 (980699.79)
Intermediate Gravity Base Station Location: TBM1_Heritage Motel, Cranbrook - tied to #9025-1980
Intermed. Gravity Base Station Value (mGal): 980697.60
Gravity Meter(s) Used: Lacoste&Romberg model G-239
Positional Survey Specs
Survey Type / Equipment: GPS / Leica System 500 RT
Positional Control: Base 999 - Established by 15 min. autonomous fix
Survey Method: Real-Time and Static Differential
Geodetic Ellipsoid/Datum: WGS84/NAD83
Gravity Data (Listing) Parameters
Number of Stations Acquired: 31 + 1 at GPS base
Number of Stations in Listing: 31
Theoretical Gravity Formula (Latitude Correction): IGF GRS1967 (var.)
Free-Air Correction: Elevation (ASL) * 0.3086 mGal
Bouguer Correction: Elevation (ASL) * 2 * pi * 0.006672 * density 2.00
Inner Terrain Correction: Hammer zones B & C (53.3m) @ density 2.00
Outer Terrain Correction: n/a
Density of Bouguer Anomaly values: 2.55, 2.60, 2.65
Additional Information
These data are also included in ARIS 30170 listing (with 30km Outer Terrain Corrections)
GPS not tied to Geodetic Control Monuments - Elevation Adjustment not required
No ITC data included in report
19

Appendix I: ARIS Survey Specifications and Adjustments
ARIS Number: 28454
Project Name: Mause Creek/Wildhorse
Project Location: Mause Creek/Wildhorse
Month/Year of Survey: July, 2004 / June, 2005 / December, 2005
Gravity Survey Specs
Gravity Survey Contractor: MEG Systems, Calgary, AB
Gravity Base Station Location: Cranbrook Post Office #9025-1980 (980699.79)
Intermediate Gravity Base Station Location: TBM1_Heritage Motel, Cranbrook - tied to #9025-1980
Intermed. Gravity Base Station Value (mGal): 980697.60
Gravity Meter(s) Used: Lacoste & Romberg model G-
Positional Survey Specs
Survey Type / Equipment: GPS / Leica System 500 RT
Positional Control: Established by Autonomous Fix
Survey Method: Real-Time Kinematic / Static Differential
Geodetic Ellipsoid/Datum: WGS84/NAD83
Gravity Data (Listing) Parameters
Number of Stations Acquired: 96
Number of Stations in Listing: 293 (includes 53 from ARIS 25555)
Theoretical Gravity Formula (Latitude Correction): IGF GRS1967 (var.)
Free-Air Correction: Elevation (ASL) * 0.3086 mGal
Bouguer Correction: Elevation (ASL) * 0.04192 * density (2.45)
Inner Terrain Correction: Hammer zones B, C & D (170m) @ density 2.45
Outer Terrain Correction: 30km @ density 2.45
Density of Bouguer Anomaly values: 2.45
Additional Information
ObsGrav and LatCor values in listing are rounded to 0.1 mGal
GPS not tied to Geodetic Control Monuments - Elevation Adjustments made
Report contains 2 sets of gravity listings - 2nd listing contains data for Lines 9 & 10, Obsgrav was reverse engineered
Data listed as Line 1997 were obtained from ARIS 25555 - key-entry & processing errors were noted
20

Appendix I: ARIS Survey Specifications and Adjustments
Caution: ITC values for L1997 were copied from ARIS 25555 (den 2.67) and processed as density 2.45
No raw ITC data included in report
ARIS Number: 27747
Project Name: Sully Properties Gravity Survey
Project Location: Brewery Creek / Wildhorse River Area
Month/Year of Survey: July, 2004
Gravity Survey Specs
Gravity Survey Contractor: MEG Systems, Calgary, AB
Gravity Base Station Location: Cranbrook Post Office #9025-1980 (980699.79)
Intermediate Gravity Base Station Location: TBM1_Heritage Motel, Cranbrook - tied to #9025-1980
Intermed. Gravity Base Station Value (mGal): 980697.60
Gravity Meter(s) Used: Lacoste&Romberg model G-
Positional Survey Specs
Survey Type / Equipment: n/a
Positional Control: n/a
Survey Method: Static Mode
Geodetic Ellipsoid/Datum: WGS84/NAD83
Gravity Data (Listing) Parameters
Number of Stations Acquired: 144
Number of Stations in Listing: data listing included in ARIS 28454
Theoretical Gravity Formula (Latitude Correction): see ARIS 28454
Free-Air Correction: see ARIS 28454
Bouguer Correction: see ARIS 28454
Inner Terrain Correction: see ARIS 28454
Outer Terrain Correction: see ARIS 28454
Density of Bouguer Anomaly values: see ARIS 28454
Additional Information
21
Appendix I: ARIS Survey Specifications and Adjustments
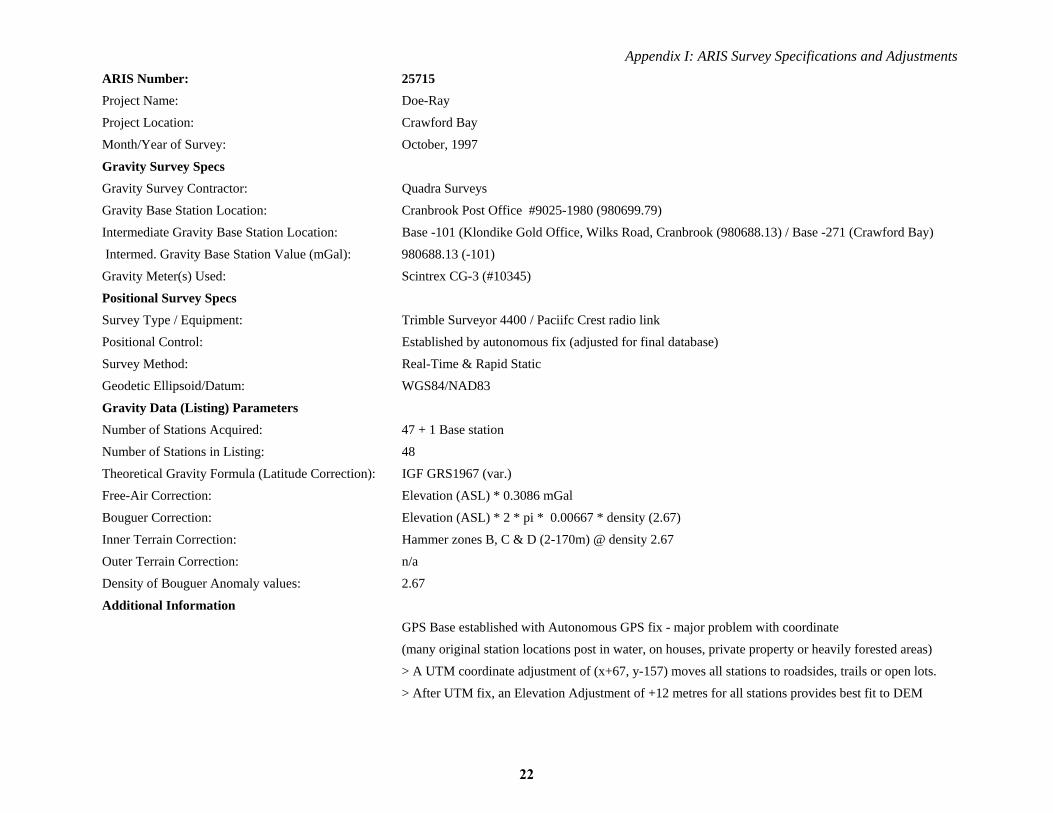
ARIS Number: 25715
Project Name: Doe-Ray
Project Location: Crawford Bay
Month/Year of Survey: October, 1997
Gravity Survey Specs
Gravity Survey Contractor: Quadra Surveys
Gravity Base Station Location: Cranbrook Post Office #9025-1980 (980699.79)
Intermediate Gravity Base Station Location: Base -101 (Klondike Gold Office, Wilks Road, Cranbrook (980688.13) / Base -271 (Crawford Bay)
Intermed. Gravity Base Station Value (mGal): 980688.13 (-101)
Gravity Meter(s) Used: Scintrex CG-3 (#10345)
Positional Survey Specs
Survey Type / Equipment: Trimble Surveyor 4400 / Paciifc Crest radio link
Positional Control: Established by autonomous fix (adjusted for final database)
Survey Method: Real-Time & Rapid Static
Geodetic Ellipsoid/Datum: WGS84/NAD83
Gravity Data (Listing) Parameters
Number of Stations Acquired: 47 + 1 Base station
Number of Stations in Listing: 48
Theoretical Gravity Formula (Latitude Correction): IGF GRS1967 (var.)
Free-Air Correction: Elevation (ASL) * 0.3086 mGal
Bouguer Correction: Elevation (ASL) * 2 * pi * 0.00667 * density (2.67)
Inner Terrain Correction: Hammer zones B, C & D (2-170m) @ density 2.67
Outer Terrain Correction: n/a
Density of Bouguer Anomaly values: 2.67
Additional Information
GPS Base established with Autonomous GPS fix - major problem with coordinate
(many original station locations post in water, on houses, private property or heavily forested areas)
> A UTM coordinate adjustment of (x+67, y-157) moves all stations to roadsides, trails or open lots.
> After UTM fix, an Elevation Adjustment of +12 metres for all stations provides best fit to DEM
22
Appendix I: ARIS Survey Specifications and Adjustments
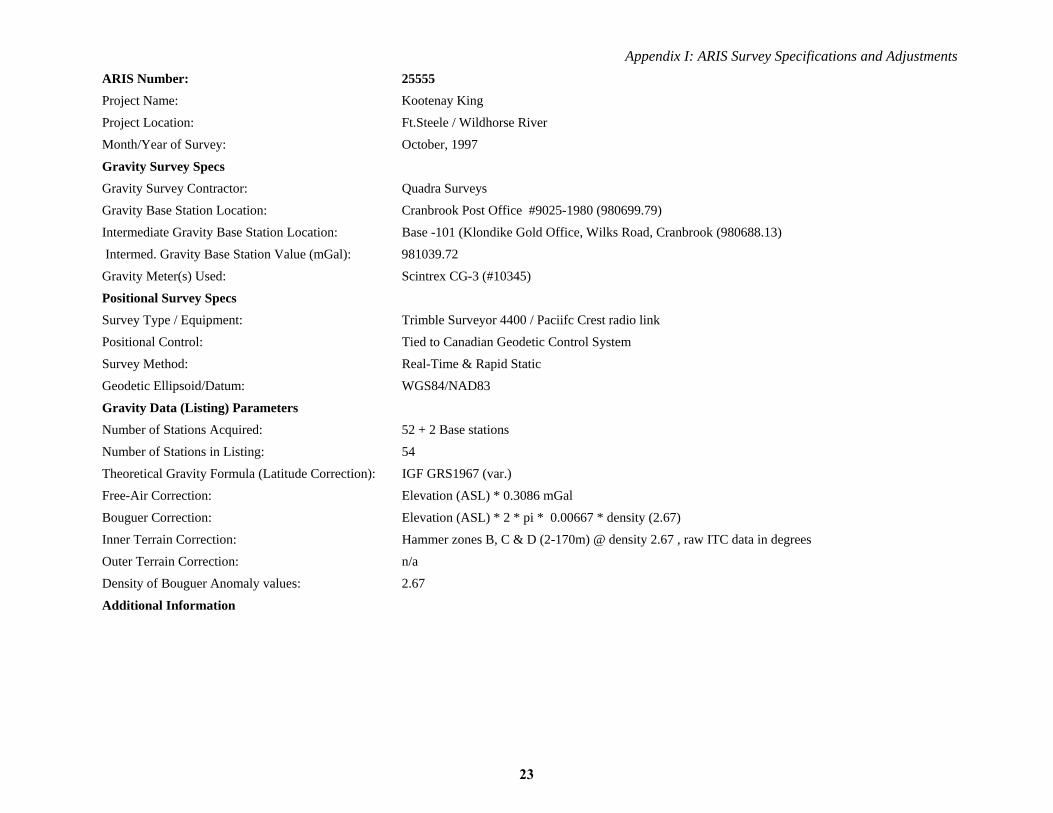
ARIS Number: 25555
Project Name: Kootenay King
Project Location: Ft.Steele / Wildhorse River
Month/Year of Survey: October, 1997
Gravity Survey Specs
Gravity Survey Contractor: Quadra Surveys
Gravity Base Station Location: Cranbrook Post Office #9025-1980 (980699.79)
Intermediate Gravity Base Station Location: Base -101 (Klondike Gold Office, Wilks Road, Cranbrook (980688.13)
Intermed. Gravity Base Station Value (mGal): 981039.72
Gravity Meter(s) Used: Scintrex CG-3 (#10345)
Positional Survey Specs
Survey Type / Equipment: Trimble Surveyor 4400 / Paciifc Crest radio link
Positional Control: Tied to Canadian Geodetic Control System
Survey Method: Real-Time & Rapid Static
Geodetic Ellipsoid/Datum: WGS84/NAD83
Gravity Data (Listing) Parameters
Number of Stations Acquired: 52 + 2 Base stations
Number of Stations in Listing: 54
Theoretical Gravity Formula (Latitude Correction): IGF GRS1967 (var.)
Free-Air Correction: Elevation (ASL) * 0.3086 mGal
Bouguer Correction: Elevation (ASL) * 2 * pi * 0.00667 * density (2.67)
Inner Terrain Correction: Hammer zones B, C & D (2-170m) @ density 2.67 , raw ITC data in degrees
Outer Terrain Correction: n/a
Density of Bouguer Anomaly values: 2.67
Additional Information
23
Appendix I: ARIS Survey Specifications and Adjustments
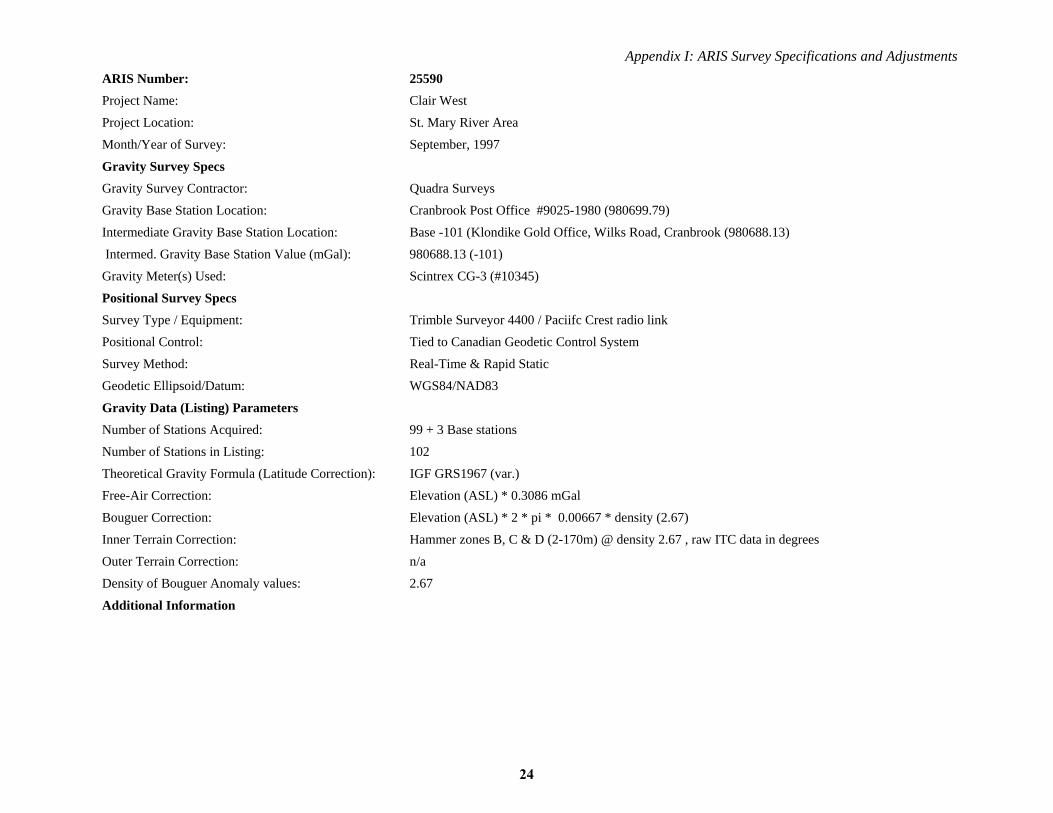
ARIS Number: 25590
Project Name: Clair West
Project Location: St. Mary River Area
Month/Year of Survey: September, 1997
Gravity Survey Specs
Gravity Survey Contractor: Quadra Surveys
Gravity Base Station Location: Cranbrook Post Office #9025-1980 (980699.79)
Intermediate Gravity Base Station Location: Base -101 (Klondike Gold Office, Wilks Road, Cranbrook (980688.13)
Intermed. Gravity Base Station Value (mGal): 980688.13 (-101)
Gravity Meter(s) Used: Scintrex CG-3 (#10345)
Positional Survey Specs
Survey Type / Equipment: Trimble Surveyor 4400 / Paciifc Crest radio link
Positional Control: Tied to Canadian Geodetic Control System
Survey Method: Real-Time & Rapid Static
Geodetic Ellipsoid/Datum: WGS84/NAD83
Gravity Data (Listing) Parameters
Number of Stations Acquired: 99 + 3 Base stations
Number of Stations in Listing: 102
Theoretical Gravity Formula (Latitude Correction): IGF GRS1967 (var.)
Free-Air Correction: Elevation (ASL) * 0.3086 mGal
Bouguer Correction: Elevation (ASL) * 2 * pi * 0.00667 * density (2.67)
Inner Terrain Correction: Hammer zones B, C & D (2-170m) @ density 2.67 , raw ITC data in degrees
Outer Terrain Correction: n/a
Density of Bouguer Anomaly values: 2.67
Additional Information
24
Appendix I: ARIS Survey Specifications and Adjustments
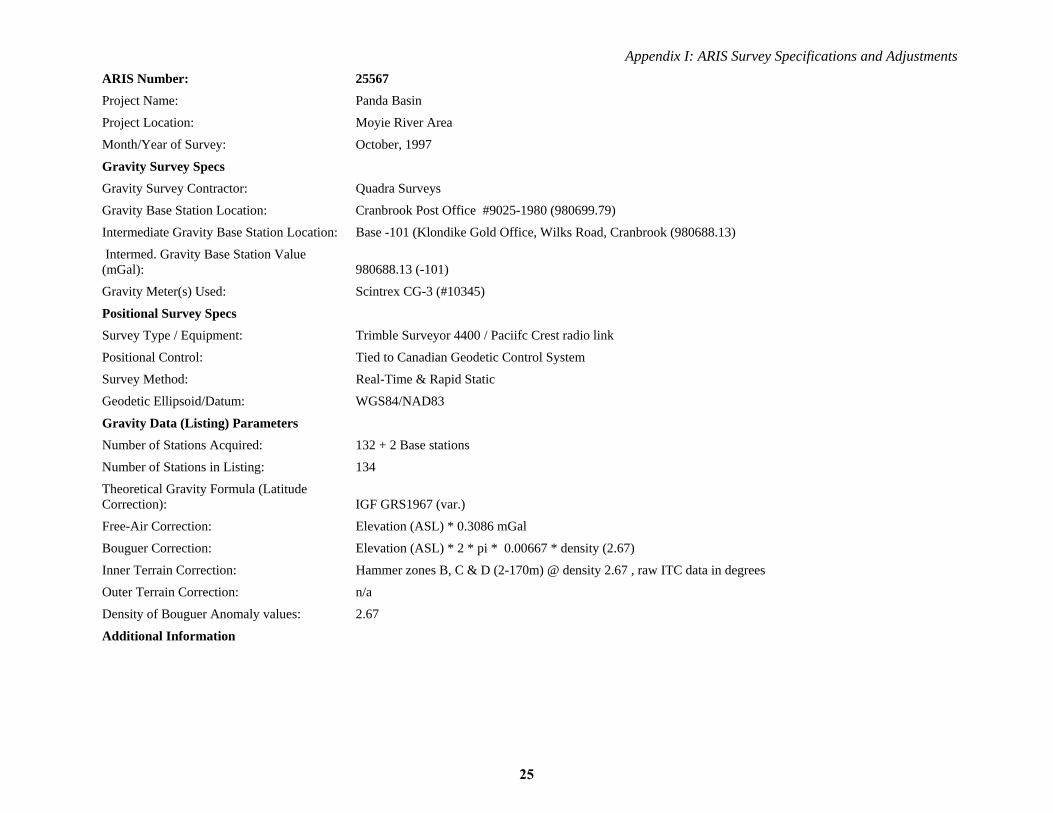
ARIS Number: 25567
Project Name: Panda Basin
Project Location: Moyie River Area
Month/Year of Survey: October, 1997
Gravity Survey Specs
Gravity Survey Contractor: Quadra Surveys
Gravity Base Station Location: Cranbrook Post Office #9025-1980 (980699.79)
Intermediate Gravity Base Station Location: Base -101 (Klondike Gold Office, Wilks Road, Cranbrook (980688.13)
Intermed. Gravity Base Station Value (mGal): 980688.13 (-101)
Gravity Meter(s) Used: Scintrex CG-3 (#10345)
Positional Survey Specs
Survey Type / Equipment: Trimble Surveyor 4400 / Paciifc Crest radio link
Positional Control: Tied to Canadian Geodetic Control System
Survey Method: Real-Time & Rapid Static
Geodetic Ellipsoid/Datum: WGS84/NAD83
Gravity Data (Listing) Parameters
Number of Stations Acquired: 132 + 2 Base stations
Number of Stations in Listing: 134
Theoretical Gravity Formula (Latitude Correction): IGF GRS1967 (var.)
Free-Air Correction: Elevation (ASL) * 0.3086 mGal
Bouguer Correction: Elevation (ASL) * 2 * pi * 0.00667 * density (2.67)
Inner Terrain Correction: Hammer zones B, C & D (2-170m) @ density 2.67 , raw ITC data in degrees
Outer Terrain Correction: n/a
Density of Bouguer Anomaly values: 2.67
Additional Information
25

Appendix I: ARIS Survey Specifications and Adjustments
ARIS Number: 25527
Project Name: Espiritu Claims
Project Location: Cranbrook Area
Month/Year of Survey: October, 1997
Gravity Survey Specs
Gravity Survey Contractor: Quadra Surveys
Gravity Base Station Location: Cranbrook Post Office #9025-1980 (980699.79)
Intermediate Gravity Base Station Location: Base -101 (Klondike Gold Office, Wilks Road, Cranbrook (980688.13)
Intermed. Gravity Base Station Value (mGal): 980688.13 (-101)
Gravity Meter(s) Used: Scintrex CG-3 (#10345)
Positional Survey Specs
Survey Type / Equipment: Trimble Surveyor 4400 / Paciifc Crest radio link
Positional Control: Tied to Canadian Geodetic Control System
Survey Method: Real-Time & Rapid Static
Geodetic Ellipsoid/Datum: WGS84/NAD83
Gravity Data (Listing) Parameters
Number of Stations Acquired: 7 + 1 Base station
Number of Stations in Listing: 8
Theoretical Gravity Formula (Latitude Correction): IGF GRS1967 (var.)
Free-Air Correction: Elevation (ASL) * 0.3086 mGal
Bouguer Correction: Elevation (ASL) * 2 * pi * 0.00667 * density (2.67)
Inner Terrain Correction: Hammer zones B, C & D (2-170m) @ density 2.67 , raw ITC data in degrees
Outer Terrain Correction: n/a
Density of Bouguer Anomaly values: 2.67
Additional Information
26
Appendix I: ARIS Survey Specifications and Adjustments
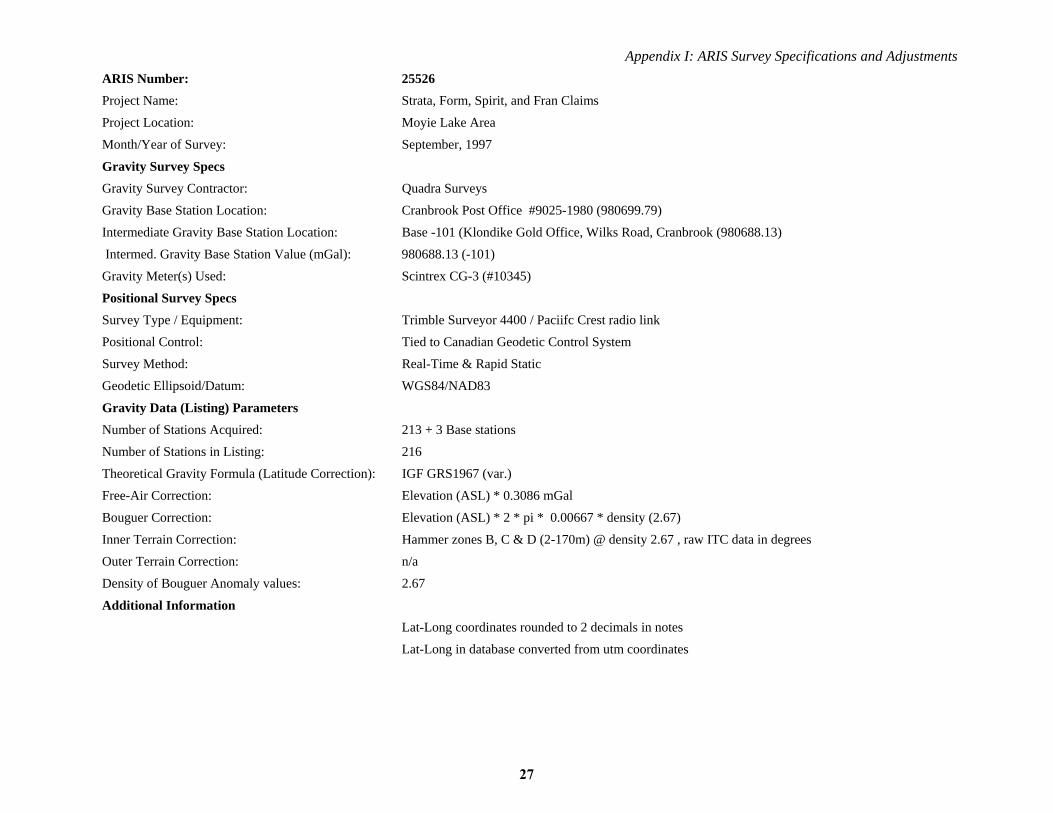
ARIS Number: 25526
Project Name: Strata, Form, Spirit, and Fran Claims
Project Location: Moyie Lake Area
Month/Year of Survey: September, 1997
Gravity Survey Specs
Gravity Survey Contractor: Quadra Surveys
Gravity Base Station Location: Cranbrook Post Office #9025-1980 (980699.79)
Intermediate Gravity Base Station Location: Base -101 (Klondike Gold Office, Wilks Road, Cranbrook (980688.13)
Intermed. Gravity Base Station Value (mGal): 980688.13 (-101)
Gravity Meter(s) Used: Scintrex CG-3 (#10345)
Positional Survey Specs
Survey Type / Equipment: Trimble Surveyor 4400 / Paciifc Crest radio link
Positional Control: Tied to Canadian Geodetic Control System
Survey Method: Real-Time & Rapid Static
Geodetic Ellipsoid/Datum: WGS84/NAD83
Gravity Data (Listing) Parameters
Number of Stations Acquired: 213 + 3 Base stations
Number of Stations in Listing: 216
Theoretical Gravity Formula (Latitude Correction): IGF GRS1967 (var.)
Free-Air Correction: Elevation (ASL) * 0.3086 mGal
Bouguer Correction: Elevation (ASL) * 2 * pi * 0.00667 * density (2.67)
Inner Terrain Correction: Hammer zones B, C & D (2-170m) @ density 2.67 , raw ITC data in degrees
Outer Terrain Correction: n/a
Density of Bouguer Anomaly values: 2.67
Additional Information
Lat-Long coordinates rounded to 2 decimals in notes
Lat-Long in database converted from utm coordinates
27

Appendix I: ARIS Survey Specifications and Adjustments
ARIS Number: 25467
Project Name: Lew & Bingo Claims
Project Location: Moyie River Area
Month/Year of Survey: June, 1997
Gravity Survey Specs
Gravity Survey Contractor: Quadra Surveys
Gravity Base Station Location: Cranbrook Post Office #9025-1980 (980699.79)
Intermediate Gravity Base Station Location: Base -101 (Klondike Gold Office, Wilks Road, Cranbrook (980688.13)
Intermed. Gravity Base Station Value (mGal): 980688.13 (-101)
Gravity Meter(s) Used: Scintrex CG-3 (#10345)
Positional Survey Specs
Survey Type / Equipment: Trimble Surveyor 4400 / Paciifc Crest radio link
Positional Control: Tied to Canadian Geodetic Control System
Survey Method: Real-Time & Rapid Static
Geodetic Ellipsoid/Datum: WGS84/NAD83
Gravity Data (Listing) Parameters
Number of Stations Acquired: 19 + 1 Base station
Number of Stations in Listing: 20
Theoretical Gravity Formula (Latitude Correction): IGF GRS1967 (var.)
Free-Air Correction: Elevation (ASL) * 0.3086 mGal
Bouguer Correction: Elevation (ASL) * 2 * pi * 0.00667 * density (2.67)
Inner Terrain Correction: Hammer zones B, C & D (2-170m) @ density 2.67 , raw ITC data in degrees
Outer Terrain Correction: n/a
Density of Bouguer Anomaly values: 2.67
Additional Information
28
Appendix I: ARIS Survey Specifications and Adjustments
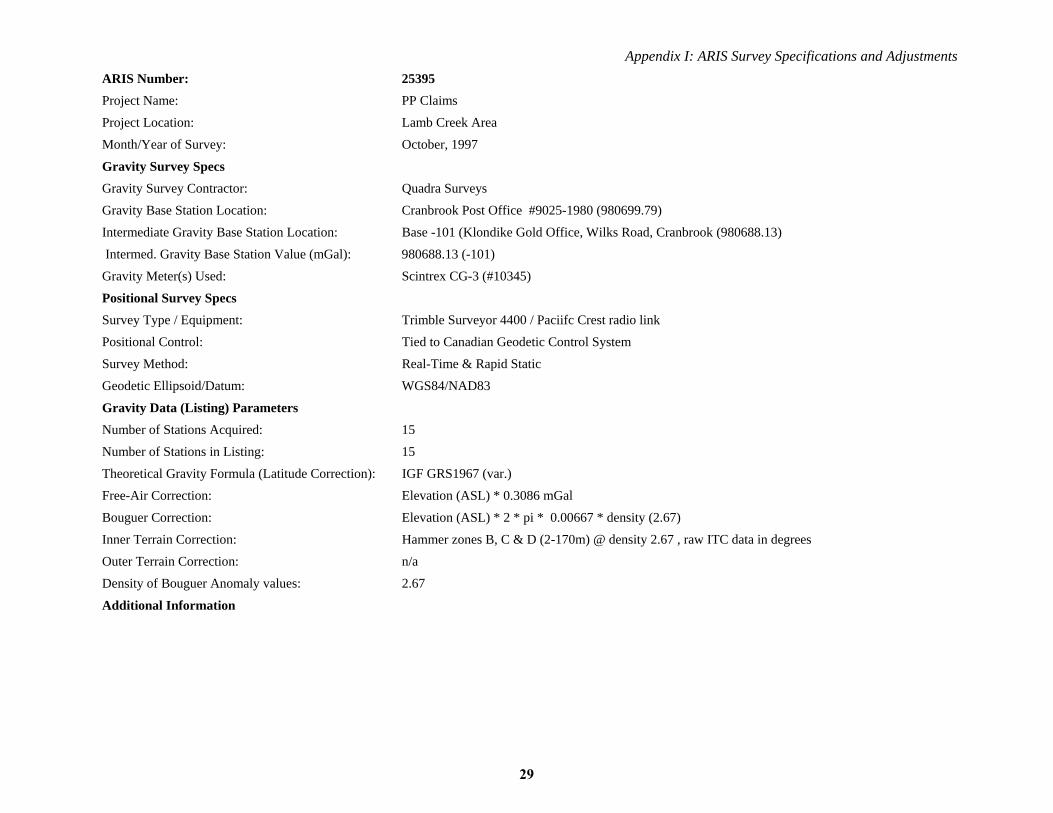
ARIS Number: 25395
Project Name: PP Claims
Project Location: Lamb Creek Area
Month/Year of Survey: October, 1997
Gravity Survey Specs
Gravity Survey Contractor: Quadra Surveys
Gravity Base Station Location: Cranbrook Post Office #9025-1980 (980699.79)
Intermediate Gravity Base Station Location: Base -101 (Klondike Gold Office, Wilks Road, Cranbrook (980688.13)
Intermed. Gravity Base Station Value (mGal): 980688.13 (-101)
Gravity Meter(s) Used: Scintrex CG-3 (#10345)
Positional Survey Specs
Survey Type / Equipment: Trimble Surveyor 4400 / Paciifc Crest radio link
Positional Control: Tied to Canadian Geodetic Control System
Survey Method: Real-Time & Rapid Static
Geodetic Ellipsoid/Datum: WGS84/NAD83
Gravity Data (Listing) Parameters
Number of Stations Acquired: 15
Number of Stations in Listing: 15
Theoretical Gravity Formula (Latitude Correction): IGF GRS1967 (var.)
Free-Air Correction: Elevation (ASL) * 0.3086 mGal
Bouguer Correction: Elevation (ASL) * 2 * pi * 0.00667 * density (2.67)
Inner Terrain Correction: Hammer zones B, C & D (2-170m) @ density 2.67 , raw ITC data in degrees
Outer Terrain Correction: n/a
Density of Bouguer Anomaly values: 2.67
Additional Information
29
Appendix I: ARIS Survey Specifications and Adjustments
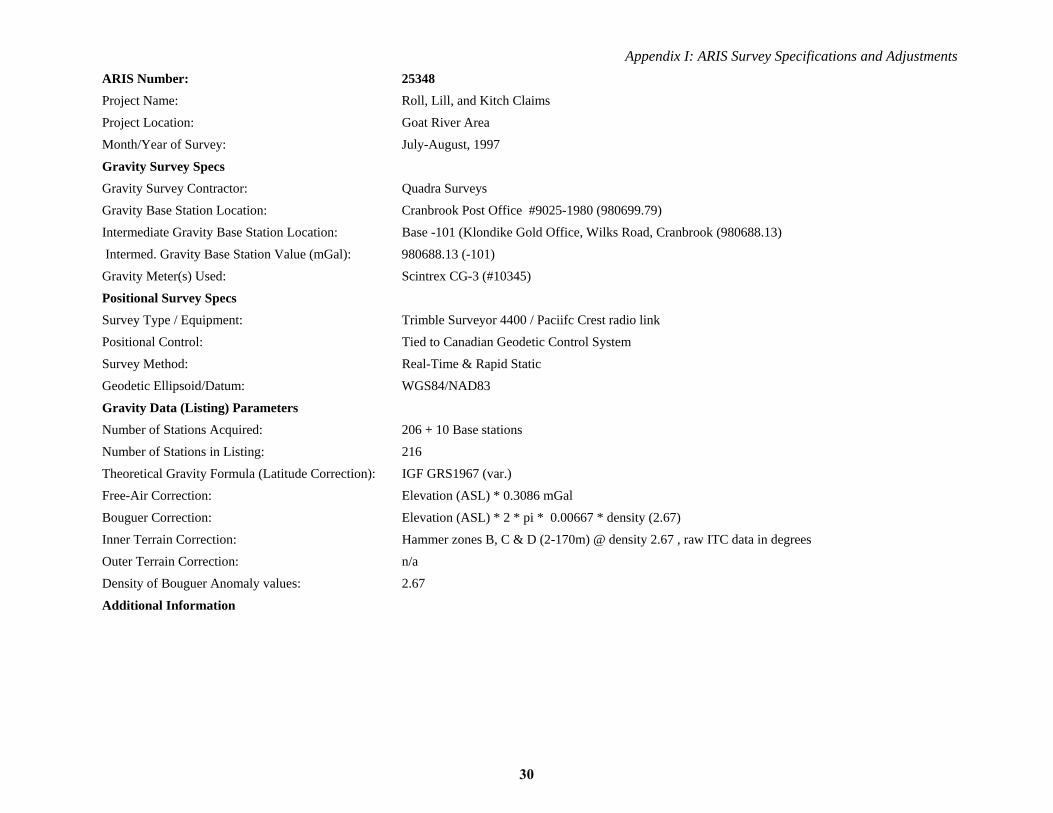
ARIS Number: 25348
Project Name: Roll, Lill, and Kitch Claims
Project Location: Goat River Area
Month/Year of Survey: July-August, 1997
Gravity Survey Specs
Gravity Survey Contractor: Quadra Surveys
Gravity Base Station Location: Cranbrook Post Office #9025-1980 (980699.79)
Intermediate Gravity Base Station Location: Base -101 (Klondike Gold Office, Wilks Road, Cranbrook (980688.13)
Intermed. Gravity Base Station Value (mGal): 980688.13 (-101)
Gravity Meter(s) Used: Scintrex CG-3 (#10345)
Positional Survey Specs
Survey Type / Equipment: Trimble Surveyor 4400 / Paciifc Crest radio link
Positional Control: Tied to Canadian Geodetic Control System
Survey Method: Real-Time & Rapid Static
Geodetic Ellipsoid/Datum: WGS84/NAD83
Gravity Data (Listing) Parameters
Number of Stations Acquired: 206 + 10 Base stations
Number of Stations in Listing: 216
Theoretical Gravity Formula (Latitude Correction): IGF GRS1967 (var.)
Free-Air Correction: Elevation (ASL) * 0.3086 mGal
Bouguer Correction: Elevation (ASL) * 2 * pi * 0.00667 * density (2.67)
Inner Terrain Correction: Hammer zones B, C & D (2-170m) @ density 2.67 , raw ITC data in degrees
Outer Terrain Correction: n/a
Density of Bouguer Anomaly values: 2.67
Additional Information
30

Appendix I: ARIS Survey Specifications and Adjustments
ARIS Number: 25326
Project Name: Pyramid Peak
Project Location: St. Mary River / Pyramid Peak Area
Month/Year of Survey: August, 1997
Gravity Survey Specs
Gravity Survey Contractor: Quadra Surveys
Gravity Base Station Location: Cranbrook Post Office #9025-1980 (980699.79)
Intermediate Gravity Base Station Location: Base -101 (Klondike Gold Office, Wilks Road, Cranbrook (980688.13)
Intermed. Gravity Base Station Value (mGal): 980688.13 (-101)
Gravity Meter(s) Used: Scintrex CG-3 (#10345)
Positional Survey Specs
Survey Type / Equipment: Trimble Surveyor 4400 / Paciifc Crest radio link
Positional Control: Tied to Canadian Geodetic Control System
Survey Method: Real-Time & Rapid Static
Geodetic Ellipsoid/Datum: WGS84/NAD83
Gravity Data (Listing) Parameters
Number of Stations Acquired: 232 + 8 Base stations
Number of Stations in Listing: 240
Theoretical Gravity Formula (Latitude Correction): IGF GRS1967 (var.)
Free-Air Correction: Elevation (ASL) * 0.3086 mGal
Bouguer Correction: Elevation (ASL) * 2 * pi * 0.00667 * density (2.67)
Inner Terrain Correction: Hammer zones B, C & D (2-170m) @ density 2.67 , raw ITC data in degrees
Outer Terrain Correction: n/a
Density of Bouguer Anomaly values: 2.67
Additional Information
31

Appendix I: ARIS Survey Specifications and Adjustments
ARIS Number: 25271
Project Name: Pyramid Peak
Project Location: St. Mary River / Pyramid Peak Area
Month/Year of Survey: August, 1997
Gravity Survey Specs
Gravity Survey Contractor: Quadra Surveys
Gravity Base Station Location: Cranbrook Post Office #9025-1980 (980699.79)
Intermediate Gravity Base Station Location: Base -101 (Klondike Gold Office, Wilks Road, Cranbrook (980688.13)
Intermed. Gravity Base Station Value (mGal): 980688.13 (-101)
Gravity Meter(s) Used: Scintrex CG-3 (#10345)
Positional Survey Specs
Survey Type / Equipment: Trimble Surveyor 4400 / Paciifc Crest radio link
Positional Control: Tied to Canadian Geodetic Control System
Survey Method: Real-Time & Rapid Static
Geodetic Ellipsoid/Datum: WGS84/NAD83
Gravity Data (Listing) Parameters
Number of Stations Acquired: 232 + 8 Base stations
Number of Stations in Listing: 240
Theoretical Gravity Formula (Latitude Correction): IGF GRS1967 (var.)
Free-Air Correction: Elevation (ASL) * 0.3086 mGal
Bouguer Correction: Elevation (ASL) * 2 * pi * 0.00667 * density (2.67)
Inner Terrain Correction: Hammer zones B, C & D (2-170m) @ density 2.67 , raw ITC data in degrees
Outer Terrain Correction: n/a
Density of Bouguer Anomaly values: 2.67
Additional Information
32

Appendix I: ARIS Survey Specifications and Adjustments
ARIS Number: 25217
Project Name: Ham Gravity Survey
Project Location: Matthew Creek Drainage near Kimberley
Month/Year of Survey: August, 1997
Gravity Survey Specs
Gravity Survey Contractor: Quadra Surveys
Gravity Base Station Location: Cranbrook Post Office #9025-1980 (980699.79)
Intermediate Gravity Base Station Location: Base -101 (Klondike Gold Office, Wilks Road, Cranbrook (980688.13)
Intermed. Gravity Base Station Value (mGal): 980688.13 (-101)
Gravity Meter(s) Used: Scintrex CG-3 (#10345)
Positional Survey Specs
Survey Type / Equipment: Trimble Surveyor 4400 / Paciifc Crest radio link
Positional Control: Tied to Canadian Geodetic Marker #543249 (897050)
Survey Method: Real-Time & Rapid Static
Geodetic Ellipsoid/Datum: WGS84/NAD83
Gravity Data (Listing) Parameters
Number of Stations Acquired: 103 + 2 Base stations
Number of Stations in Listing: 105
Theoretical Gravity Formula (Latitude Correction): IGF GRS1967 (var.)
Free-Air Correction: Elevation (ASL) * 0.3086 mGal
Bouguer Correction: Elevation (ASL) * 2 * pi * 0.00667 * density (2.67)
Inner Terrain Correction: Hammer zones B, C & D (2-170m) @ density 2.67 , raw ITC data in degrees
Outer Terrain Correction: n/a
Density of Bouguer Anomaly values: 2.67
Additional Information
Lat-Long coordinates rounded to 2 decimals in notes
Lat-Longs in database converted from original UTM coordinates
Observed Gravity values tied to incorrect Base value. 3.0 mGal added to all Obsgrav values
33
Appendix I: ARIS Survey Specifications and Adjustments
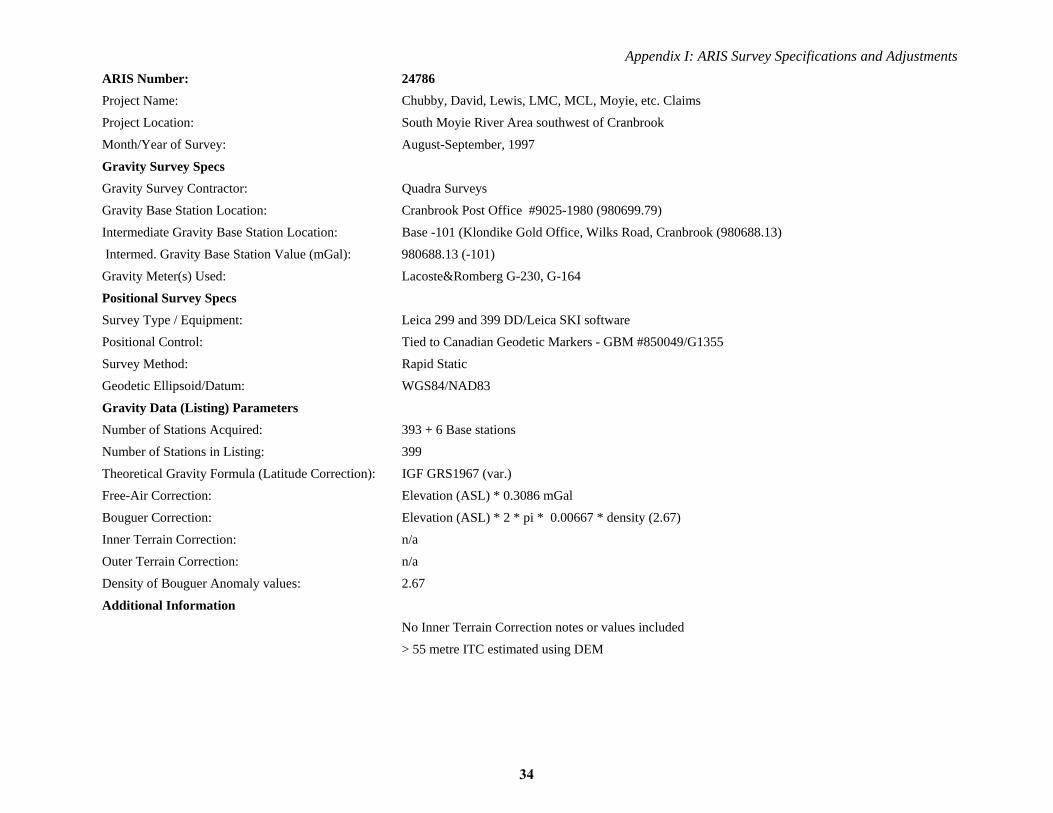
ARIS Number: 24786
Project Name: Chubby, David, Lewis, LMC, MCL, Moyie, etc. Claims
Project Location: South Moyie River Area southwest of Cranbrook
Month/Year of Survey: August-September, 1997
Gravity Survey Specs
Gravity Survey Contractor: Quadra Surveys
Gravity Base Station Location: Cranbrook Post Office #9025-1980 (980699.79)
Intermediate Gravity Base Station Location: Base -101 (Klondike Gold Office, Wilks Road, Cranbrook (980688.13)
Intermed. Gravity Base Station Value (mGal): 980688.13 (-101)
Gravity Meter(s) Used: Lacoste&Romberg G-230, G-164
Positional Survey Specs
Survey Type / Equipment: Leica 299 and 399 DD/Leica SKI software
Positional Control: Tied to Canadian Geodetic Markers - GBM #850049/G1355
Survey Method: Rapid Static
Geodetic Ellipsoid/Datum: WGS84/NAD83
Gravity Data (Listing) Parameters
Number of Stations Acquired: 393 + 6 Base stations
Number of Stations in Listing: 399
Theoretical Gravity Formula (Latitude Correction): IGF GRS1967 (var.)
Free-Air Correction: Elevation (ASL) * 0.3086 mGal
Bouguer Correction: Elevation (ASL) * 2 * pi * 0.00667 * density (2.67)
Inner Terrain Correction: n/a
Outer Terrain Correction: n/a
Density of Bouguer Anomaly values: 2.67
Additional Information
No Inner Terrain Correction notes or values included
> 55 metre ITC estimated using DEM
34
Appendix I: ARIS Survey Specifications and Adjustments
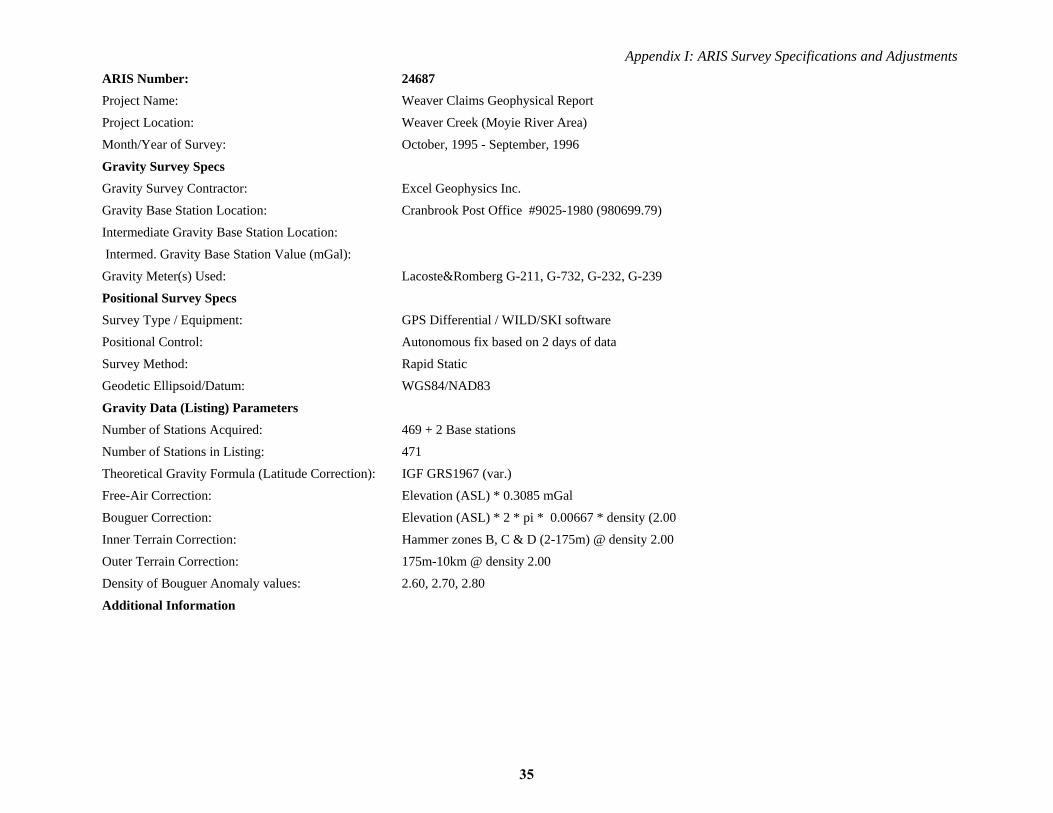
ARIS Number: 24687
Project Name: Weaver Claims Geophysical Report
Project Location: Weaver Creek (Moyie River Area)
Month/Year of Survey: October, 1995 - September, 1996
Gravity Survey Specs
Gravity Survey Contractor: Excel Geophysics Inc.
Gravity Base Station Location: Cranbrook Post Office #9025-1980 (980699.79)
Intermediate Gravity Base Station Location:
Intermed. Gravity Base Station Value (mGal):
Gravity Meter(s) Used: Lacoste&Romberg G-211, G-732, G-232, G-239
Positional Survey Specs
Survey Type / Equipment: GPS Differential / WILD/SKI software
Positional Control: Autonomous fix based on 2 days of data
Survey Method: Rapid Static
Geodetic Ellipsoid/Datum: WGS84/NAD83
Gravity Data (Listing) Parameters
Number of Stations Acquired: 469 + 2 Base stations
Number of Stations in Listing: 471
Theoretical Gravity Formula (Latitude Correction): IGF GRS1967 (var.)
Free-Air Correction: Elevation (ASL) * 0.3085 mGal
Bouguer Correction: Elevation (ASL) * 2 * pi * 0.00667 * density (2.00
Inner Terrain Correction: Hammer zones B, C & D (2-175m) @ density 2.00
Outer Terrain Correction: 175m-10km @ density 2.00
Density of Bouguer Anomaly values: 2.60, 2.70, 2.80
Additional Information
35

Appendix I: ARIS Survey Specifications and Adjustments
ARIS Number: 32911
Project Name: Bootleg Mountain Gravity Survey
Project Location: Bootleg Mountain, near St. Mary Lake
Month/Year of Survey: October, 2011
Gravity Survey Specs
Gravity Survey Contractor: Excel Geophysics Inc.
Gravity Base Station Location: Cranbrook Post Office #9025-1980 (980699.79)
Intermediate Gravity Base Station Location: Super 8 Motel, Cranbrook, BC Base 423 4231 (2010)
Intermed. Gravity Base Station Value (mGal): 980700.65
Gravity Meter(s) Used: Lacoste&Romberg G-472, G-645
Positional Survey Specs
Survey Type / Equipment: Differential GPS / LEICA VIVA
Positional Control: CSRS 89HP3C Pier 3 GPS Pillar, Ft. Steele. CGM 543249 (St. Mary Lake Rd. near Matthew Creek
Survey Method: Static / Rapid Static
Geodetic Ellipsoid/Datum: WGS84/NAD83
Gravity Data (Listing) Parameters
Number of Stations Acquired: 39 + 1 Base station
Number of Stations in Listing: 40
Theoretical Gravity Formula (Latitude Correction): I AG, WGS 1984
Free-Air Correction: Elevation (ASL) * 0.3086 mGal
Bouguer Correction: Elevation (ASL) * 2 * pi * 0.00667 * density 2.67
Inner Terrain Correction: Hammer zones B & C var. (2-50m) @ density 2.67
Outer Terrain Correction: 50m-30km @ density 2.67
Density of Bouguer Anomaly values: 2.75
Additional Information
36

Appendix I: ARIS Survey Specifications and Adjustments
ARIS Number: 32378
Project Name: Ft. Steele Gravity Survey
Project Location: Ft. Steele, B.C.
Month/Year of Survey: October, 2010, April 2011
Gravity Survey Specs
Gravity Survey Contractor: Excel Geophysics Inc.
Gravity Base Station Location: Cranbrook Post Office #9025-1980 (980699.79)
Intermediate Gravity Base Station Location: Super 8 Motel, Cranbrook, BC Base 423 4231 (2010)
Intermed. Gravity Base Station Value (mGal): 980700.65
Gravity Meter(s) Used: Lacoste&Romberg G-472, G-645
Positional Survey Specs
Survey Type / Equipment: Differential GPS / LEICA VIVA
Positional Control: CSRS 89HP3C Pier 3 GPS Pillar, Ft. Steele.
Survey Method: Static / Rapid Static
Geodetic Ellipsoid/Datum: WGS84/NAD83
Gravity Data (Listing) Parameters
Number of Stations Acquired: 813 + 4 Base station
Number of Stations in Listing: 817
Theoretical Gravity Formula (Latitude Correction): IAG, WGS 1984
Free-Air Correction: Elevation (ASL) * 0.3086 mGal
Bouguer Correction: Elevation (ASL) * 2 * pi * 0.00667 * density 2.67
Inner Terrain Correction: Hammer zones B & C var. (2-50m) @ density 2.67
Outer Terrain Correction: 50m-30km @ density 2.67
Density of Bouguer Anomaly values: 2.75
Additional Information
37

Appendix II: 2013 St. Mary Gravity Survey Specifications
38
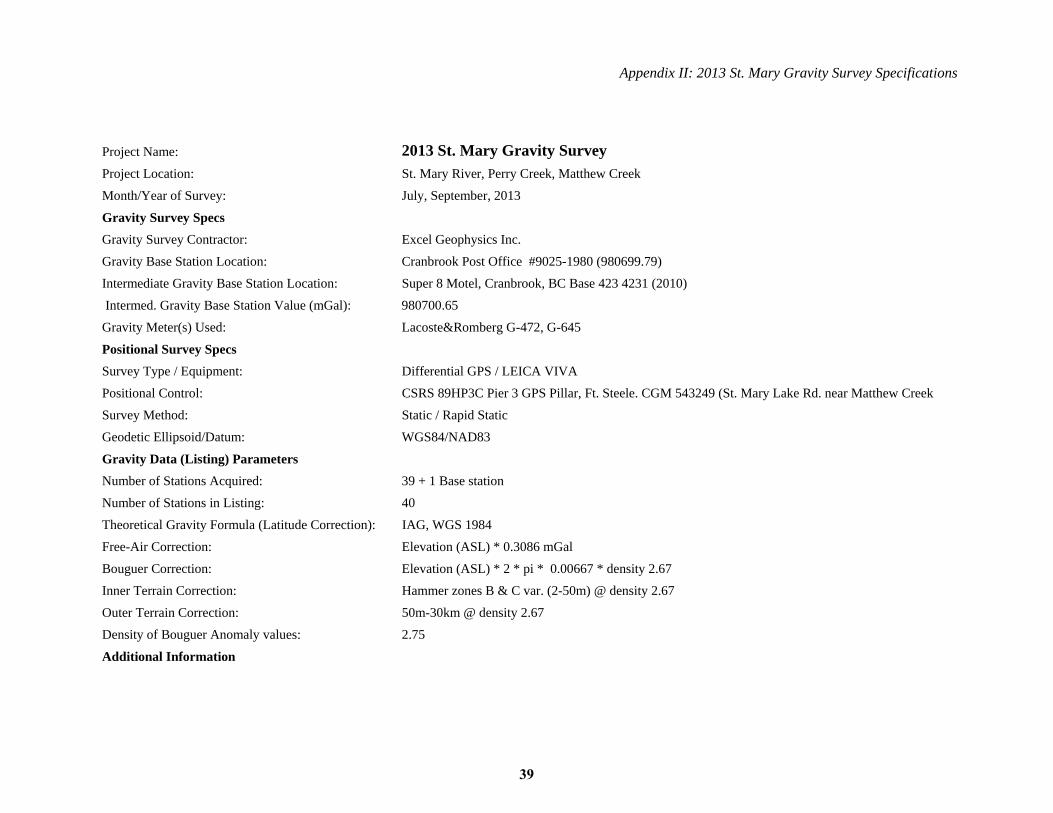
Appendix II: 2013 St. Mary Gravity Survey Specifications
Project Name: 2013 St. Mary Gravity Survey
Project Location: St. Mary River, Perry Creek, Matthew Creek
Month/Year of Survey: July, September, 2013
Gravity Survey Specs
Gravity Survey Contractor: Excel Geophysics Inc.
Gravity Base Station Location: Cranbrook Post Office #9025-1980 (980699.79)
Intermediate Gravity Base Station Location: Super 8 Motel, Cranbrook, BC Base 423 4231 (2010)
Intermed. Gravity Base Station Value (mGal): 980700.65
Gravity Meter(s) Used: Lacoste&Romberg G-472, G-645
Positional Survey Specs
Survey Type / Equipment: Differential GPS / LEICA VIVA
Positional Control: CSRS 89HP3C Pier 3 GPS Pillar, Ft. Steele. CGM 543249 (St. Mary Lake Rd. near Matthew Creek
Survey Method: Static / Rapid Static
Geodetic Ellipsoid/Datum: WGS84/NAD83
Gravity Data (Listing) Parameters
Number of Stations Acquired: 39 + 1 Base station
Number of Stations in Listing: 40
Theoretical Gravity Formula (Latitude Correction): IAG, WGS 1984
Free-Air Correction: Elevation (ASL) * 0.3086 mGal
Bouguer Correction: Elevation (ASL) * 2 * pi * 0.00667 * density 2.67
Inner Terrain Correction: Hammer zones B & C var. (2-50m) @ density 2.67
Outer Terrain Correction: 50m-30km @ density 2.67
Density of Bouguer Anomaly values: 2.75
Additional Information
39
SAINT MARY’S RIVER GRAVITY SURVEY
MODELING AND INTERPRETATION REPORT
CRANBROOK, BRITISH COLUMBIA,
CANADA
Submitted by:
Brian A. Jones (P. Geoph.)
EXCEL GEOPHYSICS INC. Box 5056 High River, Alberta, Canada T1V 1M3 Prepared for: Ted Sanders
40
St Mary’s River Gravity Survey – Modeling and Interpretation Report October 22, 2013
Excel Geophysics Inc. 1
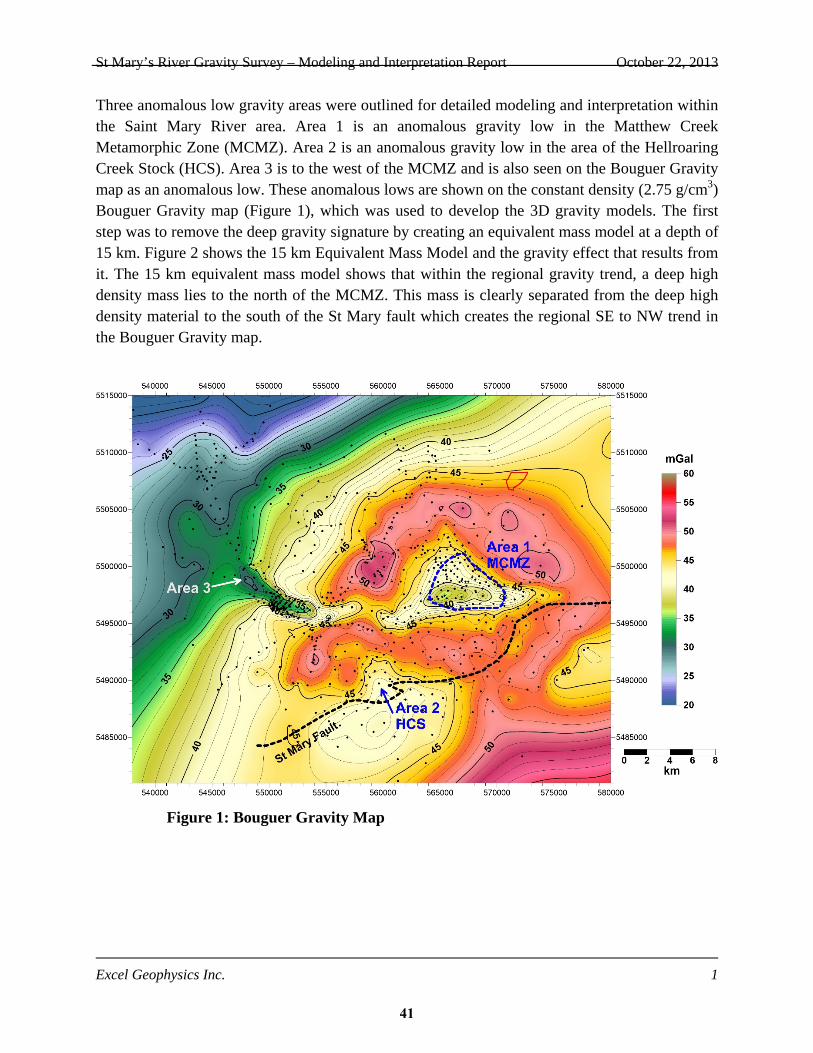
Three anomalous low gravity areas were outlined for detailed modeling and interpretation within the Saint Mary River area. Area 1 is an anomalous gravity low in the Matthew Creek Metamorphic Zone (MCMZ). Area 2 is an anomalous gravity low in the area of the Hellroaring Creek Stock (HCS). Area 3 is to the west of the MCMZ and is also seen on the Bouguer Gravity map as an anomalous low. These anomalous lows are shown on the constant density (2.75 g/cm3) Bouguer Gravity map (Figure 1), which was used to develop the 3D gravity models. The first step was to remove the deep gravity signature by creating an equivalent mass model at a depth of 15 km. Figure 2 shows the 15 km Equivalent Mass Model and the gravity effect that results from it. The 15 km equivalent mass model shows that within the regional gravity trend, a deep high density mass lies to the north of the MCMZ. This mass is clearly separated from the deep high density material to the south of the St Mary fault which creates the regional SE to NW trend in the Bouguer Gravity map.
Figure 1: Bouguer Gravity Map
41

St Mary’s River Gravity Survey – Modeling and Interpretation Report October 22, 2013
Excel Geophysics Inc. 2
Figure 2: 15 km Equivalent Mass Model
A. Equivalent Mass Model. B. Model Gravity Response
42
St Mary’s River Gravity Survey – Modeling and Interpretation Report October 22, 2013
Excel Geophysics Inc. 3
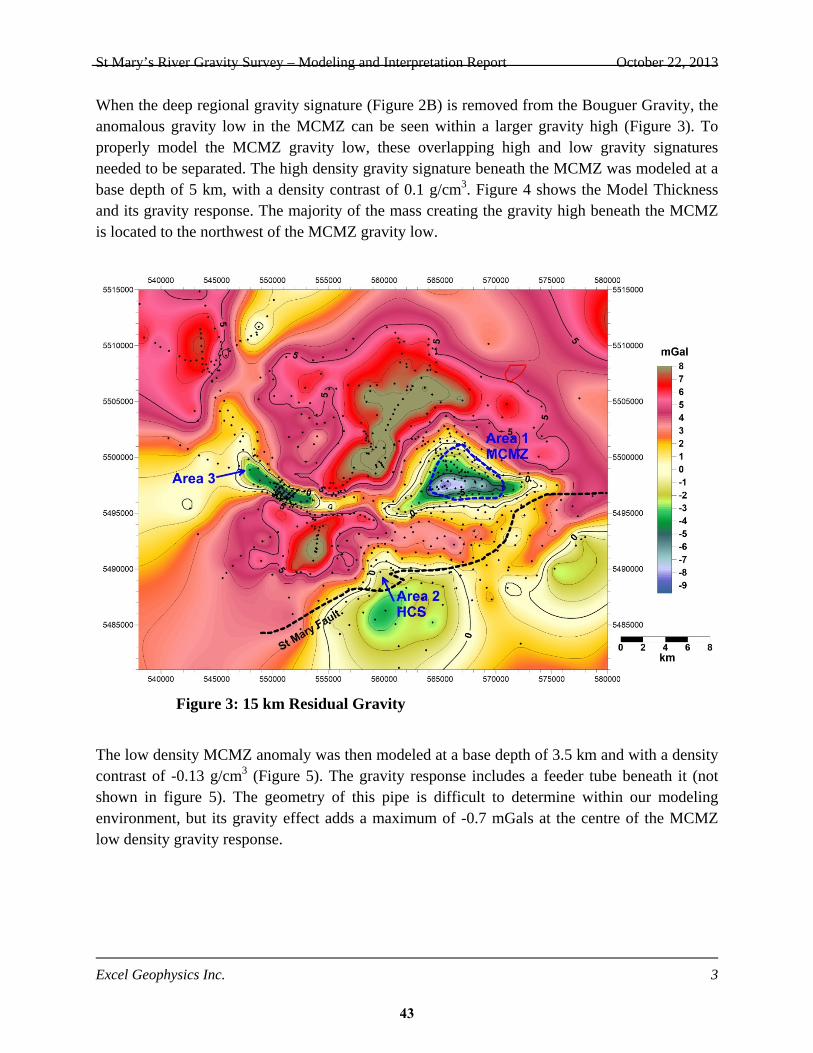
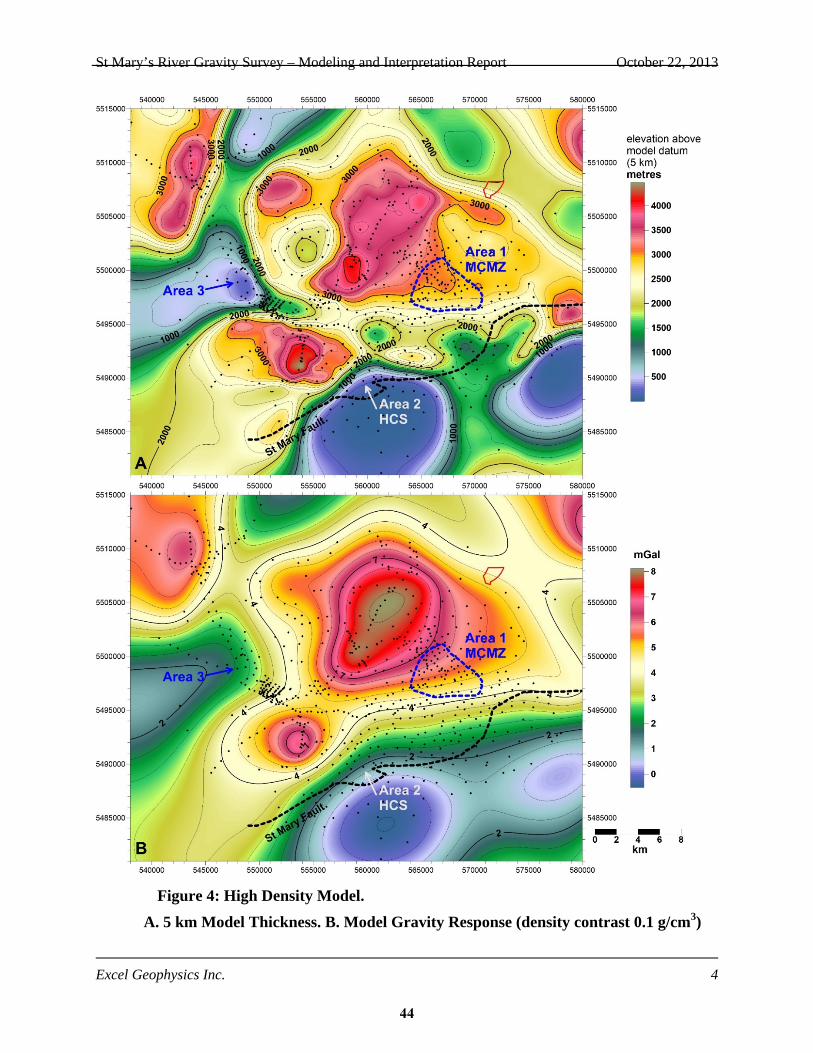
When the deep regional gravity signature (Figure 2B) is removed from the Bouguer Gravity, the anomalous gravity low in the MCMZ can be seen within a larger gravity high (Figure 3). To properly model the MCMZ gravity low, these overlapping high and low gravity signatures needed to be separated. The high density gravity signature beneath the MCMZ was modeled at a base depth of 5 km, with a density contrast of 0.1 g/cm3. Figure 4 shows the Model Thickness and its gravity response. The majority of the mass creating the gravity high beneath the MCMZ is located to the northwest of the MCMZ gravity low.
Figure 3: 15 km Residual Gravity
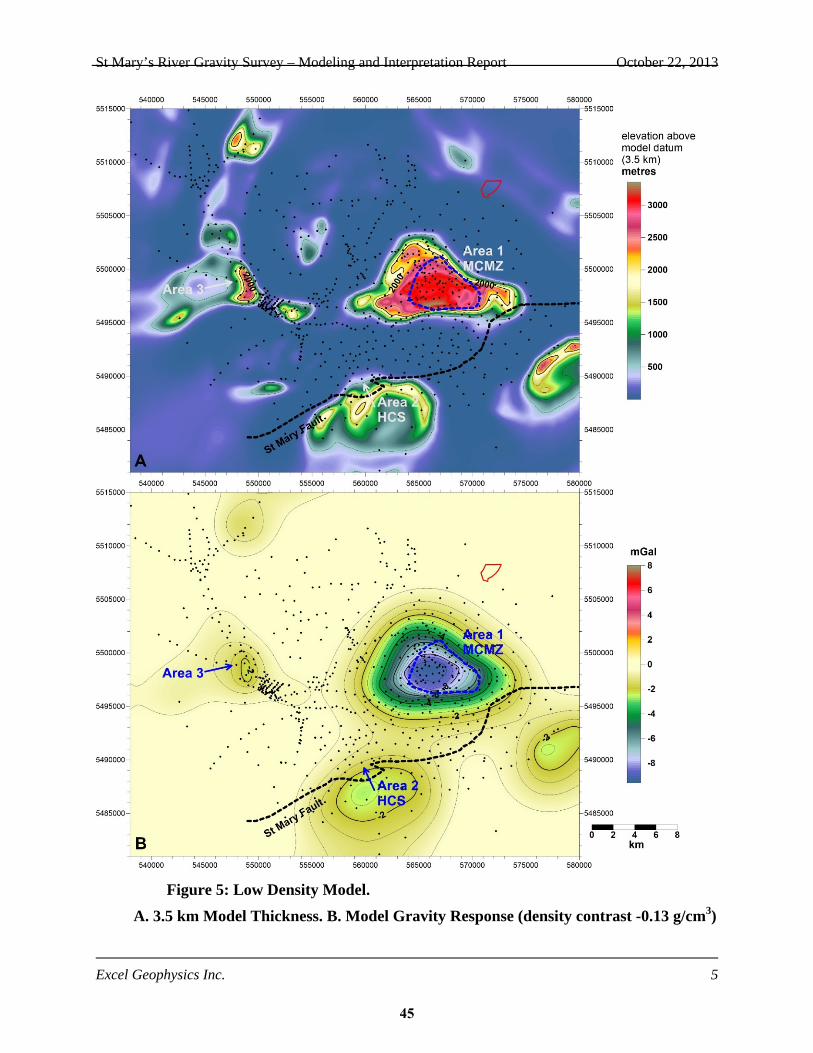
The low density MCMZ anomaly was then modeled at a base depth of 3.5 km and with a density contrast of -0.13 g/cm3 (Figure 5). The gravity response includes a feeder tube beneath it (not shown in figure 5). The geometry of this pipe is difficult to determine within our modeling environment, but its gravity effect adds a maximum of -0.7 mGals at the centre of the MCMZ low density gravity response.
43
St Mary’s River Gravity Survey – Modeling and Interpretation Report October 22, 2013
Excel Geophysics Inc. 4
Figure 4: High Density Model.
A. 5 km Model Thickness. B. Model Gravity Response (density contrast 0.1 g/cm3)
44
St Mary’s River Gravity Survey – Modeling and Interpretation Report October 22, 2013
Excel Geophysics Inc. 5
Figure 5: Low Density Model.
A. 3.5 km Model Thickness. B. Model Gravity Response (density contrast -0.13 g/cm3)
45
St Mary’s River Gravity Survey – Modeling and Interpretation Report October 22, 2013
Excel Geophysics Inc. 6
Figure 5 also clearly shows a low density structure beneath the gravity low in Area 3. This low density structure is of limited lateral extent, and can be modeled as a mass with a base at 3500 m depth.
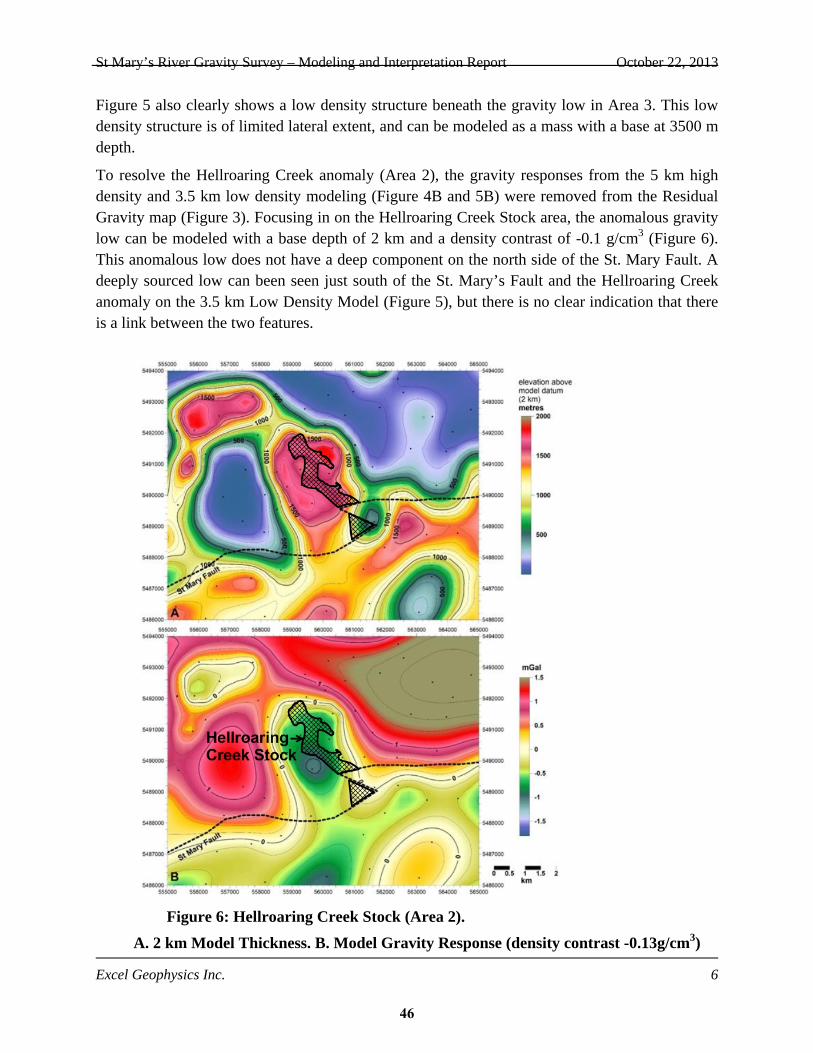
To resolve the Hellroaring Creek anomaly (Area 2), the gravity responses from the 5 km high density and 3.5 km low density modeling (Figure 4B and 5B) were removed from the Residual Gravity map (Figure 3). Focusing in on the Hellroaring Creek Stock area, the anomalous gravity low can be modeled with a base depth of 2 km and a density contrast of -0.1 g/cm3 (Figure 6). This anomalous low does not have a deep component on the north side of the St. Mary Fault. A deeply sourced low can been seen just south of the St. Mary’s Fault and the Hellroaring Creek anomaly on the 3.5 km Low Density Model (Figure 5), but there is no clear indication that there is a link between the two features.
Figure 6: Hellroaring Creek Stock (Area 2).
A. 2 km Model Thickness. B. Model Gravity Response (density contrast -0.13g/cm3)
46

St Mary’s River Gravity Survey – Modeling and Interpretation Report October 22, 2013
Excel Geophysics Inc. 7
47