Still Ahead - Heavy Traffic Ahead · WORC’s mission is to advance the vision of a ... Ridley —...
82
Heavy Traffic Still Ahead Report prepared for WORC Western Organization of Resource Council s February 2014
Transcript of Still Ahead - Heavy Traffic Ahead · WORC’s mission is to advance the vision of a ... Ridley —...

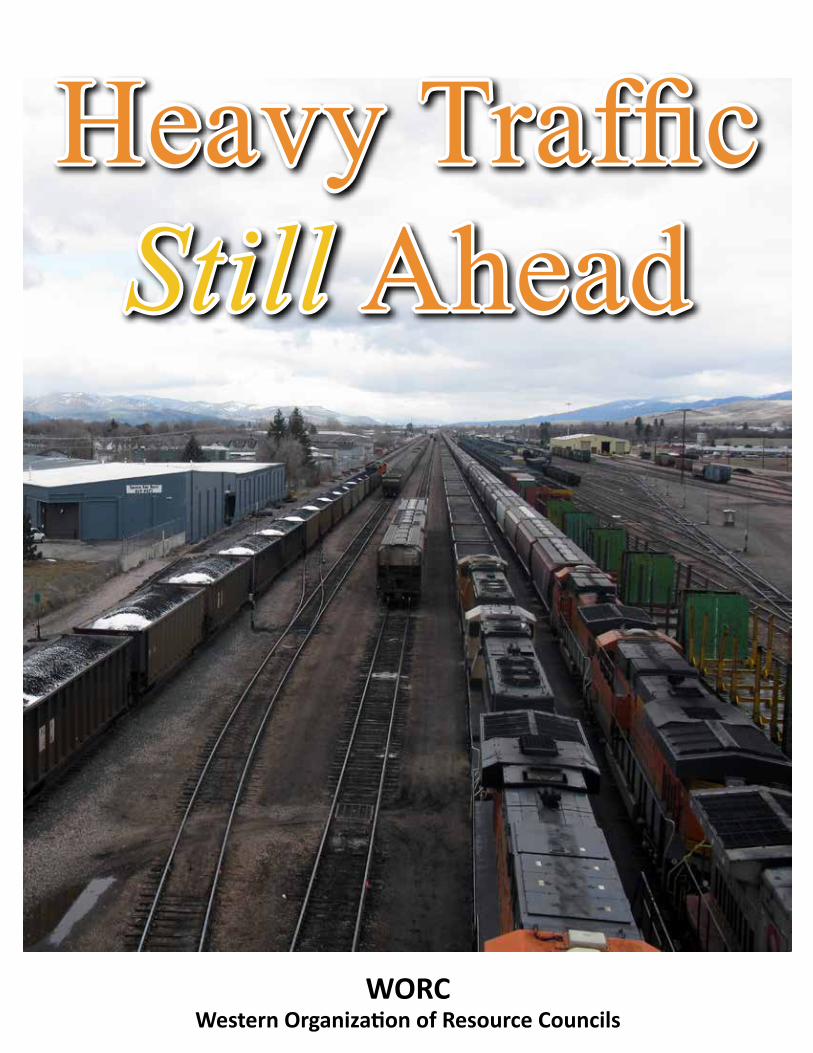
Heavy Traffic Still Ahead
Report prepared for
WORCWestern Organization of Resource Councils
February 2014

WORCWestern Organization of Resource Councils
Heavy Traffic Still Ahead
Heavy Traffic Still Ahead
Prepared For:Western Organization of Resource Councils
220 South 27th StreetBillings, MT 59101
(406) 252-9672
Prepared By:
Terry C. WhitesideWhiteside & Associates
3203 Third Avenue North, Suite 301Billings, Montana 59101
(406) 245-5132
Gerald W. Fauth IIIG. W. Fauth & Associates, Inc.
116 S. Royal StreetAlexandria, VA 22314
(703) 549-6161
Copyright © 2014
Table of ContentsIntroduction 1Executive Summary 4Methodology and Purpose 6Overview 7Updated Potential Annual PRB to PNW Export Coal Tons 10
Recent Related Developments 11Tongue River Railroad 11Cloud Peak & Cherry Point Agreement 11Ambre/Cloud Peak Decker Litigation 11Cloud Peak’s Youngs Creek & Crow Tribe Agreements 12Expansion & Proposed Sale of Ridley Terminals 12BNSF’s Expansion of Bakken Oil Capacity 12Vancouver Washington Oil Terminal 13Lac-Mégantic Train Derailment 13Casselton, North Dakota Explosive Derailment 13
Related Capital Improvement Projects 15BNSF Improvement Projects 15BNSF / WSDOT Agreement 15Other Related Mitigation Projects 18
Proponents 19PRB to PNW Export Coal Transportation Market 21Train Sizes & Trains Per Day 23Current and Proposed PNW Export Coal Terminals 25
Westshore 25Neptune 27Ridley 27Fraser Surrey 28Cherry Point 29Longview 31Morrow 33County Coal Ltd. Terminals 33
Potential Loaded and Empty PRB to PNW Export Coal Trains 352013 PRB to PNW Railroad Export Coal Movements 36Potential 2018 PRB to PNW Railroad Export Coal Movements 37Potential 2023 PRB to PNW Railroad Export Coal Movements 38BNSF’s Bakken Oil Movements to PNW 39Railroad Routes Impacted By Potential PRB to PNW Export Coal Movements 42
BNSF Routing Options 43BNSF/MRL Route Via Helena, Montana 43BNSF Route Via Great Falls, Montana 43BNSF’s Route Via Stevens Pass / Cascade Tunnel 44BNSF’s Route Via Columbia River Gorge 44BNSF’s Route Via Stampede Pass & Tunnel 44
Washington State Rail Plan 45Major Rail Traffic Choke Points & Bottlenecks 47
Huntley (Jones Jct.) to Mossmain (BNSF/MRL — 24.8 Miles) (Billings) 47Sandpoint to Spokane (BNSF — 78.3 Miles) 48
Other Major Rail Congestion Areas 49Spokane to Pasco (BNSF —149.4 miles) 49BNSF’s Directional Routing over the “Iron Triangle” 49
Pasco to Vancouver (Columbia River Gorge) (BNSF — 219.8 Miles) 50Spokane to Everett (Cascade Tunnel) (BNSF — 301.1 Miles) 51Mossmain to Sandpoint (MRL — 564.2 Miles) 52Mossmain to Shelby (BNSF — 322.9 Miles) 52Shelby to Sandpoint (Hi-Line) (BNSF — 337.9 Miles) 53
Impact on Existing Rail Traffic 54Import and Export PNW Intermodal Container Traffic 54PNW Export Grain Traffic 55PNW Passenger & Commuter Traffic 56
Regulatory Review 57Conclusions 59Endnotes 60

List of FiguresFigure 1 7Summary of Potential PRB to PNW Export Coal Movements
Figure 2 8Summary of Potential PRB to PNW Export Coal Trains Per Day
Figure 3 10Potential Annual PRB to PNW Export Coal Tons
Figure 4 14Casselton, North Dakota Oil Train Derailment
Figure 5 17Publicly-Funded Rail Projects in Washington
Figure 6 18Other Related Mitigation Projects in Washington, Montana and Wyoming
Figure 7 22UP Slide Showing Current/Potential Export Coal Flows
Figure 8 23Trains Per Day Based on 125-Car and 150-Car Trains at Various Tonnage Levels
Figure 9 26Potential PRB Coal Tons and Trains to Westshore
Figure 10 28Potential PRB Coal Tons and Trains to Ridley
Figure 11 28Potential PRB Coal Tons and Trains to Frasier Surrey
Figure 12 30Map of Proposed Cherry Point Coal Terminal and Rail Lines
Figure 13 31Potential PRB Coal Tons and Trains to Cherry Point
Figure 14 32Potential PRB Coal Tons and Trains to Longview
Figure 15 32Map of Proposed Longview Coal Terminal
Figure 16 33Potential PRB Coal Tons and Trains to Morrow
Figure 17 34Potential PRB Coal Tons and Trains to County Coal, BC
Figure 18 34Potential PRB Coal Tons and Trains to County Coal, WA
Figure 19 35Potential PRB to PNW Export Coal Trains Per Day Moving in 125-Car and 150-Car Unit Trains
Figure 20 36Estimated 2013 PRB to PNW Railroad Export Coal Movements
Figure 21 37Potential 2018 PRB to PNW Railroad Export Coal Movements

Figure 22 38Potential 2023 PRB to PNW Railroad Export Coal Movements
Figure 23 39North Dakota Crude Oil Production
Figure 24 41Potential Bakken Crude Oil Railroad Movements to the PNW
Figure 25 42BNSF’s PRB to PNW Routes
Figure 26 50Illustration of BNSF’s Directional Routing Over The “Iron Triangle”
Figure 27 55Comparison of BNSF Intermodal Service Goal Hours For Movements To Chicago, IL
Figure 28 55Railroad Shipments of Farm Products - 2010 to PNW Destinations
Figure 29 58Comparison of Potential PRB to PNW Export Coal Volumes With Projected Coal Volumes With DM&E
List of AppendicesAppendix 1 63Responses from MRL and UP to WORC’s Request for Information
Appendix 2 66Railroad Line Segments Impacted by Bakken Crude Oil Shipments to PNW Terminals
Appendix 3 67Railroad Line Segments Impacted by Railroad PRB to PNW Export Coal Movements
Heavy Traffic Still AheadFebruary 2014 1
IntroductionThe Western Organization of Resource Councils (WORC) is a regional network of grassroots
community organizations with 10,000 members and 38 local chapters. WORC member organizations are: Dakota Rural Action; the Dakota Resource Council; the Northern Plains Resource Council; Oregon Rural Action; the Powder River Basin Resource Council; and the Western Colorado Congress. WORC’s mission is to advance the vision of a democratic, sustainable, and just society through community action. WORC is committed to building sustainable environmental and economic communities that balance economic growth with the health of people and stewardship of their land, water, and air resources.
WORC is concerned about the potential impacts associated with the recent and projected significant increases in U.S. coal exports and related railroad shipments. In July, 2012, WORC published “Heavy Traffic Ahead - Rail Impacts of Powder River Basin Coal to Asia By Way of Pacific Northwest Terminals” (HTA 2012), which addressed these issues.1
Heavy Traffic Ahead highlighted the fact that major energy companies, such as Ambre Energy (Ambre), Arch Coal (Arch), Cloud Peak Energy (Cloud Peak) and Peabody Energy (Peabody), and major transportation companies, such as Berkshire Hathaway’s subsidiary BNSF Railway, Inc. (BNSF), Union Pacific Corporation (UP), SSA Marine and others, are actively engaged in projects to move significant volumes of coal from current and proposed mines in the Powder River Basin (PRB) in Montana and Wyoming to existing and proposed Pacific Northwest (PNW) export coal terminals.
These major energy and transportation companies have spent hundreds of millions of dollars and plan to spend hundreds of millions more on a variety of projects to expand the U.S. coal exports market in order to compensate for recent and projected declines in domestic coal markets and to take advantage of the growing Asian coal market.
These companies have encouraged and worked directly with Federal and State authorities to direct and spend hundreds of millions more of public money to improve related privately-owned transportation infrastructure. The State of Washington, for example, plans to spend over $800 million (mostly from Federal grants), on railroad infrastructure improvements, most of which will be directed to improvements of BNSF’s existing infrastructure in Washington to improve passenger rail service, but which will also facilitate potential export coal rail movements.2
Currently, three PNW export terminals, all in British Columbia (BC), handle significant volumes of coal: Westshore Terminals (Westshore) near Roberts Bank, BC, approximately 20 miles south of Vancouver, BC; Neptune Terminal (Neptune) near North Vancouver, BC; and Ridley Terminals (Ridley) in northern BC near Prince Rupert, BC. Historically, these Canadian export coal terminals have handled primarily Canadian metallurgical coal. However, these Canadian export terminals are proposing to significantly expand their coal export capacities, in part to handle growing perceived demand for PRB export steam coal.
These existing Canadian export coal terminals are described in more detail below. In reviewing this report, it should be noted that export coal tons are often expressed in metric “tonnes” in Canada, whereas in the U.S. railroad coal volume is most often expressed in short tons (1 metric tonne equals 2,204.62 lbs – 1 ton, or short ton, equals 2,000 lbs):
Heavy Traffic Still AheadFebruary 2014 2
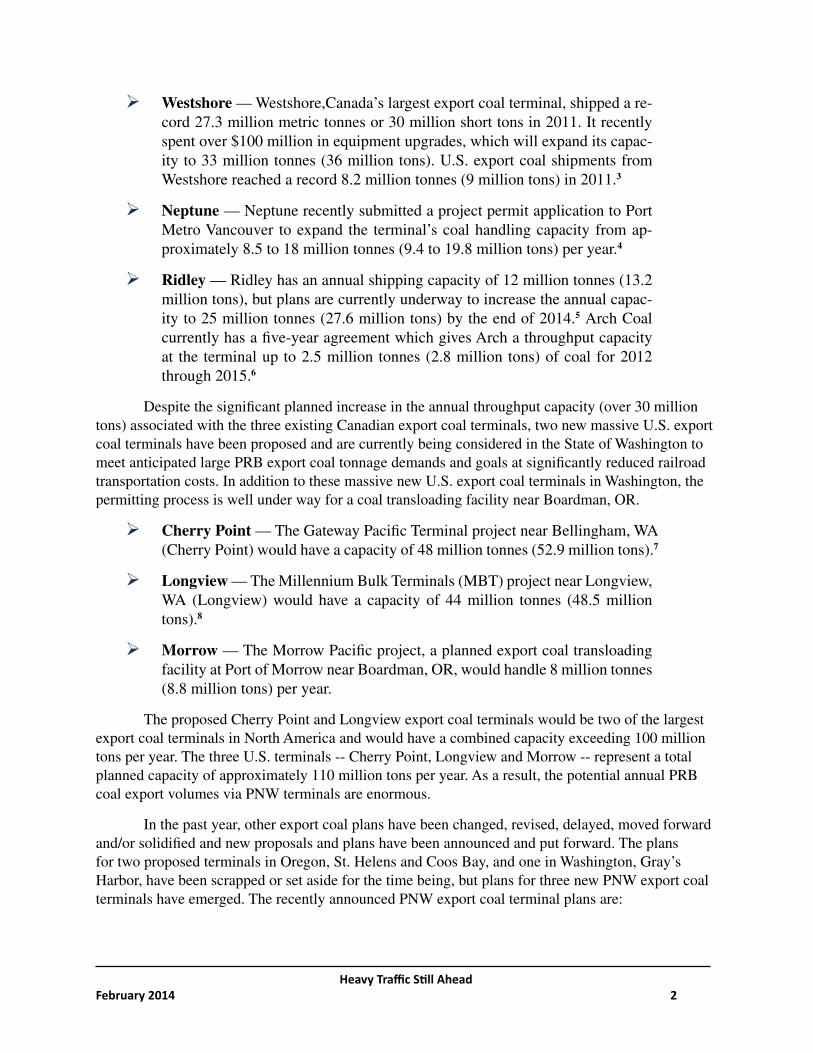
Westshore — Westshore,Canada’s largest export coal terminal, shipped a re-cord 27.3 million metric tonnes or 30 million short tons in 2011. It recently spent over $100 million in equipment upgrades, which will expand its capac-ity to 33 million tonnes (36 million tons). U.S. export coal shipments from Westshore reached a record 8.2 million tonnes (9 million tons) in 2011.3
Neptune — Neptune recently submitted a project permit application to Port Metro Vancouver to expand the terminal’s coal handling capacity from ap-proximately 8.5 to 18 million tonnes (9.4 to 19.8 million tons) per year.4
Ridley — Ridley has an annual shipping capacity of 12 million tonnes (13.2 million tons), but plans are currently underway to increase the annual capac-ity to 25 million tonnes (27.6 million tons) by the end of 2014.5 Arch Coal currently has a five-year agreement which gives Arch a throughput capacity at the terminal up to 2.5 million tonnes (2.8 million tons) of coal for 2012 through 2015.6
Despite the significant planned increase in the annual throughput capacity (over 30 million tons) associated with the three existing Canadian export coal terminals, two new massive U.S. export coal terminals have been proposed and are currently being considered in the State of Washington to meet anticipated large PRB export coal tonnage demands and goals at significantly reduced railroad transportation costs. In addition to these massive new U.S. export coal terminals in Washington, the permitting process is well under way for a coal transloading facility near Boardman, OR.
Cherry Point — The Gateway Pacific Terminal project near Bellingham, WA (Cherry Point) would have a capacity of 48 million tonnes (52.9 million tons).7
Longview — The Millennium Bulk Terminals (MBT) project near Longview, WA (Longview) would have a capacity of 44 million tonnes (48.5 million tons).8
Morrow — The Morrow Pacific project, a planned export coal transloading facility at Port of Morrow near Boardman, OR, would handle 8 million tonnes (8.8 million tons) per year.
The proposed Cherry Point and Longview export coal terminals would be two of the largest export coal terminals in North America and would have a combined capacity exceeding 100 million tons per year. The three U.S. terminals -- Cherry Point, Longview and Morrow -- represent a total planned capacity of approximately 110 million tons per year. As a result, the potential annual PRB coal export volumes via PNW terminals are enormous.
In the past year, other export coal plans have been changed, revised, delayed, moved forward and/or solidified and new proposals and plans have been announced and put forward. The plans for two proposed terminals in Oregon, St. Helens and Coos Bay, and one in Washington, Gray’s Harbor, have been scrapped or set aside for the time being, but plans for three new PNW export coal terminals have emerged. The recently announced PNW export coal terminal plans are:

Heavy Traffic Still AheadFebruary 2014 3
Fraser Surry — A new coal transfer facility has been proposed in the Van-couver, BC near Fraser Surry Docks (Fraser Surry), which would involve moving and transferring coal from trains to barges. They would carry the coal to Texada Island, where it would be unloaded, stored and then trans-ferred to deep-sea vessels for export. The planned volume is 4 million tonnes (4.4 million tons).9
County Coal Ltd. Terminals — An Australian company, County Coal Lim-ited, recently announced that it is in the “process of submitting plans” to construct and build a 20+ million tonne (22+ million tons) capacity facility in British Columbia (County Coal, BC) and a 10+ million tonne (11+ mil-lion tons) facility in the northwest U.S. (County Coal, WA) to handle PRB coal exports (the exact locations have not been disclosed).10
In addition to the changes in the PNW export coal terminal plans within the last year, several recent related developments will likely affect initial and potential PRB to PNW export coal volumes and rail traffic. The involved energy and transportation companies have also come forward with additional information, studies and statements concerning the issue, partly in response to HTA 2012.
This report, “Heavy Traffic Still Ahead” (HTSA 2014), provides an update to HTA 2012 and describes the current picture of the plans for coal production and rail movements from current and proposed PRB mines and origins to existing and proposed PNW export coal terminals. Based on revised plans and additional information that has become available, this report also reevaluates the impacts that would result from railroad transportation of potential PRB to PNW export coal traffic.
This report primarily focuses on potential U.S. export coal traffic from PRB mines in Wyoming and Montana to current and proposed PNW export coal terminals. As a result, the traffic analyses included herein exclude PRB export coal movements to non-PNW terminals (such as PRB export coal movements to Superior, Wisconsin or Gulf Coast posts such as Houston and New Orleans), and non-PRB export coal movements to the PNW (such as Canadian metallurgical and thermal coal movements and potential U.S. coal movements from Utah and Colorado).
This report discusses and analyzes two other groups of rail traffic related to coal exports from the PRB to the Pacific Northwest: (1) potential related non-coal bulk rail movements to Cherry Point and Longview, such as grain products, potash, and calcined petroleum coke; and (2) current and potential railroad shipments of oil from the Bakken area in North Dakota and Montana to the PNW. This rail traffic utilizes or would utilize many of the same rail routes as PRB to PNW export coal traffic.

Heavy Traffic Still AheadFebruary 2014 4
Executive SummaryBNSF’s shortest PRB to PNW railroad route movement is 1,135 miles, but
the potentially impacted area is extremely broad, covering a total rail distance of over 4,000 miles.
Many of the impacted railroad line segments already have significant capacity and congestion issues associated with current rail traffic, such as PNW import and export intermodal container traffic and export grain railroad traffic.
Although there have been significant changes in PNW export terminal plans since July 2012 when HTA was published, potential PRB to PNW export coal volumes remain enormous.
Current PRB to PNW export coal volume has more than doubled since the 2012 edition, from 5 million tons to 11.86 million tons in 2013. The potential 5-year volume has also significantly increased, from 75 million tons to 98.92 million tons. The estimated 10-year potential volume remains approximately the same, at 170 million tons.
The number of PRB to PNW loaded and empty export coal trains per day could be as high as 27 to 36 trains per day in 5 years, and could reach between 47 to 63 trains per day in 10 years, if current coal export proposals come to fruition.
A major bottleneck is BNSF’s 70.5-mile line between Sandpoint, ID, and Spokane, WA, which already has serious capacity issues and would feel the full potential impact of added BNSF PRB to PNW export coal trains. This line is commonly known as “The Funnel,” into which three major BNSF routes to the PNW feed and receive rail traffic. This line currently handles nearly 50 trains per day. In 5 years, 26 to 35 coal trains per day could be added to this line and this level could increase to 45 to 60 coal trains per day in a decade. In addition, this line could see 22 trains per day of loaded and empty Bakken oil trains moving to the PNW. As a result, rail traffic over this important bottle-neck could easily double and exceed its current capacity of approximately 70 trains per day.
The 24.8 mile stretch between Huntley, MT, and Mossmain, MT (which tra-verses Montana’s largest city, Billings) also represents a major bottleneck. Currently, this line handles approximately 18 to 22 trains per day. In 5 years, 23 to 31 coal trains per day could be added to this line and this could increase to 41 to 54 coal trains per day in a decade. In addition, this line could see more than 10 trains per day of loaded and empty Bakken oil trains moving to southern destinations. As a result, total rail traffic through Billings could more than triple in a decade.
Heavy Traffic Still AheadFebruary 2014 5
In addition to creating major rail bottlenecks and choke points, potential loaded and empty PRB to PNW export coal trains would result in more rail congestion over many lines already congested or facing constrained capacity, such as:
• Spokane, WA to Pasco, WA (BNSF — 149.4 miles) • Pasco, WA to Vancouver, WA (Columbia River Gorge) (BNSF — 219.8 miles)• Spokane, WA to Everett, WA (Cascade Tunnel/Stevens Pass) (BNSF — 301.1 miles)• Mossmain, MT to Sandpoint, ID (MRL — 564.2 miles)• Shelby, MT to Sandpoint, ID (Hi-Line) (BNSF — 337.9 miles)• Mossmain, MT to Shelby, MT (BNSF — 322.9 miles)
Compounding the issues of traffic and congestion that would be caused by increased coal shipments on the region’s rail system, potential BNSF railroad movements of Bakken oil from North Dakota to PNW destinations would add up to 22 trains daily.
The Federal government and BNSF have spent hundreds of millions of dollars in upgrading BNSF’s infrastructure, which will help facilitate the movement of coal from the PRB to the PNW, but state and local governments would likely be forced to spend hundreds of millions more in related infrastructure improvements to mitigate the adverse impacts of added coal traffic if the ports are built, such as separated grade crossings, bridges, tunnels and by-passes.
It is likely that hundreds of miles of railroad lines would require expansion from single to double or even triple track if the export coal terminals are built and fully utilized. Other railroad infrastructure, such as bridges, tunnels and high-way crossings, would also need to be replaced or upgraded in order to adequately, efficiently, and safely handle the expected traffic levels.
The voluminous and very profitable PRB to PNW export coal traffic and prof-itable Bakken oil traffic to the PNW would consume most of the existing rail capacity, which would displace traffic and result in higher freight rates for other rail shippers.
A variety of railroad freight shippers would likely be adversely impacted by tightened rail capacity if the export coal terminals are built. Intermodal con-tainer traffic and export grain traffic could experience higher freight rates, deteriorating service and higher equipment costs.
Passenger and commuter rail traffic, including Amtrak’s Empire Builder, which travels through the highly congested “Funnel” between Sandpoint and Spokane, would likely be disrupted by increased rail congestion caused by an increase in export coal trains.
Heavy Traffic Still AheadFebruary 2014 6
Methodology and Purpose The report looks at the potential impact associated with export terminals that are in the formal
application and permitting process, as well as announced expansions and new terminals, in Canada and the United States. Since it is possible that not all the proposed terminals will be built, the report analyzes the impacts on rail traffic if the proposed ports were operated at 75% of their capacity as well as the impacts of operating at full capacity, in 2018 and 2023.
This report updates Heavy Traffic Ahead (2012) and is meant to complement that work, but it does not reproduce all of the information in the earlier report.
This report does not attempt to answer the question of whether or not the proposed export coal projects currently under review or being planned will be built. For example, this report does not attempt to analyze the economics of the export coal market and future demand for U.S. coal. Instead, this report evaluates and analyzes what the impacts would be on affected communities, existing rail traffic, rail capacity, rail infrastructure and other rail shippers if these proposed export coal terminals were built and handle the designed and projected coal volumes proposed by their developers.

Heavy Traffic Still AheadFebruary 2014 7
Overview The PRB to PNW export coal plans described in HTA 2012 have been changed, revised,
delayed, moved forward and/or solidified, and new proposals and plans have been announced and put forward. Although these changes are significant, potential PRB to PNW export coal volumes remain enormous. HTA 2012 estimated that: the current actual (2012) volume was approximately 5 million tons; the potential volume in 5 years (2017) would be approximately 75 million tons; and, by the next decade (2022), the potential volume could reach 170 million tons.11 In the last year, the picture has become much clearer and potential tonnage figures can be refined. The following table (Figure 1) summarizes current calculations of potential PRB to PNW export coal movements:
Figure 1 Summary of Potential PRB to PNW Export Coal Movements
(Millions of Short Tons)
ItemPotential U.S. PRB Coal Tons Per Year To:
2013 2018 2023British Columbia Export Terminals 11.86 18.97 49.07Washington Export Terminals 0.00 76.06 112.43Oregon Export Terminals 0.00 3.89 8.82Total PRB to PNW Export Coal Tons 11.86 98.92 170.32
As can be seen, the current PRB to PNW export coal volume has more than doubled (i.e., from 5 million tons to 11.86 million tons). The estimated 5-year potential volume has also significantly increased (from 75 million tons to 98.92 million tons). The estimated 10-year potential volume remains approximately the same (i.e., 170.0 million tons versus 170.32 million tons). These figures exclude potential PNW exports of Canadian coal from the terminals in British Columbia, which could add over 65 million tons.
These large potential PRB to PNW export coal volumes would result in the addition of many more loaded and empty coal trains per day moving over existing rail routes from the PRB region to the PNW. The estimated numbers of loaded and empty trains per day moving over the impacted rail network are listed in the following table (Figure 2).

Heavy Traffic Still AheadFebruary 2014 8
Figure 2Summary of Potential PRB to PNW Export Coal Trains Per Day
Item 2013 2018 2023 Annual Coal Tons (Millions of Short Tons) 11.86 98.92 170.32 Estimated Tons Per Train (125-Cars Per Train) 14,875 14,875 14,875 Loaded Trains Per Yr. (L.1/L.2) 797 6,650 11,450 Loaded Trains Per Day (L.3/365) 2.18 18.22 31.37 Empty Trains Per Day (L.4x1) 2.18 18.22 31.37 Total Trains Per Day (L.4+L.5) 4.36 36.44 62.74
After the release of HTA 2012,BNSF’s then-CEO Matt Rose made press statements indicating that “only about eight loaded trains daily would pass through the Puget Sound region.”12 Mr. Rose also indicated that “he expects there would be an additional eight to 12 coal-hauling trains — maybe 12 to 16 — running through the Columbia River Gorge to export facilities in the Northwest each day.”13 Mr. Rose’s estimates of 8, 12 or 16 trains per day neglect to include the returning empty coal trains, which would be just as disruptive to communities as loaded trains, and also emit residual coal dust.
Mr. Rose’s estimate of 8 loaded trains per day appears to be based on an annual export coal volume of 50 million tons and the use of 150-car trains. The potential PRB to PNW export coal volumes are significantly higher than 50 million tons per year (i.e. 98.92 to 170.32 million tons per year). Moreover, the average train size is likely to be lower than 150-cars per train, since BNSF current average coal train size is approximately 125-cars per train, and not all PRB coal origins and PNW export coal terminals will have the capacity to handle 150-car trains.
As a result, if planned coal export projects are built, there would be significantly more than eight total loaded and empty trains per day. Based on the projected capacity of the current and proposed export coal terminal capacities and the proposed or estimated time-frames, in 5 years (2018), the potential PRB to PNW loaded and empty export coal traffic could be as high as 36.44 trains per day and, in a mere decade (2023), could reach 62.74 trains per day.
As indicated in HTA 2012, BNSF would likely dominate the PRB to PNW export coal transportation market over its extensive routes in Wyoming, Montana, Idaho, Washington and Oregon, which cover over 4,000 rail miles. BNSF has several available routing options over its extensive rail network. In addition, there would be many different possible origins and destinations. As a result, not all points along BNSF’s impacted routes would feel the full potential adverse impact of up 62.74 trains per day. However, every day these loaded and empty trains (each between 1¼ and 1½ miles long) would be somewhere on the rail network in or between the PRB and PNW areas.
Despite BNSF’s large rail network and available routing options, there is at least one apparent major bottleneck which would likely feel nearly the full potential impact of the proposed increase in export coal traffic: BNSF’s line between Sandpoint, ID, and Spokane, WA, which is the neck of “The Funnel” in Washington and already has serious capacity issues.

Heavy Traffic Still AheadFebruary 2014 9
Several of BNSF’s available routing options involve lines which are already constrained and operating at, near or over capacity. Thus, even the addition of only a few trains would likely result in serious capacity issues over many BNSF lines. This report includes an analysis of the likely impacted line segments and includes estimates of the potential number of loaded and empty trains per day.
The added loaded and empty export coal trains would adversely impact many environmentally sensitive areas, such as the major population centers of Spokane, WA, and Billings, MT, and protected areas such as Glacier National Park. The added trains would likely result in increased traffic accidents (including personal injuries and deaths), blocked automobile and pedestrian traffic, added train and horn noise, and added pollution from coal dust and diesel exhaust.
In addition to potential adverse environmental and safety impacts, the added export coal trains would have significant economic impacts. There would be economic benefits for the coal companies and BNSF in the form of billions of dollars in added annual revenues. Proponents argue that coal exports would create jobs and result in added tax revenue. Proponents’ arguments, however, virtually ignore the potential adverse economic impacts, such as the costs of traffic congestion, health impacts, and the costs of building infrastructure to reduce traffic congestion and safety hazards.
The Federal government and BNSF have spent and plan to spend hundreds of millions of dollars in upgrading BNSF’s infrastructure, which would help facilitate the movement of coal from the PRB to the PNW. If proposed coal export projects are built and result in increased coal traffic, state and local governments would likely be forced to spend hundreds of millions more in related infrastructure improvements to mitigate the adverse impacts, such as the construction of separated grade crossings, bridges, tunnels and by-passes. In most cases the impacted local communities have had little input into the location, design and spending of the planned infrastructure improvements.
Other railroad freight shippers would likely be adversely impacted from the tightening of rail capacity if coal traffic increases. Import and export intermodal container traffic and export grain traffic, which represent the largest railroad traffic groups currently moving to and from the PNW, could be adversely impacted by higher freight rates and a deterioration of service. In fact, there has already been a deterioration of service due to rail maintenance and improvements associated with the potential increase in rail traffic, which appears to have caused serious delays for shippers for the Fall of 2013.
It is simple economics. The cost-efficient, voluminous and very profitable export coal traffic and profitable Bakken oil traffic would consume most of the existing rail capacity. As rail capacity became more constrained and capacity was tightened, the railroad rates charged intermodal and grain shippers for the use of any remaining capacity would likely increase. Moreover, as the rail capacity tightens, many smaller and less profitable rail shippers would likely be displaced off rail to the highways, which would result in more trucks on the highways.
Heavy Traffic Still AheadFebruary 2014 10
Updated Potential Annual PRB to PNW Export Coal Tons
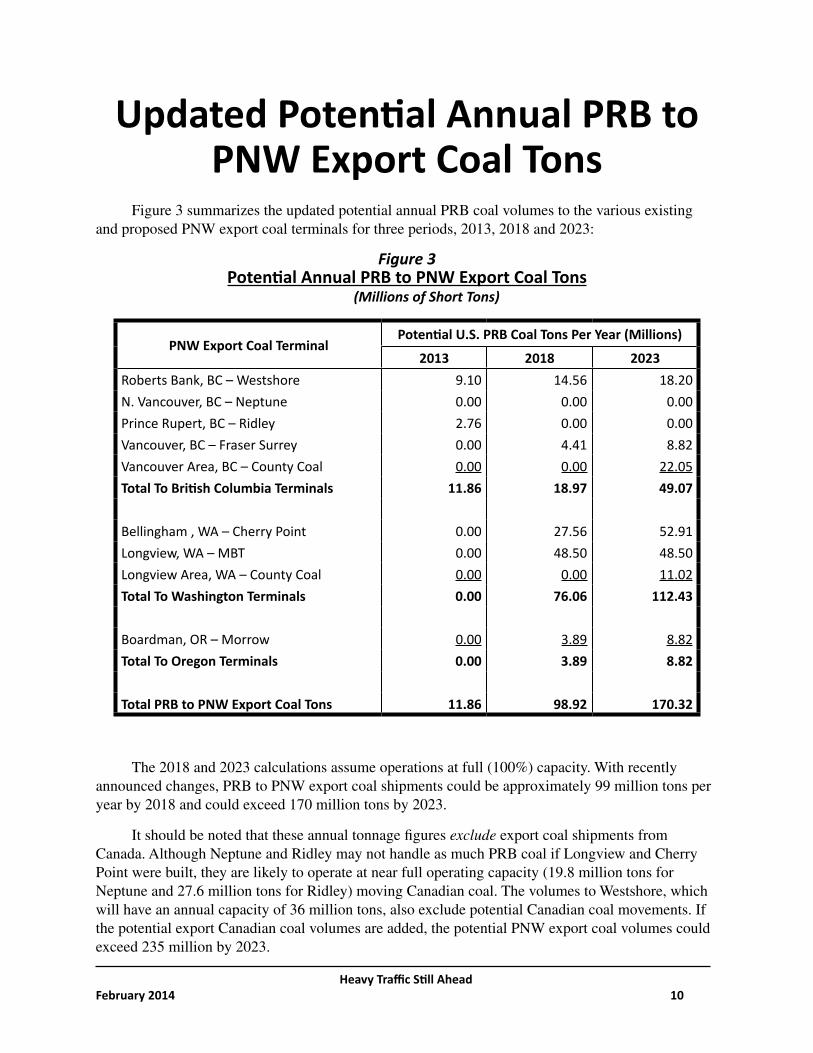
Figure 3 summarizes the updated potential annual PRB coal volumes to the various existing and proposed PNW export coal terminals for three periods, 2013, 2018 and 2023:
Figure 3Potential Annual PRB to PNW Export Coal Tons
(Millions of Short Tons)
PNW Export Coal TerminalPotential U.S. PRB Coal Tons Per Year (Millions)
2013 2018 2023Roberts Bank, BC – Westshore 9.10 14.56 18.20N. Vancouver, BC – Neptune 0.00 0.00 0.00Prince Rupert, BC – Ridley 2.76 0.00 0.00Vancouver, BC – Fraser Surrey 0.00 4.41 8.82Vancouver Area, BC – County Coal 0.00 0.00 22.05Total To British Columbia Terminals 11.86 18.97 49.07
Bellingham , WA – Cherry Point 0.00 27.56 52.91Longview, WA – MBT 0.00 48.50 48.50Longview Area, WA – County Coal 0.00 0.00 11.02Total To Washington Terminals 0.00 76.06 112.43
Boardman, OR – Morrow 0.00 3.89 8.82Total To Oregon Terminals 0.00 3.89 8.82
Total PRB to PNW Export Coal Tons 11.86 98.92 170.32
The 2018 and 2023 calculations assume operations at full (100%) capacity. With recently announced changes, PRB to PNW export coal shipments could be approximately 99 million tons per year by 2018 and could exceed 170 million tons by 2023.
It should be noted that these annual tonnage figures exclude export coal shipments from Canada. Although Neptune and Ridley may not handle as much PRB coal if Longview and Cherry Point were built, they are likely to operate at near full operating capacity (19.8 million tons for Neptune and 27.6 million tons for Ridley) moving Canadian coal. The volumes to Westshore, which will have an annual capacity of 36 million tons, also exclude potential Canadian coal movements. If the potential export Canadian coal volumes are added, the potential PNW export coal volumes could exceed 235 million by 2023.

Heavy Traffic Still AheadFebruary 2014 11
Recent Related DevelopmentsIn addition to changes in plans to build and expand the PNW export coal terminals, there have
been several related developments in the past year which could impact potential PRB to PNW export coal railroad traffic and the affected railroad routes:
Tongue River RailroadOne of the most significant recent developments was the renewal of long-delayed plans for, and
the change in ownership in, the Tongue River Railroad Company, Inc. (TRRC) in Montana. TRRC proposes to construct a new rail line to access a new proposed strip mine in Montana.
TRRC is now co-owned by BNSF, Arch, and candy billionaire and rancher Forrest Mars, Jr.14 On October 16, 2012, TRRC filed a revised application with the U.S. Surface Transportation Board (STB). TRRC first proposed to construct and operate an approximately 83-mile rail line between Miles City, Montana, and two ending points near Ashland, Montana. On December 17, 2012, TRRC filed a supplemental STB application, in which it changed its preferred alignment to the 42-mile Colstrip Alternative, which provides a shorter route to PNW destinations.
After over 30 years in financial and regulatory limbo, the TRRC construction plans have been revived and significantly revised shifting toward the potential PRB to PNW export coal market. BNSF would operate and maintain the Tongue River Railroad. Arch owns the proposed Otter Creek coal mine that TRRC would serve. TRRC estimates that it would originate approximately 20 million tons per year from the Otter Creek mine, but the potential coal volume off the Tongue River Railroad could eventually be double that number.15
In 2011, Arch acquired a 38% interest in the proposed Longview export coal terminal, which would be served by its TRRC partner, BNSF (Ambre owns the remaining 62%).16 Arch’s other PRB mines are Black Thunder and Coal Creek, which are on the southern end of the BNSF/UP “joint-line” in Wyoming and would involve a greater distance to Longview and other PNW terminals.17
Cloud Peak & Cherry Point AgreementIn February 2013, Cloud Peak, which owns and operates the Spring Creek Mine in Montana
and other PRB coal assets, announced an agreement with SSA Marine to ship 16 million tonnes per year (17.6 million tons) from the proposed Cherry Point terminal.18 Peabody was Cherry Point’s first customer and had already reached an agreement to move up to 24 million tonnes (26.5 million tons). As a result, over 44 million tons are already committed to Cherry Point.
Ambre/Cloud Peak Decker LitigationAmbre is an Australian company founded in 2005 by a Polish geologist named Edek Choros.19
Ambre owns 62% of the capacity of the proposed Longview terminal (Arch owns the remaining 38%) and 100% of the proposed Morrow facility. Ambre’s export coal capacity through these proposed terminals, if built, would represent a total of 38.9 million tons per year.
Heavy Traffic Still AheadFebruary 2014 12
Ambre also owns 50% of the Decker mine in Montana with Cloud Peak, one of the largest U.S. PRB coal producers. Decker’s production has fallen in recent years (down to 2.8 million tons in 2012), but it is capable of producing over 10 million tons per year.20 In July 2012, Cloud Peak sued Ambre (the mine’s manager) alleging that Ambre’s export plans for the Decker Mine were developed without Cloud Peak’s approval and asking the court to remove Ambre as the mine’s manager. Cloud Peak alleged that Ambre has engaged in “various self-dealing transactions” designed to give Ambre a “disproportionate share” of profits on Asian sales.21 Cloud Peak had planned on closing Decker, but Ambre plans on expanding production and claims there are 152 million tons of remaining reserves.22 Ambre claims in a countersuit that Cloud Peak is trying to close Decker in order to eliminate competition for its nearby Spring Creek Mine, which has increased production in recent years in part due to more coal exports to Asia.
In December, 2012, Ambre and Cloud Peak announced an agreement to settle the litigation regarding Decker, under which Ambre would acquire Cloud Peak’s 50% interest in Decker and Ambre would give Cloud Peak 5 million tonnes of capacity (5.5 million tons) at Longview. In May, 2013, the parties announced they were renegotiating the agreement, but, to date, a final settlement has not been reached.23 This agreement would leave approximately 15.6 million tons in remaining capacity at Longview (total proposed capacity at Longview is 48.5 million tons per year).
Cloud Peak’s Youngs Creek & Crow Tribe AgreementsIn July 2012, Cloud Peak announced its acquisition of Youngs Creek Mining Company (Youngs
Creek) and related assets, including 450 million tons of coal reserves, for $300 million.24 Youngs Creek, a permitted but undeveloped surface mine, lies north of Sheridan, WY, close to the Montana border. A few weeks later, Cloud Peak announced an agreement with the Crow Tribe of Indians involving coal exploration rights and an option to lease an estimated 1.4 billion tons of coal reserves in Montana. Colin Marshall, CEO of Cloud Peak, stated: “The significant coal and surface assets we acquired position Cloud Peak Energy well for future growth in our Asian exports as additional terminal capacity becomes available.”25 The proposed Youngs Creek mine’s production has been estimated to be 15 million tons per year.26
Expansion & Proposed Sale of Ridley TerminalsThe Ridley terminal at Prince Rupert, BC, is currently undergoing a major capacity upgrade
and will soon be able to handle 27.6 million tons of coal per year.27 Currently, because of its remote location and long railroad distance to the PRB, it is unlikely that much PRB coal would move via Ridley, especially if Cherry Point and Longview are approved. If either the Cherry Point or Longview permits are denied or even delayed, however, Ridley and Westshore could become options, which could attract a PRB coal company as a buyer of Ridley.
BNSF’s Expansion of Bakken Oil CapacityIn September, 2012, BNSF announced that it had increased capacity in 2012 to enable the
railroad to haul one million barrels per day (365 million barrels per year) out of the Williston Basin in North Dakota and Montana. BNSF indicates that it “has been hauling Bakken crude out of the Williston Basin area for over five years. In that time, we have seen the volume increase nearly 7,000

Heavy Traffic Still AheadFebruary 2014 13
percent, from 1.3 million barrels in 2008 to 88.9 million in 2012.” 28 At an average of 70,000 barrels per train, BNSF’s 1 million barrel per day capacity would equal 14.29 loaded and 14.29 empty trains per day or 28.58 total trains per day. In addition, there is a significant amount of related in-bound traffic, such as frac sand. BNSF states that it “ships more than 15 million tons of sand and construction products for drilling every year.”29
A significant amount of this Bakken oil railroad traffic currently moves over the same BNSF rail lines which would be impacted by the increase in PRB to PNW export coal movements and, with the completion of the proposed Vancouver, Washington oil terminal, even greater amounts would move over these lines to the PNW.
Vancouver Washington Oil TerminalIn July 2013, Port of Vancouver commissioners approved leasing land for a crude oil terminal
along the Columbia River northwest of Vancouver. The proposal by Tesoro Corp. and Savage Companies calls for investing up to $100 million in a 42-acre terminal that would handle as much as 360,000 barrels of crude oil per day, which would arrive by rail from the Bakken area in North Dakota and Montana and be stored in large tanks before being loaded aboard ships and barges for trips to West Coast oil refineries. U.S. law currently prohibits crude oil from being exported.30 BNSF indicates that the average oil unit train carries about 70,000 barrels of crude, which, at 360,000 barrels of crude per day, would equal 5.14 loaded and 5.14 empty trains per day for the Tesoro-Savage proposal (in addition to other Bakken oil trains moving to other PNW destinations) moving along most of the same rail routes which would be used to move PRB export coal to the PNW terminals, including along the Columbia River Gorge.
Lac-Mégantic Train DerailmentOn July 6, 2013, a 73-car train transporting Bakken crude oil from North Dakota derailed
and exploded killing 47 people in Lac-Mégantic, Quebec. The accident remains under investigation by Canadian authorities, but it raised serious questions regarding the rail transportation of Bakken crude and will likely impact the handling and routing of Bakken oil shipments to Vancouver and other PNW destinations, which would move over many of the same congested lines as export coal shipments to the PNW.31 A similar derailment of a Bakken oil train, such as a derailment along the Columbia River Gorge, could cause significant environmental damage.
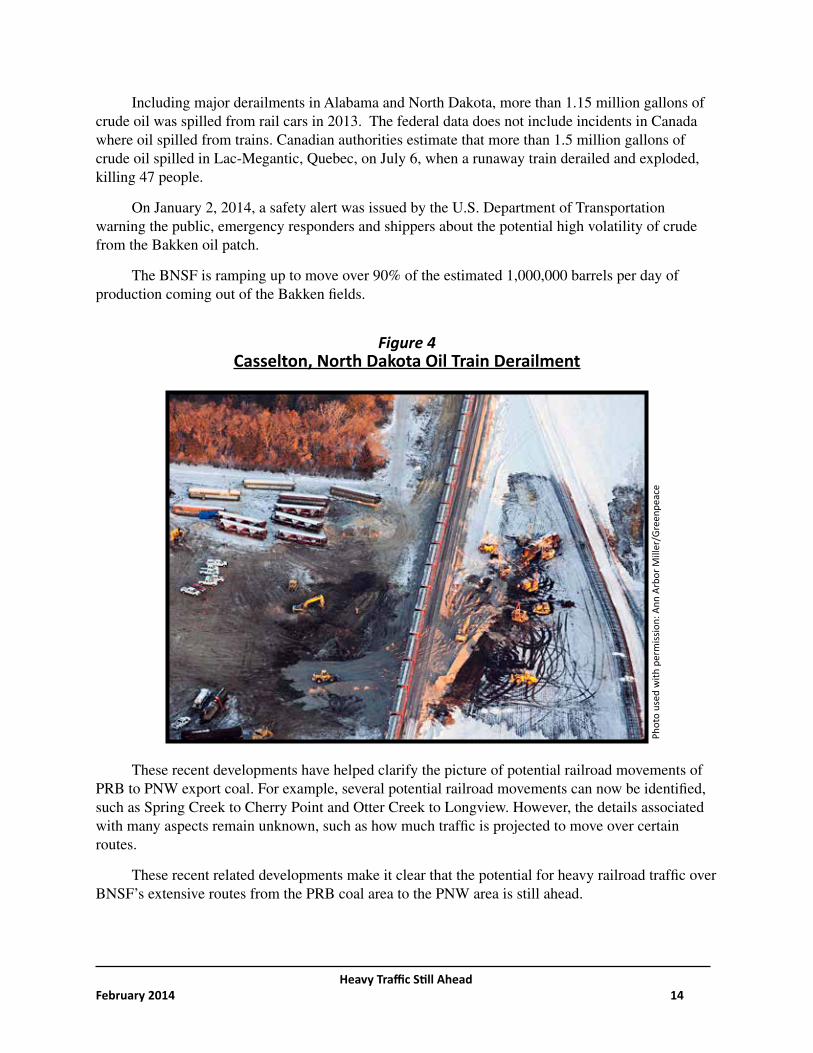
Casselton, North Dakota Explosive DerailmentThe explosive derailment of an oil train near Casselton, North Dakota, December 30, 2013
was the fourth major spill in the last twelve months and provides a stark reminder of the hazards of moving oil via rail. In fact, according to data from the Pipeline and Hazardous Materials Safety Administration, more crude oil was spilled in U.S. rail incidents last year than was spilled in the nearly four decades since the federal government began collecting data on such spills. Federal investigators have determined that 400,000 gallons of oil was lost in the December 30th derailment/crash and fire in North Dakota.
Heavy Traffic Still AheadFebruary 2014 14
Including major derailments in Alabama and North Dakota, more than 1.15 million gallons of crude oil was spilled from rail cars in 2013. The federal data does not include incidents in Canada where oil spilled from trains. Canadian authorities estimate that more than 1.5 million gallons of crude oil spilled in Lac-Megantic, Quebec, on July 6, when a runaway train derailed and exploded, killing 47 people.
On January 2, 2014, a safety alert was issued by the U.S. Department of Transportation warning the public, emergency responders and shippers about the potential high volatility of crude from the Bakken oil patch.
The BNSF is ramping up to move over 90% of the estimated 1,000,000 barrels per day of production coming out of the Bakken fields.
Figure 4Casselton, North Dakota Oil Train Derailment
These recent developments have helped clarify the picture of potential railroad movements of PRB to PNW export coal. For example, several potential railroad movements can now be identified, such as Spring Creek to Cherry Point and Otter Creek to Longview. However, the details associated with many aspects remain unknown, such as how much traffic is projected to move over certain routes.
These recent related developments make it clear that the potential for heavy railroad traffic over BNSF’s extensive routes from the PRB coal area to the PNW area is still ahead.
Phot
o us
ed w
ith p
erm
issio
n: A
nn A
rbor
Mill
er/G
reen
peac
e
Heavy Traffic Still AheadFebruary 2014 15
Related Capital Improvement ProjectsIn addition to the large capital expenditures directly associated with the proposed export
coal terminals (e.g., an estimated $600 million for Longview and $655 million for Cherry Point) and proposed new PRB origins (e.g., $472 million for the construction of the TRRC rail lines), hundreds of millions of dollars in private and government spending are going to related infrastructure improvement projects.
BNSF Improvement Projects On August 19, 2013, BNSF announced that it “plans to invest an estimated $125 million
on maintenance and rail capacity improvement and expansion projects in Washington this year.” BNSF’s 2013 capacity enhancement projects in Washington include construction of two receiving and departure tracks nearly 7,000 feet long at BNSF’s Delta yard in Everett, expanding BNSF’s automotive distribution facility at Orillia to support growth in new automobile traffic, as well as signal upgrades for federally mandated positive train control (PTC). BNSF will also continue a significant track maintenance program in Washington, which will include nearly 2,800 miles of track surfacing and undercutting work, the replacement of about 175 miles of rail and 110,000 railroad ties.32 BNSF also announced a $115 million capital program in Montana.33 Although many of the specific details regarding BNSF’s recently announced capital programs in Washington and Montana have not been provided, many of these projects are related to BNSF’s planned PRB to PNW export coal movements – yet these potential export coal movements are not mentioned in BNSF’s capital program announcements. BNSF can allocate its capital spending without transparency and, in most cases, it does not require federal or state approval for such spending. Transparency, however, is critical for capital projects that will ultimately require federal and state funding.
BNSF / WSDOT AgreementOn July 28, 2011, the Washington State Department of Transportation (WSDOT) and BNSF
signed an agreement which cleared the way for work to begin on rail improvements that ultimately will “generate hundreds of jobs and improve Amtrak Cascades service between Seattle and Portland.”34 The agreement allowed WSDOT to begin using some of nearly $800 million in Federal grants it received as part of the 2009 American Recovery and Reinvestment Act (ARRA) High-Speed-Rail grants administered by the Federal Railroad Administration (FRA), and state funds, for rail-related projects in Washington.
Most of these projects obtained federal and state funding under the guise of “enhancing rail safety” and “relieving rail congestion” in order to “improve Amtrak Cascades service.” PRB to PNW export coal movements, which would significantly add to rail congestion in Washington, are never mentioned in the WSDOT’s project descriptions or justifications.
For example, one of the largest such projects is Kelso Martin’s Bluff - Kelso to Longview Junction, which is using $123 million in Federal ARRA funding. The massive Kelso Martin’s Bluff - Kelso to Longview Junction project involves the rehabilitation of approximately 14 miles of BNSF track between Kelso and Kalama, Washington, the construction of a new third main track near Longview and construction of a new railroad bridge over the Coweeman River. WSDOT states:
Heavy Traffic Still AheadFebruary 2014 16
“Improvements will allow Amtrak Cascades trains to move around slower-moving freight trains that enter and exit the rail yard at Longview Junction. The reduced con-gestion helps passenger trains maintain higher speeds and arrive at their destinations on time. Passenger train reliability will be much improved and the additional infra-structure can accommodate additional daily round trips planned in the corridor. This work is part of WSDOT’s High-Speed Rail Program that will increase the frequency and reliability of Amtrak Cascades service between Seattle and Portland.”
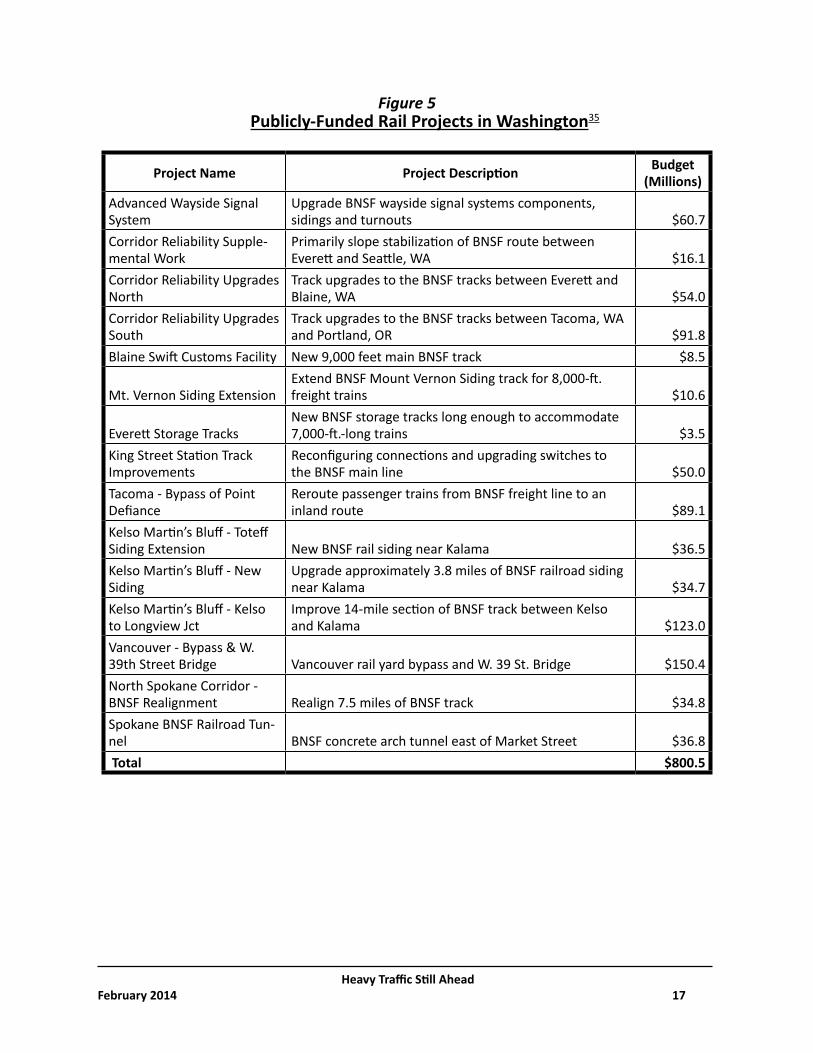
The following table (Figure 5) is a partial list of publicly-funded rail projects in Washington. Although most of these publicly-funded improvements in Washington could improve Amtrak service, it is also true that most, if not all, of the improvements (such as the aforementioned Kelso Martin’s Bluff - Kelso to Longview Junction project) would significantly help BNSF facilitate the movement of coal to the proposed PNW export terminals, and could help BNSF and the other involved companies reap billions of revenue dollars and profits. This potential economic benefit to BNSF is never mentioned by BNSF or in WSDOT’s descriptions of the publicly financed projects.
Heavy Traffic Still AheadFebruary 2014 17
Figure 5Publicly-Funded Rail Projects in Washington35
Project Name Project Description Budget(Millions)
Advanced Wayside Signal System
Upgrade BNSF wayside signal systems components, sidings and turnouts $60.7
Corridor Reliability Supple-mental Work
Primarily slope stabilization of BNSF route between Everett and Seattle, WA $16.1
Corridor Reliability Upgrades North
Track upgrades to the BNSF tracks between Everett and Blaine, WA $54.0
Corridor Reliability Upgrades South
Track upgrades to the BNSF tracks between Tacoma, WA and Portland, OR $91.8
Blaine Swift Customs Facility New 9,000 feet main BNSF track $8.5
Mt. Vernon Siding ExtensionExtend BNSF Mount Vernon Siding track for 8,000-ft. freight trains $10.6
Everett Storage TracksNew BNSF storage tracks long enough to accommodate 7,000-ft.-long trains $3.5
King Street Station Track Improvements
Reconfiguring connections and upgrading switches to the BNSF main line $50.0
Tacoma - Bypass of Point Defiance
Reroute passenger trains from BNSF freight line to an inland route $89.1
Kelso Martin’s Bluff - Toteff Siding Extension New BNSF rail siding near Kalama $36.5Kelso Martin’s Bluff - New Siding
Upgrade approximately 3.8 miles of BNSF railroad siding near Kalama $34.7
Kelso Martin’s Bluff - Kelso to Longview Jct
Improve 14-mile section of BNSF track between Kelso and Kalama $123.0
Vancouver - Bypass & W. 39th Street Bridge Vancouver rail yard bypass and W. 39 St. Bridge $150.4North Spokane Corridor - BNSF Realignment Realign 7.5 miles of BNSF track $34.8Spokane BNSF Railroad Tun-nel BNSF concrete arch tunnel east of Market Street $36.8 Total $800.5
Heavy Traffic Still AheadFebruary 2014 18
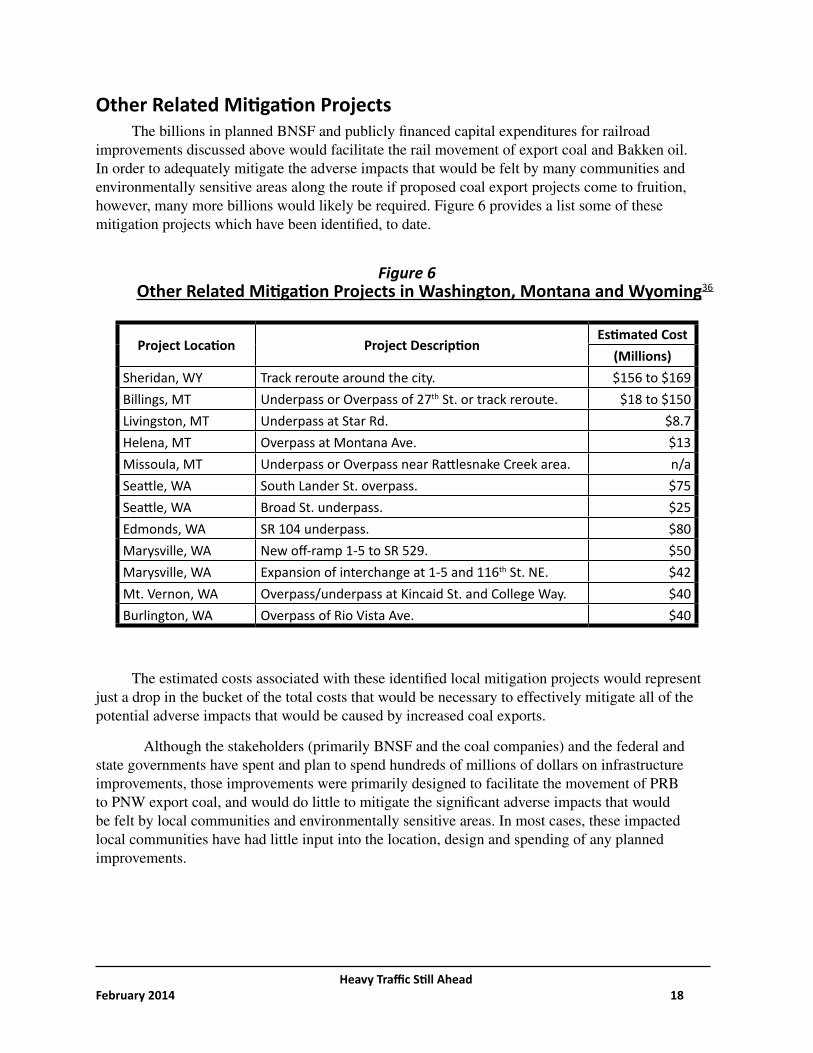
Other Related Mitigation ProjectsThe billions in planned BNSF and publicly financed capital expenditures for railroad
improvements discussed above would facilitate the rail movement of export coal and Bakken oil. In order to adequately mitigate the adverse impacts that would be felt by many communities and environmentally sensitive areas along the route if proposed coal export projects come to fruition, however, many more billions would likely be required. Figure 6 provides a list some of these mitigation projects which have been identified, to date.
Figure 6Other Related Mitigation Projects in Washington, Montana and Wyoming36
Project Location Project DescriptionEstimated Cost
(Millions)Sheridan, WY Track reroute around the city. $156 to $169Billings, MT Underpass or Overpass of 27th St. or track reroute. $18 to $150Livingston, MT Underpass at Star Rd. $8.7Helena, MT Overpass at Montana Ave. $13Missoula, MT Underpass or Overpass near Rattlesnake Creek area. n/aSeattle, WA South Lander St. overpass. $75Seattle, WA Broad St. underpass. $25Edmonds, WA SR 104 underpass. $80Marysville, WA New off-ramp 1-5 to SR 529. $50Marysville, WA Expansion of interchange at 1-5 and 116th St. NE. $42Mt. Vernon, WA Overpass/underpass at Kincaid St. and College Way. $40Burlington, WA Overpass of Rio Vista Ave. $40
The estimated costs associated with these identified local mitigation projects would represent just a drop in the bucket of the total costs that would be necessary to effectively mitigate all of the potential adverse impacts that would be caused by increased coal exports.
Although the stakeholders (primarily BNSF and the coal companies) and the federal and state governments have spent and plan to spend hundreds of millions of dollars on infrastructure improvements, those improvements were primarily designed to facilitate the movement of PRB to PNW export coal, and would do little to mitigate the significant adverse impacts that would be felt by local communities and environmentally sensitive areas. In most cases, these impacted local communities have had little input into the location, design and spending of any planned improvements.
Heavy Traffic Still AheadFebruary 2014 19
Proponents In the past year, railroad and coal companies have been promoting purported economic benefits
of the proposed PNW export coal terminals:
Alliance for Northwest Jobs & Exports — Coal and transportation compa-nies formed a group called the Alliance for Northwest Jobs & Exports (ANJE). BNSF, UP, Ambre, Arch, Cloud Peak, Peabody, SSA Marine and other com-panies which would benefit from an increase in PRB to PNW coal exports are ANJE members. ANJE maintains that coal exports will create 4,823 direct jobs at Cherry Point, Longview and Morrow and 7,062 “indirect & induced” jobs for a total of 11,885 jobs. ANJE also maintains that PNW exports will generate “$25 million” in new state and local taxes.37
Spring Creek Expansion Report — In October 2012, proponents released a report by Patrick M. Barkley of the University of Montana, titled The Eco-nomic Impact of Increased Production at the Spring Creek Mine, which pur-ports to analyze “the employment, income, production, and other economic flows that would result from a hypothetical 20 million tons per year increase in mine output.” (Current production at Spring Creek is approximately 19 million tons).38
Washington Farm Bureau Report — A recent report sponsored by the Washington State Farm Bureau (also an ANJE member), titled Coal Exports From The Pacific Northwest And The Economic Growth Of The Northwest Economy, (June, 2013) maintains that there would be economic benefits for agricultural shippers associated with the increase in railroad coal traffic in Washington.39
These statements and reports conclude that the proposed coal export projects would have net benefits, without analyzing or even discussing the costs of environmental, health, traffic and safety problems caused by mining, loading, moving, transporting, unloading and exporting the coal. Certainly, some temporary construction jobs and a limited number of jobs at the terminals would be created and taxes would be generated, but at what cost? What would be the costs of environmental impacts? Which cities and towns would be impacted and how much coal traffic would be expected? Related rail traffic congestion, automobile traffic delays, environmental issues and mitigation would all cost money. How much would it all cost compared to the $25 million in tax revenue predicted by ANJE? Who would pay? The question many continue to ask is: “Is it worth it?” These and other questions should be considered by affected communities and concerned parties. The proponents promote the potential jobs and tax revenue, but have been less than forthcoming with information that would help communities evaluate the costs.
BNSF maintains that there is ample rail capacity to handle the influx of coal traffic and that the adverse results associated with congestion would be minimal, but has been silent concerning the exact coal export traffic levels it is planning for, the routes that would be utilized and the communities that would be affected. For example, BNSF maintains that it has “three major east west
Heavy Traffic Still AheadFebruary 2014 20
routes through Washington and the exact routing would depend on several factors, such as customer needs, weather and freight volume.”40 After the release of HTA 2012, BNSF’s CEO Matt Rose made press statements that “only about eight loaded trains daily would pass through the Puget Sound region.”41 Yet, the proposed Cherry Point and Longview projects alone would need 18 loaded and 18 empty trips per day at full projected capacity.42
Some additional traffic and routing information has become available. For example, Montana Rail Link (MRL), which provides a vital routing option for BNSF in Montana, announced that capacity restrictions limit the number of BNSF export coal trains it can handle.43 BNSF is now moving significant rail volumes from and to the Bakken oil field in North Dakota and Montana, which will add to the rail congestion in the region.
In the preparation of this report, WORC submitted a series of questions to BNSF, UP and MRL concerning the potential export coal traffic and the impacted rail routes which would be utilized. MRL and UP responded to WORC’s letter. These letters are attached as Appendix 1.
MRL responded by forwarding WORC’s request to BNSF with the following statement: “We would greatly appreciate BNSF Railway responding to the request as Montana Rail Link is not the originating carrier and cannot accurately forecast potential volume for shippers that are not located on our railroad.” MRL would play a major role in PRB to PNW coal exports as it has the shorter route to Spokane, Washington. MRL’s rail lines go through many populated areas such as Helena, the state capitol, and Missoula, Montana. The vast majority of PRB to PNW coal trains would move over MRL’s line from Billings to Mossmain, Montana. Despite these facts, MRL itself, like most of the public, appears to have been kept in the dark by BNSF in regard to the potential increase in PRB to PNW export coal traffic.
UP responded to WORC with a letter which indicated that the potential PRB to PNW coal trains would not result in the congestion of UP’s routes. UP confirmed that it may interchange PRB coal with BNSF at Spokane and indicated that its lines would not be congested. While it may be true that PRB export coal trains to Morrow would not result in the congestion of UP’s line from Spokane, the PRB trains bound for Morrow will certainly add to the congestion on BNSF’s lines from the PRB to Spokane.

Heavy Traffic Still AheadFebruary 2014 21
PRB to PNW Export Coal Transportation Market
BNSF would originate and terminate the vast majority of PRB to PNW export coal movements. BNSF serves the majority of the PRB mines as well as serving both Cherry Point and Longview. Economics favor BNSF’s PRB coal origins, which involve the shortest rail distances to the various PNW export terminals. BNSF has several routing options in Montana and Washington which could be utilized for PRB to PNW export coal movements. Economics favor the shortest available route, but the large projected annual coal volumes, current railroad traffic levels and current capacity constraints would likely result in BNSF’s utilization, to some extent, of all of its available routing options, covering over 4,000 miles of railroad line.
BNSF is making a substantial investment into Longview with construction of new lead tracks. UP also serves Longview and solely serves Morrow. UP could originate PRB coal and obtain a larger export coal market share by utilizing its longer, but less congested, southern routes. A detailed evaluation of these southern UP routes was not included as part of this study. Any use of UP’s expansive southern routes from the PRB to the PNW would significantly broaden the adverse impact of increased rail traffic over a larger area and through more communities.
Initially, Ambre projected that 60 million metric tons (66 million short tons) would move via Longview, but subsequently lowered the projection to 44 million metric tons (48.5 million short tons). UP had hoped to capture a large share of the Longview market. However, UP has grown “wary of possible environmental restrictions” associated with PNW exports and is “exploring the potential of exporting coal through the Port of Guaymas in northwest Mexico,” as well as Long Beach and Houston.44
While the PNW export terminals remain an option for UP, it appears that UP is focusing its efforts on other ports, as is indicated in the following slide from a UP 2012 presentation to Citi Global Industries:45
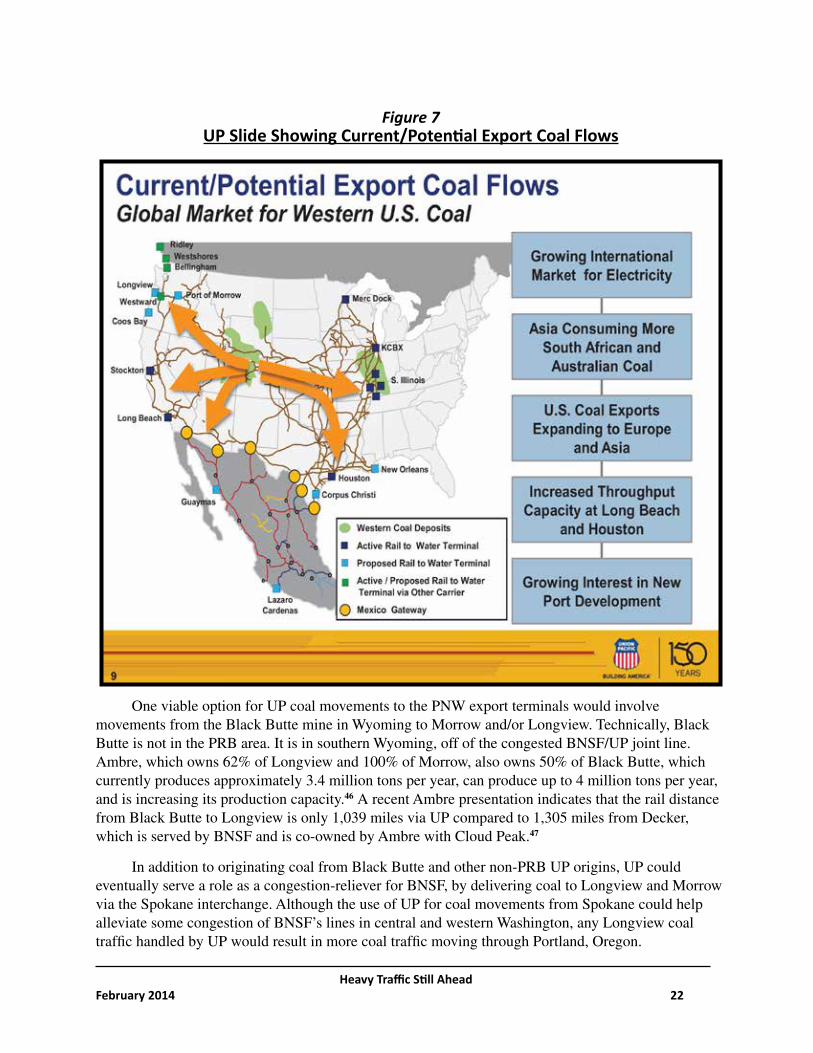
Heavy Traffic Still AheadFebruary 2014 22
Figure 7UP Slide Showing Current/Potential Export Coal Flows
One viable option for UP coal movements to the PNW export terminals would involve movements from the Black Butte mine in Wyoming to Morrow and/or Longview. Technically, Black Butte is not in the PRB area. It is in southern Wyoming, off of the congested BNSF/UP joint line. Ambre, which owns 62% of Longview and 100% of Morrow, also owns 50% of Black Butte, which currently produces approximately 3.4 million tons per year, can produce up to 4 million tons per year, and is increasing its production capacity.46 A recent Ambre presentation indicates that the rail distance from Black Butte to Longview is only 1,039 miles via UP compared to 1,305 miles from Decker, which is served by BNSF and is co-owned by Ambre with Cloud Peak.47
In addition to originating coal from Black Butte and other non-PRB UP origins, UP could eventually serve a role as a congestion-reliever for BNSF, by delivering coal to Longview and Morrow via the Spokane interchange. Although the use of UP for coal movements from Spokane could help alleviate some congestion of BNSF’s lines in central and western Washington, any Longview coal traffic handled by UP would result in more coal traffic moving through Portland, Oregon.
Heavy Traffic Still AheadFebruary 2014 23
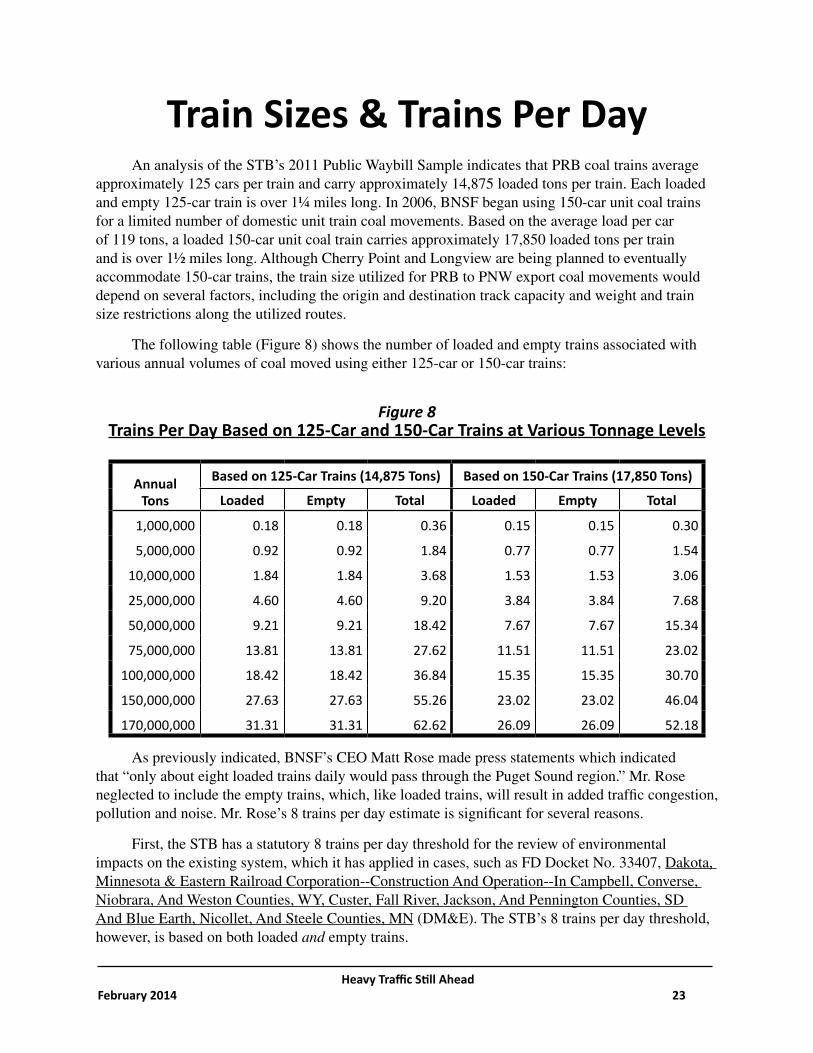
Train Sizes & Trains Per DayAn analysis of the STB’s 2011 Public Waybill Sample indicates that PRB coal trains average
approximately 125 cars per train and carry approximately 14,875 loaded tons per train. Each loaded and empty 125-car train is over 1¼ miles long. In 2006, BNSF began using 150-car unit coal trains for a limited number of domestic unit train coal movements. Based on the average load per car of 119 tons, a loaded 150-car unit coal train carries approximately 17,850 loaded tons per train and is over 1½ miles long. Although Cherry Point and Longview are being planned to eventually accommodate 150-car trains, the train size utilized for PRB to PNW export coal movements would depend on several factors, including the origin and destination track capacity and weight and train size restrictions along the utilized routes.
The following table (Figure 8) shows the number of loaded and empty trains associated with various annual volumes of coal moved using either 125-car or 150-car trains:
Figure 8Trains Per Day Based on 125-Car and 150-Car Trains at Various Tonnage Levels
AnnualTons
Based on 125-Car Trains (14,875 Tons) Based on 150-Car Trains (17,850 Tons)
Loaded Empty Total Loaded Empty Total
1,000,000 0.18 0.18 0.36 0.15 0.15 0.30
5,000,000 0.92 0.92 1.84 0.77 0.77 1.54
10,000,000 1.84 1.84 3.68 1.53 1.53 3.06
25,000,000 4.60 4.60 9.20 3.84 3.84 7.68
50,000,000 9.21 9.21 18.42 7.67 7.67 15.34
75,000,000 13.81 13.81 27.62 11.51 11.51 23.02
100,000,000 18.42 18.42 36.84 15.35 15.35 30.70
150,000,000 27.63 27.63 55.26 23.02 23.02 46.04
170,000,000 31.31 31.31 62.62 26.09 26.09 52.18
As previously indicated, BNSF’s CEO Matt Rose made press statements which indicated that “only about eight loaded trains daily would pass through the Puget Sound region.” Mr. Rose neglected to include the empty trains, which, like loaded trains, will result in added traffic congestion, pollution and noise. Mr. Rose’s 8 trains per day estimate is significant for several reasons.
First, the STB has a statutory 8 trains per day threshold for the review of environmental impacts on the existing system, which it has applied in cases, such as FD Docket No. 33407, Dakota, Minnesota & Eastern Railroad Corporation--Construction And Operation--In Campbell, Converse, Niobrara, And Weston Counties, WY, Custer, Fall River, Jackson, And Pennington Counties, SD And Blue Earth, Nicollet, And Steele Counties, MN (DM&E). The STB’s 8 trains per day threshold, however, is based on both loaded and empty trains.

Heavy Traffic Still AheadFebruary 2014 24
Second, it appears that Mr. Rose based his 8 loaded trains per day estimate on the use of 150-car trains, which would equal an annual PRB to PNW volume of approximately 50 million ton per year.
As also noted, Cherry Point and Longview alone will have the capacity to handle over 100 million tons per year. Based on 150-car trains and 100 million tons, the loaded and empty trains would equal 30.7 loaded and empty trains per day -- significantly more than Mr. Rose’s 8 trains per day estimate.
Third, Mr. Rose’s 8-train estimate is very close to the remaining capacity of the east-west lines in Washington, many of which, according to a 2006 report of the Washington State Transportation Commission, are congested or constrained.48 For example, the report estimated that BNSF’s key line from Wishram to Vancouver averages 28 trains (loaded and empty) per day and has a 36 train capacity, which leaves 8 trains of remaining capacity. The report also indicated that this line, along with several others, will exceed practical capacity by 2015.
The traffic analyses included herein were based on the use of 125 cars per train, which is approximately BNSF’s current average unit coal train size. Larger 150-car trains could eventually be utilized in PRB to PNW coal movements. As indicated in Figure 8, the use of 150-car trains would lower the numbers of trains per day. It is important to note, however, that whether 125-car or 150-cars unit coal trains are utilized, the same number of railroad cars per day would be moving over the impacted railroad routes. There may be fewer trains with the use of 150-car unit trains, but the trains would be longer (i.e., approximately 1½ miles versus 1¼ miles long) and thus could result in longer delays.
Heavy Traffic Still AheadFebruary 2014 25
Current and Proposed PNW Export Coal Terminals
In the past year, export coal terminal plans have been changed, revised, delayed, moved forward and/or solidified and new proposals and plans have been announced and put forward. The plans for two proposed terminals in Oregon, St. Helens and Coos Bay, and one in Washington, Gray’s Harbor, have been scrapped or set aside for the time being, but plans for three new PNW export coal terminals have emerged. The following describes the current and proposed export coal terminals.
WestshoreWestshore is approximately 20 miles south of Vancouver, BC, near the U.S. border, and has
been in operation since 1970. Westshore is Canada’s largest export coal facility, with capacity and volumes “easily surpassing the combined total coal exports of all other Canadian facilities.”49 In recent years, Westshore has invested millions in equipment enhancements, which has enabled it to significantly increase its annual throughput.50 In 2011, Westshore handled a record 27.3 million tonnes (30.6 million short tons) and loaded 277 ships.51 Westshore’s actual throughput has exceeded stated capacity in recent years. Westshore recently announced that it had completed an upgrade in 2012, which increased capacity to 33 million tonnes or 36.4 million short tons. Westshore’s recent upgrades have been part of an effort to attract and move more coal from U.S. PRB origins. In its 2012 Annual Report, Westshore states:
“The significant growth from 2009 to 2012 in the throughput destined for Asia from 16.3 to 20.7 million tonnes was as a result of significant increases in shipments to Ko-rea where the increase was principally in shipments of thermal coal. Increased ship-ments of thermal coal were due to the success of producers in the Powder River Basin in Montana and Wyoming in selling coal into the international market“ (page 8).
Currently, Westshore has contracts to ship coal from Canadian origins, which consumes much of its capacity. The largest such contract is with Teck Resources Limited (Teck), a large Canadian resource company. In March 2011, Teck announced that it had reached agreement with Westshore for the shipment of coal from Teck’s mines in British Columbia and Alberta for a four year term (April 1, 2012 to March 31, 2016), under which Teck is initially shipping 16 million tonnes (17.6 million tons) per year and will ship larger amounts in subsequent years.52
Westshore recently renewed a contract with Coal Valley Resources (Coal Valley) which allows Coal Valley to export up to 3 million tonnes per year (3.3 million tons) of thermal coal from Westshore up until the end of first quarter 2022.53 In March 2011, Westshore reached a new agreement with Grande Cache Coal Ltd. (Grand Cache) to ship coal from its Canadian origins through March, 2022.54 Grand Cache has a production capacity of 3 million tonnes (3.3 million tons) per year.55 Consequently, approximately 24.2 million tons of Westshore’s 36.4 million ton capacity, or about 66%, is committed to Canadian coal from Teck, Coal Valley and Grand Cache. However, Teck’s contract will expire in 2016, which will free up a significant amount of capacity unless it is renewed.
Heavy Traffic Still AheadFebruary 2014 26
Westshore indicates that U.S. coal shipments, which started in 2009, have significantly increased in recent years. In 2012, 8.6 million tons moved from U.S. coal origins to Westshore. This represents a slight reduction from the 2011 level, which was a record 9 million tons. Westshore indicates that it experienced two major shutdowns in 2012, which reduced export coal shipments.
Cloud Peak appears to be one of Westshore’s largest U.S. customers. In 2010, Cloud Peak exported approximately 3.3 million tons from its Spring Creek mine to Asian customers through Westshore. In June 2011, Cloud Peak announced that it had reached a 10-year agreement with Westshore.56 In 2012, Cloud Peak Energy exported nearly 4.4 million tons of coal via Westshore and, the company expects its coal exports to Asian countries to reach 4.5 million tons in 2013.57 Cloud Peak is also a 50% owner of the Decker Mine in Montana, which is capable of producing 9 million tons per year. Cloud Peak’s share of this capacity is 4.5 million tons.
In 2011, Gunvor, a Russian energy trader, paid $400 million to take a 33% stake in the Signal Peak coal mine in Montana. Over the next several years, Gunvor plans to boost the underground production from a stated 9 million tons a year to about 15 million tons per year and ship the coal to Pacific and Asian markets through Westshore.58 As a result, it appears that the majority of the U.S. coal moving via Westshore could eventually originate from Signal Peak. (Technically, Signal Peak is not in the PRB, but it is included in this report because of its location near the PRB and its ability to compete with PRB coal in the export market.)
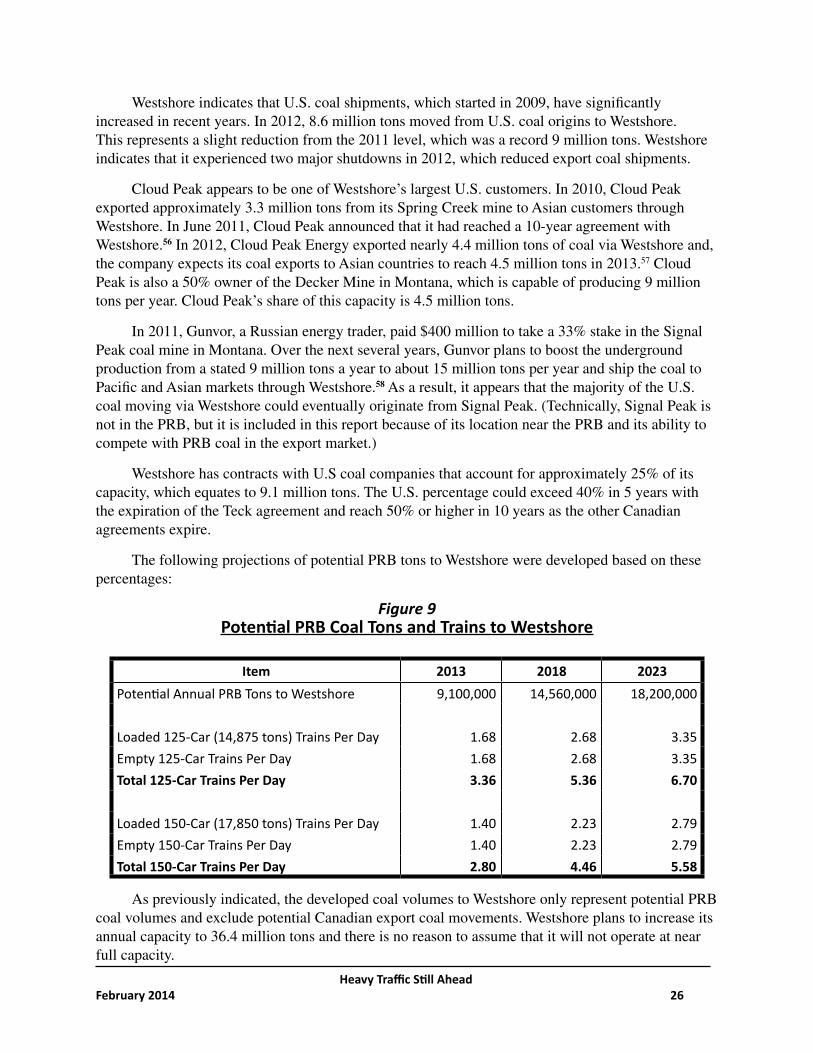
Westshore has contracts with U.S coal companies that account for approximately 25% of its capacity, which equates to 9.1 million tons. The U.S. percentage could exceed 40% in 5 years with the expiration of the Teck agreement and reach 50% or higher in 10 years as the other Canadian agreements expire.
The following projections of potential PRB tons to Westshore were developed based on these percentages:
Figure 9Potential PRB Coal Tons and Trains to Westshore
Item 2013 2018 2023Potential Annual PRB Tons to Westshore 9,100,000 14,560,000 18,200,000 Loaded 125-Car (14,875 tons) Trains Per Day 1.68 2.68 3.35Empty 125-Car Trains Per Day 1.68 2.68 3.35Total 125-Car Trains Per Day 3.36 5.36 6.70 Loaded 150-Car (17,850 tons) Trains Per Day 1.40 2.23 2.79Empty 150-Car Trains Per Day 1.40 2.23 2.79Total 150-Car Trains Per Day 2.80 4.46 5.58
As previously indicated, the developed coal volumes to Westshore only represent potential PRB coal volumes and exclude potential Canadian export coal movements. Westshore plans to increase its annual capacity to 36.4 million tons and there is no reason to assume that it will not operate at near full capacity.
Heavy Traffic Still AheadFebruary 2014 27
NeptuneOn January 23, 2013, Port Metro Vancouver issued a project permit to Neptune Terminals
which would more than double the terminal’s coal handling capacity, from 8.5 to 18.5 million tonnes or 20.4 million tons.
Teck owns 46% of the terminal and has sole right to the coal system. Although Neptune is significantly increasing its capacity, most of the coal moving from Neptune will most likely be steelmaking coal originating from Teck mines in Canada. As a result, this report assumes that only Canadian coal and no PRB coal will move via Neptune. However, changing market conditions, such as a decline in demand for metallurgical coal, a significant increase in demand for PRB coal, and/or other factors (e.g., labor strikes, shut-downs, etc.) could eventually lead to PRB coal moving from Neptune.
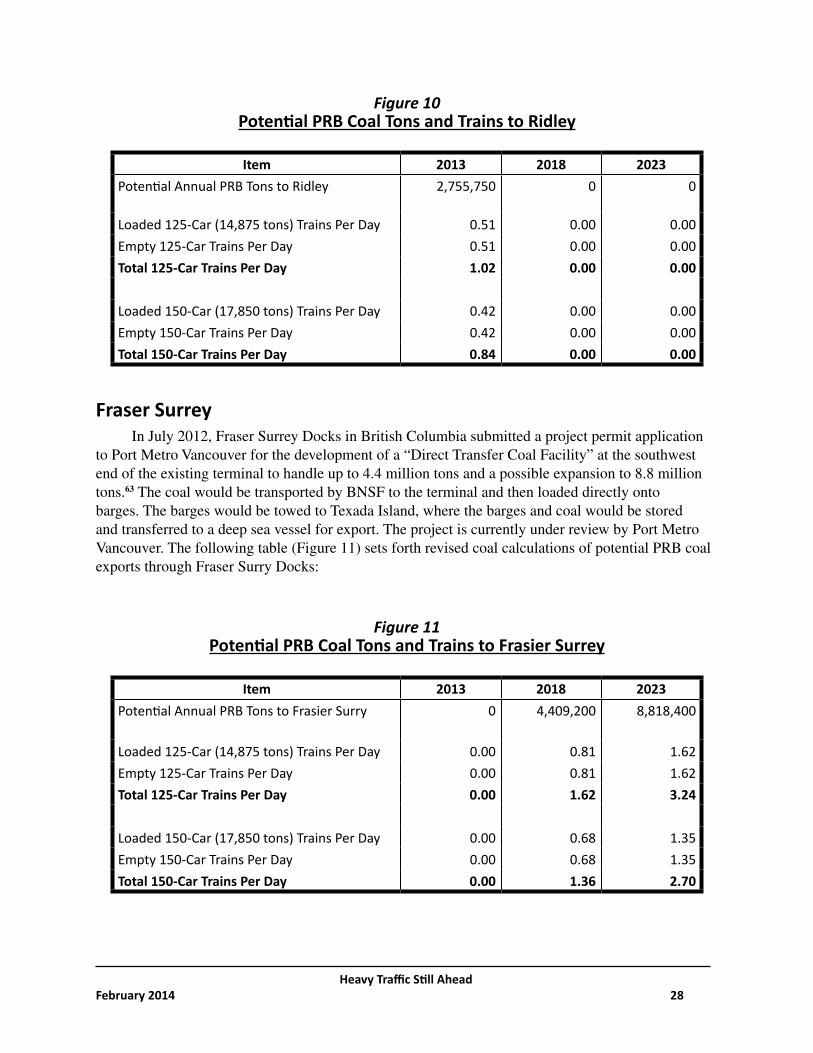
RidleyThe Prince Rupert, BC coal export facility operated by Ridley is a Federal Crown Corporation
owned by the Canadian government. The coal terminal is in a remote location in the northwestern part of the province near Alaska, a long distance from the PRB mines in Wyoming and Montana, but closer in nautical miles to the Asian market.
Ridley has an annual capacity of 12 million tonnes (13.2 million tons) per year, but plans are underway to double the capacity to 25 million tonnes (27.6 million tons) per year, by the end of 2014 or early 2015.59
Ridley indicates that it began to receive U.S. PRB coal shipments in 2011.60 In its 2010 Annual Report, Ridley stated: “Commencing in 2011 the Terminal will be receiving coal from customers based in the United States, their throughput volume combined with our Canadian producers have helped the Terminal realize a goal that has been 28 years in the making, to double the Terminal’s capacity from 12 million tonnes per annum to 25 million tonnes.” In January 2011, Arch announced that it had reached a 5-year agreement with Ridley that gave Arch throughput capacity at the terminal of up to 2 million metric tons of coal for 2011 and up to 2.5 million metric tons (2.8 million short tons) of coal for 2012 through 2015.61
After Arch’s contract expires in 2015, there is no U.S. coal contracted to ship through Ridley. Because of longer distances from PRB origins to Ridley, it may be difficult for it to compete for PRB coal exports with Longview and Cherry Point if those projects begin operations. Therefore, this report assumes only Canadian coal would move from Ridley by 2018. In December 2012, the Canadian government announced plans to sell Ridley Terminal.62 Future PRB coal exports may depend on the future private sector buyer of Ridley. For example, Arch, or some other PRB coal company, could purchase Ridley if other export plans are changed, and PRB export coal via Ridley could increase.
The following table (Figure 10) sets forth updated calculations of potential PRB coal exports for Ridley:
Heavy Traffic Still AheadFebruary 2014 28
Figure 10Potential PRB Coal Tons and Trains to Ridley
Item 2013 2018 2023Potential Annual PRB Tons to Ridley 2,755,750 0 0
Loaded 125-Car (14,875 tons) Trains Per Day 0.51 0.00 0.00Empty 125-Car Trains Per Day 0.51 0.00 0.00Total 125-Car Trains Per Day 1.02 0.00 0.00 Loaded 150-Car (17,850 tons) Trains Per Day 0.42 0.00 0.00Empty 150-Car Trains Per Day 0.42 0.00 0.00Total 150-Car Trains Per Day 0.84 0.00 0.00
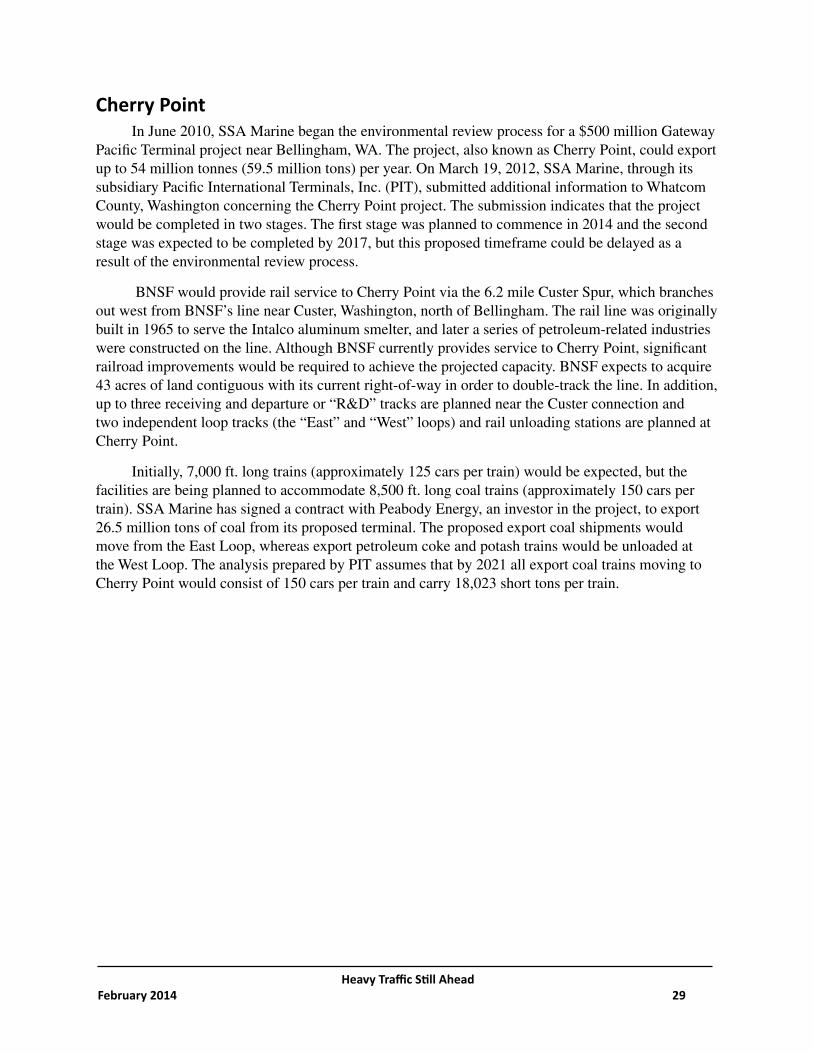
Fraser SurreyIn July 2012, Fraser Surrey Docks in British Columbia submitted a project permit application
to Port Metro Vancouver for the development of a “Direct Transfer Coal Facility” at the southwest end of the existing terminal to handle up to 4.4 million tons and a possible expansion to 8.8 million tons.63 The coal would be transported by BNSF to the terminal and then loaded directly onto barges. The barges would be towed to Texada Island, where the barges and coal would be stored and transferred to a deep sea vessel for export. The project is currently under review by Port Metro Vancouver. The following table (Figure 11) sets forth revised coal calculations of potential PRB coal exports through Fraser Surry Docks:
Figure 11Potential PRB Coal Tons and Trains to Frasier Surrey
Item 2013 2018 2023Potential Annual PRB Tons to Frasier Surry 0 4,409,200 8,818,400
Loaded 125-Car (14,875 tons) Trains Per Day 0.00 0.81 1.62Empty 125-Car Trains Per Day 0.00 0.81 1.62Total 125-Car Trains Per Day 0.00 1.62 3.24 Loaded 150-Car (17,850 tons) Trains Per Day 0.00 0.68 1.35Empty 150-Car Trains Per Day 0.00 0.68 1.35Total 150-Car Trains Per Day 0.00 1.36 2.70
Heavy Traffic Still AheadFebruary 2014 29
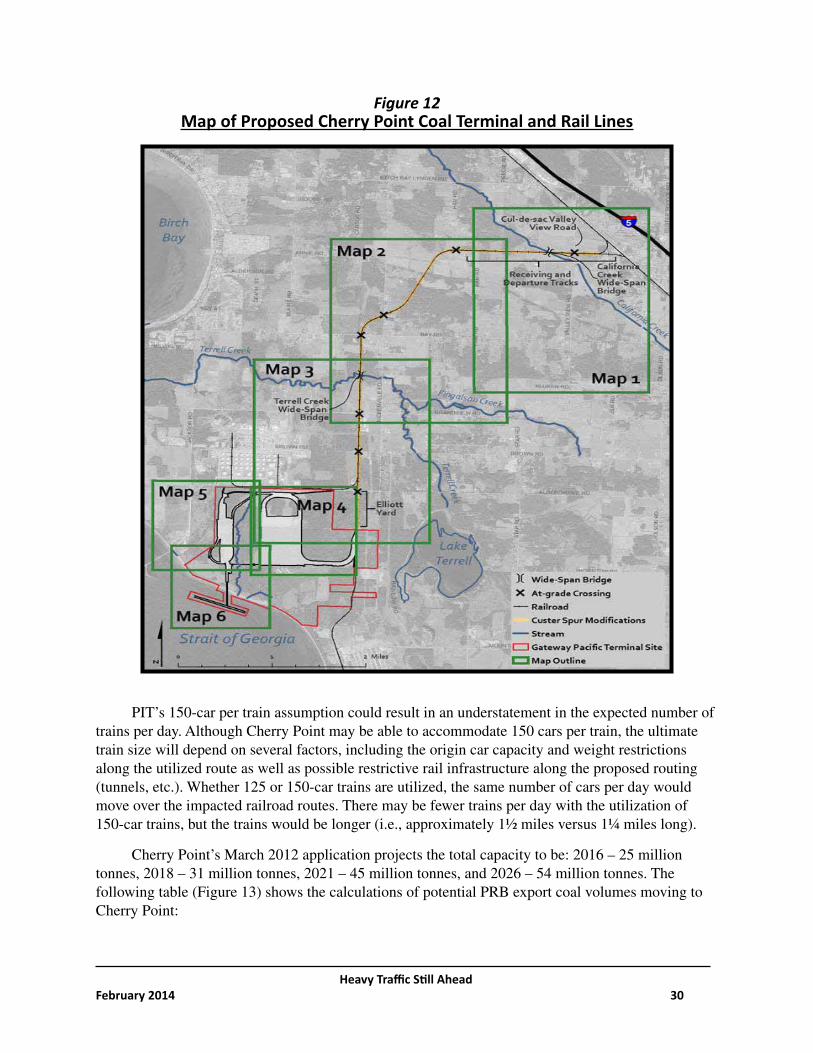
Cherry PointIn June 2010, SSA Marine began the environmental review process for a $500 million Gateway
Pacific Terminal project near Bellingham, WA. The project, also known as Cherry Point, could export up to 54 million tonnes (59.5 million tons) per year. On March 19, 2012, SSA Marine, through its subsidiary Pacific International Terminals, Inc. (PIT), submitted additional information to Whatcom County, Washington concerning the Cherry Point project. The submission indicates that the project would be completed in two stages. The first stage was planned to commence in 2014 and the second stage was expected to be completed by 2017, but this proposed timeframe could be delayed as a result of the environmental review process.
BNSF would provide rail service to Cherry Point via the 6.2 mile Custer Spur, which branches out west from BNSF’s line near Custer, Washington, north of Bellingham. The rail line was originally built in 1965 to serve the Intalco aluminum smelter, and later a series of petroleum-related industries were constructed on the line. Although BNSF currently provides service to Cherry Point, significant railroad improvements would be required to achieve the projected capacity. BNSF expects to acquire 43 acres of land contiguous with its current right-of-way in order to double-track the line. In addition, up to three receiving and departure or “R&D” tracks are planned near the Custer connection and two independent loop tracks (the “East” and “West” loops) and rail unloading stations are planned at Cherry Point.
Initially, 7,000 ft. long trains (approximately 125 cars per train) would be expected, but the facilities are being planned to accommodate 8,500 ft. long coal trains (approximately 150 cars per train). SSA Marine has signed a contract with Peabody Energy, an investor in the project, to export 26.5 million tons of coal from its proposed terminal. The proposed export coal shipments would move from the East Loop, whereas export petroleum coke and potash trains would be unloaded at the West Loop. The analysis prepared by PIT assumes that by 2021 all export coal trains moving to Cherry Point would consist of 150 cars per train and carry 18,023 short tons per train.
Heavy Traffic Still AheadFebruary 2014 30
Figure 12Map of Proposed Cherry Point Coal Terminal and Rail Lines
PIT’s 150-car per train assumption could result in an understatement in the expected number of trains per day. Although Cherry Point may be able to accommodate 150 cars per train, the ultimate train size will depend on several factors, including the origin car capacity and weight restrictions along the utilized route as well as possible restrictive rail infrastructure along the proposed routing (tunnels, etc.). Whether 125 or 150-car trains are utilized, the same number of cars per day would move over the impacted railroad routes. There may be fewer trains per day with the utilization of 150-car trains, but the trains would be longer (i.e., approximately 1½ miles versus 1¼ miles long).
Cherry Point’s March 2012 application projects the total capacity to be: 2016 – 25 million tonnes, 2018 – 31 million tonnes, 2021 – 45 million tonnes, and 2026 – 54 million tonnes. The following table (Figure 13) shows the calculations of potential PRB export coal volumes moving to Cherry Point:
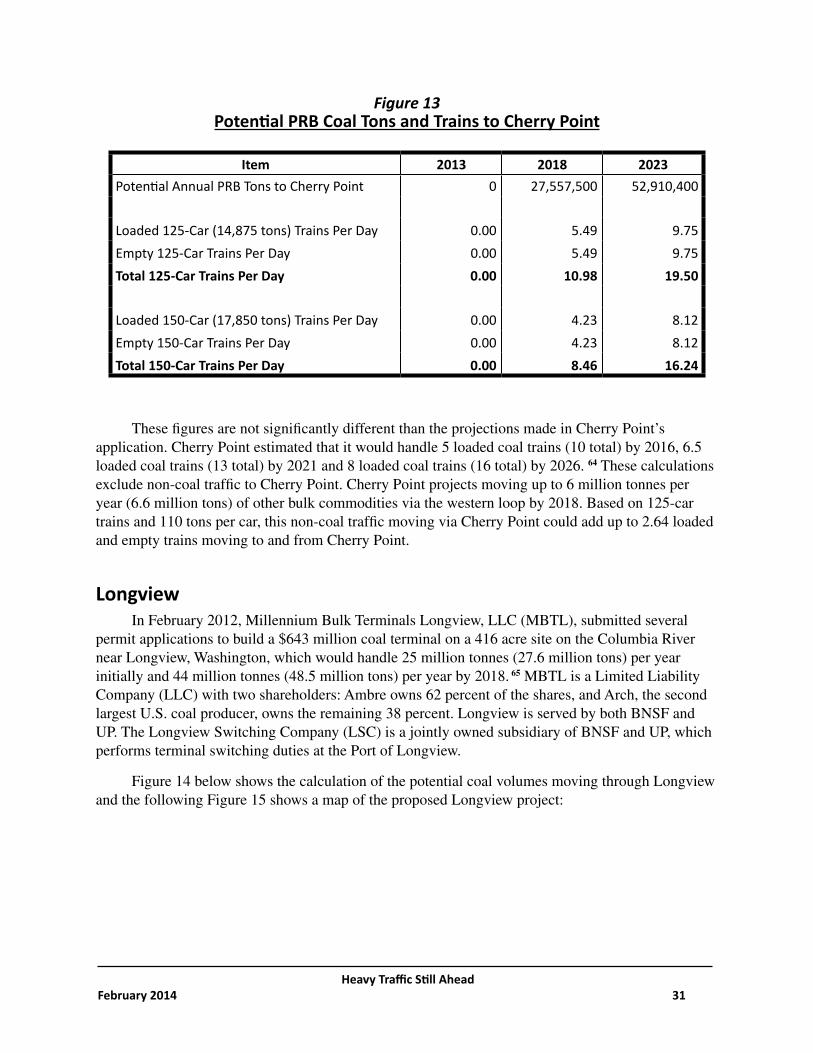
Heavy Traffic Still AheadFebruary 2014 31
Figure 13Potential PRB Coal Tons and Trains to Cherry Point
Item 2013 2018 2023Potential Annual PRB Tons to Cherry Point 0 27,557,500 52,910,400 Loaded 125-Car (14,875 tons) Trains Per Day 0.00 5.49 9.75Empty 125-Car Trains Per Day 0.00 5.49 9.75Total 125-Car Trains Per Day 0.00 10.98 19.50 Loaded 150-Car (17,850 tons) Trains Per Day 0.00 4.23 8.12Empty 150-Car Trains Per Day 0.00 4.23 8.12Total 150-Car Trains Per Day 0.00 8.46 16.24
These figures are not significantly different than the projections made in Cherry Point’s application. Cherry Point estimated that it would handle 5 loaded coal trains (10 total) by 2016, 6.5 loaded coal trains (13 total) by 2021 and 8 loaded coal trains (16 total) by 2026. 64 These calculations exclude non-coal traffic to Cherry Point. Cherry Point projects moving up to 6 million tonnes per year (6.6 million tons) of other bulk commodities via the western loop by 2018. Based on 125-car trains and 110 tons per car, this non-coal traffic moving via Cherry Point could add up to 2.64 loaded and empty trains moving to and from Cherry Point.
LongviewIn February 2012, Millennium Bulk Terminals Longview, LLC (MBTL), submitted several
permit applications to build a $643 million coal terminal on a 416 acre site on the Columbia River near Longview, Washington, which would handle 25 million tonnes (27.6 million tons) per year initially and 44 million tonnes (48.5 million tons) per year by 2018. 65 MBTL is a Limited Liability Company (LLC) with two shareholders: Ambre owns 62 percent of the shares, and Arch, the second largest U.S. coal producer, owns the remaining 38 percent. Longview is served by both BNSF and UP. The Longview Switching Company (LSC) is a jointly owned subsidiary of BNSF and UP, which performs terminal switching duties at the Port of Longview.
Figure 14 below shows the calculation of the potential coal volumes moving through Longview and the following Figure 15 shows a map of the proposed Longview project:
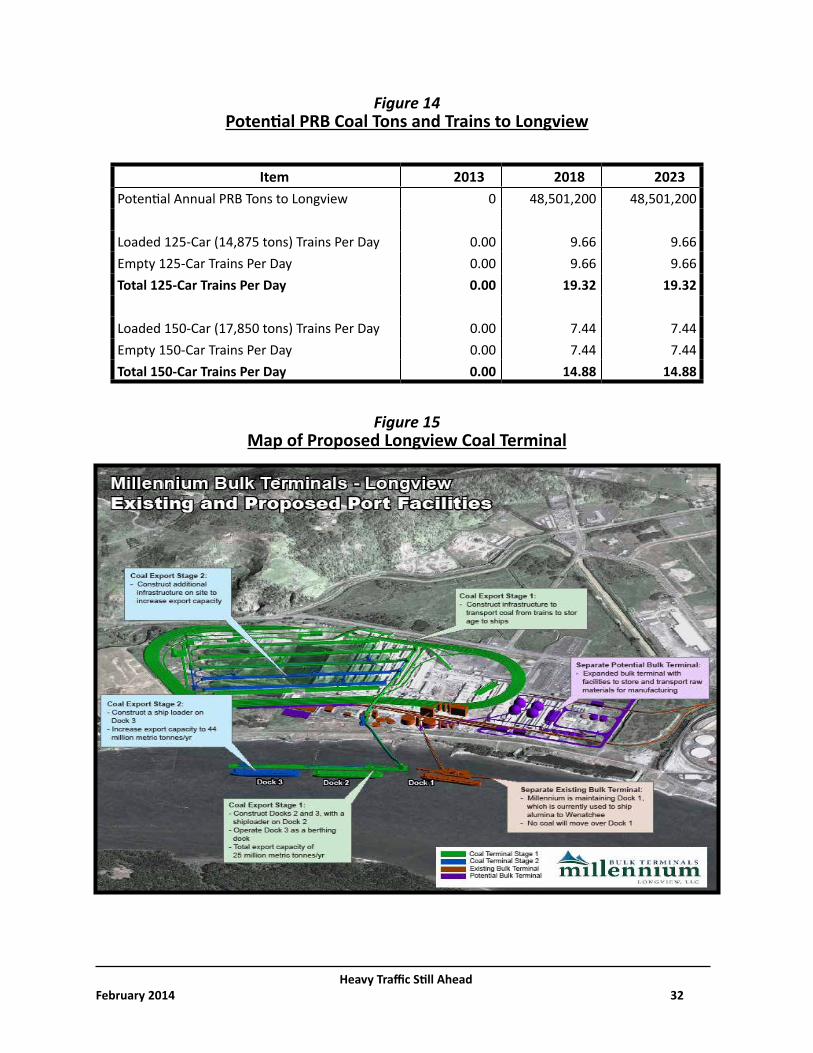
Heavy Traffic Still AheadFebruary 2014 32
Figure 14Potential PRB Coal Tons and Trains to Longview
Item 2013 2018 2023Potential Annual PRB Tons to Longview 0 48,501,200 48,501,200 Loaded 125-Car (14,875 tons) Trains Per Day 0.00 9.66 9.66Empty 125-Car Trains Per Day 0.00 9.66 9.66Total 125-Car Trains Per Day 0.00 19.32 19.32 Loaded 150-Car (17,850 tons) Trains Per Day 0.00 7.44 7.44Empty 150-Car Trains Per Day 0.00 7.44 7.44Total 150-Car Trains Per Day 0.00 14.88 14.88
Figure 15Map of Proposed Longview Coal Terminal
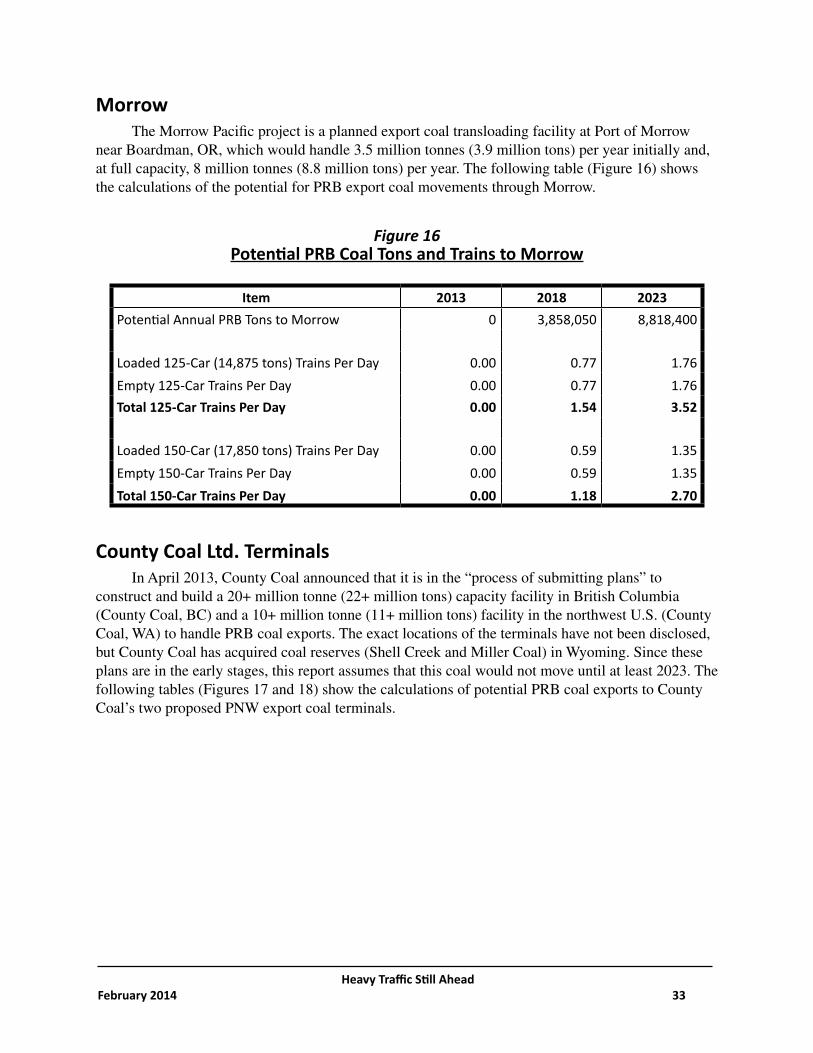
Heavy Traffic Still AheadFebruary 2014 33
MorrowThe Morrow Pacific project is a planned export coal transloading facility at Port of Morrow
near Boardman, OR, which would handle 3.5 million tonnes (3.9 million tons) per year initially and, at full capacity, 8 million tonnes (8.8 million tons) per year. The following table (Figure 16) shows the calculations of the potential for PRB export coal movements through Morrow.
Figure 16Potential PRB Coal Tons and Trains to Morrow
Item 2013 2018 2023Potential Annual PRB Tons to Morrow 0 3,858,050 8,818,400
Loaded 125-Car (14,875 tons) Trains Per Day 0.00 0.77 1.76Empty 125-Car Trains Per Day 0.00 0.77 1.76Total 125-Car Trains Per Day 0.00 1.54 3.52 Loaded 150-Car (17,850 tons) Trains Per Day 0.00 0.59 1.35Empty 150-Car Trains Per Day 0.00 0.59 1.35Total 150-Car Trains Per Day 0.00 1.18 2.70
County Coal Ltd. TerminalsIn April 2013, County Coal announced that it is in the “process of submitting plans” to
construct and build a 20+ million tonne (22+ million tons) capacity facility in British Columbia (County Coal, BC) and a 10+ million tonne (11+ million tons) facility in the northwest U.S. (County Coal, WA) to handle PRB coal exports. The exact locations of the terminals have not been disclosed, but County Coal has acquired coal reserves (Shell Creek and Miller Coal) in Wyoming. Since these plans are in the early stages, this report assumes that this coal would not move until at least 2023. The following tables (Figures 17 and 18) show the calculations of potential PRB coal exports to County Coal’s two proposed PNW export coal terminals.
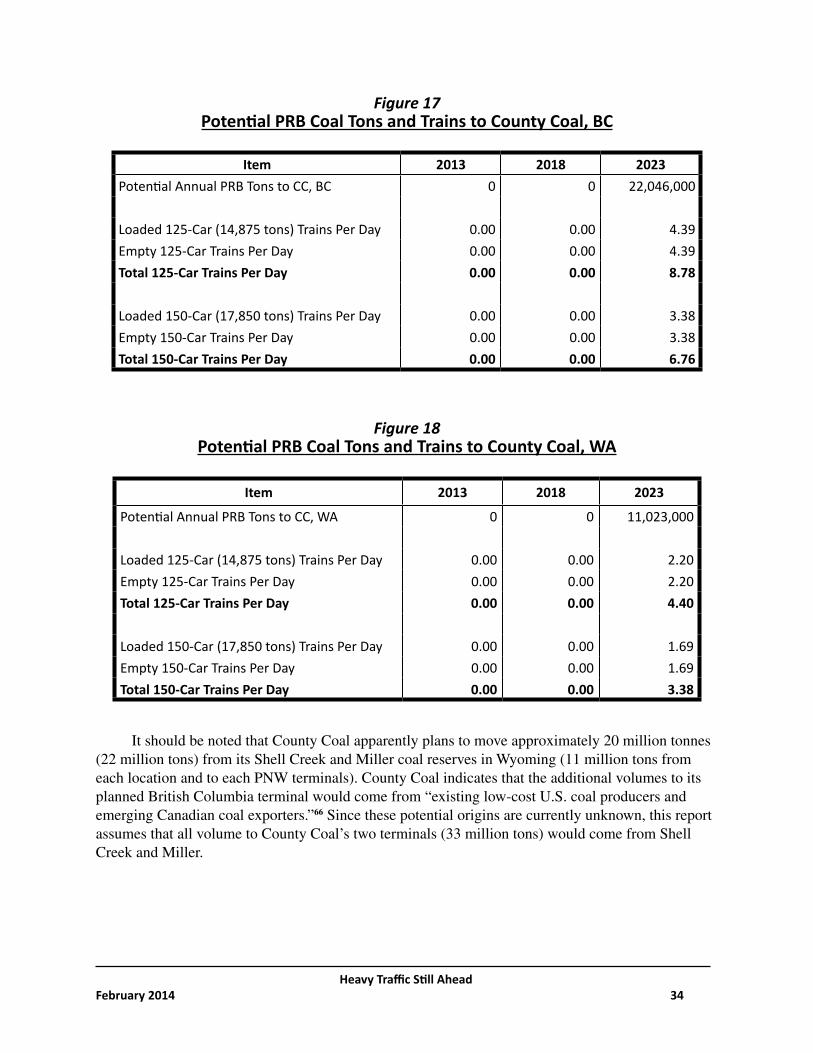
Heavy Traffic Still AheadFebruary 2014 34
Figure 17Potential PRB Coal Tons and Trains to County Coal, BC
Item 2013 2018 2023Potential Annual PRB Tons to CC, BC 0 0 22,046,000 Loaded 125-Car (14,875 tons) Trains Per Day 0.00 0.00 4.39Empty 125-Car Trains Per Day 0.00 0.00 4.39Total 125-Car Trains Per Day 0.00 0.00 8.78 Loaded 150-Car (17,850 tons) Trains Per Day 0.00 0.00 3.38Empty 150-Car Trains Per Day 0.00 0.00 3.38Total 150-Car Trains Per Day 0.00 0.00 6.76
Figure 18Potential PRB Coal Tons and Trains to County Coal, WA
Item 2013 2018 2023
Potential Annual PRB Tons to CC, WA 0 0 11,023,000 Loaded 125-Car (14,875 tons) Trains Per Day 0.00 0.00 2.20Empty 125-Car Trains Per Day 0.00 0.00 2.20Total 125-Car Trains Per Day 0.00 0.00 4.40 Loaded 150-Car (17,850 tons) Trains Per Day 0.00 0.00 1.69Empty 150-Car Trains Per Day 0.00 0.00 1.69Total 150-Car Trains Per Day 0.00 0.00 3.38
It should be noted that County Coal apparently plans to move approximately 20 million tonnes (22 million tons) from its Shell Creek and Miller coal reserves in Wyoming (11 million tons from each location and to each PNW terminals). County Coal indicates that the additional volumes to its planned British Columbia terminal would come from “existing low-cost U.S. coal producers and emerging Canadian coal exporters.”66 Since these potential origins are currently unknown, this report assumes that all volume to County Coal’s two terminals (33 million tons) would come from Shell Creek and Miller.

Heavy Traffic Still AheadFebruary 2014 35
Potential Loaded and Empty PRB to PNW Export Coal Trains
The following table (Figure 19) summarizes the calculations of potential loaded and empty PRB unit coal trains that could move to and from the current and proposed PNW export coal terminals:
Figure 19Potential PRB to PNW Export Coal Trains Per Day
Moving in 125-Car and 150-Car Unit Trains
PNW Export Coal Terminal2013 2018 2023
125-Cars 150-Cars 125-Cars 150-Cars 125-Cars 150-Cars
Roberts Bank, BC – Westshore 3.36 2.80 5.36 4.46 6.70 5.58N. Vancouver, BC – Neptune 0.00 0.00 0.00 0.00 0.00 0.00Prince Rupert, BC – Ridley 1.02 0.84 0.00 0.00 0.00 0.00Vancouver, BC -- Fraser Surrey 0.82 0.68 1.62 1.36 3.24 2.70Vancouver Area, BC – County Coal 0.00 0.00 0.00 0.00 8.78 6.76Total To British Columbia Terminals 5.20 4.32 6.98 5.82 18.72 15.04 Bellingham , WA – Cherry Point 0.00 0.00 10.98 8.46 19.50 16.24Longview, WA 0.00 0.00 19.32 14.88 19.32 14.88Longview Area, WA – County Coal 0.00 0.00 0.00 0.00 4.40 3.38Total To Washington Terminals 0.00 0.00 30.30 23.34 43.22 34.50 Boardman, OR – Morrow 0.00 0.00 1.54 1.18 3.52 2.70Total To Oregon Terminals 0.00 0.00 1.54 1.18 3.52 2.70 Total PRB to PNW Export Coal Trains 5.20 4.32 38.82 30.34 65.46 52.24
As can be seen, daily loaded and empty PRB coal trains could average between 30.34 and 38.82 trains per day by 2018 and, at full capacity, could average between 52.24 to 65.46 trains per day, which would equal 2.18 to 2.73 trains per hour. In other words, despite recent changes in the status of proposed coal export terminal projects, based on existing plans for new and expanded PNW coal terminals, there could still be heavy traffic ahead.
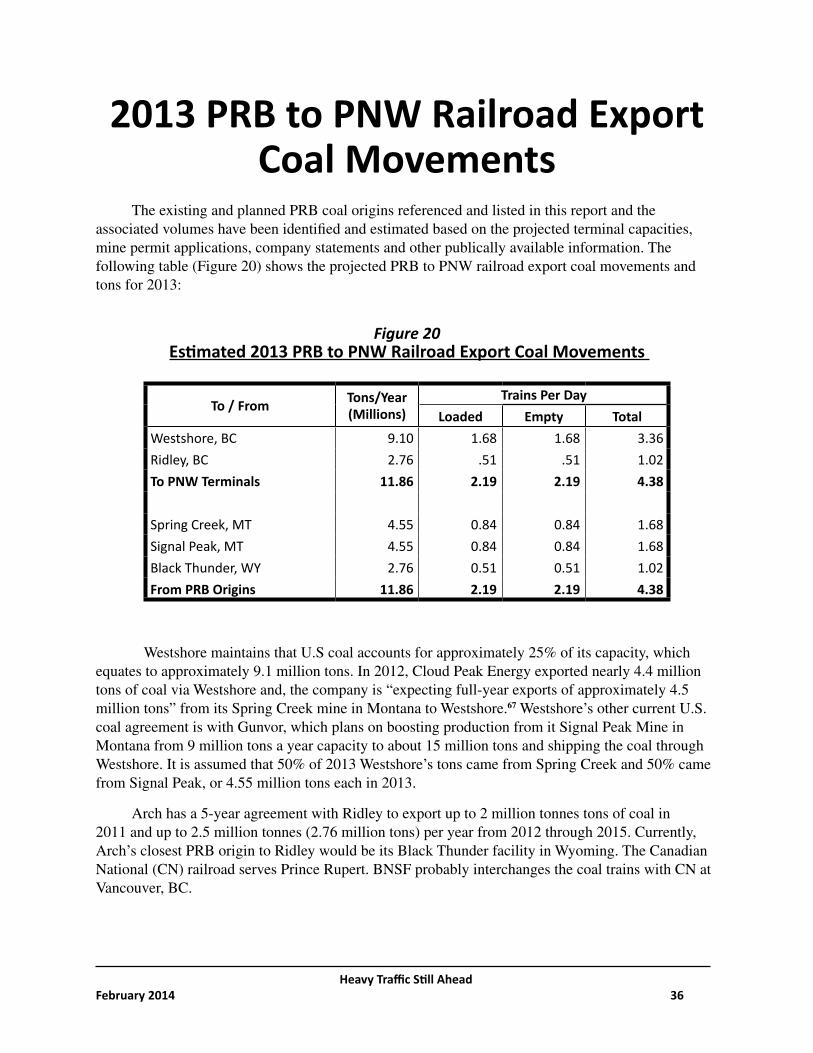
Heavy Traffic Still AheadFebruary 2014 36
2013 PRB to PNW Railroad Export Coal Movements
The existing and planned PRB coal origins referenced and listed in this report and the associated volumes have been identified and estimated based on the projected terminal capacities, mine permit applications, company statements and other publically available information. The following table (Figure 20) shows the projected PRB to PNW railroad export coal movements and tons for 2013:
Figure 20Estimated 2013 PRB to PNW Railroad Export Coal Movements
To / From Tons/Year(Millions)
Trains Per DayLoaded Empty Total
Westshore, BC 9.10 1.68 1.68 3.36Ridley, BC 2.76 .51 .51 1.02To PNW Terminals 11.86 2.19 2.19 4.38
Spring Creek, MT 4.55 0.84 0.84 1.68Signal Peak, MT 4.55 0.84 0.84 1.68Black Thunder, WY 2.76 0.51 0.51 1.02From PRB Origins 11.86 2.19 2.19 4.38
Westshore maintains that U.S coal accounts for approximately 25% of its capacity, which equates to approximately 9.1 million tons. In 2012, Cloud Peak Energy exported nearly 4.4 million tons of coal via Westshore and, the company is “expecting full-year exports of approximately 4.5 million tons” from its Spring Creek mine in Montana to Westshore.67 Westshore’s other current U.S. coal agreement is with Gunvor, which plans on boosting production from it Signal Peak Mine in Montana from 9 million tons a year capacity to about 15 million tons and shipping the coal through Westshore. It is assumed that 50% of 2013 Westshore’s tons came from Spring Creek and 50% came from Signal Peak, or 4.55 million tons each in 2013.
Arch has a 5-year agreement with Ridley to export up to 2 million tonnes tons of coal in 2011 and up to 2.5 million tonnes (2.76 million tons) per year from 2012 through 2015. Currently, Arch’s closest PRB origin to Ridley would be its Black Thunder facility in Wyoming. The Canadian National (CN) railroad serves Prince Rupert. BNSF probably interchanges the coal trains with CN at Vancouver, BC.

Heavy Traffic Still AheadFebruary 2014 37
Potential 2018 PRB to PNW Railroad Export Coal Movements
The follow table (Figure 21) shows the calculations of potential PRB to PNW railroad export coal tons and trains per day for the year 2018. These figures show coal train traffic levels if the Cherry Point, Longview and Morrow export terminals and the TRRC railroad and Otter Creek Mine in Montana were all operational by 2018:
Figure 21Potential 2018 PRB to PNW Railroad Export Coal Movements
To / From Tons/Year(Millions)
Trains Per DayLoaded Empty Total
Longview, WA 48.50 8.93 8.93 17.86Cherry Point, WA 27.56 5.08 5.08 10.16Westshore, BC 14.56 2.68 2.68 5.36Fraser Surrey, BC 4.41 0.81 0.81 1.62Boardman, WA 3.89 0.72 0.72 1.44To PNW Terminals 98.92 18.22 18.22 36.44
N. Antelope Rochelle, WY 26.46 4.88 4.88 9.76Otter Creek, MT 20.00 3.68 3.68 7.36Youngs Creek, MT 11.82 2.18 2.18 4.36Spring Creek, MT 11.15 2.05 2.05 4.10Signal Peak, MT 10.10 1.86 1.86 3.72Decker, MT 10.00 1.84 1.84 3.68Absaloka, MT 5.50 1.01 1.01 2.02Black Butte, WY 3.89 0.72 0.72 1.44From PRB Origins 98.92 18.22 18.22 36.44
The calculations in Figure 21 show railroad traffic levels if the PNW export coal terminals were operating at 100% capacity. The railroad line segment analyses attached to this report also show the calculations based on these terminals operating at 75%.
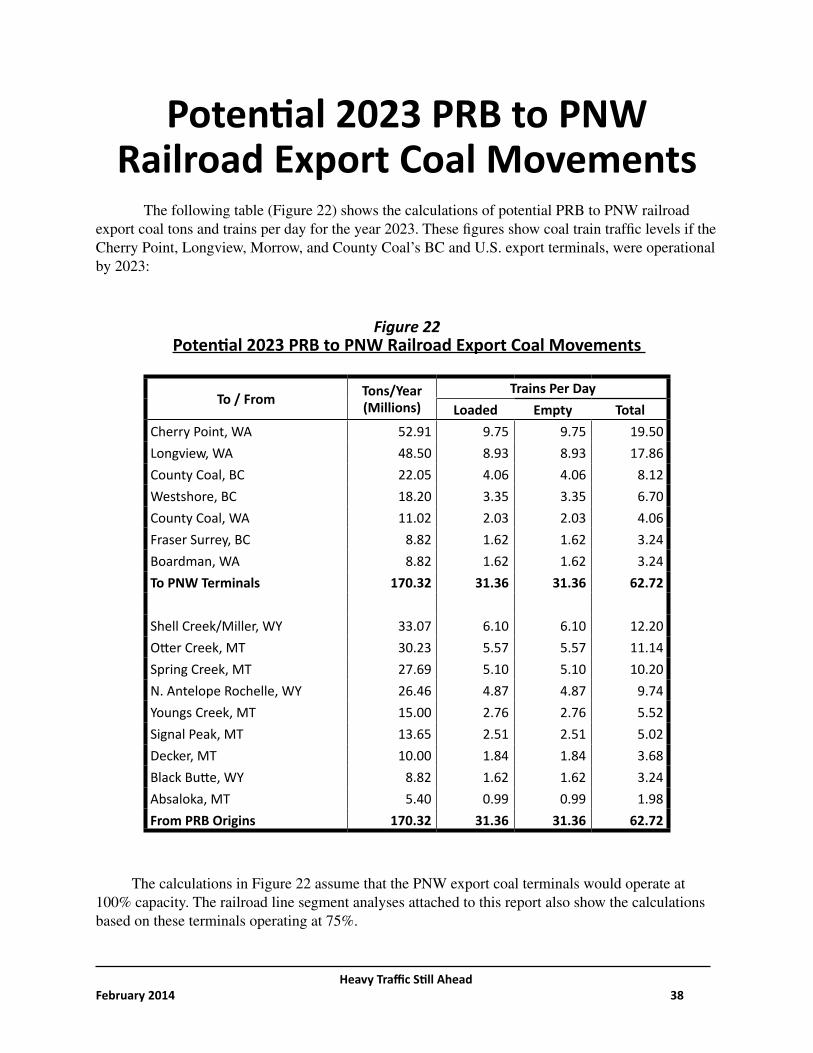
Heavy Traffic Still AheadFebruary 2014 38
Potential 2023 PRB to PNW Railroad Export Coal Movements
The following table (Figure 22) shows the calculations of potential PRB to PNW railroad export coal tons and trains per day for the year 2023. These figures show coal train traffic levels if the Cherry Point, Longview, Morrow, and County Coal’s BC and U.S. export terminals, were operational by 2023:
Figure 22Potential 2023 PRB to PNW Railroad Export Coal Movements
To / From Tons/Year(Millions)
Trains Per DayLoaded Empty Total
Cherry Point, WA 52.91 9.75 9.75 19.50Longview, WA 48.50 8.93 8.93 17.86County Coal, BC 22.05 4.06 4.06 8.12Westshore, BC 18.20 3.35 3.35 6.70County Coal, WA 11.02 2.03 2.03 4.06Fraser Surrey, BC 8.82 1.62 1.62 3.24Boardman, WA 8.82 1.62 1.62 3.24To PNW Terminals 170.32 31.36 31.36 62.72
Shell Creek/Miller, WY 33.07 6.10 6.10 12.20Otter Creek, MT 30.23 5.57 5.57 11.14Spring Creek, MT 27.69 5.10 5.10 10.20N. Antelope Rochelle, WY 26.46 4.87 4.87 9.74Youngs Creek, MT 15.00 2.76 2.76 5.52Signal Peak, MT 13.65 2.51 2.51 5.02Decker, MT 10.00 1.84 1.84 3.68Black Butte, WY 8.82 1.62 1.62 3.24Absaloka, MT 5.40 0.99 0.99 1.98From PRB Origins 170.32 31.36 31.36 62.72
The calculations in Figure 22 assume that the PNW export coal terminals would operate at 100% capacity. The railroad line segment analyses attached to this report also show the calculations based on these terminals operating at 75%.
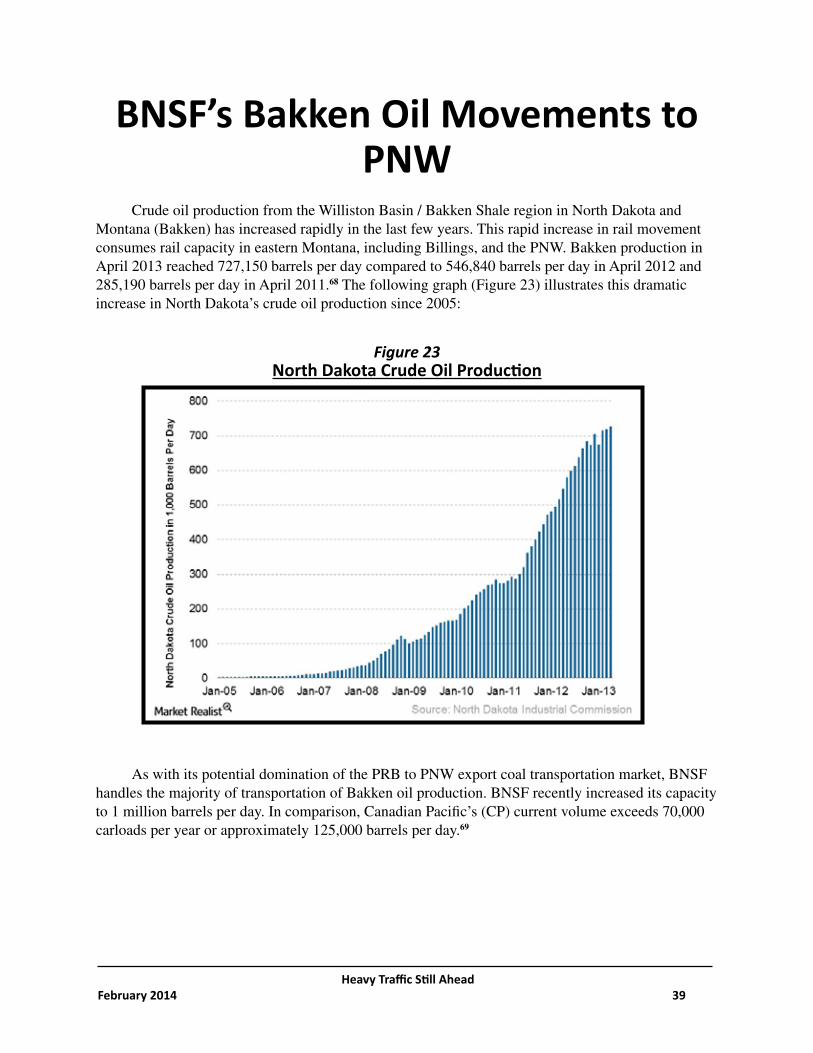
Heavy Traffic Still AheadFebruary 2014 39
BNSF’s Bakken Oil Movements to PNW
Crude oil production from the Williston Basin / Bakken Shale region in North Dakota and Montana (Bakken) has increased rapidly in the last few years. This rapid increase in rail movement consumes rail capacity in eastern Montana, including Billings, and the PNW. Bakken production in April 2013 reached 727,150 barrels per day compared to 546,840 barrels per day in April 2012 and 285,190 barrels per day in April 2011.68 The following graph (Figure 23) illustrates this dramatic increase in North Dakota’s crude oil production since 2005:
Figure 23North Dakota Crude Oil Production
As with its potential domination of the PRB to PNW export coal transportation market, BNSF handles the majority of transportation of Bakken oil production. BNSF recently increased its capacity to 1 million barrels per day. In comparison, Canadian Pacific’s (CP) current volume exceeds 70,000 carloads per year or approximately 125,000 barrels per day.69

Heavy Traffic Still AheadFebruary 2014 40
There are several current and proposed PNW destinations for Bakken oil:
Tesoro Anacortes Refinery — Tesoro Corp. plans to move 50,000 bar-rels per day of crude oil from the Bakken formation in North Dakota to its 120,000-barrel per day refinery in Anacortes, Washington.70
Shell Puget Sound Refinery in Anacortes — In March, 2013, Shell Oil an-nounced that it was considering building a rail offloading facility for Bakken crude on its property. Shell’s Anacortes refinery currently processes 145,000 barrels of oil per day, with crude coming in largely from Alaska’s North Slope and from Canada via pipeline.71
Phillips/Conoco Ferndale Refinery — In March, 2013, Phillips/Conoco an-nounced that it was aggressively pursuing the movement of Bakken oil to its refineries in Ferndale, WA and Bayway, NJ. It announced that it was con-structing a crude oil rail unloading facility at Ferndale. The company is al-ready processing 75,000 bpd of Bakken crude oil at the Bayway refinery, and is processing smaller volumes of Bakken crude oil at Ferndale, with plans to significantly grow those volumes as a new railcar fleet is delivered.72
BP Cherry Point Refinery — In November 2012, BP announced a rail con-struction project to accommodate trainloads of crude oil from the booming Bakken oil fields in North Dakota and Montana.73
U.S. Oil and Refining Co. Tacoma Refinery — U.S. Oil and Refining Com-pany’s (USOR) Tacoma refinery has a current crude capacity of 39,000 bar-rels per day. USOR is expanding its rail yard and storage tanks to handle crude oil from the Bakken.74
Chevron Burnaby Refinery in Vancouver, BC — Chevron’s Burnaby Re-finery has a capacity of approximately 55,000 barrels per day. Historically, it has received oil via the Trans Mountain Pipeline (TMPL). Loaded rail to truck crude shipments began in May 2012. They are currently limited to 2,500 bpd with a potential for 6,000 bpd. Once operational, a crude by rail option would be limited to 8,000 bpd.75
Vancouver Oil Terminal — The Vancouver oil terminal proposal by Tesoro Vancouver and Salvage Company would handle as much as 360,000 barrels of crude oil per day, which would arrive by rail from the Bakken area in North Dakota and Montana and be stored in large tanks before being loaded aboard ships and barges for trips to West Coast oil refineries.
A recent report by the Sightline Institute, titled The Northwest’s Pipeline on Rail, describes these potential PNW Bakken oil destinations and the potential rail movements in detail.76 The following table (Figure 24) shows the potential loaded and empty Bakken oil trains to PNW destinations based on 70,000 barrels per train:
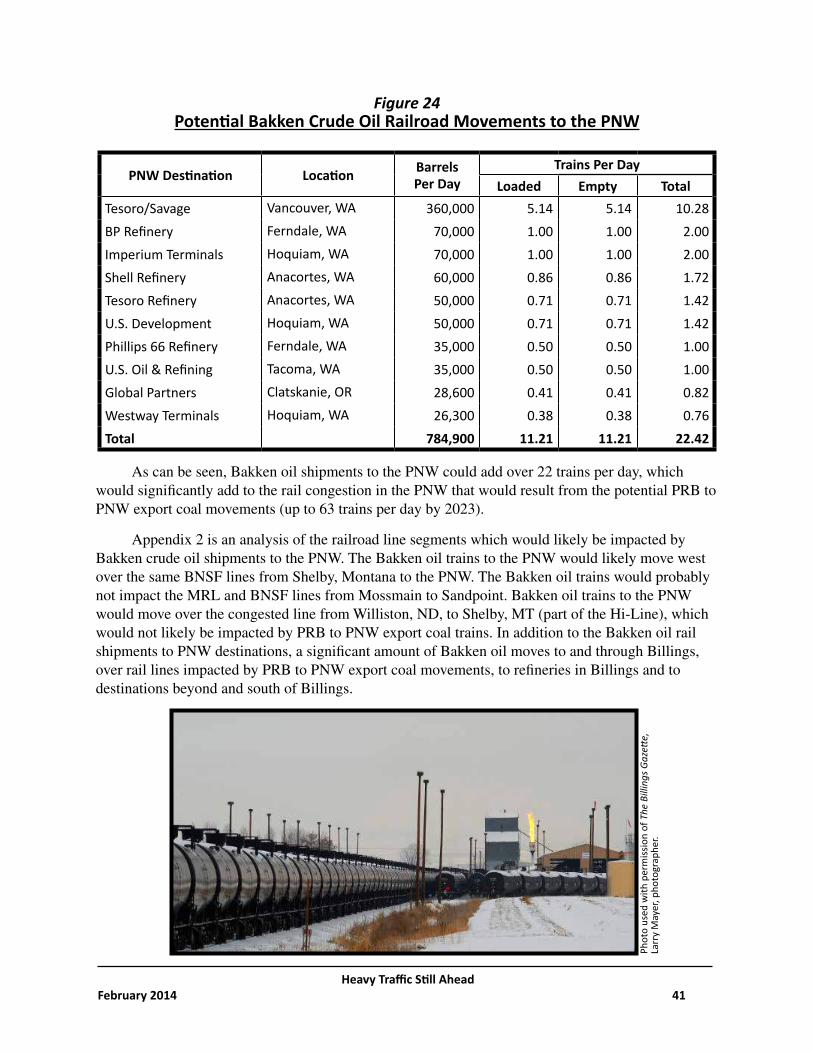
Heavy Traffic Still AheadFebruary 2014 41
Figure 24Potential Bakken Crude Oil Railroad Movements to the PNW
PNW Destination Location BarrelsPer Day
Trains Per DayLoaded Empty Total
Tesoro/Savage Vancouver, WA 360,000 5.14 5.14 10.28BP Refinery Ferndale, WA 70,000 1.00 1.00 2.00Imperium Terminals Hoquiam, WA 70,000 1.00 1.00 2.00Shell Refinery Anacortes, WA 60,000 0.86 0.86 1.72Tesoro Refinery Anacortes, WA 50,000 0.71 0.71 1.42U.S. Development Hoquiam, WA 50,000 0.71 0.71 1.42Phillips 66 Refinery Ferndale, WA 35,000 0.50 0.50 1.00U.S. Oil & Refining Tacoma, WA 35,000 0.50 0.50 1.00Global Partners Clatskanie, OR 28,600 0.41 0.41 0.82Westway Terminals Hoquiam, WA 26,300 0.38 0.38 0.76Total 784,900 11.21 11.21 22.42
As can be seen, Bakken oil shipments to the PNW could add over 22 trains per day, which would significantly add to the rail congestion in the PNW that would result from the potential PRB to PNW export coal movements (up to 63 trains per day by 2023).
Appendix 2 is an analysis of the railroad line segments which would likely be impacted by Bakken crude oil shipments to the PNW. The Bakken oil trains to the PNW would likely move west over the same BNSF lines from Shelby, Montana to the PNW. The Bakken oil trains would probably not impact the MRL and BNSF lines from Mossmain to Sandpoint. Bakken oil trains to the PNW would move over the congested line from Williston, ND, to Shelby, MT (part of the Hi-Line), which would not likely be impacted by PRB to PNW export coal trains. In addition to the Bakken oil rail shipments to PNW destinations, a significant amount of Bakken oil moves to and through Billings, over rail lines impacted by PRB to PNW export coal movements, to refineries in Billings and to destinations beyond and south of Billings.
Phot
o us
ed w
ith p
erm
issio
n of
The
Bill
ings
Gaz
ette,
La
rry
May
er, p
hoto
grap
her.
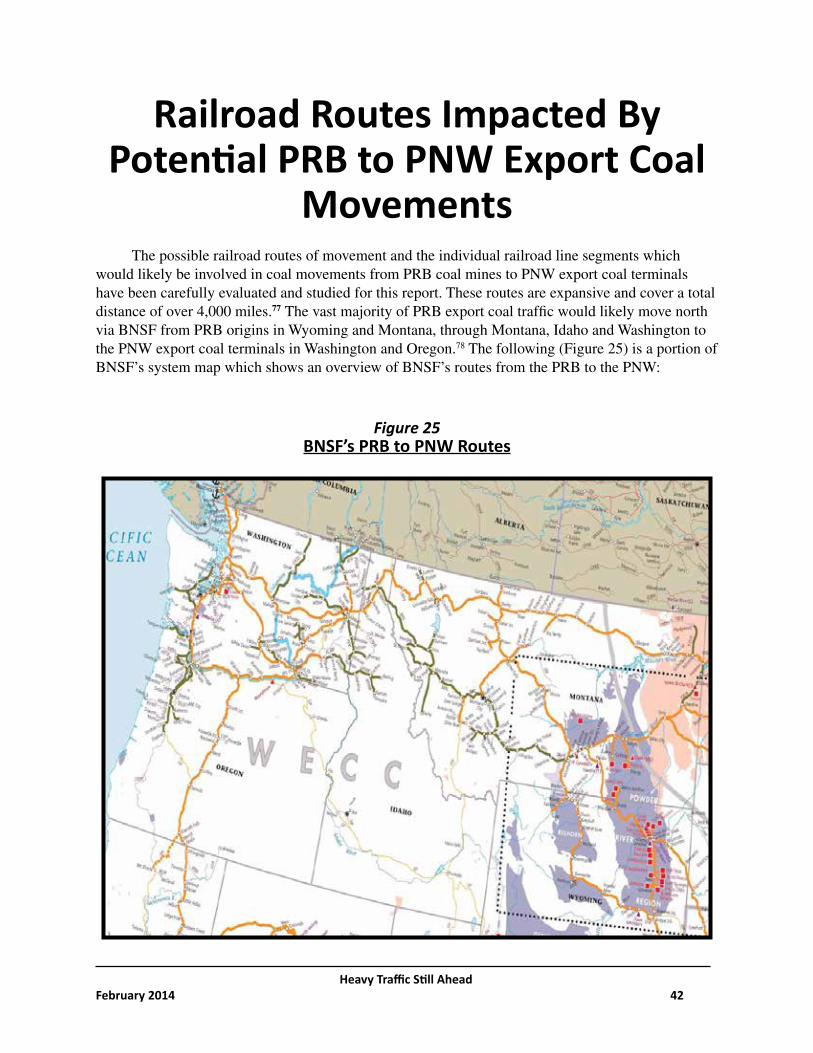
Heavy Traffic Still AheadFebruary 2014 42
Railroad Routes Impacted By Potential PRB to PNW Export Coal
MovementsThe possible railroad routes of movement and the individual railroad line segments which
would likely be involved in coal movements from PRB coal mines to PNW export coal terminals have been carefully evaluated and studied for this report. These routes are expansive and cover a total distance of over 4,000 miles.77 The vast majority of PRB export coal traffic would likely move north via BNSF from PRB origins in Wyoming and Montana, through Montana, Idaho and Washington to the PNW export coal terminals in Washington and Oregon.78 The following (Figure 25) is a portion of BNSF’s system map which shows an overview of BNSF’s routes from the PRB to the PNW:
Figure 25BNSF’s PRB to PNW Routes

Heavy Traffic Still AheadFebruary 2014 43
BNSF’s PRB to PNW routes are extensive, stretching from eastern Montana and Wyoming to the Pacific coast. These rail routes traverse many environmentally sensitive areas, such as Glacier National Park in Montana, as well as many major populated areas, such as Billings, Montana, and Spokane, Washington. The terminal operations would have impacts in areas such as Portland, Oregon, Tacoma and Seattle, Washington, as well as a host of communities along the PNW coast.
BNSF Routing OptionsBNSF has several viable routing options for PRB to PNW export coal movements, which could
(depending upon BNSF’s utilization of these routing options) lessen the impact on certain areas. However, BNSF’s routing options have operational constraints resulting from current congestion problems for the routes. These routing options would significantly broaden the potential impact area. BNSF has three viable routing options in Montana and three viable routing options in Washington from Spokane.
BNSF/MRL Route Via Helena, MontanaMontana Rail Link’s (MRL) 564.2 mile line from Mossmain, Montana (12 miles west of
Billings), to Sandpoint, Idaho, runs through Helena and Missoula, Montana, and reconnects with BNSF at Sandpoint, Idaho. MRL, which is owned by Washington Companies, assumed control of the western portion of BNSF’s mainline in Montana in 1987. MRL is considered a “bridge carrier” for BNSF as it only connects with BNSF at Huntley, Montana, and Sandpoint. BNSF retains ownership of the MRL lines until at least 2047. BNSF and MRL have a long-term lease-purchase plan for MRL to acquire the line in 2047. The MRL route is approximately 100 miles shorter than the BNSF route via Great Falls. BNSF currently uses the MRL route for PRB to PNW coal traffic to Centralia and Boardman, for export grain traffic to the PNW and for other traffic.
After the release of HTA 2012, MRL came forward with estimates of the potential increase in PRB to PNW export coal trains. Specifically, MRL maintains that it currently averages 18 total trains per day, of which 2.5 are loaded coal trains and 2.5 are empty coal trains. MRL maintains that “Potential future volume is determined by capacity. Studies indicate that, with significant infrastructure investment, capacity could increase by an additional 8 loaded and 8 empty trains per day.”79
BNSF Route Via Great Falls, MontanaBNSF’s northbound line from Mossmain, Montana, runs through Great Falls and connects to
BNSF’s main east-west “Hi-Line” at Shelby, Montana. Although the BNSF/MRL route via Helena is approximately 100 miles shorter, MRL’s capacity issues and the possible high volumes, likely mean that BNSF’s routes via Great Falls would also be heavily utilized by BNSF for export coal shipments if potential PRB to PNW coal exports are realized. This underutilized BNSF line is not equipped with Centralized Train Control (CTC) and has a significant amount of deferred maintenance. However, in the past few years, BNSF has made significant improvements to this line, including the installation of new continuous-welded rails and concrete ties and the rebuilding of bridges, which logically indicates BNSF’s anticipation of increased heavy rail traffic.

Heavy Traffic Still AheadFebruary 2014 44
BNSF’s Route Via Stevens Pass / Cascade Tunnel BNSF’s northern line from Spokane through Wenatchee, WA connects with BNSF’s north-
south line along the coast at Everett, WA. This mainline, which passes through the Cascade Tunnel, is BNSF’s major transcontinental route for double-stack intermodal container trains. Currently, this line has a capacity of 24 to 28 trains per day and is operating at 57 percent to 75 percent capacity.80
BNSF’s Route Via Columbia River GorgeThe BNSF’s Vancouver-Pasco line, which follows the Columbia River along the north side of
the Columbia River Gorge, is used by double-stack intermodal container trains moving east, grain trains moving west, and other carload traffic. The line is operating today at about 80 percent of practical capacity with an estimated capacity of 40 trains per day.81
BNSF’s Route Via Stampede Pass & TunnelThe Stampede Pass route moves south from Spokane and then west through Yakima,
connecting with BNSF’s north-south line along the coast south of Seattle, WA (Auburn). The line passes through the Stampede Tunnel and operates at a lower capacity because the ceiling of the Stampede Tunnel is too low to accommodate double-stack intermodal container trains and the grades over the Stampede Pass make it difficult to haul heavily-loaded unit trains. As a result, BNSF could use the Columbia River Gorge or Steven Pass / Cascade Tunnel routes for loaded trains and the Stampede Pass route for returning empty trains.82 In fact, according to a recent WSDOT study, this directional routing is likely.83
Heavy Traffic Still AheadFebruary 2014 45
Washington State Rail Plan In December 2006, the Washington State Transportation Commission issued a report titled
Statewide Rail Capacity and System Needs Study. The report concluded that many of the rail lines in Washington were operating at or near capacity. A report prepared for the Pacific Northwest Rail Coalition, Pacific Northwest Marine Cargo Forecast Update and Rail Capacity Assessment, issued in December 2011, reached similar conclusions. Neither of these reports, however, adequately addressed the potential adverse impacts associated with the potential high PRB to PNW export coal volumes.
On September 30, 2013, WSDOT released a public review draft of the Washington State Rail Plan. The draft State Rail Plan provides a “demand and capacity analysis based on industry-standard methodology using best available data.” The report concludes that the rail capacity constraints remain an issue:
Capacity constraints along the state’s three east-west rail corridors have been a recur-ring issue, as they affect the competitive position of the Puget Sound ports as well as the region’s freight shippers and short-lines (p.46).
The authors explain that the analyses included in the draft report do not reflect the possibility of significant increases in rail congestion from potential PRB to PNW export coal movements and Bakken to PNW oil movements, which could more than double the amount of rail traffic over many lines in Washington:
The forecast does not take into account specific known or potential developments, such as the scheduled closure of a coal-fired generating station, construction of new termi-nals for shipping coal and crude oil, or shifts in container shipping economics arising from the adoption of new technologies (p.39).
New coal export terminals proposed for construction in Washington state and elsewhere in the Pacific Northwest (including British Columbia) are not specifically included in the forecast. If completed, these projects could further increase the demands placed on the state’s rail system and accelerate the rate of growth so that capacity limits on the existing system will be met sooner (p.41).
Certainly, the report’s statement that the proposed export coal projects could “increase the demands placed on the state’s rail system” is an understatement.
Impacted Railroad Line SegmentsBNSF’s available routing options, and the lack of specific information from BNSF concerning
the potential routes and volumes, make it difficult to project with certainty the precise export volumes that could move over each route. The economics often and generally favor the shortest available route. However, there may be capacity and other issues associated with the shortest route which can limit its utilization.
Heavy Traffic Still AheadFebruary 2014 46
For example, the BNSF/MRL route is shorter than BNSF’s other routes, but capacity and contractual issues could limit or impact the amount of export coal that moves over the MRL route. Similarly, the shortest route to Cherry Point and the Canadian terminals would involve movement over BNSF’s northern line from Spokane through Wenatchee, Washington, which passes through the Cascade Tunnel and Stevens Pass, which already has serious capacity issues. This is BNSF’s major transcontinental route for double-stack intermodal container trains and time-sensitive Amtrak trains and moving coal trains through the tunnel could be an issue.
Attached as Appendix 3 are detailed analyses of the rail line segments that would be impacted by increased railroad PRB to PNW export coal movements. These analyses reflect three different time frames: 2013; 5 years (2018); and a decade (2023). The potentially impacted railroad line segments are identified (e.g., Spring Creek, MT to Decker, MT), along with the railroad (e.g., BNSF) and the miles (e.g., 8.1). For each identified rail line segment, the potential tons per year (millions of short tons) and trains per day (loaded, empty and total) are calculated. For the 2018 and 2023 calculations, the projections are based on the proposed export coal terminals operating at 100% and 75% capacity.
The individual line segment analyses were based on the best and most current information available regarding routes and capacities, and on logical assumptions, such as the use of the most direct route when possible. However, these estimates are subject to change. Because of the large potential coal volumes, it was necessary to allocate traffic over some lines which are already at or near capacity. Therefore, in these cases, it was assumed that improvements would be made to increase the capacity of these lines.
Heavy Traffic Still AheadFebruary 2014 47
Major Rail Traffic Choke Points & Bottlenecks
BNSF’s internal routing options will help distribute the tonnage and could help lessen the impact of increased coal export movement in certain areas, but the expected large coal volumes would likely result in congestion problems for the entire route. Based on this analysis, several potential major rail choke points and bottlenecks have been identified. There are two key line segments which will carry nearly all the coal traffic and represent major choke points and bottlenecks.
Huntley (Jones Jct.) to Mossmain (BNSF/MRL — 24.8 Miles) (Billings)All PRB coal shipments from the BNSF/UP Joint Line and most PRB coal shipments from
BNSF-served PRB origins would converge near Huntley, MT (Jones Jct.). From there, coal would move 24.8 miles through Billings, MT, on the MRL line to Mossmain where it could then move via BNSF’s direct route through Great Falls MT or via the shorter MRL route through Helena and Missoula, MT.
If the proposed PNW export coal terminals are built and operate at full (100%) capacity, we calculate that by 2018 approximately 85 million tons of coal from the PRB to PNW (31.28 trains per day) would move over this 25-mile line segment through Billings and by 2023 this coal volume could increase to nearly 148 million tons (54.46 trains per day).
Railroad traffic and associated problems in Billings, the largest city in Montana, have been the issue of many studies over the years. In 2004, the City of Billings, with Federal funding, conducted a Railroad Crossing Feasibility Study. The 2004 report stated that the growth of rail traffic “has resulted in traffic slowdowns, safety hazards and air pollution.” The report also concluded that the rail lines through Billings have “created a barrier” and “have played a role in the development and continuation of a social divider between downtown Billings and surrounding neighborhoods.” The report looked at various alternatives to improving railroad traffic problems and recommended improved signage, signal controls and other low-cost improvements, as well as an underpass under the railroad tracks crossing 27th Street combined with a small track shift. It estimated that the cost of implementing the recommendation would be approximately $20 million. The cost of rerouting the main tracks around the city, which would preserve the integrity of the revived downtown areas, could exceed $150 million.
The 2004 Billings report was based on an estimated 30 trains per day through Billings. This traffic level, however, excluded the potential rapid growth in PRB to PNW export coal traffic, which could result in an additional 31.28 to 54.46 loaded and empty coal trains per day through Billings, more than double the estimated 30 trains per day utilized in the report.
The 2004 Billings report did not anticipate the significant increase in Bakken oil shipments, many of which move to three refineries around Billings or through Billings to Cushing, Oklahoma and other southern destinations, and the related inbound rail shipments of tubulars, fracturing sand and other supplies to the Bakken, which have resulted in additional loaded and empty trains moving to, from and through Billings.

Heavy Traffic Still AheadFebruary 2014 48
The Billings rail yards in the last few years have become loaded with rail tank cars reflecting the rapid and substantial increase in Bakken oil rail shipments to and through Billings. With the potential for added export coal trains and existing coal, grain, intermodal, Bakken oil and other rail traffic already moving from, to and through Billings, there could be as many as 60 to 90 trains per day moving through the city in the near future.
The 2004 Billings report also considered several options that involved major track relocations, which it estimated would cost between $60 and $150 million. These track relocation options involved by-passes around Billings (south of I-90, north of I-90 and north of Billings) and the relocation of MRL’s switching yard in Billings. The report concluded that there would be major impacts associated with the track relocation options, and that they were too costly. Billings transportation planners will have to reevaluate these track relocation and by-pass options given the potential high volume of rail traffic.
Sandpoint to Spokane (BNSF — 78.3 Miles)The MRL route from Mossmain would converge with BNSF-direct coal from Shelby at
Sandpoint, ID, and move on the BNSF line through Spokane, WA. All (100%) of BNSF originated export coal to the PNW would likely move over this 78.3 mile line segment. This line is commonly known as the “Funnel,” and is the second-busiest rail corridor in Washington. According to the Spokane Regional Transportation Council (SRTC), the line currently handles 50 to 60 trains per day and has a maximum capacity of 78 trains per day.84
If the proposed PNW export coal terminals are built and operate at full (100%) capacity, we calculate that by 2018 approximately 95 million tons of coal from the PRB to PNW (35.00 trains per day), would move over this 78.3-mile line segment and by 2023 this coal volume could increase to nearly 162 million tons (59.50 trains per day).
In 2009 (with the help of $36.8 million in funding from WSDOT), a 1,330 ft. BNSF railroad tunnel was completed in Spokane, which has helped alleviate some of the rail traffic congestion. An earlier study and initiative conducted by the SRTC, known as Bridging the Valley (BTV), identified a series of projects, including 75 railroad/roadway crossings, which will separate vehicle traffic from train traffic in the 42-mile rail corridor between Athol, Idaho, and Spokane.85 To date, adequate funding has not been obtained for these projects.
The identified improvements were originally designed to handle a gradual growth in intermodal and grain traffic of up to a total of 70 trains per day.
The potential rapid growth in PRB to PNW export coal traffic (35.00 to 59.50 trains per day) and Bakken oil rail movements (22.42 trains per day) were not envisioned or considered when these improvements were first designed (2000) and approved (2006). Now, in a few short years, instead of the expected 70 trains per day, Spokane could see more than 57.42 to 81.92 loaded and empty trains per day in addition to the current volume.

Heavy Traffic Still AheadFebruary 2014 49
Other Major Rail Congestion AreasIn addition to these major choke points and bottlenecks, several other sections in the routings
are already congested and may not be able to adequately handle the expected large volumes of export coal.
Spokane to Pasco (BNSF —149.4 miles)After all potential BNSF PRB to PNW export coal trains converge on Spokane, the loaded
trains can either move west to Everett, WA, via the Cascade Tunnel at Stevens Pass, or south to Pasco, Washington. Since BNSF’s line from Spokane to Everett is already congested as a result of capacity issues associated with the Cascade tunnel, it is likely that the majority of the loaded coal trains and all of the empty coal trains moving through Spokane would move over BNSF’s line from Spokane to Pasco.
BNSF’s 149.4-mile line from Spokane to Pasco currently averages approximately 45 trains per day and has a capacity of approximately 60 trains per day.86 Washington’s draft State Rail Plan indicates that this line has the highest utilization in the state and operates at “87 percent of the practical line capacity” (p.35).
If the proposed PNW export coal terminals are built and operate at full (100%) capacity, we calculate that by 2018 approximately 71.1 million tons of coal from the PRB to PNW would move over this line segment and by 2023 this coal volume could increase to 110.51 million tons. Coal trains bound for the proposed Longview terminals (Longview and County Coal Washington) would use this line segment, as it is part of the shortest route to Longview. Although the Cascade Tunnel route offers the shortest distance to the proposed Cherry Point terminal and the current and proposed terminals in British Columbia, because of capacity issues, we have assumed that only 50% of the loaded trains and no empty trains would move over the line from Spokane to Everett and that the remaining 50% of the loaded trains and 100% of the empty trains to and from Cherry Point and the British Columbia terminals would move over the line from Spokane to Pasco.
As a result, the number of loaded and empty coal trains over this line could increase by 30.72 per day by 2018 and by over 50 trains per day by 2023, which, combined with current level of 45 trains per day, would greatly exceed its capacity of 60 trains per day. This line would likely see more empty trains than loaded trains as a result of BNSF’s recent implementation of directional routing.
BNSF’s Directional Routing over the “Iron Triangle” In order to reduce rail congestion in the PNW, in 2012, BNSF started directional routing over
certain lines, which has been called the “Iron Triangle.”87 Essentially, BNSF runs bulk unit trains in a clockwise loop, with westbound traffic moving over BNSF’s 219.8-mile line between Pasco and Vancouver, Washington, and then north over BNSF’s 155.1-mile line from Vancouver to Auburn and then east over the BNSF’s 227.5-mile Stampede Pass lines from Auburn to Pasco. This directional routing is illustrated below (Figure 26).

Heavy Traffic Still AheadFebruary 2014 50
Figure 26Illustration of BNSF’s Directional Routing Over The “Iron Triangle”
Spokane, WA
Auburn, WA 227.5 Miles
Pasco, WA
Vancouver, WA
149.4 Miles
219.8 Miles
155.1 Miles
Washington’s draft State Rail Plan maintains that BNSF’s use of directional routing has significantly increased the capacity of the Stampede Pass line from Auburn to Pasco:
Since 2012, BNSF’s directional running of empty bulk trains on the Stampede Pass route (Auburn-Pasco via Yakima) has vastly enhanced rail capacity over the previous bidirectional rail operation—by almost 300 percent—from about 10 trains per day to 39 trains per day. At present, this route handles approximately 4-6 trains per day. (p.35)
Pasco to Vancouver (Columbia River Gorge) (BNSF — 219.8 Miles)One of the most significant areas of potential rail congestion is BNSF’s 219.8-mile line
between Pasco and Vancouver, Washington, which follows the Columbia River along the north side of the Columbia River Gorge. The line is currently used by double-stack intermodal container trains moving east and grain trains moving west to PNW export grain terminals. The line currently handles approximately 45 trains per day and has a current capacity of approximately 60 trains per day.88
If proposed PNW export coal terminals are built and operate at full (100%) capacity, we calculate that by 2018 approximately 72 million tons of coal from the PRB to PNW (13.22 loaded trains per day), would move over this 219.8-mile line segment, and by 2023 this coal volume could increase to nearly 111 million tons (20.35 loaded trains per day). For this report, it has been assumed that this line would be only be used for loaded coal trains and that the empty trains would move back via the Stampede Pass route.
Heavy Traffic Still AheadFebruary 2014 51
In addition to the potential increase in PRB to PNW loaded export coal trains, this line has already seen an increase in loaded crude oil trains from Bakken to the PNW. Tesoro/Savage’s proposed oil unit-train unloading facility in Vancouver, WA would be the largest such facility in the PNW, with a proposed capacity of 360,000 barrels per day, and oil trains to the large Vancouver facility and other PNW facilities would likely move over this line. We estimate that as many as 8 loaded oil trains per day (which are, obviously, more hazardous than empty oil trains) would move over this route. The combination of the loaded coal and oil trains would constrain the existing capacity over this line.
Spokane to Everett (Cascade Tunnel) (BNSF — 301.1 Miles)BNSF’s 301.1-mile line between Everett and Spokane, Washington, which passes through
the 7.8-mile Cascade Tunnel at Stevens Pass, is the BNSF’s major northern transcontinental route for double-stack intermodal container trains and Amtrak. This line currently handles approximately 18 trains per day. Its capacity is currently restricted to 28 to 32 trains per day, primarily because of ventilation problems associated with the Cascade Tunnel, which is described by WSDOT below:
The primary capacity constraints on this segment are the approaches to the Cascade Tunnel under Stevens Pass and the throughput of the tunnel. The approaches include heavy curvature and steep grades (i.e. 2.2 percent), which require slow operation. Ad-ditionally, the tunnel restricts capacity because the air in the tunnel must be flushed between trains. Flushing takes approximately 40 minutes following eastbound trains and 20 minutes following westbound trains. The maximum sustained capacity through the tunnel is estimated at approximately 28 trains per day, with surge capacity of 30 to 32 trains per day. . . BNSF has indicated that Stevens Pass capacity will be reserved for intermodal traffic and Amtrak.89
Although BNSF has indicated that the remaining capacity “will be reserved for intermodal traffic and Amtrak,” this line also provides BNSF with the shortest route to the proposed massive Cherry Point export coal terminal (estimated to handle 27.56 million tons by 2018 and 52.91 million tons by 2023), and to the export terminals in British Columbia. BNSF’s direct route from Spokane to Cherry Point via the Cascade Tunnel route is approximately 413 miles whereas BNSF’s circuitous route via Vancouver, Washington and the Columbia River Gorge is 692 miles.
As the shortest and most direct route, the economics would favor the use of the route via the Cascade Tunnel for potential PRB to PNW export coal movements to Cherry Point and beyond to Canadian export coal terminals. The shorter route via the Cascade Tunnel would also avoid moving loaded coal trains through the major populated areas of Seattle and Tacoma. Moreover, the route via Pasco and the Columbia River Gorge is already operating near capacity.
The state of Washington has identified signaling and ventilation improvements which could be made to the Cascade Tunnel which would allow two trains in the tunnel at the same time and would significantly increase capacity on the line.90 For the purpose of this report, it is assumed that these improvements would be made and BNSF would directionally route 50% of the loaded west-bound coal trains to Cherry Point and the Canadian terminals over this line and move the empty trains via the longer Stampede Pass route.
Heavy Traffic Still AheadFebruary 2014 52
If proposed PNW export coal terminals are built and operate at full (100%) capacity, we calculate that by 2018 approximately 23 million tons of coal from the PRB to PNW (4.29 loaded trains per day), would move over this 301.1-mile line segment, and by 2023 this coal volume could increase to nearly 51 million tons (9.39 loaded trains per day).
Mossmain to Sandpoint (MRL — 564.2 Miles)MRL’s 564.2 mile line from Mossmain, MT (12 miles west of Billings), to Sandpoint, ID, runs
through Helena and Missoula, MT, and reconnects with BNSF at Sandpoint, Idaho. MRL maintains that it currently averages 18 total trains per day, of which 2.5 are loaded coal trains and 2.5 are empty. MRL maintains that “potential future volume is determined by capacity. Studies indicate that, with significant infrastructure investment, capacity could increase by an additional 8 loaded and 8 empty trains per day.”91 This report assumes that MRL would make these infrastructure improvements.
Currently, all PRB to PNW coal trains move over the MRL line from Mossmain to Sandpoint. BNSF’s northbound line from Mossmain, Montana, runs through Great Falls and connects to BNSF’s main east-west “Hi-Line” at Shelby, Montana. Although the BNSF/MRL route via Helena and Missoula is approximately 100 miles shorter, apparent MRL capacity issues and the expected high volumes likely means that BNSF routes via Great Falls would also be heavily utilized by BNSF for export coal shipments.
If proposed PNW export coal terminals are built and operate at full (100%) capacity, we calculate that by 2018 approximately 47 million tons of coal from the PRB to PNW (17.20 trains per day), would move over this line segment, and by 2023 this coal volume could increase to over 81 million tons (29.96 trains per day).
Mossmain to Shelby (BNSF — 322.9 Miles)BNSF’s 322.9-mile line from Mossmain to Shelby currently lacks Centralized Traffic Control
(CTC), which is sometimes called a “dark” line in the industry, and has a significant amount of deferred maintenance. As a result, most traffic via Mossmain currently utilizes MRL’s shorter route. For example, the rail line serving Signal Peak Mine connects with this line at Broadview, Montana, which is 35.8 miles north of Mossmain. Rather than moving north over BNSF’s line to Shelby, the Signal Peak coal to the PNW currently moves south to Mossmain before proceeding north and west over MRL’s line.
In the past few years, BNSF has made significant improvements to the line between Mossmain and Shelby, including the installation of new rails and concrete ties. As a result of these improvements and the capacity issues associated with MRL’s line, it is expected that this line would be heavily utilized for potential PRB to PNW export coal movements (i.e., 2018 – 17.80 trains per day ; 2023 – 29.54 trains per day).
As indicated in HTA 2012, the Association of American Railroads (AAR) estimates that the conversion of a line to CTC can cost up to $700,000 per mile, which would equate to over $225 million for this 322.9 mile dark line. In addition to installing CTC, double tracks would be required for certain areas and there are numerous bridges, grade crossings and other railroad-related infrastructure which would need to be expanded, upgraded or rebuilt to efficiently and effectively move the potential coal volumes from the PRB to PNW.
Heavy Traffic Still AheadFebruary 2014 53
Shelby to Sandpoint (Hi-Line) (BNSF — 337.9 Miles)BNSF’s Hi-Line is one of its highest capacity lines, handling the majority of BNSF intermodal
container traffic and westbound export grain traffic. Coal from BNSF’s Great Falls line would connect with the Hi-Line at Shelby and move west to Sandpoint. If proposed PNW export coal terminals are built and operate at full (100%) capacity, we calculate that by 2018 approximately 48 million tons of coal from the PRB to PNW (17.80 trains per day) would move over this line segment, and by 2023 this coal volume could increase to over 80 million tons (29.54 trains per day). In addition to the potential for a significant increase in PRB to PNW export coal traffic, this segment of the Hi-Line would likely handle all (100%) of the Bakken crude oil unit trains bound for the PNW, which would equal over 22 trains per day (see Figure 24).
Heavy Traffic Still AheadFebruary 2014 54
Impact on Existing Rail Traffic Many of the rail lines that would be impacted by the potential increase in export coal traffic
are already at or near capacity. Even with substantial infrastructure improvements, a significant increase in export coal trains and Bakken oil trains (as well as related construction projects) would likely significantly interrupt and disrupt other railroad traffic lanes.
Current rail traffic, such as export grain traffic and import and export intermodal container traffic, would likely experience a deterioration of rail service, such as higher transit and cycle times, and would likely incur higher costs in the form of higher freight rates and equipment costs. Amtrak passenger train traffic would also experience a deterioration of service and higher costs.
PRB to PNW export coal traffic, which would be voluminous and move in long and cost-efficient unit trains, would likely be significantly more profitable than the existing PNW import/export intermodal container traffic, which, historically, has moved in lower volumes and at rates which are only marginally profitable. The potential PRB to PNW export coal traffic would also be more voluminous and likely more profitable to BNSF than PNW export grain traffic.
As a result of the high volume and profitable revenue, PRB to PNW export coal movements and Bakken oil trains to the PNW would likely be favored by the railroads over other types of existing railroad traffic. The remaining capacity available to other railroad shippers would be limited, constrained, and more expensive. Numerous railroad shipping and logistical problems would be created by the massive increase in export coal and oil shipments. Other freight shippers would likely see increased costs and higher railroad rates as a result of rail congestion and the limitations on available rail capacity. Railroad transit times would likely increase for other railroad traffic as a result of congestion. Current rail traffic may be forced to move over more circuitous routes, which would increase private railroad equipment needs and utilization as well as related costs.
Import and Export PNW Intermodal Container TrafficAlthough the Port of Los Angeles and Long Beach, California, handles the largest number
of import and export containers (approximately 33% of total U.S. container traffic), a significant amount of container traffic moves inbound and outbound from the PNW Ports of Seattle, Tacoma and Portland. In 2009, over 3 million containers or TEU’s (twenty-foot equivalent units) were handled by these PNW Ports. PNW intermodal container traffic would likely be adversely impacted by the increased congestion from increased export coal traffic and Bakken oil shipments on BNSF’s Hi-Line and on the impacted lines in Washington and Oregon.
PNW container volumes recently increased after cargoes were shifted from Southern California to PNW due to continuing congestion problems in Southern California and the search for new gateways by shippers and carriers. PRB export coal trains and Bakken oil trains would consume and swallow up the remaining rail capacity. Intermodal transit times to and from PNW ports would be adversely impacted which would reduce the ability of the PNW container ports to compete with the Southern California ports. The following table (Figure 27) shows and compares BNSF’s current service goal hours for intermodal traffic from South Seattle, Washington, and Los Angeles, California to Chicago, Illinois:
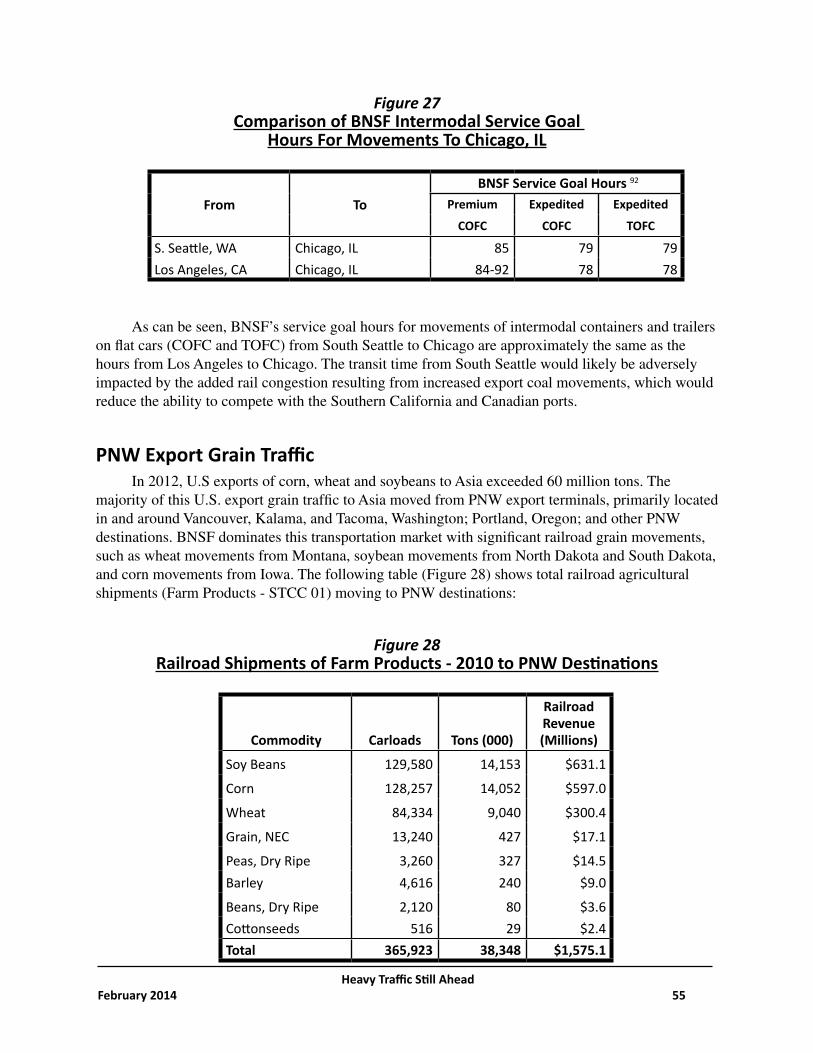
Heavy Traffic Still AheadFebruary 2014 55
Figure 27Comparison of BNSF Intermodal Service Goal
Hours For Movements To Chicago, IL
BNSF Service Goal Hours 92 From To Premium Expedited Expedited
COFC COFC TOFC
S. Seattle, WA Chicago, IL 85 79 79Los Angeles, CA Chicago, IL 84-92 78 78
As can be seen, BNSF’s service goal hours for movements of intermodal containers and trailers on flat cars (COFC and TOFC) from South Seattle to Chicago are approximately the same as the hours from Los Angeles to Chicago. The transit time from South Seattle would likely be adversely impacted by the added rail congestion resulting from increased export coal movements, which would reduce the ability to compete with the Southern California and Canadian ports.
PNW Export Grain TrafficIn 2012, U.S exports of corn, wheat and soybeans to Asia exceeded 60 million tons. The
majority of this U.S. export grain traffic to Asia moved from PNW export terminals, primarily located in and around Vancouver, Kalama, and Tacoma, Washington; Portland, Oregon; and other PNW destinations. BNSF dominates this transportation market with significant railroad grain movements, such as wheat movements from Montana, soybean movements from North Dakota and South Dakota, and corn movements from Iowa. The following table (Figure 28) shows total railroad agricultural shipments (Farm Products - STCC 01) moving to PNW destinations:
Figure 28Railroad Shipments of Farm Products - 2010 to PNW Destinations
Commodity Carloads Tons (000)
RailroadRevenue (Millions)
Soy Beans 129,580 14,153 $631.1
Corn 128,257 14,052 $597.0
Wheat 84,334 9,040 $300.4
Grain, NEC 13,240 427 $17.1
Peas, Dry Ripe 3,260 327 $14.5Barley 4,616 240 $9.0
Beans, Dry Ripe 2,120 80 $3.6Cottonseeds 516 29 $2.4Total 365,923 38,348 $1,575.1
Heavy Traffic Still AheadFebruary 2014 56
This railroad grain traffic moving to the PNW would likely be adversely impacted by an increase in congestion on the impacted lines in Washington and Oregon. In addition to the large volumes of grain moving to the PNW, the grain traffic fluctuates seasonally with increased volumes taking place after the fall harvests. As a result, traffic congestion would likely be greater during these post-harvest periods.
During the past decade, BNSF has increasingly promoted the use of 110-car shuttle trains for PNW export grain shipments. These shuttle trains would have to compete for capacity with the longer and more voluminous export coal unit trains, as well as the more profitable Bakken oil trains, which would result in higher rates for grain shippers. Grain movements use a combination of privately-owned and railroad-owned covered hoppers. Transit times are likely to increase, which would increase equipment costs. Grain traffic from smaller elevators (non-shuttle elevators), such as 48/52-car elevators in Montana, would likely be hurt the most as BNSF would continue to favor the large shuttle facilities and price out the 48/52 car facilities.
PNW Passenger & Commuter TrafficPassenger and commuter rail traffic would also be disrupted by increased rail congestion caused
by a potential increase in export coal trains. Amtrak’s Empire Builder travels daily along BNSF’s routes between Chicago, IL, Seattle, WA and Portland, OR. Amtrak serves many stations along the impacted route, including Shelby, Cut Bank, Browning, East Glacier Park, Essex, West Glacier, Whitefish, and Libby, Montana; Sandpoint, Idaho; Spokane, Pasco, Wishram, Bingen, Vancouver, Ephrata, Wenatchee, Leavenworth, Everett, Edmonds, and Seattle, Washington; and Portland, Oregon. This Amtrak service would likely be disrupted and impacted by the increase in congestion caused by increased export coal train traffic. Freight congestion has caused massive delays and even cancellations of a popular Amtrak train in recent months, a situation that could worsen as one of the nation’s largest rail corporations plans to increase shipments of fossil fuels on much of the route,93 according to an article by Curtis Tate of the McClatchy Washington Bureau in December, 2013.
Amtrak also operates Amtrak Cascades Intercity Passenger Rail, which is sponsored by ticket-buying passengers, the states of Washington and Oregon, and Amtrak. Amtrak Cascades service operates on the same railroad tracks as freight trains, makes a limited number of stops, and connects central cities between Vancouver, BC and Eugene, OR.
Sound Transit’s Sounder Commuter offers commuter rail service between Tacoma and downtown Seattle with stops in Puyallup, Sumner, Auburn, Kent, and Tukwila, and between Everett and downtown Seattle with stops in Edmonds and Mukilteo. It shares the same railroad tracks as freight trains and Amtrak. In contrast to Amtrak, Sounder commuter rail makes frequent stops along the 70-mile corridor between Everett and Tacoma, with service currently provided only during the weekday morning and evening commute hours. Sounder commuter trains make additional stops along the route at Mukilteo, Auburn, Kent, Sumner, Puyallup, and Tacoma’s Tacoma Dome station. Sound Transit service would likely be disrupted and impacted by the increase in congestion caused by increased export coal train traffic.
Heavy Traffic Still AheadFebruary 2014 57
Regulatory ReviewThere are many areas along the impacted railroad routes which would require significant
mitigation in order to alleviate the adverse impacts associated with the significant increase in coal traffic that wuld result if coal export projects are developed and operate at their planned capacity. State and local governments and other impacted and interested parties may have little input into related rail infrastructure requirements and needs.
Cherry Point and Longview are currently undergoing an environmental review process. The U.S. Army Corps of Engineers (USACE) is serving as the lead federal agency in the preparation of Environmental Impact Statements (EIS’s) associated with the local improvements and installations. USACE has declined to address cumulative impacts under the National Environmental Policy Act (NEPA) and, in any event, USACE has no authority over interstate railroad movements. As a result, the USACE permitting process does not provide a public forum to address rail infrastructure requirements and needs that would be created by an increase in export coal rail shipments.
The Surface Transportation Board (STB) is an economic regulatory agency that Congress has charged with resolving railroad rate and service disputes and reviewing proposed railroad mergers. STB cases have often involved mitigation resulting from increased railroad traffic levels and several cases have involved the proposed expansion of PRB coal movements.
In the 1995 railroad merger between UP and Southern Pacific (UP/SP), the city of Reno, Nevada, along with many other cities and impacted parties, protested the merger, which required STB approval, because of the predicted 40 to 50 trains per day which would run through town as a result of the merger. Mitigation for Reno was a very expensive undertaking because the railroad tracks run through the heart of Reno’s casino district. Several alternatives were considered and discarded, including track relocation or by-pass and a tunnel. After a decade of litigation and negotiations, an agreement was finally reached to excavate a 2.25-mile long, 33-feet-deep, and 54-foot-wide trench through the city, which was not completed until 2005. The Reno trench cost an estimated $265 million, excluding debt.
Other potential expansions of railroad PRB coal movements have also been under the jurisdiction of, and the subject of approval by, the STB, including the application filed by the Dakota, Minnesota & Eastern Railroad Corporation (DM&E) to construct and operate 280 miles of new rail line and the rehabilitation of approximately 600 miles of existing rail line in Wyoming, South Dakota, and Minnesota. The STB is currently reviewing the revised Tongue River Railroad Company (TRRC) application to construct a new 42-mile line from Colstrip to the Otter Creek Mine near Ashland, MT to access PRB coal.
In the DM&E case, the railroad projected the movement of up to 100 million tons of coal through either populated or environmentally sensitive areas, or both. The STB prepared a Draft and a Final EIS. The STB conducted biological surveys for threatened and endangered species and cultural resource surveys for archaeological sites and historic structures. Additionally, the STB gathered extensive data on air quality, crossing safety and potential delays, railroad and vehicular traffic volumes, wetlands and aquatic resources, noise receptors, wildlife migration, and potential impacts to ranching operations. There was extensive public involvement in the development of the original EIS. STB worked with five cooperating Federal agencies, conducted dozens of meetings

Heavy Traffic Still AheadFebruary 2014 58
and received approximately 10,000 comments from agencies, elected officials, tribes, organizations, businesses, affected communities, landowners, and other members of the public. As a result, the STB identified and examined potential environmental impacts associated with the project and ordered 147 environmental conditions.
The DM&E proposal involved the construction of new rail lines in order to access PRB coal, whereas the rail construction associated with the proposed PNW export terminals primarily involves the construction of railroad track, storage areas and unloading facilities. The size, scope and problems associated with DM&E’s proposed PRB coal project are similar in many respects to the proposals to move PRB export coal tonnage to the PNW: the same commodity (coal); the same origin area (the PRB); similar distances; and similar congestion and environmental problems. Indeed, as illustrated in the following table (Figure 29), the traffic levels and adverse impacts associated with proposed expansion of PRB to PNW export coal movements are likely much bigger than with the DM&E.
Figure 29Comparison of Potential PRB to PNW Export Coal Volumes
With Projected Coal Volumes With DM&E
Potential PRB to PNW Export Coal VolumesLow High
PRB to PNW Export Coal Tons Per Year (Millions) 128 170PRB to PNW Export Coal Trains Per Day (Loaded and Empty) 47 63
Projected DM&E PRB to U.S. Coal VolumesLow High
DM&E Proposed PRB Coal Tons Per Year (Millions) 20 100DM&E Proposed PRB Coal Trains Per Day (L&E) 8 34
The STB is currently reviewing TRRC’s revised application. The STB’s Draft Scope of Study has been revised to reflect that the EIS will evaluate the potential downline rail traffic congestion as well as road traffic congestion at road/rail grade crossings resulting from increased transaction-related rail line traffic. The EIS will describe the existing road/rail grade crossing delay and analyze the potential for an increase in delay related to the proposed rail operations.94
However, the STB is not a participating agency in EIS processes associated with the proposed Longview and Cherry Point export terminals. Therefore, neither the STB or any other government agency is addressing the whole picture from end to end and, the STB is not positioned to impose mitigating conditions, which could help alleviate congestion problems that would result from an increase in PRB to PNW export coal movements.
Heavy Traffic Still AheadFebruary 2014 59
ConclusionsIf the plans to expand existing PNW coal terminals and construct new PNW coal terminals proceed
and if these terminals operate at full capacity (100%), we calculate that, by 2018, PRB to PNW export coal movements could reach 98.92 million tons per year, which equates to 36.44 loaded and empty trains per day. By 2023, PRB to PNW export coal movements could reach 170.32 million tons per year, which equates to 62.74 loaded and empty trains per day. Even if one assumes that these terminals would operate at 75% capacity, we calculate that, by 2018, PRB to PNW export coal movements could reach 74.19 million tons per year, which equates to 27.32 loaded and empty trains per day. By 2023, PRB to PNW export coal movements could reach 127.74 million tons per year, which equates to 47.06 loaded and empty trains per day.
These loaded and empty coal trains (27 to 63 trains per day), along with up to 22.42 Bakken oil trains, would go through numerous populated cities, towns, communities, parks, forests and other environmentally sensitive areas -- blocking traffic, causing vehicular and railroad traffic congestion, creating logistics problems, adversely impacting wildlife, polluting the air, lakes and rivers, and ground, creating noise, and resulting in numerous other related problems.
BNSF would likely dominate this large and expanding PRB to PNW export coal market. BNSF’s routes from the PRB to the PNW are significantly shorter than UP’s routes and BNSF has a lower cost structure. As a result, BNSF can provide transportation rates which are significantly lower than UP and thus would likely capture the lion’s share of an expanding and lucrative PRB to PNW export coal market.
BNSF’s shortest PRB to PNW railroad route covers a distance of 1,135 miles, but the potentially impacted area is extremely broad covering a total rail distance of over 4,000 miles. These railroad routes traverse many environmentally sensitive areas, such as Glacier National Park in Montana, as well as many major populated areas, such as Sheridan, Wyoming; Spokane and Seattle, Washington; Billings, Montana; and Portland, Oregon.
Many of the impacted railroad line segments already have significant rail capacity and congestion issues associated with current rail traffic, such as PNW import and export intermodal container traffic and grain railroad traffic. As a result of these capacity and congestion problems, there are many areas which would require major upgrading and expansion of existing railroad tracks.
In some cases (such as in Sheridan, Spokane and Billings) new rail by-passes may be required around populated areas. It is likely that hundreds of miles of railroad lines would require expansion from single to double or even triple track. Other railroad infrastructure, such as bridges, tunnels, highway crossings, track and ties, would also need to be replaced or upgraded in order to adequately, efficiently and safely handle the expected traffic levels.
There are many areas along the impacted railroad routes which would require significant mitigation to alleviate the adverse impacts associated with a potential significant increase in coal traffic. The required upgrading and expansion of railroad tracks and related infrastructure could well cost billions of dollars. Although BNSF has already secured millions in federal funding to upgrade its privately-owned track in Washington, state and local governments would likely bear the brunt and burden of related local costs and would likely be required to spend hundreds of millions of dollars in related mitigation, litigation, debt and other costs associated with the necessary improvements to accommodate export coal traffic levels.
Heavy Traffic Still AheadFebruary 2014 60
Endnotes1 http://heavytrafficahead.org
2 http://www.wsdot.wa.gov/funding/stimulus/passengerrail.htm
3 http://www.westshore.com/beyond.html
4 http://portmetrovancouver.com/en/projects/OngoingProjects/Tenant-Led_Projects/Neptune Terminals.aspx
5 http://investnorthwestbc.ca/major-projects-and-investment-opportunities/map-view/prince-rupert/ridley-terminals-expansion
6 http://news.archcoal.com/phoenix.zhtml?c=107109&p=irol-newsArticle&ID=1517028&highlight
7 http://www.ecy.wa.gov/geographic/gatewaypacific
8 http://www.ecy.wa.gov/geographic/millennium
9 http://portmetrovancouver.com/en/projects/ongoingprojects/Tenant-Led_Projects/FraserSurreyDocks.aspx
10 http://asx.com.au/asxpdf/20130423/pdf/42fdz0vzp8g41k.pdf
11 See HTA 2012, page 3.
12 http://sustainablebusinessoregon.com/national/2012/11/bnsf-coal-trains-wont-congest-puget.html
13 http://www.columbian.com/news/2012/aug/23/bnsf-railway-ceo-sounds-pacific-northwest-coal-exp/
14 http://billingsgazette.com/news/state-and-regional/montana/billionaire-buys-part-of-tongue-river-railroad/article_42e012c8-b2a4-5062-a7c1-96b692f1707b.html
15 http://www.tonguerivereis.com/documents/STB_Filing_TRRC_ApplicationSupplement_12172012.pdf
16 http://news.archcoal.com/phoenix.zhtml?c=107109&p=irol-newsArticle&ID=1515428&highlight
17 http://www.bnsf.com/customers/pdf/mineguide.pdf
18 http://cloudpeakenergy.com/investor-relations/press-releases
19 http://www.ambreenergy.com/board
20 http://www.ambreenergy.com/decker-mine
21 http://www.columbian.com/news/2012/jul/18/lawsuit-clouds-ambre-energys-coal-export-plans
22 http://www.columbian.com/news/2012/jul/18/lawsuit-clouds-ambre-energys-coal-export-plans
23 http://tdn.com/news/state-and-regional/washington/ambre-energy-s-montana-coal-mine-deal-beset-by-financ-ing/article_f94ae866-e5c5-11e2-80e5-0019bb2963f4.html
24 http://phx.corporate-ir.net/phoenix.zhtml?c=232126&p=irol-newsArticle_pf&ID=1711148&highlight=
25 http://www.bloomberg.com/article/2012-07-02/avhrmqRurxq4.html
26 http://www.sheridanmedia.com/news/update-youngs-creek-mine11212
27 http://www.platts.com/latest-news/coal/Washington/Sale-of-Canadian-Ridley-coal-terminal-could-bring-21162923
28 http://www.bnsf.com/employees/communications/bnsf-news/2012/september/2012-09-04-a.html
29 http://www.bnsf.com/customers/oil-gas/ship-drilling-materials-benefits.html
30 http://mynorthwest.com/174/2319532/Vancouver-port-commission-OKs-oil-train-terminal
31 http://news.nationalgeographic.com/news/energy/2013/07/130711-oil-train-crash-five-key-issues
32 http://www.bnsf.com/media/news-releases/2013/august/2013-08-19a.html
33 http://www.bnsf.com/media/news-releases/2013/august/2013-08-15b.html
34 http://www.wsdot.wa.gov/News/2011/07/28_BNSFAgreement.htm
Heavy Traffic Still AheadFebruary 2014 61
35 http://www.wsdot.wa.gov/projects
36 Developed by WORC based on public information.
37 http://createnwjobs.com/assets/content/Alliance_Factsheet_Job_Creation_2013_FINAL_7_1.pdf
38 http://www.bber.umt.edu/pubs/Econ/Spring%20Creek%20Mine%20Report.pdf
39 http://www.wsfb.com/system/files/Globerman,+WAFB+Export+Paper.pdf
40 https://www.friendsofbnsf.com/sites/default/files/Custer10_24_12.pdf
41 http://sustainablebusinessoregon.com/national/2012/11/bnsf-coal-trains-wont-congest-puget.html
42 http://www.coaltrainfacts.org/docs/GTC-Bham.pdf
43 http://www.montanarail.com/coalfacts.php
44 http://www.platts.com/latest-news/coal/Washington/Union-Pacific-looks-to-Mexico-as-US-coal-de-mand-6202450
45 http://www.up.com/investors/attachments/presentations/2012/citi_slides.pdf
46 http://www.ambreenergy.com/black-butte-mine
47 http://wyia.org/wp-content/uploads/2013/05/evrett.pdf
48 http://www.wstc.wa.gov/Rail/RailFinalReport.pdf
49 http://www.westshore.com
50 In the 4th Quarter of 2012, Westshore completed a five-year, $100 million equipment upgrade. Westshore is on a peninsula which limits the physical expansion of the terminal.
51 Ibid
52 http://www.teck.com/Generic.aspx?PAGE=Teck+Site%2fMedia+Pages%2fMedia+Detail &releaseNumber=11-09-TR&portalName=tc
53 http://www.westshore.com/pdf/news/2012/nov19.pdf
54 http://www.mining.com/grande-cache-coal-corporation-announces-new-handling-agreement-with-westshore-terminals-limited-partnership/
55 http://www.gccoal.com/upload/media_element/49/01/corporate-presentation---august-2011.pdf
56 http://cloudpeakenergy.com/investor-relations/press-releases/
57 http://phx.corporate-ir.net/phoenix.zhtml?c=232126&p=irol-newsArticle&ID= 1813252&highlight=
58 http://billingsgazette.com/news/state-and-regional/montana/swiss-company-with-russian-ties-buys-into-signal-peak-coal/article_5b349520-a087-5b9a-b1ad-aa5558ee1514.html
59 http://www.rti.ca/en_terminalprofile.html
60 According to the Ridley Terminals, Inc. 2010 Annual Report, in early 2011 Ridley Terminals Inc. signed an amended long-term terminal services agreement with Western Coal Corp. and entered into a multi-year ter-minal service agreement with Arch Coal Sales Company, Inc. The Arch Coal agreement is for coal exports which originate from the PRB (page 26).
61 http://news.archcoal.com/phoenix.zhtml?c=107109&p=irol-newsArticle&ID=1517028&highlight
62 http://www.fin.gc.ca/n12/12-163-eng.asp
63 The Fraser Surrey Dock proposal was not reflected in HTA 2012.
64 http://www.co.whatcom.wa.us/pds/plan/current/gpt-ssa/pdf/20120319-permit-submittal.pdf
65 http://www.ecy.wa.gov/geographic/millennium/20120222_JARPAapplication.pdf
66 http://www.countycoal.com/index.php/infrastructure-projects/canadian-bulk-export-terminal
67 http://www.businesswire.com/news/home/20130430006265/en/Cloud-Peak-Energy-Announces-Results-Quar-ter-2013

Heavy Traffic Still AheadFebruary 2014 62
68 http://marketrealist.com/2013/07/wti-bakken-spread-widens-slightly-but-still-relatively-small-and-stable/
69 http://www.progressiverailroading.com/canadian_pacific/article/Canadian-Pacific-rides-the-crudeoil-wave--35443
70 http://phx.corporate-ir.net/phoenix.zhtml?c=79122&p=irol-newsArticle&ID=1759180&highlight=anacortes
71 http://www.goskagit.com/all_access/shell-considers-rail-loop-for-bakken-crude/article_117f6919-350e-539d-b38d-4c8bb694aebf.html
72 http://oilspot2.dtnenergy.com/e_article002668448.cfm?x=b11,0,w
73 http://www.bellinghamherald.com/2012/11/30/2786221/bp-taking-next-steps-on-rail-project.html
74 http://www.thenewstribune.com/2013/01/27/2451203/jumping-aboard-north-dakotas-oil.html
75 http://www.chevroncap.com/files/documents/Attachment-2-Burnaby-Refinery-Crude-Supply-Overview_Nov212012.pdf
76 http://www.sightline.org/wp-content/uploads/downloads/2013/10/crude-oil-by-rail_October-2013-Update.pdf
77 The more than 4,000 route miles which could be impacted does not inlcude potential coal movements via UP’s southern routes through Wyoming, Colorado, Utah , Idaho and Oregon, or the miles in British Columbia to Prince Rupert, which were not analyzed in this study.
78 There are other BNSF routing options, such as the movement south from the PRB mines and then west with the utilization of UP’s routes west though Colorado, Utah and then north through Idaho and Oregon (BNSF has trackage rights over a portion of the UP’s Central Corridor route), but these other routing options are more circuitous.
79 http://www.montanarail.com/coalfacts.php
80 Washington State 2010-2030 Freight Rail Plan, page 3-28.
81 Ibid.
82 Ibid. These three alternative routes in Washington have some common line segments. For example, both the Stampede Pass and Columbia River Gorge routes would use the line segment from Spokane to Pasco, WA, and the Stevens Pass/Cascade Tunnel and Stampede Pass routes would use the line from Auburn to Longview, WA.
83 http://www.mcmillan.ca/Handling-Agreement-with-Teck-Resources-Announced
84 http://earthfix.opb.org/communities/article/northwest-railroads-already-congested
85 http://www.srtc.org/btv.html
86 http://www.wsdot.wa.gov/NR/rdonlyres/E1743FB8-9376-4A4C-8316-14283E42A5F7/0/PNW2011PortRailFore-castFinalReport.pdf
87 http://www.yakimaherald.com/news/livenews/1538792-8/the-state-of-freight-in-the-yakima-valley
88 http://www.wsdot.wa.gov/NR/rdonlyres/E1743FB8-9376-4A4C-8316-14283E42A5F7/0/PNW2011PortRailFore-castFinalReport.pdf
89 http://www.wsdot.wa.gov/NR/rdonlyres/E1743FB8-9376-4A4C-8316-14283E42A5F7/0/PNW2011PortRailFore-castFinalReport.pdf
90 http://www.wstc.wa.gov/rail/RailFinalReport.pdf
91 http://www.montanarail.com/coalfacts.php
92 Source: BNSF. COFC = Container on Flat Car. TOFC = Trailer on Flat Car93 http://www.mcclatchydc.com/2013/12/23/212551/oil-grain-trains-squeeze-amtraks.html
94 http://www.stb.dot.gov/decisions/readingroom.nsf/WEBUNID/B72DE182F5E0673A85257B33006CC07A?OpenDocument

Heavy Traffic Still AheadFebruary 2014 63
Appendix 1Responses from MRL and UP to WORC’s Request for Information
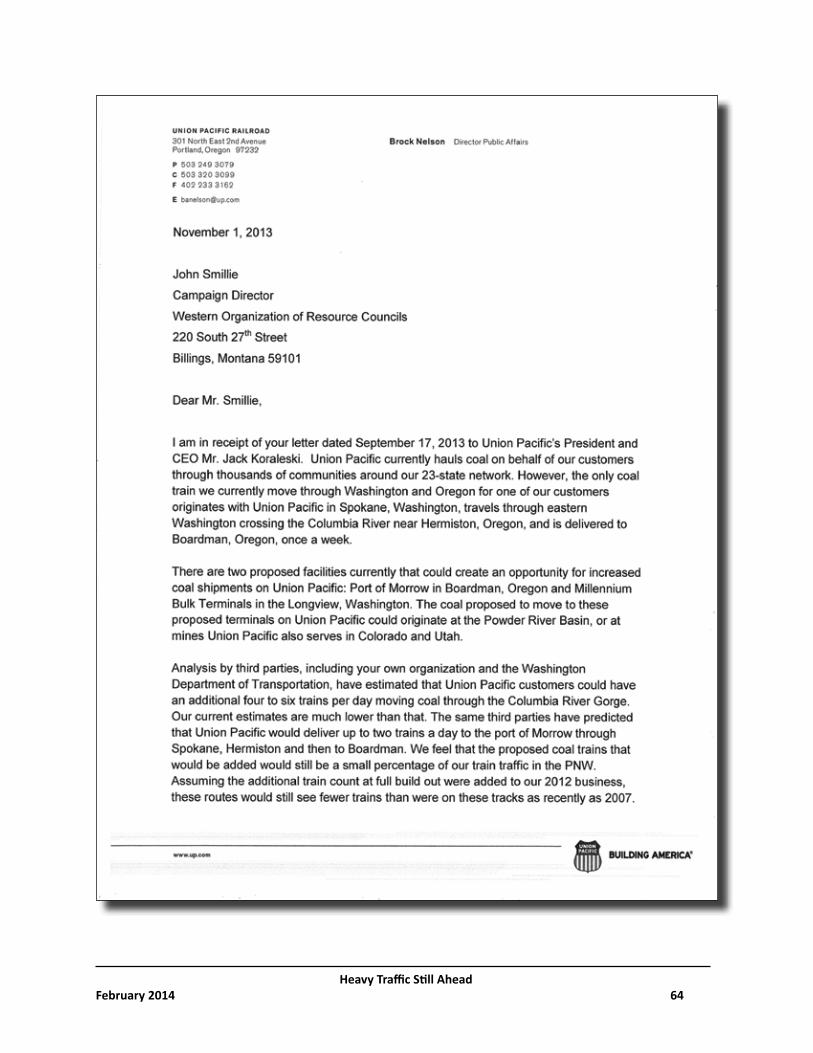
Heavy Traffic Still AheadFebruary 2014 64

Heavy Traffic Still AheadFebruary 2014 65

Heavy Traffic Still AheadFebruary 2014 66
Appendix 2Railroad Line Segments Impacted by Bakken Crude Oil Shipments
to PNW Terminals
Heavy Traffic Still AheadAppendix 2
Loaded Empty Total
Tesoro/Savage - Vancouver, WA BNSF ----- 360,000 5.14 5.14 10.28
BP Refinery - Ferndale, WA BNSF ----- 70,000 1.00 1.00 2.00
Imperium Terminals - Hoquiam, WA BNSF ----- 70,000 1.00 1.00 2.00
Shell Rrefinery - Anacortes, WA BNSF ----- 60,000 0.86 0.86 1.72
Tesoro Refinery - Anacortes, WA BNSF ----- 50,000 0.71 0.71 1.42
U.S. Development - Hoquiam, WA BNSF ----- 50,000 0.71 0.71 1.42
Phillips 66 Refinery - Ferndale, WA BNSF ----- 35,000 0.50 0.50 1.00
U.S. Oil and Refining - Tacoma, WA BNSF ----- 35,000 0.50 0.50 1.00
Global Partners - Clatskanie, OR BNSF ----- 28,600 0.41 0.41 0.82
Westway Terminals - Hoquiam, WA BNSF ----- 26,300 0.38 0.38 0.76
Total 784,900 11.21 11.21 22.42
Williston, ND to Snowden, MT (Hi-Line) (Assumes 100% from Williston) BNSF 26.0 1,484,900 21.21 21.21 42.42
Snowden, MT to Billings, MT (Est. to Non-PNW Destinations via Billings) BNSF 305.0 700,000 10.00 10.00 20.00
Snowden, MT to Shelby, MT (Hi-Line) BNSF 389.0 784,900 11.21 11.21 22.42
Shelby, MT to Sandpoint, ID (Hi-Line) BNSF 337.9 784,900 11.21 11.21 22.42
Sandpoint, ID to Spokane, WA BNSF 70.5 784,900 11.21 11.21 22.42
Spokane, WA (Latah Jct.) to Everett, WA (Stevens Pass / Cascade Tunnel) BNSF 301.1 215,000 3.07 0.00 3.07
Everett, WA to Burlington, WA BNSF 39.0 215,000 3.07 3.07 6.14
Burlington,WA to Anacortes, WA BNSF 16.0 110,000 1.57 1.57 3.14
Burlington, WA to Bellingham, WA BNSF 24.0 105,000 1.50 1.50 3.00
Bellingham, WA to Ferndale, WA BNSF 9.0 105,000 1.50 1.50 3.00
Everett, WA to Auburn, WA (via Seattle, WA) BNSF 55.6 0 0.00 3.07 3.07
Spokane, WA to Pasco, WA BNSF 149.4 569,900 8.14 11.21 19.35
Pasco, WA to Vancouver, WA (Columbia River Gorge Route) BNSF 219.8 569,900 8.14 0.00 8.14
Vancouver, WA to Clatskine, OR BNSF/UP 65.0 28,600 0.41 0.41 0.82
Vancouver, WA to Longview, WA BNSF 35.4 181,300 2.59 5.55 8.14
Longview, WA to Centralia, WA BNSF 47.1 181,300 2.59 5.55 8.14
Centralia, WA to Hoquiam, WA BNSF 57.0 146,300 2.09 2.09 4.18
Centalia, WA to Tacoma, WA BNSF 50.0 35,000 0.50 6.05 6.55
Tacoma, WA to Auburn, WA BNSF 18.0 0 0.00 6.05 6.05
Pasco, WA to Auburn, WA (Stampede Tunnel Route) (Empty Only) BNSF 227.5 0 0.00 11.21 11.21
Total Rail Miles Impacted ------- 2,442.3 ------- ------- ------- -------
Bakken Crude Oil Shipments to PNW TerminalsRailroad Line Segments Impacted By
Railroad Miles Barrels Per Day
Trains Per DayDestination / Line Segment
Page 1 of 1
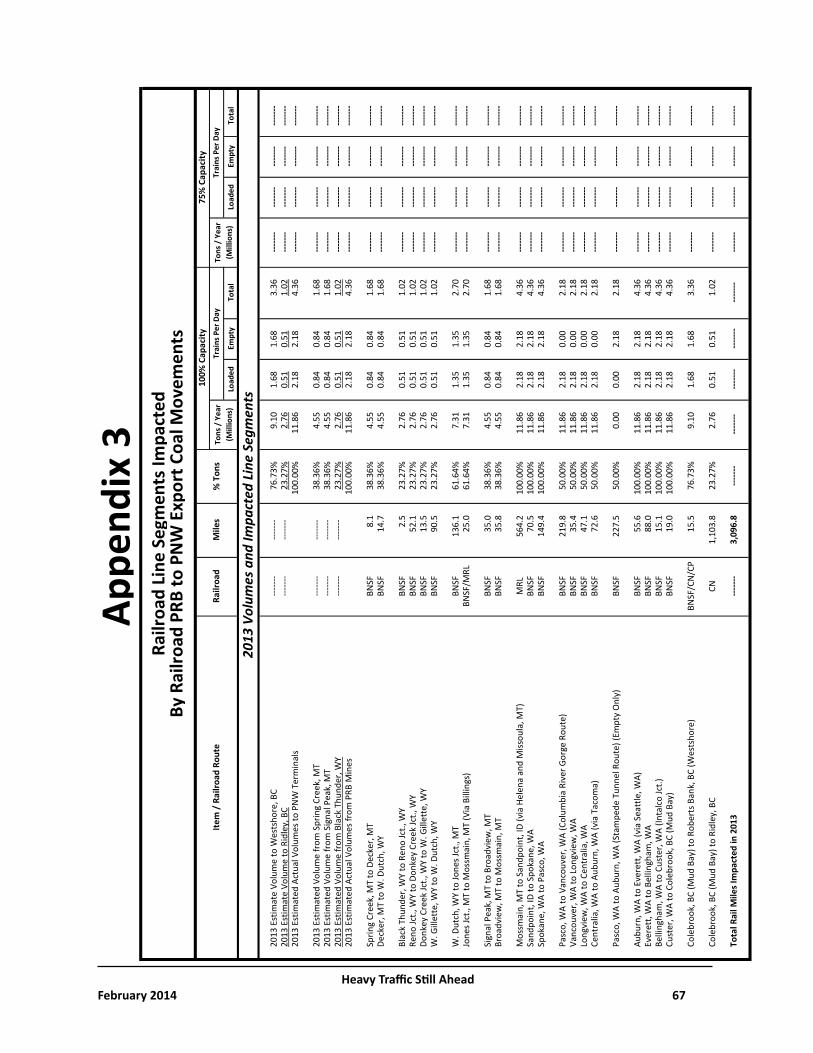
Heavy Traffic Still AheadFebruary 2014 67
Appe
ndix
3Ra
ilroa
d Li
ne S
egm
ents
Impa
cted
by
Railr
oad
PRB
to P
NW
Exp
ort C
oal M
ovem
ents
Heav
y Tr
affic
Stil
l Ahe
adAp
pend
ix 4
Load
edEm
pty
Tota
lLo
aded
Empt
yTo
tal
2013
Est
imat
e Vo
lum
e to
Wes
tsho
re, B
C---
----
------
-76
.73%
9.10
1.68
1.68
3.36
------
----
----
------
----
----
2013
Est
imat
e Vo
lum
e to
Rid
ley,
BC
------
----
----
23.2
7%2.
760.
510.
511.
02---
----
------
----
----
------
-20
13 E
stim
ated
Act
ual V
olum
es to
PN
W T
erm
inal
s10
0.00
%11
.86
2.18
2.18
4.36
------
----
----
------
----
----
2013
Est
imat
ed V
olum
e fr
om S
prin
g Cr
eek,
MT
------
----
----
38.3
6%4.
550.
840.
841.
68---
----
------
----
----
------
-20
13 E
stim
ated
Vol
ume
from
Sig
nal P
eak,
MT
------
----
----
38.3
6%4.
550.
840.
841.
68---
----
------
----
----
------
-20
13 E
stim
ated
Vol
ume
from
Bla
ck T
hund
er, W
Y---
----
------
-23
.27%
2.76
0.51
0.51
1.02
------
----
----
------
----
----
2013
Est
imat
ed A
ctua
l Vol
umes
from
PRB
Min
es10
0.00
%11
.86
2.18
2.18
4.36
------
----
----
------
----
----
Sprin
g Cr
eek,
MT
to D
ecke
r, M
TBN
SF8.
138
.36%
4.55
0.84
0.84
1.68
------
----
----
------
----
----
Deck
er, M
T to
W. D
utch
, WY
BNSF
14.7
38.3
6%4.
550.
840.
841.
68---
----
------
----
----
------
-
Blac
k Th
unde
r, W
Y to
Ren
o Jc
t., W
Y BN
SF2.
523
.27%
2.76
0.51
0.51
1.02
------
----
----
------
----
----
Reno
Jct.,
WY
to D
onke
y Cr
eek
Jct.,
WY
BNSF
52.1
23.2
7%2.
760.
510.
511.
02---
----
------
----
----
------
-Do
nkey
Cre
ek Jc
t., W
Y to
W. G
illet
te, W
YBN
SF13
.523
.27%
2.76
0.51
0.51
1.02
------
----
----
------
----
----
W. G
illet
te, W
Y to
W. D
utch
, WY
BNSF
90.5
23.2
7%2.
760.
510.
511.
02---
----
------
----
----
------
-
W. D
utch
, WY
to Jo
nes J
ct.,
MT
BNSF
136.
161
.64%
7.31
1.35
1.35
2.70
------
----
----
------
----
----
Jone
s Jct
., M
T to
Mos
smai
n, M
T (V
ia B
illin
gs)
BNSF
/MRL
25.0
61.6
4%7.
311.
351.
352.
70---
----
------
----
----
------
-
Sign
al P
eak,
MT
to B
road
view
, MT
BNSF
35.0
38.3
6%4.
550.
840.
841.
68---
----
------
----
----
------
-Br
oadv
iew
, MT
to M
ossm
ain,
MT
BNSF
35.8
38.3
6%4.
550.
840.
841.
68---
----
------
----
----
------
-
Mos
smai
n, M
T to
San
dpoi
nt, I
D (v
ia H
elen
a an
d M
issou
la, M
T)
MRL
564.
210
0.00
%11
.86
2.18
2.18
4.36
------
----
----
------
----
----
Sand
poin
t, ID
to S
poka
ne, W
ABN
SF70
.510
0.00
%11
.86
2.18
2.18
4.36
------
----
----
------
----
----
Spok
ane,
WA
to P
asco
, WA
BNSF
149.
410
0.00
%11
.86
2.18
2.18
4.36
------
----
----
------
----
----
Pa
sco,
WA
to V
anco
uver
, WA
(Col
umbi
a Ri
ver G
orge
Rou
te)
BNSF
219.
850
.00%
11.8
62.
180.
002.
18---
----
------
----
----
------
-Va
ncou
ver,
WA
to L
ongv
iew
, WA
BNSF
35.4
50.0
0%11
.86
2.18
0.00
2.18
------
----
----
------
----
----
Long
view
, WA
to C
entr
alia
, WA
BNSF
47.1
50.0
0%11
.86
2.18
0.00
2.18
------
----
----
------
----
----
Cent
ralia
, WA
to A
ubur
n, W
A (v
ia T
acom
a)BN
SF72
.650
.00%
11.8
62.
180.
002.
18---
----
------
----
----
------
-
Pasc
o, W
A to
Aub
urn,
WA
(Sta
mpe
de T
unne
l Rou
te) (
Empt
y O
nly)
BNSF
227.
550
.00%
0.00
0.00
2.18
2.18
------
----
----
------
----
----
Aubu
rn, W
A to
Eve
rett
, WA
(via
Sea
ttle
, WA)
BNSF
55.6
100.
00%
11.8
62.
182.
184.
36---
----
------
----
----
------
-Ev
eret
t, W
A to
Bel
lingh
am, W
ABN
SF88
.010
0.00
%11
.86
2.18
2.18
4.36
------
----
----
------
----
----
Belli
ngha
m, W
A to
Cus
ter,
WA
(Inta
lco
Jct.)
BNSF
15.1
100.
00%
11.8
62.
182.
184.
36---
----
------
----
----
------
-Cu
ster
, WA
to C
oleb
rook
, BC
(Mud
Bay
) BN
SF19
.010
0.00
%11
.86
2.18
2.18
4.36
------
----
----
------
----
----
Cole
broo
k, B
C (M
ud B
ay) t
o Ro
bert
s Ban
k, B
C (W
ests
hore
)BN
SF/C
N/C
P15
.576
.73%
9.10
1.68
1.68
3.36
------
----
----
------
----
----
Cole
broo
k, B
C (M
ud B
ay) t
o Ri
dley
, BC
CN1,
103.
823
.27%
2.76
0.51
0.51
1.02
------
----
----
------
----
----
Tota
l Rai
l Mile
s Im
pact
ed in
201
3---
----
3,09
6.8
------
----
----
------
----
----
------
----
----
------
----
----
------
-
2018
Vol
umes
and
Impa
cted
Lin
e Se
gmen
ts
By R
ailro
ad P
RB to
PN
W E
xpor
t Coa
l Mov
emen
ts
2013
Vol
umes
and
Impa
cted
Lin
e Se
gmen
ts
Railr
oad
Line
Seg
men
ts Im
pact
ed
Trai
ns P
er D
ayTo
ns /
Yea
r (M
illio
ns)
Railr
oad
Mile
sTo
ns /
Yea
r (M
illio
ns)
Trai
ns P
er D
ay
100%
Cap
acity
75%
Cap
acity
Item
/ R
ailro
ad R
oute
% T
ons
Page
1 o
f 5
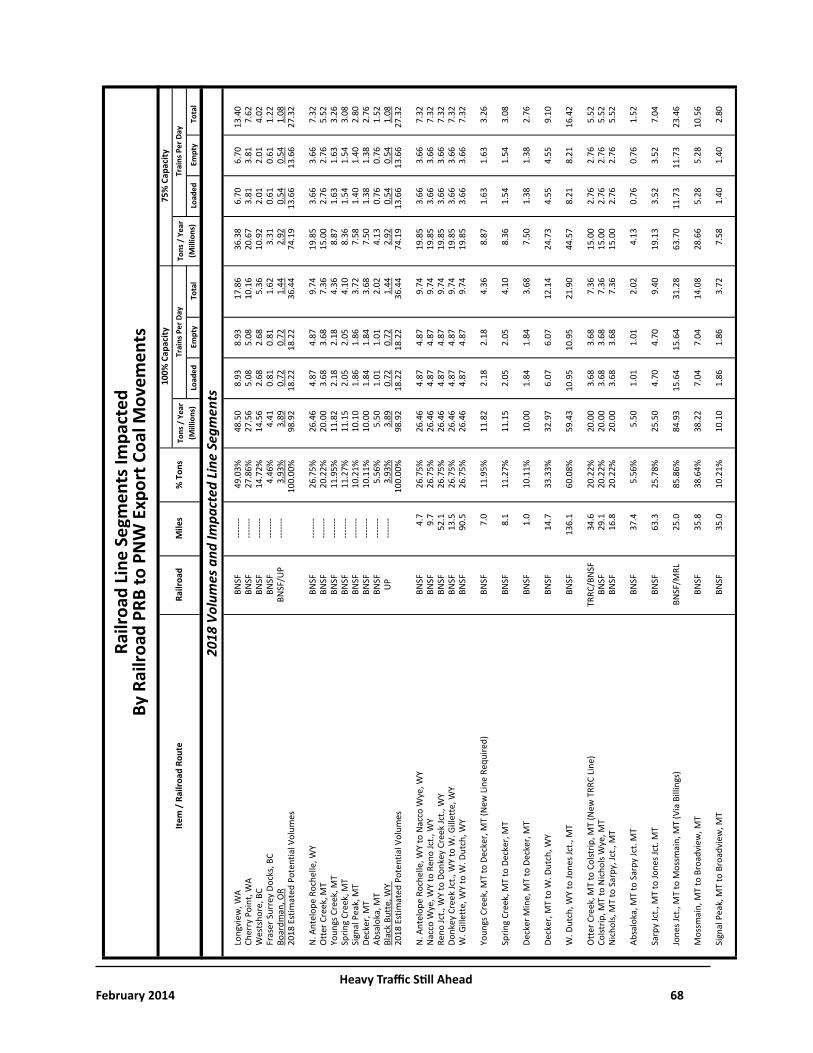
Heavy Traffic Still AheadFebruary 2014 68
Heav
y Tr
affic
Stil
l Ahe
adAp
pend
ix 4
Load
edEm
pty
Tota
lLo
aded
Empt
yTo
tal
By R
ailro
ad P
RB to
PN
W E
xpor
t Coa
l Mov
emen
ts
2013
Vol
umes
and
Impa
cted
Lin
e Se
gmen
ts
Railr
oad
Line
Seg
men
ts Im
pact
ed
Trai
ns P
er D
ayTo
ns /
Yea
r (M
illio
ns)
Railr
oad
Mile
sTo
ns /
Yea
r (M
illio
ns)
Trai
ns P
er D
ay
100%
Cap
acity
75%
Cap
acity
Item
/ R
ailro
ad R
oute
% T
ons
Long
view
, WA
BNSF
------
-49
.03%
48.5
08.
938.
9317
.86
36.3
86.
706.
7013
.40
Cher
ry P
oint
, WA
BNSF
------
-27
.86%
27.5
65.
085.
0810
.16
20.6
73.
813.
817.
62W
ests
hore
, BC
BNSF
------
-14
.72%
14.5
62.
682.
685.
3610
.92
2.01
2.01
4.02
Fras
er S
urre
y Do
cks,
BCBN
SF---
----
4.46
%4.
410.
810.
811.
623.
310.
610.
611.
22Bo
ardm
an, O
RBN
SF/U
P---
----
3.93
%3.
890.
720.
721.
442.
920.
540.
541.
0820
18 E
stim
ated
Pot
entia
l Vol
umes
10
0.00
%98
.92
18.2
218
.22
36.4
474
.19
13.6
613
.66
27.3
2
N. A
ntel
ope
Roch
elle
, WY
BNSF
------
-26
.75%
26.4
64.
874.
879.
7419
.85
3.66
3.66
7.32
Ott
er C
reek
, MT
BNSF
------
-20
.22%
20.0
03.
683.
687.
3615
.00
2.76
2.76
5.52
Youn
gs C
reek
, MT
BNSF
------
-11
.95%
11.8
22.
182.
184.
368.
871.
631.
633.
26Sp
ring
Cree
k, M
TBN
SF---
----
11.2
7%11
.15
2.05
2.05
4.10
8.36
1.54
1.54
3.08
Sign
al P
eak,
MT
BNSF
------
-10
.21%
10.1
01.
861.
863.
727.
581.
401.
402.
80De
cker
, MT
BNSF
------
-10
.11%
10.0
01.
841.
843.
687.
501.
381.
382.
76Ab
salo
ka, M
TBN
SF---
----
5.56
%5.
501.
011.
012.
024.
130.
760.
761.
52Bl
ack
Butt
e, W
Y U
P---
----
3.93
%3.
890.
720.
721.
442.
920.
540.
541.
0820
18 E
stim
ated
Pot
entia
l Vol
umes
100.
00%
98.9
218
.22
18.2
236
.44
74.1
913
.66
13.6
627
.32
N. A
ntel
ope
Roch
elle
, WY
to N
acco
Wye
, WY
BNSF
4.7
26.7
5%26
.46
4.87
4.87
9.74
19.8
53.
663.
667.
32N
acco
Wye
, WY
to R
eno
Jct.,
WY
BNSF
9.7
26.7
5%26
.46
4.87
4.87
9.74
19.8
53.
663.
667.
32Re
no Jc
t., W
Y to
Don
key
Cree
k Jc
t., W
YBN
SF52
.126
.75%
26.4
64.
874.
879.
7419
.85
3.66
3.66
7.32
Donk
ey C
reek
Jct.,
WY
to W
. Gill
ette
, WY
BNSF
13.5
26.7
5%26
.46
4.87
4.87
9.74
19.8
53.
663.
667.
32W
. Gill
ette
, WY
to W
. Dut
ch, W
YBN
SF90
.526
.75%
26.4
64.
874.
879.
7419
.85
3.66
3.66
7.32
Youn
gs C
reek
, MT
to D
ecke
r, M
T (N
ew L
ine
Requ
ired)
BNSF
7.0
11.9
5%11
.82
2.18
2.18
4.36
8.87
1.63
1.63
3.26
Sprin
g Cr
eek,
MT
to D
ecke
r, M
TBN
SF8.
111
.27%
11.1
52.
052.
054.
108.
361.
541.
543.
08
Deck
er M
ine,
MT
to D
ecke
r, M
TBN
SF1.
010
.11%
10.0
01.
841.
843.
687.
501.
381.
382.
76
Deck
er, M
T to
W. D
utch
, WY
BNSF
14.7
33.3
3%32
.97
6.07
6.07
12.1
424
.73
4.55
4.55
9.10
W. D
utch
, WY
to Jo
nes J
ct.,
MT
BNSF
136.
160
.08%
59.4
310
.95
10.9
521
.90
44.5
78.
218.
2116
.42
Ott
er C
reek
, MT
to C
olst
rip, M
T (N
ew T
RRC
Line
) TR
RC/B
NSF
34.6
20.2
2%20
.00
3.68
3.68
7.36
15.0
02.
762.
765.
52Co
lstrip
, MT
to N
icho
ls W
ye, M
TBN
SF29
.120
.22%
20.0
03.
683.
687.
3615
.00
2.76
2.76
5.52
Nic
hols,
MT
to S
arpy
, Jct
., M
TBN
SF16
.820
.22%
20.0
03.
683.
687.
3615
.00
2.76
2.76
5.52
Ab
salo
ka, M
T to
Sar
py Jc
t. M
TBN
SF37
.45.
56%
5.50
1.01
1.01
2.02
4.13
0.76
0.76
1.52
Sarp
y Jc
t., M
T to
Jone
s Jct
. MT
BNSF
63.3
25.7
8%25
.50
4.70
4.70
9.40
19.1
33.
523.
527.
04
Jone
s Jct
., M
T to
Mos
smai
n, M
T (V
ia B
illin
gs)
BNSF
/MRL
25.0
85.8
6%84
.93
15.6
415
.64
31.2
863
.70
11.7
311
.73
23.4
6
Mos
smai
n, M
T to
Bro
advi
ew, M
TBN
SF35
.838
.64%
38.2
27.
047.
0414
.08
28.6
65.
285.
2810
.56
Sign
al P
eak,
MT
to B
road
view
, MT
BNSF
35.0
10.2
1%10
.10
1.86
1.86
3.72
7.58
1.40
1.40
2.80
2018
Vol
umes
and
Impa
cted
Lin
e Se
gmen
ts
Page
2 o
f 5
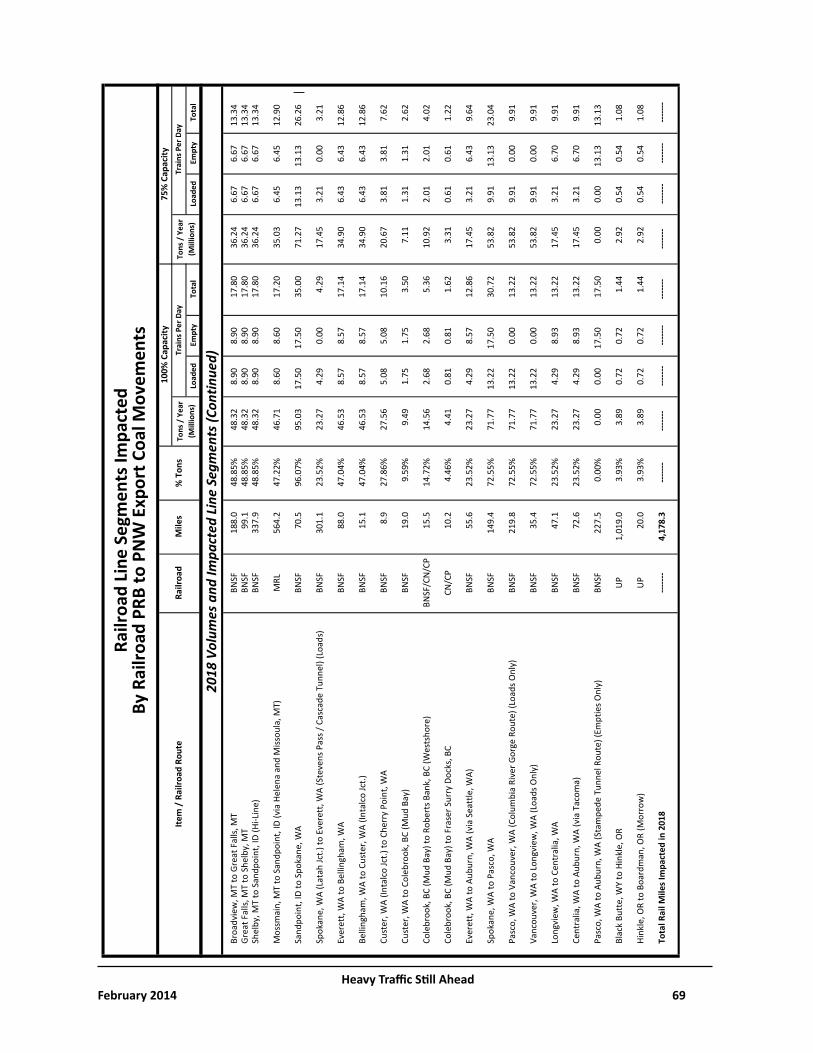
Heavy Traffic Still AheadFebruary 2014 69
Heav
y Tr
affic
Stil
l Ahe
adAp
pend
ix 4
Load
edEm
pty
Tota
lLo
aded
Empt
yTo
tal
By R
ailro
ad P
RB to
PN
W E
xpor
t Coa
l Mov
emen
ts
2013
Vol
umes
and
Impa
cted
Lin
e Se
gmen
ts
Railr
oad
Line
Seg
men
ts Im
pact
ed
Trai
ns P
er D
ayTo
ns /
Yea
r (M
illio
ns)
Railr
oad
Mile
sTo
ns /
Yea
r (M
illio
ns)
Trai
ns P
er D
ay
100%
Cap
acity
75%
Cap
acity
Item
/ R
ailro
ad R
oute
% T
ons
Broa
dvie
w, M
T to
Gre
at F
alls,
MT
BNSF
188.
048
.85%
48.3
28.
908.
9017
.80
36.2
46.
676.
6713
.34
Grea
t Fal
ls, M
T to
She
lby,
MT
BNSF
99.1
48.8
5%48
.32
8.90
8.90
17.8
036
.24
6.67
6.67
13.3
4Sh
elby
, MT
to S
andp
oint
, ID
(Hi-L
ine)
BNSF
337.
948
.85%
48.3
28.
908.
9017
.80
36.2
46.
676.
6713
.34
Mos
smai
n, M
T to
San
dpoi
nt, I
D (v
ia H
elen
a an
d M
issou
la, M
T)
MRL
564.
247
.22%
46.7
18.
608.
6017
.20
35.0
36.
456.
4512
.90
Sa
ndpo
int,
ID to
Spo
kane
, WA
BNSF
70.5
96.0
7%95
.03
17.5
017
.50
35.0
071
.27
13.1
313
.13
26.2
6
Spok
ane,
WA
(Lat
ah Jc
t.) to
Eve
rett
, WA
(Ste
vens
Pas
s / C
asca
de T
unne
l) (L
oads
)BN
SF30
1.1
23.5
2%23
.27
4.29
0.00
4.29
17.4
53.
210.
003.
21
Ever
ett,
WA
to B
ellin
gham
, WA
BNSF
88.0
47.0
4%46
.53
8.57
8.57
17.1
434
.90
6.43
6.43
12.8
6
Belli
ngha
m, W
A to
Cus
ter,
WA
(Inta
lco
Jct.)
BNSF
15.1
47.0
4%46
.53
8.57
8.57
17.1
434
.90
6.43
6.43
12.8
6
Cust
er, W
A (In
talc
o Jc
t.) to
Che
rry
Poin
t, W
ABN
SF8.
927
.86%
27.5
65.
085.
0810
.16
20.6
73.
813.
817.
62
Cust
er, W
A to
Col
ebro
ok, B
C (M
ud B
ay)
BNSF
19.0
9.59
%9.
491.
751.
753.
507.
111.
311.
312.
62
Cole
broo
k, B
C (M
ud B
ay) t
o Ro
bert
s Ban
k, B
C (W
ests
hore
)BN
SF/C
N/C
P15
.514
.72%
14.5
62.
682.
685.
3610
.92
2.01
2.01
4.02
Cole
broo
k, B
C (M
ud B
ay) t
o Fr
aser
Sur
ry D
ocks
, BC
CN/C
P10
.24.
46%
4.41
0.81
0.81
1.62
3.31
0.61
0.61
1.22
Ever
ett,
WA
to A
ubur
n, W
A (v
ia S
eatt
le, W
A)BN
SF55
.623
.52%
23.2
74.
298.
5712
.86
17.4
53.
216.
439.
64
Spok
ane,
WA
to P
asco
, WA
BNSF
149.
472
.55%
71.7
713
.22
17.5
030
.72
53.8
29.
9113
.13
23.0
4
Pasc
o, W
A to
Van
couv
er, W
A (C
olum
bia
Rive
r Gor
ge R
oute
) (Lo
ads O
nly)
BNSF
219.
872
.55%
71.7
713
.22
0.00
13.2
253
.82
9.91
0.00
9.91
Vanc
ouve
r, W
A to
Lon
gvie
w, W
A (L
oads
Onl
y)BN
SF35
.472
.55%
71.7
713
.22
0.00
13.2
253
.82
9.91
0.00
9.91
Long
view
, WA
to C
entr
alia
, WA
BNSF
47.1
23.5
2%23
.27
4.29
8.93
13.2
217
.45
3.21
6.70
9.91
Cent
ralia
, WA
to A
ubur
n, W
A (v
ia T
acom
a)BN
SF72
.623
.52%
23.2
74.
298.
9313
.22
17.4
53.
216.
709.
91
Pasc
o, W
A to
Aub
urn,
WA
(Sta
mpe
de T
unne
l Rou
te) (
Empt
ies O
nly)
BNSF
227.
50.
00%
0.00
0.00
17.5
017
.50
0.00
0.00
13.1
313
.13
Blac
k Bu
tte,
WY
to H
inkl
e, O
RU
P1,
019.
03.
93%
3.89
0.72
0.72
1.44
2.92
0.54
0.54
1.08
Hink
le, O
R to
Boa
rdm
an, O
R (M
orro
w)
UP
20.0
3.93
%3.
890.
720.
721.
442.
920.
540.
541.
08
Tota
l Rai
l Mile
s Im
pact
ed in
201
8---
----
4,17
8.3
------
----
----
------
----
----
------
----
----
------
----
----
------
-
2018
Vol
umes
and
Impa
cted
Lin
e Se
gmen
ts (C
ontin
ued)
Page
3 o
f 5
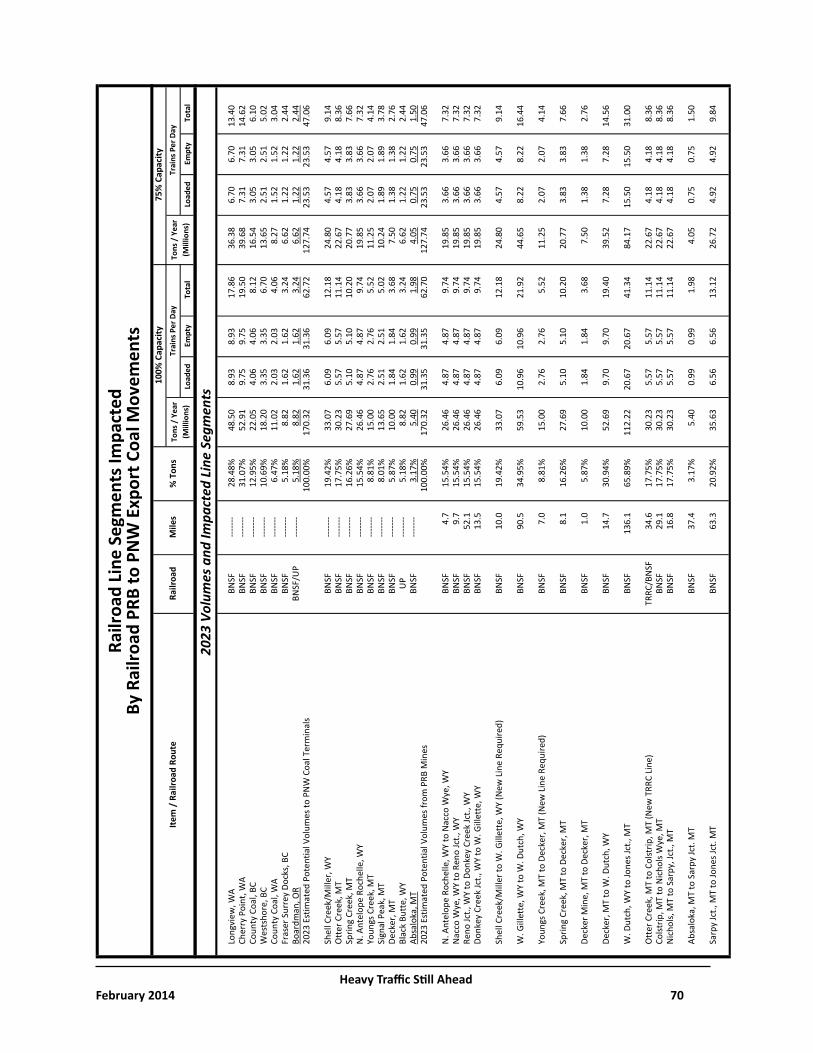
Heavy Traffic Still AheadFebruary 2014 70
Heav
y Tr
affic
Stil
l Ahe
adAp
pend
ix 4
Load
edEm
pty
Tota
lLo
aded
Empt
yTo
tal
By R
ailro
ad P
RB to
PN
W E
xpor
t Coa
l Mov
emen
ts
2013
Vol
umes
and
Impa
cted
Lin
e Se
gmen
ts
Railr
oad
Line
Seg
men
ts Im
pact
ed
Trai
ns P
er D
ayTo
ns /
Yea
r (M
illio
ns)
Railr
oad
Mile
sTo
ns /
Yea
r (M
illio
ns)
Trai
ns P
er D
ay
100%
Cap
acity
75%
Cap
acity
Item
/ R
ailro
ad R
oute
% T
ons
Long
view
, WA
BNSF
------
-28
.48%
48.5
08.
938.
9317
.86
36.3
86.
706.
7013
.40
Cher
ry P
oint
, WA
BNSF
------
-31
.07%
52.9
19.
759.
7519
.50
39.6
87.
317.
3114
.62
Coun
ty C
oal,
BCBN
SF---
----
12.9
5%22
.05
4.06
4.06
8.12
16.5
43.
053.
056.
10W
ests
hore
, BC
BNSF
------
-10
.69%
18.2
03.
353.
356.
7013
.65
2.51
2.51
5.02
Coun
ty C
oal,
WA
BNSF
------
-6.
47%
11.0
22.
032.
034.
068.
271.
521.
523.
04Fr
aser
Sur
rey
Dock
s, BC
BNSF
------
-5.
18%
8.82
1.62
1.62
3.24
6.62
1.22
1.22
2.44
Boar
dman
, OR
BNSF
/UP
------
-5.
18%
8.82
1.62
1.62
3.24
6.62
1.22
1.22
2.44
2023
Est
imat
ed P
oten
tial V
olum
es to
PN
W C
oal T
erm
inal
s
100.
00%
170.
3231
.36
31.3
662
.72
127.
7423
.53
23.5
347
.06
Shel
l Cre
ek/M
iller
, WY
BNSF
------
-19
.42%
33.0
76.
096.
0912
.18
24.8
04.
574.
579.
14O
tter
Cre
ek, M
TBN
SF---
----
17.7
5%30
.23
5.57
5.57
11.1
422
.67
4.18
4.18
8.36
Sprin
g Cr
eek,
MT
BNSF
------
-16
.26%
27.6
95.
105.
1010
.20
20.7
73.
833.
837.
66N
. Ant
elop
e Ro
chel
le, W
YBN
SF---
----
15.5
4%26
.46
4.87
4.87
9.74
19.8
53.
663.
667.
32Yo
ungs
Cre
ek, M
TBN
SF---
----
8.81
%15
.00
2.76
2.76
5.52
11.2
52.
072.
074.
14Si
gnal
Pea
k, M
TBN
SF---
----
8.01
%13
.65
2.51
2.51
5.02
10.2
41.
891.
893.
78De
cker
, MT
BNSF
------
-5.
87%
10.0
01.
841.
843.
687.
501.
381.
382.
76Bl
ack
Butt
e, W
Y U
P---
----
5.18
%8.
821.
621.
623.
246.
621.
221.
222.
44Ab
salo
ka, M
TBN
SF---
----
3.17
%5.
400.
990.
991.
984.
050.
750.
751.
5020
23 E
stim
ated
Pot
entia
l Vol
umes
from
PRB
Min
es10
0.00
%17
0.32
31.3
531
.35
62.7
012
7.74
23.5
323
.53
47.0
6
N. A
ntel
ope
Roch
elle
, WY
to N
acco
Wye
, WY
BNSF
4.7
15.5
4%26
.46
4.87
4.87
9.74
19.8
53.
663.
667.
32N
acco
Wye
, WY
to R
eno
Jct.,
WY
BNSF
9.7
15.5
4%26
.46
4.87
4.87
9.74
19.8
53.
663.
667.
32Re
no Jc
t., W
Y to
Don
key
Cree
k Jc
t., W
YBN
SF52
.115
.54%
26.4
64.
874.
879.
7419
.85
3.66
3.66
7.32
Donk
ey C
reek
Jct.,
WY
to W
. Gill
ette
, WY
BNSF
13.5
15.5
4%26
.46
4.87
4.87
9.74
19.8
53.
663.
667.
32
Shel
l Cre
ek/M
iller
to W
. Gill
ette
, WY
(New
Lin
e Re
quire
d)BN
SF10
.019
.42%
33.0
76.
096.
0912
.18
24.8
04.
574.
579.
14
W. G
illet
te, W
Y to
W. D
utch
, WY
BNSF
90.5
34.9
5%59
.53
10.9
610
.96
21.9
244
.65
8.22
8.22
16.4
4
Youn
gs C
reek
, MT
to D
ecke
r, M
T (N
ew L
ine
Requ
ired)
BNSF
7.0
8.81
%15
.00
2.76
2.76
5.52
11.2
52.
072.
074.
14
Sprin
g Cr
eek,
MT
to D
ecke
r, M
TBN
SF8.
116
.26%
27.6
95.
105.
1010
.20
20.7
73.
833.
837.
66
Deck
er M
ine,
MT
to D
ecke
r, M
TBN
SF1.
05.
87%
10.0
01.
841.
843.
687.
501.
381.
382.
76
Deck
er, M
T to
W. D
utch
, WY
BNSF
14.7
30.9
4%52
.69
9.70
9.70
19.4
039
.52
7.28
7.28
14.5
6
W. D
utch
, WY
to Jo
nes J
ct.,
MT
BNSF
136.
165
.89%
112.
2220
.67
20.6
741
.34
84.1
715
.50
15.5
031
.00
Ott
er C
reek
, MT
to C
olst
rip, M
T (N
ew T
RRC
Line
) TR
RC/B
NSF
34.6
17.7
5%30
.23
5.57
5.57
11.1
422
.67
4.18
4.18
8.36
Colst
rip, M
T to
Nic
hols
Wye
, MT
BNSF
29.1
17.7
5%30
.23
5.57
5.57
11.1
422
.67
4.18
4.18
8.36
Nic
hols,
MT
to S
arpy
, Jct
., M
TBN
SF16
.817
.75%
30.2
35.
575.
5711
.14
22.6
74.
184.
188.
36
Absa
loka
, MT
to S
arpy
Jct.
MT
BNSF
37.4
3.17
%5.
400.
990.
991.
984.
050.
750.
751.
50
Sarp
y Jc
t., M
T to
Jone
s Jct
. MT
BNSF
63.3
20.9
2%35
.63
6.56
6.56
13.1
226
.72
4.92
4.92
9.84
2023
Vol
umes
and
Impa
cted
Lin
e Se
gmen
ts
Page
4 o
f 5
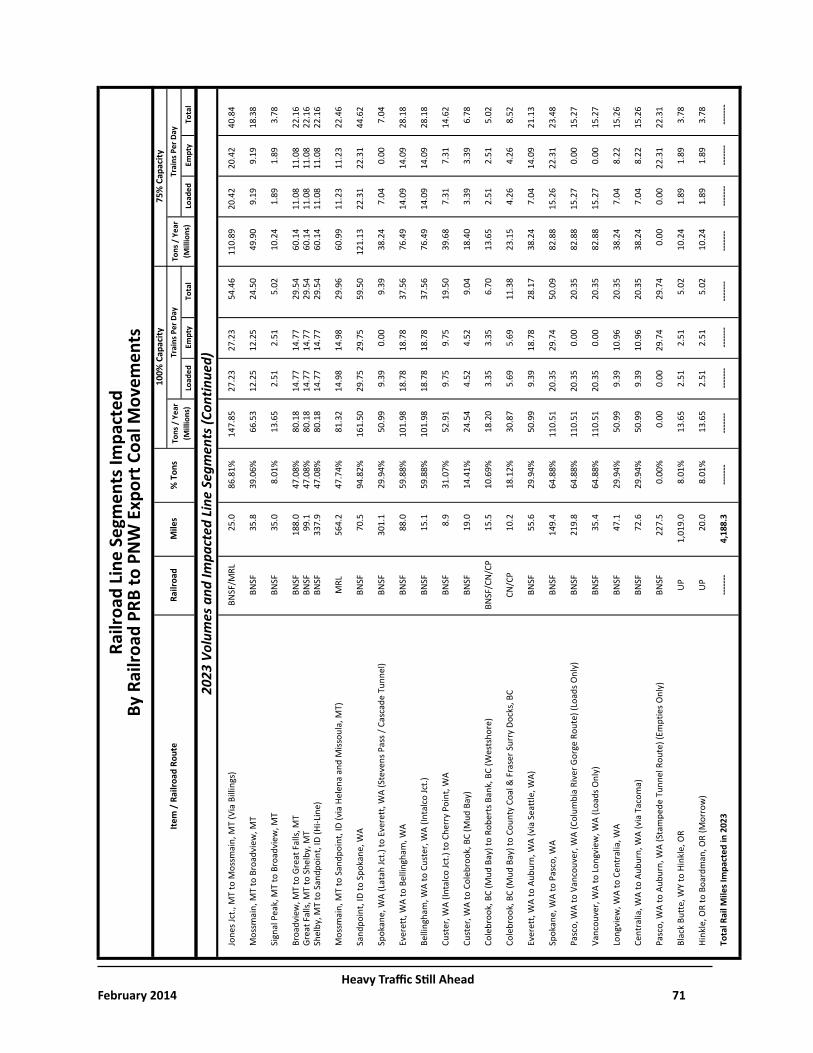
Heavy Traffic Still AheadFebruary 2014 71
Heav
y Tr
affic
Stil
l Ahe
adAp
pend
ix 4
Load
edEm
pty
Tota
lLo
aded
Empt
yTo
tal
By R
ailro
ad P
RB to
PN
W E
xpor
t Coa
l Mov
emen
ts
2013
Vol
umes
and
Impa
cted
Lin
e Se
gmen
ts
Railr
oad
Line
Seg
men
ts Im
pact
ed
Trai
ns P
er D
ayTo
ns /
Yea
r (M
illio
ns)
Railr
oad
Mile
sTo
ns /
Yea
r (M
illio
ns)
Trai
ns P
er D
ay
100%
Cap
acity
75%
Cap
acity
Item
/ R
ailro
ad R
oute
% T
ons
Jone
s Jct
., M
T to
Mos
smai
n, M
T (V
ia B
illin
gs)
BNSF
/MRL
25.0
86.8
1%14
7.85
27.2
327
.23
54.4
611
0.89
20.4
220
.42
40.8
4
Mos
smai
n, M
T to
Bro
advi
ew, M
TBN
SF35
.839
.06%
66.5
312
.25
12.2
524
.50
49.9
09.
199.
1918
.38
Sign
al P
eak,
MT
to B
road
view
, MT
BNSF
35.0
8.01
%13
.65
2.51
2.51
5.02
10.2
41.
891.
893.
78
Broa
dvie
w, M
T to
Gre
at F
alls,
MT
BNSF
188.
047
.08%
80.1
814
.77
14.7
729
.54
60.1
411
.08
11.0
822
.16
Grea
t Fal
ls, M
T to
She
lby,
MT
BNSF
99.1
47.0
8%80
.18
14.7
714
.77
29.5
460
.14
11.0
811
.08
22.1
6Sh
elby
, MT
to S
andp
oint
, ID
(Hi-L
ine)
BNSF
337.
947
.08%
80.1
814
.77
14.7
729
.54
60.1
411
.08
11.0
822
.16
Mos
smai
n, M
T to
San
dpoi
nt, I
D (v
ia H
elen
a an
d M
issou
la, M
T)
MRL
564.
247
.74%
81.3
214
.98
14.9
829
.96
60.9
911
.23
11.2
322
.46
Sand
poin
t, ID
to S
poka
ne, W
ABN
SF70
.594
.82%
161.
5029
.75
29.7
559
.50
121.
1322
.31
22.3
144
.62
Spok
ane,
WA
(Lat
ah Jc
t.) to
Eve
rett
, WA
(Ste
vens
Pas
s / C
asca
de T
unne
l)BN
SF30
1.1
29.9
4%50
.99
9.39
0.00
9.39
38.2
47.
040.
007.
04
Ever
ett,
WA
to B
ellin
gham
, WA
BNSF
88.0
59.8
8%10
1.98
18.7
818
.78
37.5
676
.49
14.0
914
.09
28.1
8
Belli
ngha
m, W
A to
Cus
ter,
WA
(Inta
lco
Jct.)
BNSF
15.1
59.8
8%10
1.98
18.7
818
.78
37.5
676
.49
14.0
914
.09
28.1
8
Cust
er, W
A (In
talc
o Jc
t.) to
Che
rry
Poin
t, W
ABN
SF8.
931
.07%
52.9
19.
759.
7519
.50
39.6
87.
317.
3114
.62
Cust
er, W
A to
Col
ebro
ok, B
C (M
ud B
ay)
BNSF
19.0
14.4
1%24
.54
4.52
4.52
9.04
18.4
03.
393.
396.
78
Cole
broo
k, B
C (M
ud B
ay) t
o Ro
bert
s Ban
k, B
C (W
ests
hore
)BN
SF/C
N/C
P15
.510
.69%
18.2
03.
353.
356.
7013
.65
2.51
2.51
5.02
Cole
broo
k, B
C (M
ud B
ay) t
o Co
unty
Coa
l & F
rase
r Sur
ry D
ocks
, BC
CN/C
P10
.218
.12%
30.8
75.
695.
6911
.38
23.1
54.
264.
268.
52
Ever
ett,
WA
to A
ubur
n, W
A (v
ia S
eatt
le, W
A)BN
SF55
.629
.94%
50.9
99.
3918
.78
28.1
738
.24
7.04
14.0
921
.13
Spok
ane,
WA
to P
asco
, WA
BNSF
149.
464
.88%
110.
5120
.35
29.7
450
.09
82.8
815
.26
22.3
123
.48
Pasc
o, W
A to
Van
couv
er, W
A (C
olum
bia
Rive
r Gor
ge R
oute
) (Lo
ads O
nly)
BNSF
219.
864
.88%
110.
5120
.35
0.00
20.3
582
.88
15.2
70.
0015
.27
Vanc
ouve
r, W
A to
Lon
gvie
w, W
A (L
oads
Onl
y)BN
SF35
.464
.88%
110.
5120
.35
0.00
20.3
582
.88
15.2
70.
0015
.27
Long
view
, WA
to C
entr
alia
, WA
BNSF
47.1
29.9
4%50
.99
9.39
10.9
620
.35
38.2
47.
048.
2215
.26
Cent
ralia
, WA
to A
ubur
n, W
A (v
ia T
acom
a)BN
SF72
.629
.94%
50.9
99.
3910
.96
20.3
538
.24
7.04
8.22
15.2
6
Pasc
o, W
A to
Aub
urn,
WA
(Sta
mpe
de T
unne
l Rou
te) (
Empt
ies O
nly)
BNSF
227.
50.
00%
0.00
0.00
29.7
429
.74
0.00
0.00
22.3
122
.31
Blac
k Bu
tte,
WY
to H
inkl
e, O
RU
P1,
019.
08.
01%
13.6
52.
512.
515.
0210
.24
1.89
1.89
3.78
Hink
le, O
R to
Boa
rdm
an, O
R (M
orro
w)
UP
20.0
8.01
%13
.65
2.51
2.51
5.02
10.2
41.
891.
893.
78
Tota
l Rai
l Mile
s Im
pact
ed in
202
3---
----
4,18
8.3
------
----
----
------
----
----
------
----
----
------
----
----
------
-
2023
Vol
umes
and
Impa
cted
Lin
e Se
gmen
ts (C
ontin
ued)
Page
5 o
f 5
About the AuthorsTerry Whiteside is a principal in Whiteside and Associates, a transportation and marketing
consulting firm. Terry has over 30 years of experience in transportation with both carrier and shipper representation. He has worked in private industry for several Fortune 500 companies including Conoco, Continental Pipeline and several of the Williams Companies and later headed up the Transportation Division of the Montana Department of Agriculture and the Litigation Bureau of the Transportation Division of the Montana Department of Commerce. W&A today represents most of the Wheat and Barley Commissions throughout the Western half of the U.S. The firm does work for utilities, lumber companies, agricultural manufacturers and government entities and most importantly the growers of grain.
G.W. Fauth is a recognized expert in transportation issues with 30 years experience, including the Surface Transportation Board where he served as staff advisor on transportation issues to one of the Commissioners. His experience includes economic, regulatory, public policy and legislative issues primarily associated with, or related to, the U. S. railroad industry. Most of his work has involved regulatory proceedings, litigations, negotiations, legislative efforts and related projects before, or related to, the U.S. Surface Transportation Board and its predecessor, the Interstate Commerce Commission. He has extensive experience working on projects involving railroad mergers, transactions, acquisitions, abandonments, rate reasonableness issues, railroad accounting and cost issues, railroad practices and other railroad related issues.


Western Organization of Resource Councils220 South 27th Street
Billings, MT 59101(406) 252-9672www.worc.org