
Assessing the Contribution of VC to Innovation Kortum and Lerner 2000
Unclassified DSTI/DOC(2000)2
Organisation de Coopération et de Développement Economiques OLIS : 22-Mar-2000Organisation for Economic Co-operation and Development Dist. : 23-Mar-2000__________________________________________________________________________________________
English text onlyDIRECTORATE FOR SCIENCE, TECHNOLOGY AND INDUSTRY
STI WORKING PAPER 2000/2
THE CONTRIBUTION OF INFORMATION AND COMMUNICATIONTECHNOLOGY TO OUTPUT GROWTH: A STUDY OF THE G7 COUNTRIES
Paul Schreyer
Unclassified
DST
I/DO
C(2000)2
English text only
89070
Document complet disponible sur OLIS dans son format d’origine
Complete document available on OLIS in its original format
DSTI/DOC(2000)2
2
STI Working Paper Series
The Working Paper series of the OECD Directorate for Science, Technology and Industry of the OECD isdesigned to make available to a wider readership selected studies prepared by staff in the Directorate or byoutside consultants working on OECD projects. The papers included in the series are of a technical andanalytical nature and deal with issues of data, methodology and empirical analysis in the areas of work ofthe DSTI. The Working Papers are generally available only in their original language – English orFrench – with a summary in the other.
Comment on the papers is invited, and should be sent to the Directorate for Science, Technology andIndustry, OECD, 2 rue André Pascal, 75775 Paris Cedex 16, France.
The opinions expressed in these papers are the sole responsibility of the author(s) and do not necessarilyreflect those of the OECD or of the governments of its Member countries.
http://www.oecd.org/dsti/sti/prod/sti_wp.htm
Copyright OECD, 2000Applications for permission to reproduce or translate all or part of this material should be made to:Head of Publication Service, OECD, 2 rue André-Pascal, 75775 Paris, Cedex 16, France.
DSTI/DOC(2000)2
3
THE CONTRIBUTION OF INFORMATION AND COMMUNICATION TECHNOLOGY TOOUTPUT GROWTH: A STUDY OF THE G7 COUNTRIES
Paul Schreyer
This paper deals with the contribution of information and communication technology (ICT) to economicgrowth and to labour and multi-factor productivity. It uses a well-established growth accountingframework to assess the role of ICTs as capital inputs and the contribution of these capital inputs to outputgrowth. The paper provides an international perspective by presenting results for the G7 countries. For thispurpose, data on ICT investment expenditure were compiled from several sources, to construct measures ofICT capital stocks and capital services. Special care was taken to account for the methodologicaldifferences in price deflators for computers as they exist across OECD countries. For all seven countries,the report finds that ICT capital goods have been important contributors to economic growth, although therole of ICT has been most accentuated in the United States. An important limitation of the study lies in thetimeliness of internationally comparable data. Calculations could only be carried out for the years up to1996 for all G7 countries. The report points to some of the most recent studies for the United States andbriefly discusses their results.
--------------------
Cette étude examine la contribution des technologies de l’information et de la communication (TIC) à lacroissance économique, ainsi qu’à la productivité du travail et à la productivité totale des facteurs. Elles’appuie sur un cadre éprouvé d’analyse causale de la croissance pour évaluer le rôle des TIC en tantqu’apports de capital et la contribution de ces apports à la croissance de la production. L’étude propose untour d’horizon international en présentant les résultats des pays du G7. A cette fin, des données sur lesdépenses d’équipement en TIC ont été recueillies auprès de plusieurs sources et classées de façon à obtenirdes mesures du stock de capital sous forme de TIC et des services tirés de ce capital. Les différencesméthodologiques entre les pays de l’OCDE en ce qui concerne les coefficients d’ajustement des prix desordinateurs ont été soigneusement prises en compte. Il apparaît que les biens d’équipement des TIC ontjoué un rôle important dans la croissance économique dans l’ensemble des sept pays examinés, même sic’est aux États-Unis que cette contribution a été la plus marquée. La principale imperfection de l’étudetient aux délais de disponibilité de données comparables au plan international. Ainsi, les calculs n’ont puêtre effectués que jusqu’à l’année 1996 pour l’ensemble des pays du G7. Le rapport renvoie cependant àcertaines des études les plus récentes concernant les États-Unis et examine brièvement leurs résultats.
DSTI/DOC(2000)2
4
TABLE OF CONTENTS
THE CONTRIBUTION OF INFORMATION AND COMMUNICATIONTECHNOLOGY TO OUTPUT GROWTH: A STUDY OF THE G7 COUNTRIES
1. Introduction and main findings............................................................................................................ 5
2. Measurement: the growth contribution of ICT .................................................................................... 6
2.1. Three aspects ................................................................................................................................ 6
2.2. Framework.................................................................................................................................... 7
2.3. The importance of ICT in the capital stock .................................................................................. 9
Measuring ICT investment .................................................................................................................. 9ICT capital stock................................................................................................................................ 10Non-ICT capital stock........................................................................................................................ 13
2.4. User cost of capital ..................................................................................................................... 14
3. Results: the growth contribution of ICT ............................................................................................ 17
3.1. ICT as a capital input.................................................................................................................. 17
3.2. ICT as a special type of capital good.......................................................................................... 19
MFP growth in the United States since 1996..................................................................................... 19
REFERENCES ............................................................................................................................................. 21
NOTES ......................................................................................................................................................... 23
Box
Box 1. Measurement of prices and quantities ........................................................................................... 11
DSTI/DOC(2000)2
5
1. Introduction and main findings
In recent years, the US economy has grown at a surprisingly fast pace, in a phase of expansion that startednine years ago and constitutes the longest-ever recorded period of sustained growth. Moreover, expansionhas been marked by low unemployment and record employment but also by low inflation, and anacceleration of productivity growth in the most recent years. This long period of expansion coincides withsignificant investment in and the diffusion of information and communication technologies (ICT) and theirapplications. The term “new economy” has been coined to mark the association of inflation-free growthwith computerisation and globalisation, with the implication that information technologies play a majorrole in explaining sustained growth. The notion of the “new economy” has also been employed to signalthat the workings of the economy may have significantly changed, with rules, principles and institutionsdifferent from those of the “old economy”. A frequently cited example of such new factors is the risingimportance of network externalities. Whether a “new economy” in this sense has actually emerged isunclear but the performance of the US economy is uncontested and has been contrasted with growth andemployment in many European countries and in Japan.
This Working Paper deals with the contribution of ICTs to economic growth and to labour and multi-factorproductivity. It uses a conceptual framework (presented in Section 2). One important distinction whichneeds to be made is the difference between ICT industries and their contribution to growth, and the role ofICTs as capital inputs in all parts of the economy. Another distinction is between the effects of ICTs onlabour and on multi-factor productivity. Conclusions about the role of ICT can be quite different,depending on the perspective taken.
From an international perspective, the question of differences across countries arises: if ICTs constitute animportant driver of output and productivity growth, why has an extended period of growth been observedin some countries – in particular the United States – and not in others? Investment in and use ofinformation technology has by no means been confined to the United States, and yet average European orJapanese growth experiences have been quite different. The international perspective is at the core of thepresent study. For the G7 countries, data on ICT investment expenditure were compiled to constructmeasures of ICT capital stocks and capital services. Special care was taken to account for themethodological differences in price deflators for computers as they exist across OECD countries. Based onthese data, this report focuses on the role of ICTs as capital inputs and on their contribution to outputgrowth.
Main findings are:
− ICT capital goods are important contributors to economic growth but there is little evidencethat they are inherently different from other capital goods. Over the past decades, technicalprogress has led to a rapid improvement in the price-performance ratio of ICT capital goodsand has thus reduced the user cost of ICT capital goods relative to other types of assets. As aconsequence, there has been significant substitution of ICT capital for other types of capitaland labour inputs – witness the sustained growth in volume investment in ICTs that hasoutpaced investment in other types of capital goods. In their role as capital goods andproviders of capital services, ICTs have increasingly contributed to output and therefore tolabour productivity growth.
− It is sometimes argued that, in addition to their direct (and remunerated) contribution tooutput growth, ICTs generate spill-overs and “free” benefits that exceed the direct returns toICT capital. If such effects are large, they should translate into an acceleration of multi-factorproductivity (MFP) growth, the overall efficiency with which combined inputs are used in the
DSTI/DOC(2000)2
6
economy. For the observation period 1985-96, and the group of G7 countries, this study findsfew signs of a broad-based uptake in multi-factor productivity growth.
− At the same time, an important limitation of the present study lies in the timeliness ofinternationally comparable data. MFP calculations could only be carried out for the years upto 1996 for all G7 countries. Yet, over the most recent past (1996-99), several studies,including Oliner and Sichel (2000), Jorgenson and Stiroh (2000), and Council of EconomicAdvisers (2000) find a significant uptake in the growth rate of MFP in the United States. ICTplays a role here, because a sizeable part of this acceleration in MFP growth is attributable totechnological gains and MFP growth in the ICT-producing industries. The remaining part ofMFP growth stems from other industries. Although data limitations do not allow one todetermine whether, over the period 1996-99, these (other) industries’ MFP growth reflectsspill-over effects from ICTs, this is certainly a possibility. Further research will be needed tomake a more definite statement here.
− There are also several conclusions of a methodological nature. The first concerns theimportance of international harmonisation of price indices for ICT products. At present,methodologies vary significantly and may bias international comparisons. Similarly, officialsources of internationally comparable data on expenditure on ICT assets still need to bedeveloped. The present study also underlines the importance of conceptually correctmeasures of capital inputs.
2. Measurement: the growth contribution of ICT
2.1. Three aspects
To provide the context for measurement in this paper, consider several ways in which informationtechnology can influence economic growth.
ICT production. One obvious way to grasp the economic importance of information technologies is toconsider the role of ICT producers in an economy’s total value added or GDP. Such an approach focuseson the production process of ICT goods. Where comparisons are made, ICT production constitutesbetween 2.5 and 4.5% of total GDP at current prices (OECD, 2000), depending on the country and on thespecific definition of ICT. Even with relatively small shares, however, the contribution to overall outputcan be significant if ICT industries grow much faster than other parts of the economy. If rapid outputgrowth in ICT industries is due to strong productivity gains in these industries, this contributes tomacroeconomic productivity gains. Looking at ICT industries only provides, however, no informationabout the use of ICT in production, i.e. the importance of computers and information technology as aninput in other industries. There may well be countries whose ICT industry is small and yet ICT capitalgoods – imported and invested – play an important role in producing non-ICT output.
ICT as a capital input. An input-oriented approach would focus on the role of ICT in production.Computers and information equipment can be seen as a specific type of capital good in which firms invest,and which they combine with other types of capital and labour to produce output. The amount of ICTinvestment is governed by the relative prices and expected marginal revenues of capital goods: when pricesof computer assets fall relative to other capital or labour, firms will substitute the latter for the former andchange the way in which they combine various inputs in production. Capturing substitution processes is animportant aspect of assessing the role of ICT in production. This approach [which features, for example inthe work of Jorgenson and Stiroh (1999) and Oliner and Sichel (2000)] treats ICT capital goods like allother types of capital goods – in particular, it is assumed that firms who own ICT assets are able to reap
DSTI/DOC(2000)2
7
most or all of the benefits that accrue from using new technologies. Only in this case is it possible toobserve market income accruing to ICT capital and make inferences about its overall growth contribution.If there are other, unobserved, benefits or income, this contribution would be underestimated. This leads tothe point about ICT as a special input.
ICT as a special capital input. Part of the discussion about the “new economy” is based on the claim thatICTs produce benefits that go beyond those accruing to investors and owners. A case in point are networkexternalities: for example, one of the advantages of Internet transactions between businesses arises becausefirms are connected to the network – every new investment in a connection is advantageous not only forthe investor but also for all other participants. Such externalities, or spillovers, improve overallproductivity and aggregate income growth. As such, they are similar to advances in knowledge, theappearance of new blueprints and formulae or organisational innovations that potentially benefit all marketparticipants. As will be shown below in a more formal framework, such effects imply a link between multi-factor productivity (the overall efficiency with which resources are used in an economy) and use of ICT.
2.2. Framework
The three aspects of the role of ICT can be translated into a well-established growth accountingframework.1 To see this, consider a production function relating an economy’s output to labour and capitalinput and to multi-factor productivity. Capital input comprises the services from different types of capitalgoods, but for the present exposition only ICT and non-ICT capital are distinguished. The growthcontribution of each input is obtained by weighting its rate of change with a coefficient that represents eachfactor’s share in total cost. Mathematically, this can be expressed as:
AKsKsLsQ NKNCKCL +++= (1)
where Q is output, L is labour input, CK is ICT capital, NK is all other capital and A is disembodiedtechnical change (hatted variables indicate percentage rates of change). Ls , etc., denote each factor’s sharein total cost. Under constant returns to scale, total costs equal total revenue and the weights also representincome shares. How then, can the three views about ICT’s contribution to growth be articulated in thisframework?
ICT production. To capture the contribution of ICT industries, expression (1) could be split up into valueadded generated by ICT industries and by non-ICT industries. Equivalently, each of the inputs (labour, ICTand other capital as well as MFP) could be broken down into those inputs employed by the ICT industryand those employed by other industries. The contribution of ICT producers to GDP growth could then beevaluated as the sum of the contribution of labour and capital employed and MFP generated in ICTproduction. As pointed out earlier, there is no reason to assume that the so-computed contribution of ICTindustries to output equals the contribution of ICT capital goods to output growth. Both are meaningfulindicators, but respond to different questions.
ICT as a capital input. In the second approach, ICT is treated like other capital goods. Its contribution tooverall output can be measured by CKC Ks , i.e. the rate of change of ICT capital input, weighted by its sharein total income. Notes that CK stands for services from ICT capital goods in all parts of the economy, ICTindustries and other sectors. This relation is used to assess the impact of ICT investment on labourproductivity, or on output per person. Equation (1) can be rearranged to yield an expression for the rate ofchange of labour productivity:
DSTI/DOC(2000)2
8
A)LK(s)LK(sLQ CKCNKN +−+−=− (2)
The expression shows that labour productivity increases with a rising intensity of non-ICT capital per unitof labour input, with a rising intensity of ICT capital per unit of labour input and with general multi-factorproductivity advances. An important point arises from this presentation: if ICT is considered to be an“ordinary” capital input whose revenues accrue entirely to its owners, labour productivity will rise whenthere is ICT capital deepening, but there is no necessity for multi-factor productivity to rise.
ICT as a special capital input. According to this view, ICT affects not only output and labour productivityin line with its income share but also gives rise to additional effects that translate into gains in overallproductivity. Such positive externalities are always characterised by a discrepancy between a privateinvestor’s rate of return and the rate of return for society as a whole. In other words, ICT equipmentgenerates benefits above and beyond those reflected in its measured income share. This view is in the spiritof models of economic growth with increasing returns, as developed by a number of authors, in particularRomer (1986) and Lucas (1988). In Romer’s model, output depends not only on each producer’s capitalstock but on the economy-wide capital stock. While Romer motivates this formulation with knowledgespillovers, it can also accommodate the idea of externalities generated by ICTs. Lucas’ emphasis is onpositive spillovers from human capital but formally the analysis is similar. In expression (1), spillovers canbe picked up by a term θ , which adds to the growth effects of ICT capital:
AKsK)1(sLsQ NKNCKCL ++++= θ (4)
In practice, it is difficult to observe θ directly. Although econometric techniques permit in principle toobtain estimates of the coefficient )1(sKC θ+ , obtaining unbiased estimates is difficult and the usuallypreferred approach to MFP estimation is the non-parametric one (Barro, 1998). What can normally beobserved is the income share sKC realised by computer capital. This is also the coefficient that typicallyenters the computation of MFP. In the presence of externalities, the standard MFP calculation capturesboth the externality generated by ICT capital and the overall rate of technical change. This can be seenfrom the following expression that shows the effects of calculating the standard MFP residual in thepresence of spillovers:
AKsKsKsLsQP~
MF CKCNKNCKCL +=−−−= θ (5)
Thus, if ICT generates positive externalities, these effects should be picked up by a conventionallymeasured multi-factor productivity residual.
For the purpose at hand, then, the vehicle of analysis will be equations (4) and (5): in a first instance, thecontribution of ICT capital to output growth is evaluated. This entails estimates for the growth rate of ICTcapital and for its income share. In a second instance, contributions from all other inputs are evaluated topermit computation of a multi-factor productivity residual. If the performance of MFP has improved overtime, this could be interpreted as the sign of an additional growth contribution from ICT. Nonetheless, thisremains only a possibility. A rise in MFP growth is neither a necessary nor a sufficient condition to showpositive externalities of ICT capital. Many factors influence MFP growth and can compensate positiveeffects from ICT (in which case the absence of MFP growth would be wrongly interpreted as an absence ofpositive effects from ICT). Alternatively, other factors can raise MFP growth and this would be wronglyinterpreted as a positive effect from ICT capital. In particular, one such factor is the ICT industry itself: ifthe production of ICT is accompanied by large MFP gains, this will feed through to the aggregate MFPmeasure A . While this may be an interesting result from the production perspective of ICT, it should notbe confused with spillovers generated by ICTs in their use as capital goods.
DSTI/DOC(2000)2
9
2.3. The importance of ICT in the capital stock
Oliner and Sichel (1994) and Sichel (1997) noted that computers make up a relatively small share of theentire capital stock – they find a share of about 2% in the US nominal net capital stock during the early1990s. This was the basis for their argument that the overall growth contribution of computers should notbe expected to be large. For more recent years (1996-98), they find a much larger role of computers in thecapital stock and in its growth contribution. However, already in their earlier work, they demonstrated thata definition of ICT that encompasses computers and other information equipment as well as computersoftware and corresponding labour inputs significantly raise ICT’s contribution to output. A first andimportant point is therefore the specification of information and communication technology. For thepresent purpose of evaluating the growth contribution of ICT, the notion should cover computers,peripheral equipment and other information-related office equipment (photocopiers, cash registers,calculators), communications equipment, and instruments. As will presently be seen, such data is onlypartly available at the international level.
An important omission in this coverage of ICT assets is software. The 1993 System of National Accountsrecognises software as an investment good, and some countries have started to implement thisrecommendation in their national accounts. At present, however, it is too early to obtain software-relatedinformation at the international level and, consequently, the current paper limits itself to the hardwarecomponent of ICT. Recent studies concerning the United States by Oliner and Sichel (2000) and Jorgensonand Stiroh (2000) incorporate software as an ICT asset and find that it plays an important role. Forexample, Oliner and Sichel attribute 0.23 of a percentage point per year of US non-farm business outputgrowth over the first half of the 1990s to software – about as much as the contribution of hardware.
Measuring ICT investment
Most of the research on the importance of ICT has been carried out for the United States where nationalincome and product accounts provide detailed and long time series of different types of ICT investment,quality-adjusted price indices and measures of the respective capital stock. Such rich data sets are notalways available for other countries and where they are, differences in national statistics reduceinternational comparability. Empirical analysis at the international level has to refer to a number of sourcesand use simplifying assumptions for purposes of comparison between countries. For current priceexpenditure on ICT goods, the present study draws on a private source (International Data Corporation,1998). While IDC data may not always be identical to official national data (where such data exist), it hasthe advantage of a symmetric treatment of all countries. Two IDC series enter the study at hand:
− IT hardware, comprising servers, personal computers, workstations data communicationequipment (LAN hardware) and peripherals purchased by a corporation, household, school orgovernment agency from an external agent or corporation. From a national accountsperspective, all but the expenditure of private households qualifies as investment and thus aspart of an ICT capital stock. In this sense, the IDC series overestimate IT investment.However, IT expenditure of unincorporated enterprises are excluded – and in this sense ITinvestment is underestimated. For the present purpose, it was assumed that the two effectsroughly cancel out. A comparison for the United States, where both official and IDC seriesare available, shows that this approximation is not unreasonable.
− Telecommunications spending brings together expenditures on public and private networkequipment and telecommunication services. While equipment expenditures qualify asinvestment, telecommunication services do not. Based on a comparison with official sources
DSTI/DOC(2000)2
10
in the United States,2 it was found that a 30% share would constitute a lower bound for theinvestment expenditure part in total telecommunications spending.
An issue of considerable importance is the choice of the appropriate deflator for ICT capital goods.Productive services of ICT capital vary in proportion to the ICT capital stock and one importantdeterminant of its rate of growth or decline is the amount of volume investment in every period. Volumeinvestment is obtained by dividing current-price expenditure by a price index. Two specificities arise forICT capital goods.
The first is that certain ICT capital goods, in particular computers, have undergone significant qualitychange, witnessed by the rapid succession of ever more powerful computer models at stagnant or fallingprices per “computer box”. In constant quality terms (i.e. taking into account the improvement inperformance), computer prices have fallen very rapidly and computer quantities (quality-adjusted) haverisen at rates outstripping those of other capital goods.
The second specificity is that methodologies to measure the price change in ICT capital goods vary greatlyacross OECD countries. Some statistical agencies (e.g. in the United States, Canada, Japan, partly inFrance) apply “hedonic” techniques to capture price change in various types of ICT capital goods, mainlycomputers – others apply more traditional techniques to price ICT goods. Results from the various methodscan be vastly different, rendering direct international comparisons difficult. To carry out meaningfulanalysis of the economic effects of ICT investment, a common methodology for deflation was applied. Inthe present study, a harmonised deflator is used for all countries under investigation. This harmonised priceindex is based on the assumption that the differences between price changes for ICT capital goods and non-ICT capital goods are the same across countries (Box 1). There is no doubt that such a procedureintroduces other biases3 – in particular, it ignores all cross-country differences in real ICT prices thatreflect different structures in the composition of ICT investment as well as all differences that are real inthe sense that relative ICT prices in some countries have fallen more rapidly than in others, due to marketbarriers, effects of government regulation or differential regimes of taxation. To date, the extent of thesebiases cannot be established. However, it was felt that they were smaller than the biases incurred bychoosing national deflators that were manifestly based on very different methodologies. Further support forthis approach comes from the fact that ICT goods are produced and traded on a global scale with fewinternational barriers to trade. This creates a presumption of similar rather than divergent price movementsacross economies.
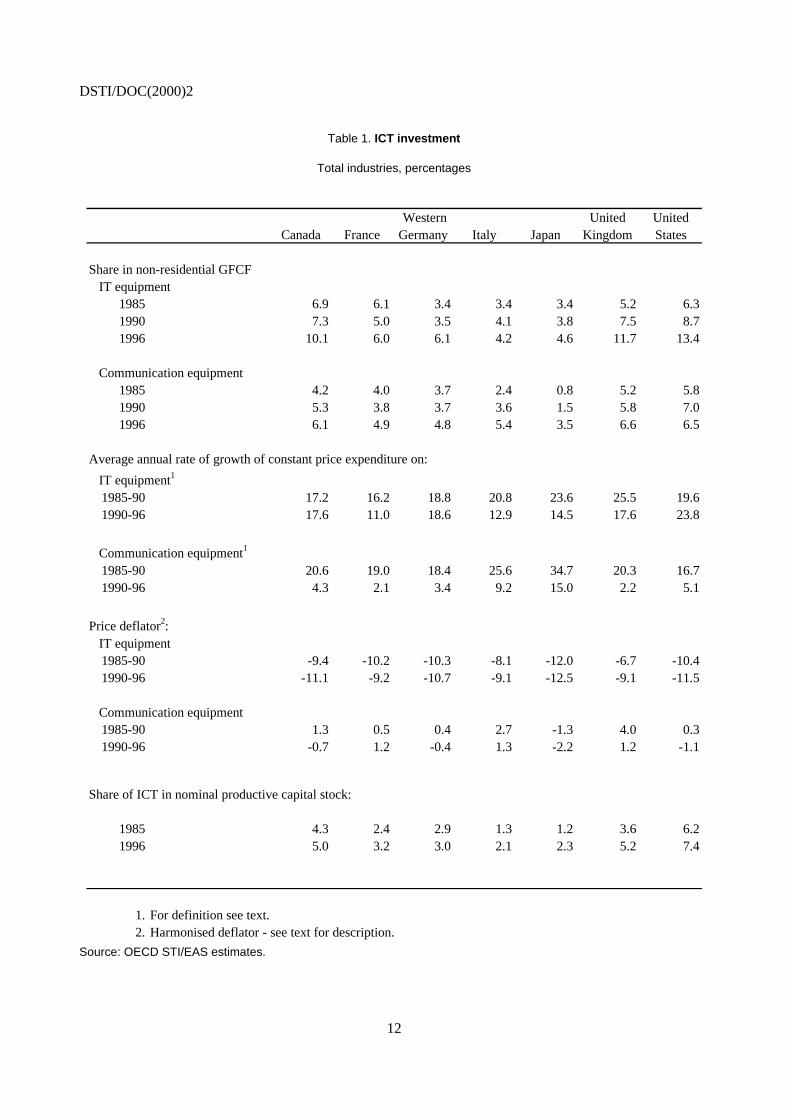
Table 1 is largely based on the above sources. It shows that in all G7 countries, the share of IT capitalgoods in total investment expenditure has steadily increased and now accounts for about 10% of total non-residential gross fixed capital formation or about 20% of total producer durable equipment expenditure.The share of communication equipment has risen less rapidly, but accounts for another 5 to 10% of totalnon-residential investment. All shares are expressed in current prices. At constant prices, volume growthrates of ICT capital investment have progressed at a rate of about 20% and are outstripping all other kindsof assets. IT price indices draw the “dual” picture: they decline at rates of around 10% per year, reflectingrapid quality improvements and technical progress embodied in these capital goods.
ICT capital stock
Capital goods provide productive services, and the quantity of these services is usually taken to beproportional to the capital stock. Capital stocks are not directly observable and time series have to beconstructed by cumulating real investment over time. Weights are then attached to each vintage investmentto reflect the fact that older capital goods provide fewer productive services than new ones. The so-derivedseries is the productive capital stock. It has to be distinguished from the net capital stock, which reflects awealth concept. The distinction can be important in the case of ICT capital goods:
DSTI/DOC(2000)2
11
Box 1. Measurement of prices and quantities
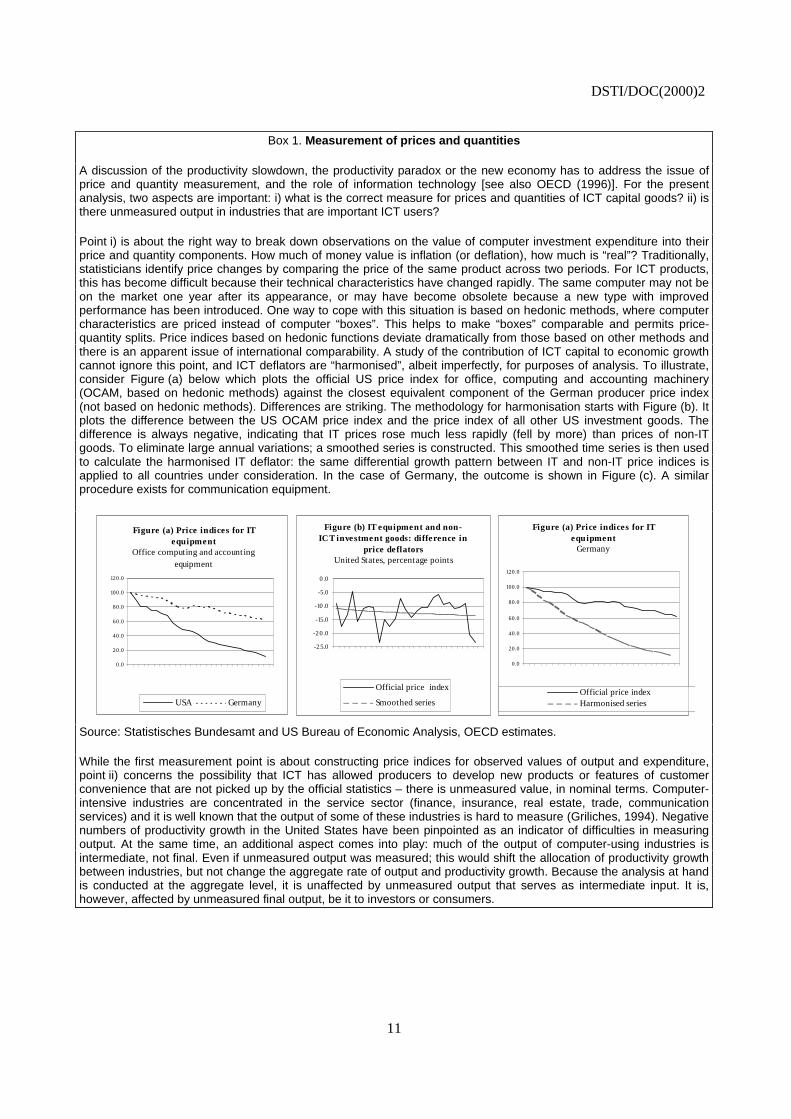
A discussion of the productivity slowdown, the productivity paradox or the new economy has to address the issue ofprice and quantity measurement, and the role of information technology [see also OECD (1996)]. For the presentanalysis, two aspects are important: i) what is the correct measure for prices and quantities of ICT capital goods? ii) isthere unmeasured output in industries that are important ICT users?
Point i) is about the right way to break down observations on the value of computer investment expenditure into theirprice and quantity components. How much of money value is inflation (or deflation), how much is “real”? Traditionally,statisticians identify price changes by comparing the price of the same product across two periods. For ICT products,this has become difficult because their technical characteristics have changed rapidly. The same computer may not beon the market one year after its appearance, or may have become obsolete because a new type with improvedperformance has been introduced. One way to cope with this situation is based on hedonic methods, where computercharacteristics are priced instead of computer “boxes”. This helps to make “boxes” comparable and permits price-quantity splits. Price indices based on hedonic functions deviate dramatically from those based on other methods andthere is an apparent issue of international comparability. A study of the contribution of ICT capital to economic growthcannot ignore this point, and ICT deflators are “harmonised”, albeit imperfectly, for purposes of analysis. To illustrate,consider Figure (a) below which plots the official US price index for office, computing and accounting machinery(OCAM, based on hedonic methods) against the closest equivalent component of the German producer price index(not based on hedonic methods). Differences are striking. The methodology for harmonisation starts with Figure (b). Itplots the difference between the US OCAM price index and the price index of all other US investment goods. Thedifference is always negative, indicating that IT prices rose much less rapidly (fell by more) than prices of non-ITgoods. To eliminate large annual variations; a smoothed series is constructed. This smoothed time series is then usedto calculate the harmonised IT deflator: the same differential growth pattern between IT and non-IT price indices isapplied to all countries under consideration. In the case of Germany, the outcome is shown in Figure (c). A similarprocedure exists for communication equipment.
Figure (a) Price indices for IT equipment
Office computing and account ing equipment
0.0
20.0
40.0
60.0
80.0
100.0
120.0
USA Germany
Figure (b) IT equipment and non-ICT investment goods: difference in
price deflatorsUnited States, percentage points
-25.0
-20 .0
-15.0
-10 .0
-5.0
0 .0
Official price index
Smoothed series
Figure (a) Price indices for IT equipment
Germany
0.0
20.0
40.0
60.0
80.0
100.0
120.0
Official price indexHarmonised series
Source: Statistisches Bundesamt and US Bureau of Economic Analysis, OECD estimates.
While the first measurement point is about constructing price indices for observed values of output and expenditure,point ii) concerns the possibility that ICT has allowed producers to develop new products or features of customerconvenience that are not picked up by the official statistics – there is unmeasured value, in nominal terms. Computer-intensive industries are concentrated in the service sector (finance, insurance, real estate, trade, communicationservices) and it is well known that the output of some of these industries is hard to measure (Griliches, 1994). Negativenumbers of productivity growth in the United States have been pinpointed as an indicator of difficulties in measuringoutput. At the same time, an additional aspect comes into play: much of the output of computer-using industries isintermediate, not final. Even if unmeasured output was measured; this would shift the allocation of productivity growthbetween industries, but not change the aggregate rate of output and productivity growth. Because the analysis at handis conducted at the aggregate level, it is unaffected by unmeasured output that serves as intermediate input. It is,however, affected by unmeasured final output, be it to investors or consumers.
DSTI/DOC(2000)2
12
Table 1. ICT investment
Total industries, percentages
Canada France Western Germany Italy Japan
United Kingdom
United States
Share in non-residential GFCF IT equipment
1985 6.9 6.1 3.4 3.4 3.4 5.2 6.31990 7.3 5.0 3.5 4.1 3.8 7.5 8.71996 10.1 6.0 6.1 4.2 4.6 11.7 13.4
Communication equipment1985 4.2 4.0 3.7 2.4 0.8 5.2 5.81990 5.3 3.8 3.7 3.6 1.5 5.8 7.01996 6.1 4.9 4.8 5.4 3.5 6.6 6.5
Average annual rate of growth of constant price expenditure on:
IT equipment1
1985-90 17.2 16.2 18.8 20.8 23.6 25.5 19.61990-96 17.6 11.0 18.6 12.9 14.5 17.6 23.8
Communication equipment1
1985-90 20.6 19.0 18.4 25.6 34.7 20.3 16.7 1990-96 4.3 2.1 3.4 9.2 15.0 2.2 5.1
Price deflator2: IT equipment
1985-90 -9.4 -10.2 -10.3 -8.1 -12.0 -6.7 -10.41990-96 -11.1 -9.2 -10.7 -9.1 -12.5 -9.1 -11.5
Communication equipment 1985-90 1.3 0.5 0.4 2.7 -1.3 4.0 0.3 1990-96 -0.7 1.2 -0.4 1.3 -2.2 1.2 -1.1
Share of ICT in nominal productive capital stock:
1985 4.3 2.4 2.9 1.3 1.2 3.6 6.21996 5.0 3.2 3.0 2.1 2.3 5.2 7.4
1. For definition see text.2. Harmonised deflator - see text for description.
Source: OECD STI/EAS estimates.
DSTI/DOC(2000)2
13
Computers are often quoted as examples for capital goods whose productive efficiency hardly declinesover their lifetime. Their rate of decay is low as long as they are in use, and this has led researchers(e.g. Jorgenson and Stiroh, 1995) to use a profile where capital services remain fully intact over acomputer’s service life. ICT capital goods, however, show rapid rates of losses in value – their rate ofeconomic depreciation is high and it is this rate that shapes the net (wealth) stock of computers. Thepronounced distinction between decay and depreciation (see also Triplett, 1996) for ICT assets lendsspecific importance to the choice of the capital stock formulation.
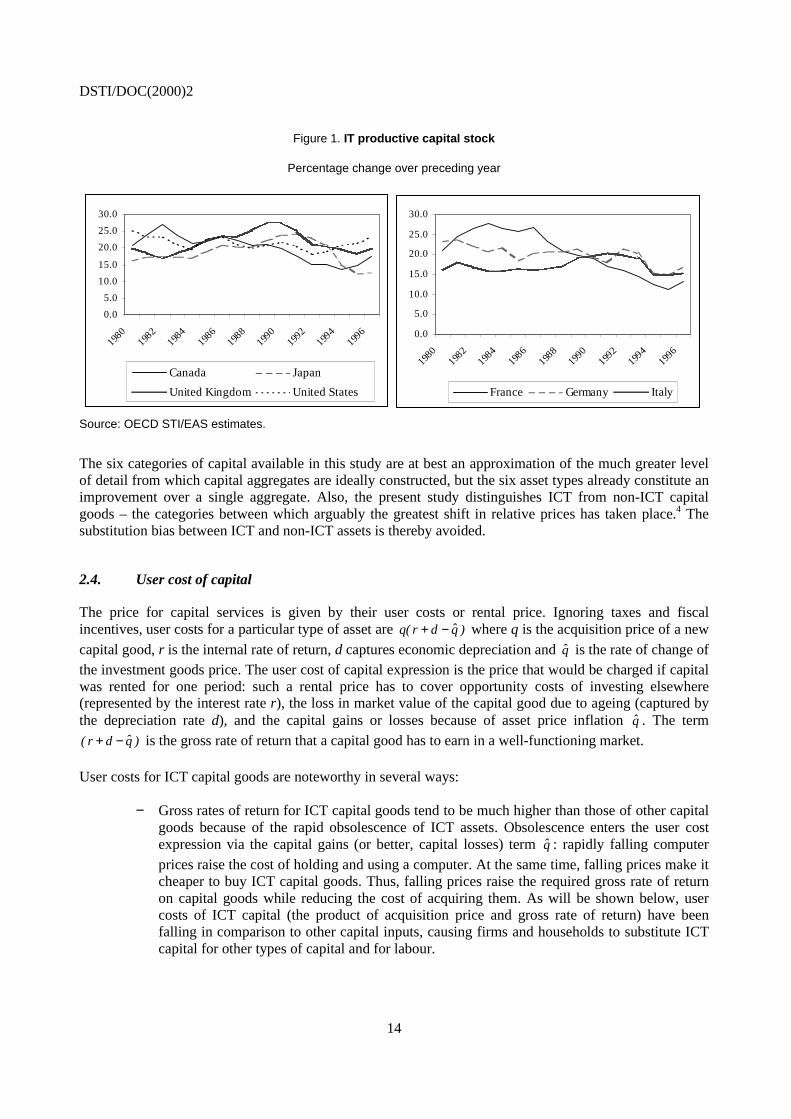
For the present analysis, then, a productive capital stock for computers has been calculated with an age-efficiency pattern that declines slowly in the early years of an ICT capital good’s service life and rapidly atthe end. Parallel to this age-efficiency pattern, a consistent age-price pattern has been derived to measuredepreciation (value losses) at different years. Although measures of depreciation are not needed to producequantity series of capital services, they are needed as an input to the corresponding price component ofcapital services, the user costs of capital as described below. Figure 1 shows the annual growth rate of theproductive ICT capital stock at constant prices and confirms the observed rapid growth in earlier studies ofthe United States. All the G7 countries have been adding to their IT capital stock at two-digit rates over thepast decades. However, only in the United States, Canada and the United Kingdom has the rate of ITcapital-build up accelerated in the second half of the 1990s.
Non-ICT capital stock
The present study distinguishes six types of assets: non-residential structures, other non-residentialconstruction, transport equipment, IT hardware, communication equipment and other non-transportequipment (Table 2). These categories correspond directly to those used in the OECD’s Annual NationalAccounts, with the exception of IT hardware and communication equipment whose sources are describedabove.
In productivity analysis, the total flow of capital services is best measured with a bottom-up approach,starting with the most detailed differentiation: for each type of asset, an asset-specific capital stock shouldbe computed. Total capital services are obtained by aggregating the rates of growth of the stock of eachtype of asset, where user costs of capital should be used as weights. User costs are designed to account fordifferences in service flows of assets of different types. When user cost weights are allowed to changeevery period, the resulting aggregate index takes account of substitution processes between different typesof capital.
Table 2. Types of capital assets
Asset type Source Category
Non-residential structures and equipment OECD ANA*
Structures:
Non-residential structures OECD ANA* Non-ICT
Other construction OECD ANA* Non-ICT
Producer durable equipment
Transport equipment OECD ANA* Non-ICT
Non-transport equipment OECD ANA*
IT hardware IDC ICT
Communication equipment IDC ICT
Other non-transport equipment By deduction Non-ICTNote: * = OECD, Annual National Accounts (1999).
DSTI/DOC(2000)2
14
Figure 1. IT productive capital stock
Percentage change over preceding year
0.0
5.0
10.0
15.0
20.0
25.0
30.0
1980
1982
1984
1986
1988
1990
1992
1994
1996
Canada Japan
United Kingdom United States
0.0
5.0
10.0
15.0
20.0
25.0
30.0
1980
1982
1984
1986
1988
1990
1992
1994
1996
France Germany Italy
Source: OECD STI/EAS estimates.
The six categories of capital available in this study are at best an approximation of the much greater levelof detail from which capital aggregates are ideally constructed, but the six asset types already constitute animprovement over a single aggregate. Also, the present study distinguishes ICT from non-ICT capitalgoods – the categories between which arguably the greatest shift in relative prices has taken place.4 Thesubstitution bias between ICT and non-ICT assets is thereby avoided.
2.4. User cost of capital
The price for capital services is given by their user costs or rental price. Ignoring taxes and fiscalincentives, user costs for a particular type of asset are )qdr(q −+ where q is the acquisition price of a newcapital good, r is the internal rate of return, d captures economic depreciation and q is the rate of change ofthe investment goods price. The user cost of capital expression is the price that would be charged if capitalwas rented for one period: such a rental price has to cover opportunity costs of investing elsewhere(represented by the interest rate r), the loss in market value of the capital good due to ageing (captured bythe depreciation rate d), and the capital gains or losses because of asset price inflation q . The term
)qdr( −+ is the gross rate of return that a capital good has to earn in a well-functioning market.
User costs for ICT capital goods are noteworthy in several ways:
− Gross rates of return for ICT capital goods tend to be much higher than those of other capitalgoods because of the rapid obsolescence of ICT assets. Obsolescence enters the user costexpression via the capital gains (or better, capital losses) term q : rapidly falling computerprices raise the cost of holding and using a computer. At the same time, falling prices make itcheaper to buy ICT capital goods. Thus, falling prices raise the required gross rate of returnon capital goods while reducing the cost of acquiring them. As will be shown below, usercosts of ICT capital (the product of acquisition price and gross rate of return) have beenfalling in comparison to other capital inputs, causing firms and households to substitute ICTcapital for other types of capital and for labour.
DSTI/DOC(2000)2
15
− Depreciation rates – the loss in an asset’s value due to ageing – are not necessarily constantover time, nor is their time profile necessarily identical to an asset’s age-efficiency profile.Depreciation rates are governed by the age-price profile of computer equipment, which tendsto show rapid value losses in early years and slower ones in later years of an asset’s lifetime.This is the age-price pattern used in the present study.
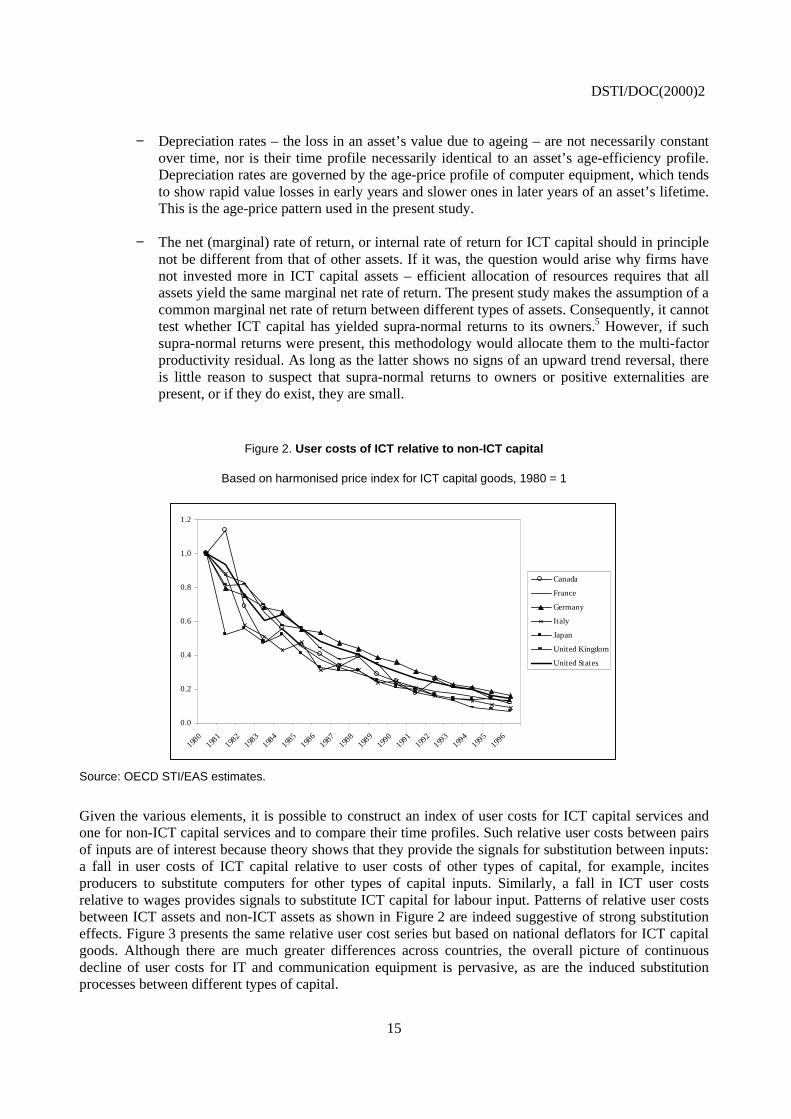
− The net (marginal) rate of return, or internal rate of return for ICT capital should in principlenot be different from that of other assets. If it was, the question would arise why firms havenot invested more in ICT capital assets – efficient allocation of resources requires that allassets yield the same marginal net rate of return. The present study makes the assumption of acommon marginal net rate of return between different types of assets. Consequently, it cannottest whether ICT capital has yielded supra-normal returns to its owners.5 However, if suchsupra-normal returns were present, this methodology would allocate them to the multi-factorproductivity residual. As long as the latter shows no signs of an upward trend reversal, thereis little reason to suspect that supra-normal returns to owners or positive externalities arepresent, or if they do exist, they are small.
Figure 2. User costs of ICT relative to non-ICT capital
Based on harmonised price index for ICT capital goods, 1980 = 1
0.0
0.2
0.4
0.6
0.8
1.0
1.2
1980
1981
1982
1983
1984
1985
1986
1987
1988
1989
1990
1991
1992
1993
1994
1995
1996
Canada
France
Germany
Italy
Japan
United Kingdom
United States
Source: OECD STI/EAS estimates.
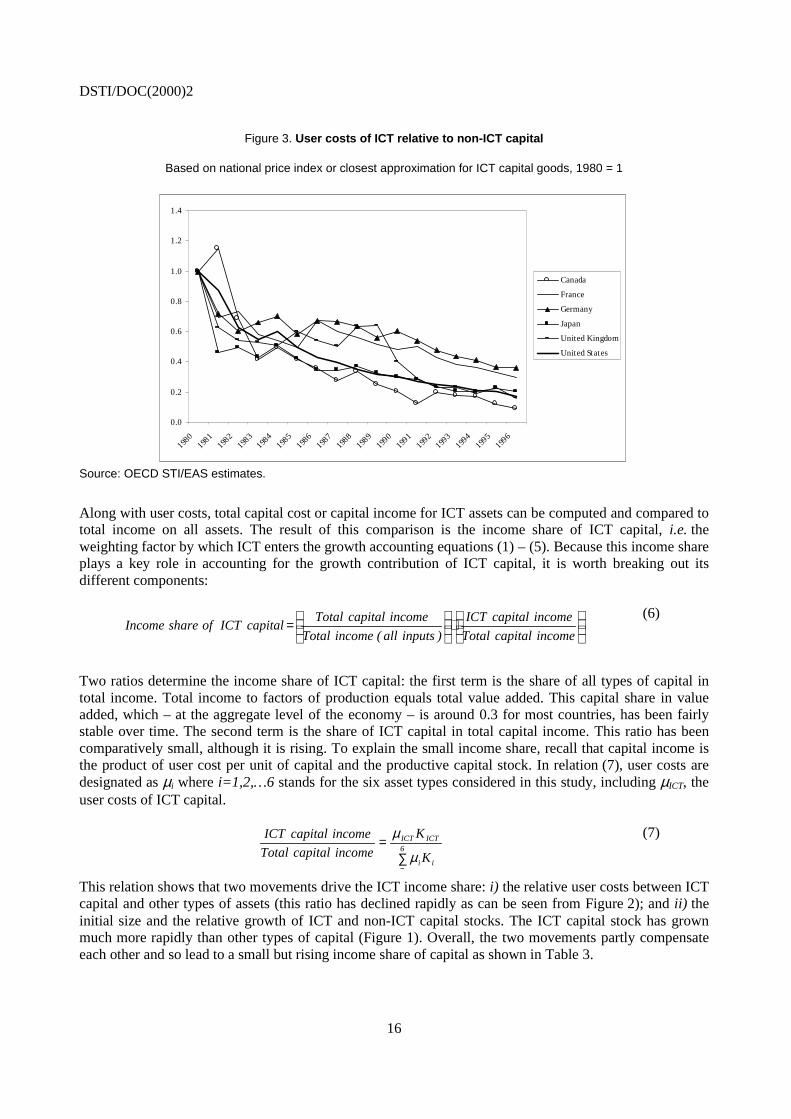
Given the various elements, it is possible to construct an index of user costs for ICT capital services andone for non-ICT capital services and to compare their time profiles. Such relative user costs between pairsof inputs are of interest because theory shows that they provide the signals for substitution between inputs:a fall in user costs of ICT capital relative to user costs of other types of capital, for example, incitesproducers to substitute computers for other types of capital inputs. Similarly, a fall in ICT user costsrelative to wages provides signals to substitute ICT capital for labour input. Patterns of relative user costsbetween ICT assets and non-ICT assets as shown in Figure 2 are indeed suggestive of strong substitutioneffects. Figure 3 presents the same relative user cost series but based on national deflators for ICT capitalgoods. Although there are much greater differences across countries, the overall picture of continuousdecline of user costs for IT and communication equipment is pervasive, as are the induced substitutionprocesses between different types of capital.
DSTI/DOC(2000)2
16
Figure 3. User costs of ICT relative to non-ICT capital
Based on national price index or closest approximation for ICT capital goods, 1980 = 1
0.0
0.2
0.4
0.6
0.8
1.0
1.2
1.4
1980
1981
1982
1983
1984
1985
1986
1987
1988
1989
1990
1991
1992
1993
1994
1995
1996
Canada
France
Germany
Japan
United Kingdom
United States
Source: OECD STI/EAS estimates.
Along with user costs, total capital cost or capital income for ICT assets can be computed and compared tototal income on all assets. The result of this comparison is the income share of ICT capital, i.e. theweighting factor by which ICT enters the growth accounting equations (1) – (5). Because this income shareplays a key role in accounting for the growth contribution of ICT capital, it is worth breaking out itsdifferent components:
⋅
=
incomecapitalTotal
incomecapitalICT
)inputsall(incomeTotal
incomecapitalTotalcapitalICTofshareIncome
(6)
Two ratios determine the income share of ICT capital: the first term is the share of all types of capital intotal income. Total income to factors of production equals total value added. This capital share in valueadded, which – at the aggregate level of the economy – is around 0.3 for most countries, has been fairlystable over time. The second term is the share of ICT capital in total capital income. This ratio has beencomparatively small, although it is rising. To explain the small income share, recall that capital income isthe product of user cost per unit of capital and the productive capital stock. In relation (7), user costs aredesignated as µi where i=1,2,…6 stands for the six asset types considered in this study, including µICT, theuser costs of ICT capital.
∑=
=
6
ii
ICTICT
K
K
incomecapitalTotal
incomecapitalICT
µ
µ (7)
This relation shows that two movements drive the ICT income share: i) the relative user costs between ICTcapital and other types of assets (this ratio has declined rapidly as can be seen from Figure 2); and ii) theinitial size and the relative growth of ICT and non-ICT capital stocks. The ICT capital stock has grownmuch more rapidly than other types of capital (Figure 1). Overall, the two movements partly compensateeach other and so lead to a small but rising income share of capital as shown in Table 3.
DSTI/DOC(2000)2
17
Table 3. ICT income shares
Percentages
Canada France Western Germany Italy Japan
United Kingdom
United States
ICT share in total capital income1980 2.1 1.3 1.0 1.5 2.2 1.4 2.41990 4.5 2.6 1.7 2.1 2.6 3.0 3.81996 4.6 2.4 1.9 2.1 2.8 4.3 4.9
ICT share in total income1980 0.7 0.3 0.3 0.5 0.5 0.4 0.81990 1.4 0.9 0.7 0.8 0.7 1.0 1.31996 1.5 0.9 0.8 0.9 0.8 1.5 1.7
Source: OECD STI/EAS estimates.
3. Results: the growth contribution of ICT
3.1. ICT as a capital input
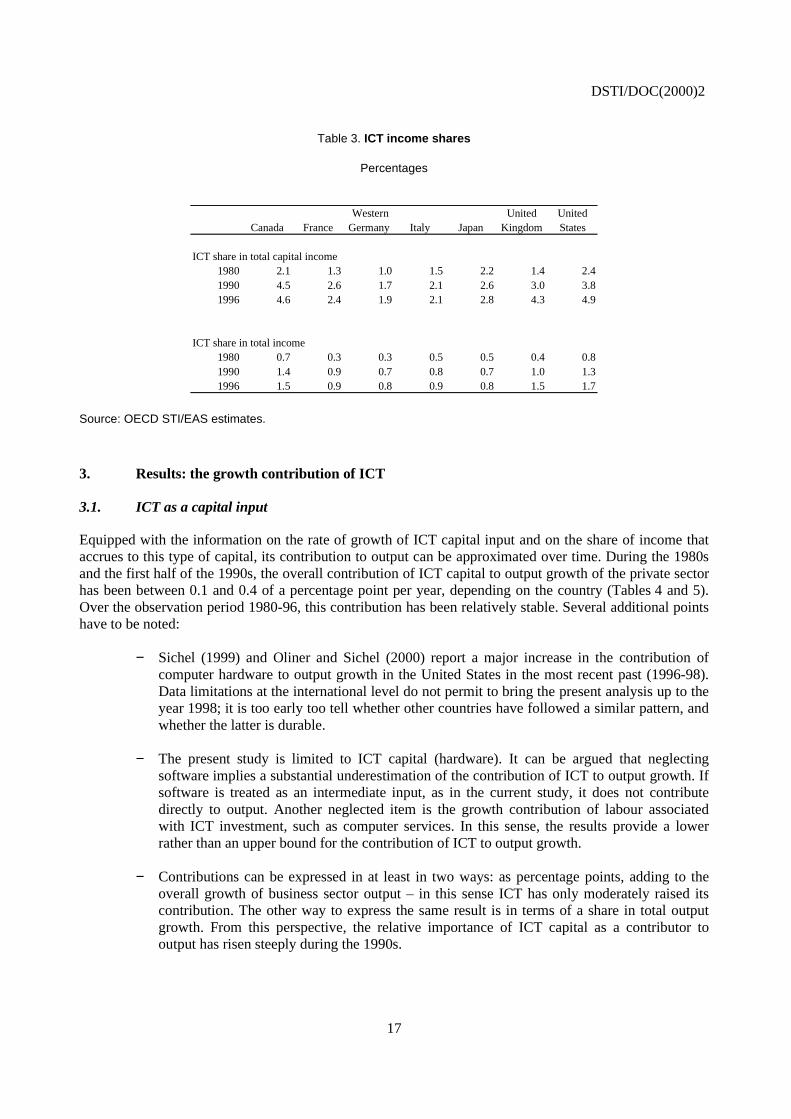
Equipped with the information on the rate of growth of ICT capital input and on the share of income thataccrues to this type of capital, its contribution to output can be approximated over time. During the 1980sand the first half of the 1990s, the overall contribution of ICT capital to output growth of the private sectorhas been between 0.1 and 0.4 of a percentage point per year, depending on the country (Tables 4 and 5).Over the observation period 1980-96, this contribution has been relatively stable. Several additional pointshave to be noted:
− Sichel (1999) and Oliner and Sichel (2000) report a major increase in the contribution ofcomputer hardware to output growth in the United States in the most recent past (1996-98).Data limitations at the international level do not permit to bring the present analysis up to theyear 1998; it is too early too tell whether other countries have followed a similar pattern, andwhether the latter is durable.
− The present study is limited to ICT capital (hardware). It can be argued that neglectingsoftware implies a substantial underestimation of the contribution of ICT to output growth. Ifsoftware is treated as an intermediate input, as in the current study, it does not contributedirectly to output. Another neglected item is the growth contribution of labour associatedwith ICT investment, such as computer services. In this sense, the results provide a lowerrather than an upper bound for the contribution of ICT to output growth.
− Contributions can be expressed in at least in two ways: as percentage points, adding to theoverall growth of business sector output – in this sense ICT has only moderately raised itscontribution. The other way to express the same result is in terms of a share in total outputgrowth. From this perspective, the relative importance of ICT capital as a contributor tooutput has risen steeply during the 1990s.
DSTI/DOC(2000)2
18
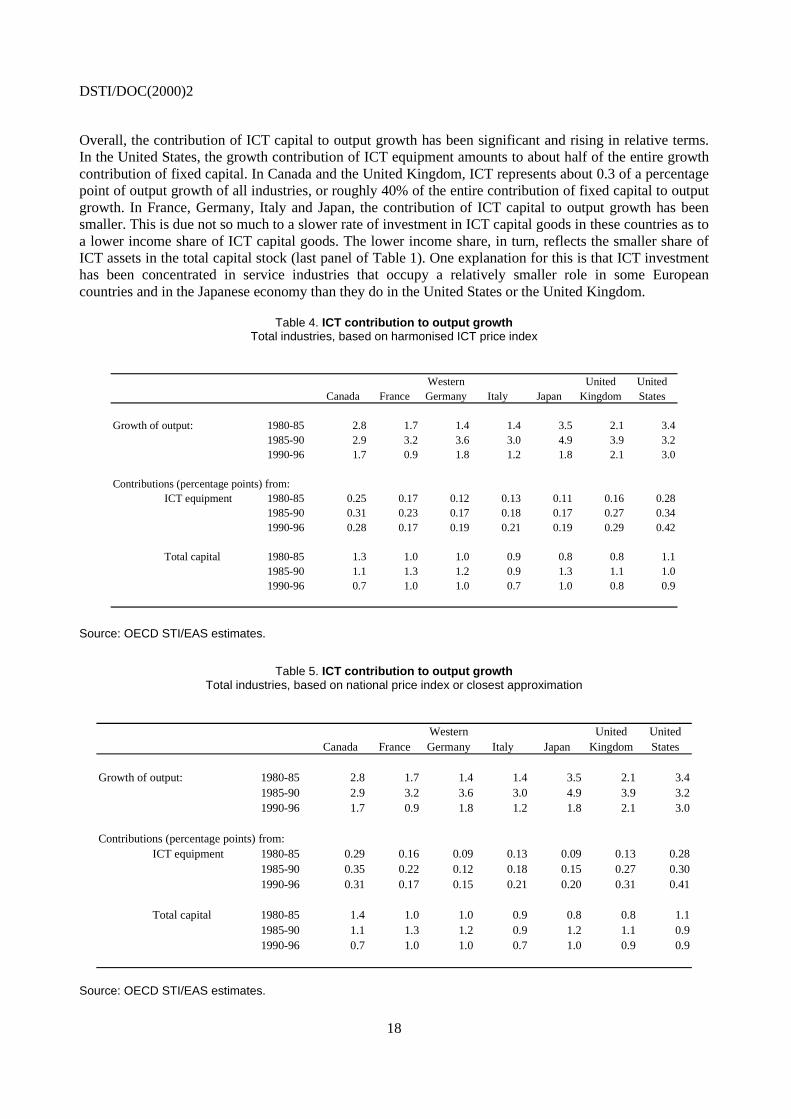
Overall, the contribution of ICT capital to output growth has been significant and rising in relative terms.In the United States, the growth contribution of ICT equipment amounts to about half of the entire growthcontribution of fixed capital. In Canada and the United Kingdom, ICT represents about 0.3 of a percentagepoint of output growth of all industries, or roughly 40% of the entire contribution of fixed capital to outputgrowth. In France, Germany, Italy and Japan, the contribution of ICT capital to output growth has beensmaller. This is due not so much to a slower rate of investment in ICT capital goods in these countries as toa lower income share of ICT capital goods. The lower income share, in turn, reflects the smaller share ofICT assets in the total capital stock (last panel of Table 1). One explanation for this is that ICT investmenthas been concentrated in service industries that occupy a relatively smaller role in some Europeancountries and in the Japanese economy than they do in the United States or the United Kingdom.
Table 4. ICT contribution to output growthTotal industries, based on harmonised ICT price index
Canada FranceWestern Germany Italy Japan
United Kingdom
United States
Growth of output: 1980-85 2.8 1.7 1.4 1.4 3.5 2.1 3.41985-90 2.9 3.2 3.6 3.0 4.9 3.9 3.21990-96 1.7 0.9 1.8 1.2 1.8 2.1 3.0
Contributions (percentage points) from:ICT equipment 1980-85 0.25 0.17 0.12 0.13 0.11 0.16 0.28
1985-90 0.31 0.23 0.17 0.18 0.17 0.27 0.341990-96 0.28 0.17 0.19 0.21 0.19 0.29 0.42
Total capital 1980-85 1.3 1.0 1.0 0.9 0.8 0.8 1.11985-90 1.1 1.3 1.2 0.9 1.3 1.1 1.01990-96 0.7 1.0 1.0 0.7 1.0 0.8 0.9
Source: OECD STI/EAS estimates.
Table 5. ICT contribution to output growthTotal industries, based on national price index or closest approximation
Canada FranceWestern Germany Italy Japan
United Kingdom
United States
Growth of output: 1980-85 2.8 1.7 1.4 1.4 3.5 2.1 3.41985-90 2.9 3.2 3.6 3.0 4.9 3.9 3.21990-96 1.7 0.9 1.8 1.2 1.8 2.1 3.0
Contributions (percentage points) from:ICT equipment 1980-85 0.29 0.16 0.09 0.13 0.09 0.13 0.28
1985-90 0.35 0.22 0.12 0.18 0.15 0.27 0.301990-96 0.31 0.17 0.15 0.21 0.20 0.31 0.41
Total capital 1980-85 1.4 1.0 1.0 0.9 0.8 0.8 1.11985-90 1.1 1.3 1.2 0.9 1.2 1.1 0.91990-96 0.7 1.0 1.0 0.7 1.0 0.9 0.9
Source: OECD STI/EAS estimates.
DSTI/DOC(2000)2
19
3.2. ICT as a special type of capital good
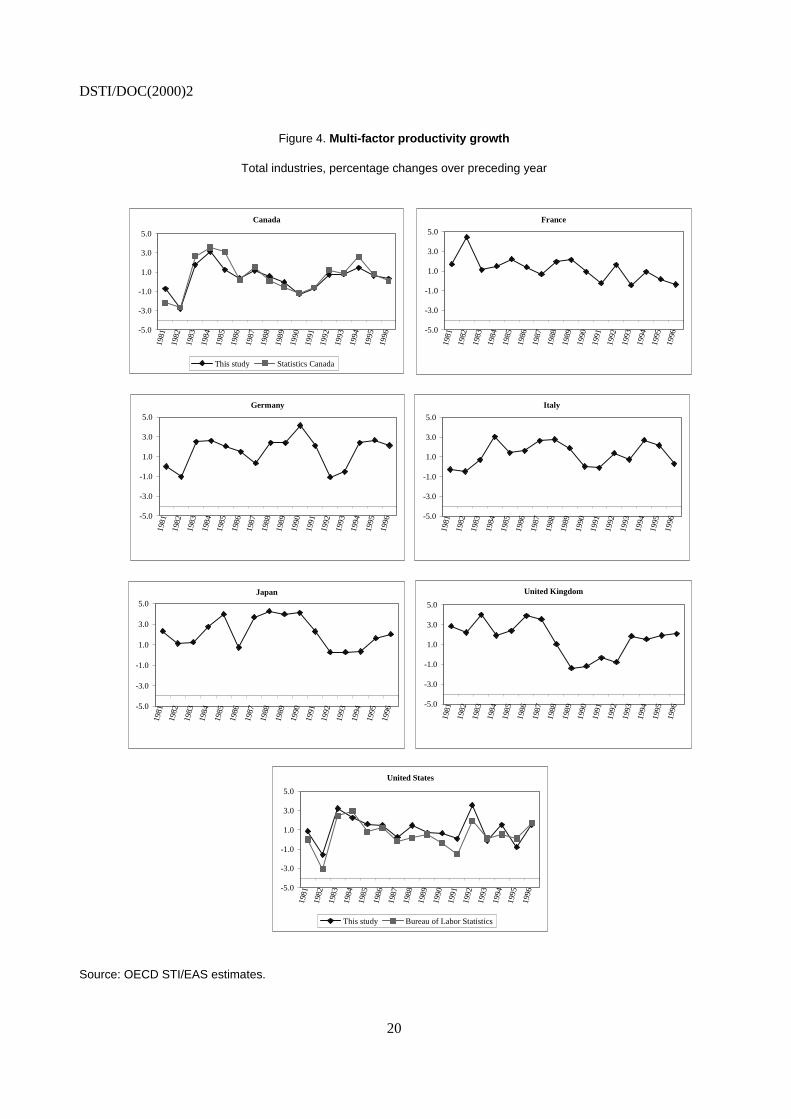
Finally, it is instructive to examine trends in multi-factor productivity: it was pointed out earlier that if ICTcapital goods generate positive spillovers or network effects in the economy, these effects should show upas MFP growth. Unfortunately, MFP is a residual measure combining a myriad of factors and it is difficultto disentangle them. Nonetheless, if MFP growth is persistently slow, this creates a strong presumptionagainst the presence of large spill-over effects caused by ICT. Conversely, an upward reversal in trendMFP growth would at least be consistent with the hypothesis of significant positive externalities generatedby the use of IT and communication technology.
As shown in equation (3), rates of changes in MFP are obtained residually by deducting the growthcontributions of capital and labour from the rate of output growth.6 Figure 4 presents the results. Overall,and for the group of G7 countries, there is no convincing sign of a broad-based acceleration in MFPgrowth. In the first half of the 1990s, MFP productivity growth increased quite significantly in Japan,although this movement would appear to be a cyclical recovery back to trend growth rather than a reversalof trend productivity growth itself. However, recent developments in the United States – although notdirectly covered by the present study – merit specific attention.
MFP growth in the United States since 1996
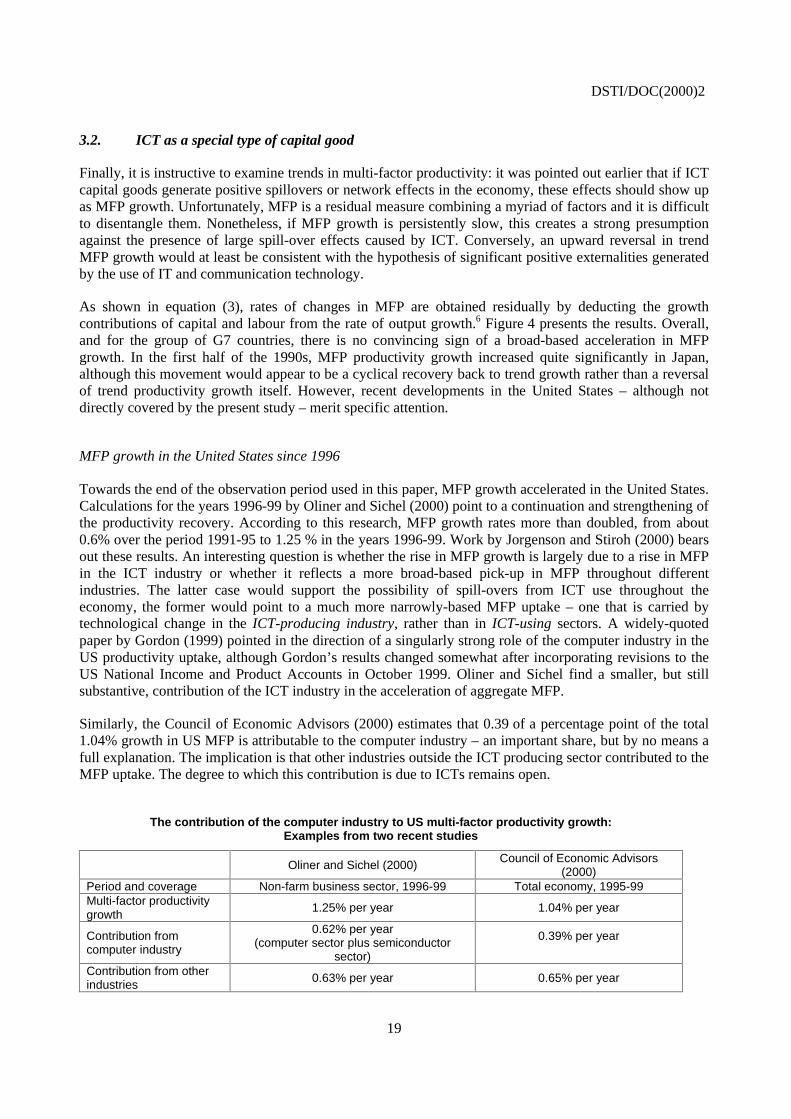
Towards the end of the observation period used in this paper, MFP growth accelerated in the United States.Calculations for the years 1996-99 by Oliner and Sichel (2000) point to a continuation and strengthening ofthe productivity recovery. According to this research, MFP growth rates more than doubled, from about0.6% over the period 1991-95 to 1.25 % in the years 1996-99. Work by Jorgenson and Stiroh (2000) bearsout these results. An interesting question is whether the rise in MFP growth is largely due to a rise in MFPin the ICT industry or whether it reflects a more broad-based pick-up in MFP throughout differentindustries. The latter case would support the possibility of spill-overs from ICT use throughout theeconomy, the former would point to a much more narrowly-based MFP uptake – one that is carried bytechnological change in the ICT-producing industry, rather than in ICT-using sectors. A widely-quotedpaper by Gordon (1999) pointed in the direction of a singularly strong role of the computer industry in theUS productivity uptake, although Gordon’s results changed somewhat after incorporating revisions to theUS National Income and Product Accounts in October 1999. Oliner and Sichel find a smaller, but stillsubstantive, contribution of the ICT industry in the acceleration of aggregate MFP.
Similarly, the Council of Economic Advisors (2000) estimates that 0.39 of a percentage point of the total1.04% growth in US MFP is attributable to the computer industry – an important share, but by no means afull explanation. The implication is that other industries outside the ICT producing sector contributed to theMFP uptake. The degree to which this contribution is due to ICTs remains open.
The contribution of the computer industry to US multi-factor productivity growth:Examples from two recent studies
Oliner and Sichel (2000) Council of Economic Advisors(2000)
Period and coverage Non-farm business sector, 1996-99 Total economy, 1995-99Multi-factor productivitygrowth
1.25% per year 1.04% per year
Contribution fromcomputer industry
0.62% per year(computer sector plus semiconductor
sector)
0.39% per year
Contribution from otherindustries 0.63% per year 0.65% per year
DSTI/DOC(2000)2
20
Figure 4. Multi-factor productivity growth
Total industries, percentage changes over preceding year
Canada
-5.0
-3.0
-1.0
1.0
3.0
5.0
1981
1982
1983
1984
1985
1986
1987
1988
1989
1990
1991
1992
1993
1994
1995
1996
This study Statistics Canada
France
-5.0
-3.0
-1.0
1.0
3.0
5.0
1981
1982
1983
1984
1985
1986
1987
1988
1989
1990
1991
1992
1993
1994
1995
1996
Germany
-5.0
-3.0
-1.0
1.0
3.0
5.0
1981
1982
1983
1984
1985
1986
1987
1988
1989
1990
1991
1992
1993
1994
1995
1996
Italy
-5.0
-3.0
-1.0
1.0
3.0
5.0
1981
1982
1983
1984
1985
1986
1987
1988
1989
1990
1991
1992
1993
1994
1995
1996
Japan
-5.0
-3.0
-1.0
1.0
3.0
5.0
1981
1982
1983
1984
1985
1986
1987
1988
1989
1990
1991
1992
1993
1994
1995
1996
United Kingdom
-5.0
-3.0
-1.0
1.0
3.0
5.0
1981
1982
1983
1984
1985
1986
1987
1988
1989
1990
1991
1992
1993
1994
1995
1996
United States
-5.0
-3.0
-1.0
1.0
3.0
5.0
1981
1982
1983
1984
1985
1986
1987
1988
1989
1990
1991
1992
1993
1994
1995
1996
This study Bureau of Labor Statistics
Source: OECD STI/EAS estimates.
DSTI/DOC(2000)2
21
REFERENCES
Barro, Robert J. (1998), “Notes on Growth Accounting”, NBER Working Paper 6654.
Brynjolfsson, Erik and Lorin Hitt (1994), “Computers and Economic Growth: Firm-level Evidence”, MITSloan School of Management Working Paper No. 3714.
Council of Economic Advisors (2000), Economic Report of the President, United States GovernmentPrinting Office, http://w3.access.gpo.gov/eop/.
Denison, Edward F. (1974), Accounting for United States Economic Growth 1929-1969, The BrookingsInstitution, Washington.
Gordon, Robert J. (1999), “Has the ‘New Economy’ Rendered the Productivity Slowdown Obsolete?”,http://www.econ.nwu.edu/faculty-frame.html.
Griliches, Zvi (1994), “Productivity, R&D and the Data Constraint”, American Economic Review, Vol. 84.
International Data Corporation (IDC) (1998), Digital Planet – The Global Information Economy.
Jorgenson, Dale W. and Zvi Griliches (1967), “The Explanation of Productivity Change”, Review ofEconomic Studies 34.
Jorgenson, Dale W. and Kevin J. Stiroh (1995), “Computers and Growth”, Economics of Innovation andNew Technology.
Jorgenson, Dale W. and Kevin J. Stiroh (1999), “Information Technology and Growth”, AEA Papers andProceedings.
Jorgenson, Dale W. and Kevin J. Stiroh (2000), “Raising the Speed Limit: US Economic Growth in theInformation Age”, mimeo.
Lucas, Robert E., Jr. (1988), “On the Mechanics of Development Planning”, Journal of MonetaryEconomics, 22.
OECD (1996), Industry Productivity: International Comparison and Measurement Issues, OECD, Paris,http://www.oecd.org/dsti/sti/stat-ana/prod/measurement.htm.
OECD (1999), Annual National Accounts, OECD, Paris.
OECD (2000), Information Technology Outlook 2000, OECD, Paris, .
Oliner, Stephen D. and Daniel E. Sichel (1994), “Computers and Output Growth Revisited: How Big is thePuzzle?”, Brookings Papers on Economic Activity 2.
DSTI/DOC(2000)2
22
Oliner, Stephen D. and Daniel E. Sichel (2000), “The Resurgence of Growth in the late 1990s: IsInformation Technology the Story?”, mimeo, Federal Reserve Board, February.
Romer, Paul M. (1986), “Increasing Returns and Long-run Growth”, Journal of Political Economy 94(5).
Sichel, Daniel E. (1997), The Computer Revolution: An Economic Perspective, Brookings Institution Press.
Sichel, Daniel E. (1999), “Computers and Aggregate Economic Growth: An Update”, Business Economics,April.
Solow, Robert M. (1957), “Technical Change and the Aggregate Production Function”, Review ofEconomics and Statistics 39.
Statistisches Bundesamt (1999), “Bueromaschinen, DV-geraete und -einrichtungen: Index derErzeugerpreise gewerblicher Produkte”, Statistisches Informationssystem des Bundes.
Triplett, Jack E. (1996), “Depreciation in Production Analysis and in Income and Wealth Accounts:Resolution of an Old Debate”, Economic Enquiry, Vol. 34.
Triplett, Jack E. (1999), “Economic Statistics, the New Economy and the Productivity Slowdown”,Business Economics, April.
US Bureau of Economic Analysis (1998), Fixed Reproducible Tangible Wealth in the United States 1925-97, http://www.bea.doc.gov/bea/dn2.htm.
US Bureau of Labor Statistics (1998), “Revisions to Capital Inputs for the BLS Multifactor ProductivityMeasures”, http://stats.bls.gov:80/mprcaptl.htm.
DSTI/DOC(2000)2
23
NOTES
1. Jorgenson and Griliches (1967) and Denison (1974), using Solow’s (1957) approach to modellingeconomic growth, have pioneered growth accounting. A large body of literature has developed since.
2. For 1996, the US national income and product accounts give a value of USD 99 096 million for officecomputing and accounting machinery equipment plus photocopy and related equipment of the privatesector – this is roughly in line with the IT hardware expenditure figure derived from the IDC source(USD 105 606 million). The official private business sector expenditure on communications equipmentwas USD 64 025 million; that derived from IDC sources, USD 51 622 million. Similar relations hold forother years of comparison between 1992 and 1996.
3. When national price indices for ICT capital goods are changed to improve international comparability, thisshould in principle also translate into modified measures of output growth. Because the present studymakes no effort to adjust volume growth rates of production, there is a potential bias. Note, however, thatthe size of this bias depends on the relative importance of the ICT-producing industry, and on the extent towhich its output is used in investment or in final consumption. The adjustment of price indices for ICTproducts that are used as intermediate goods affects the distribution of output and productivity growthacross industries, but does not affect aggregate output.
4. A recent revision of capital input measures by the US Bureau of Labor Statistics (1998) puts a questionmark to this statement. As BLS showed, there is a surprising amount of substitution within the relativelynarrow category of office, computing and accounting machinery – roughly the same aggregate as the IThardware component in the present study.
5. A test requires econometric analysis, for examples of such work see Brynjolfsson and Hitt (1994).
6. It should be noted that the calculation of labour input and its growth contribution raises additionalstatistical issues. At least two should be mentioned here: first, labour input should be measured in totalhours, not as total persons employed. Only the former measure accounts for shifts in average hours perperson, caused, for example by a changing share of part-time employees. A second issue is the quality oflabour input. It has been shown that the composition of the labour force in most OECD countries hasundergone structural shifts, typically towards higher-skilled labour and away from low-skilled workers.Labour input has thus changed, but an input measure that aggregates total hours or total persons withoutdifferentiation will not reflect such changes. For the present study, neither adjustment could be made andlabour was measured as the number of persons engaged. Consequently, MFP growth rates are somewhatdifferent from those obtained in national statistics where allowance is sometimes made for average hoursand labour composition. Differences may also arise due to the relatively aggregate treatment of capitalinput and due to common assumptions about asset service lives which may differ from national sources butwhich ensure consistent treatment across countries. For purposes of comparison, then, for the United Statesand Canada, time profiles of MFP growth as obtained by national statistical offices are shown next to thoseevaluated in the present study. It is easy to see that in spite of some differences in the level of MFP growth,movements over time are closely correlated and for the purpose of identifying an acceleration ordeceleration of MFP growth this is sufficient.


